- 1Cores and Samples Center of Natural Resources, China Geological Survey, Beijing, China
- 2lnstitute of Gealogy and Geophysics, Chinese Academy of Sciences, Beijing, China
Mineral forecasting is of great significance for social development. As an important aspect of geological exploration, its importance lies not only in its direct contribution to economic growth but also in how it employs precise technical methods for mineral exploration. This study utilizes a geological factor analysis method that combines various complex geological observation factors into a few dominant comprehensive factors, followed by causal research and multivariate statistical analysis for classification. Based on this, the study applies principles and methods of elemental geochemistry to identify the dispersion and concentration patterns of associated elements from the distribution characteristics of ordered accompanying factors, providing a scientific basis for mineralization forecasting. Using geochemical experimental data, geological survey comprehensive profiles, and factor score contour maps, this paper analyzes the southern extension segment of the Jiaojia gold mine mineralization belt through geological factor analysis. It was found that the anomalous distribution of chemical elements F4 (Hg, Au, Pb) exhibits certain regularities, which significantly indicate mineralization information and suggest the presence of two main longitudinal mineralization belts.
1 Introduction
Mineral resources refer to natural resources in solid, liquid, and gas forms that have economic value and are formed through geological processes. The Jiaodong gold mining concentrated area is an important gold production base in China, with dense distributions of gold deposits and significant resource potential. The area’s tectonic-magmatic activity exhibits multi-stage characteristics, providing suitable geological conditions for the activation, migration, and deposition of mineralizing materials. There are numerous gold mines in the region, with gold reserves accounting for one-quarter of the nationally identified reserves, making it the largest known gold-rich area in China. As mining depth increases and shallow resources are gradually depleted, finding alternative resources targeting deep areas of mineral-rich zones or medium to large deposits has become a key challenge for national geological and mineral departments as well as mining enterprises.
The Jiaojia mineralization belt is an important part of the Longlai arc fault zone, consisting of the Jiaojia main fault, the Hexi branch fault, and the Wang’er Mountain branch fault. The Jiaojia main fault controls two super-large gold deposits at Jiaojia and Xincheng, as well as three medium-sized deposits: Matang, Sizhuang, and Dongji. The Wang’er Mountain branch fault governs three medium-sized gold deposits: Wang’er Mountain, Hedong, and Shangzhuang. The Hexi branch fault controls the Hexi super-large gold deposit. Despite differences in scale and development, the fault zones that control gold deposits share a common characteristic of being broad, shattered zones composed of tectonic rocks. The main fracture surfaces within the fault zones consist of fault gouge, with symmetrically developed granitic breccia, brecciated rock, and granodiorite on both sides, showing greater development on the lower side. A metamorphosed hydrothermal zone forms through alteration and mineralization in the mining area. Factors such as alteration degree, ore body characteristics, mineralization intensity, and structural features are strictly constrained by the spatial morphology and scale characteristics of the tectonic rocks in the mineralized area. As exploration difficulties increase and data from geology, geophysics, geochemistry, and remote sensing multiply, effectively extracting key, reliable, practical, and targeted information has become a major goal across disciplines like geology, mathematics, geochemistry, geophysics, and remote sensing, reflecting the current trends and hot topics in geological and geochemical exploration.
Factor analysis, as an effective dimensionality reduction technique, is particularly useful in the era of big data, allowing for the extraction of meaningful composite information from numerous variables. In 1986, Davis pointed out that once the analytical factors are assigned objective and reasonable geological and mineralization interpretations, each factor score for the collected samples serves as a trace of geological and mineralization information for those samples. The magnitude of the scores reflects the degree of membership of the sample attributes; the higher the score, the more representative it is of the sample’s information.
Shi Yanxiang and others applied R-type factor analysis to the geochemical data of Dubao Mountain at a scale of 1:50,000, identifying the geochemical information represented by each factor and creating a geochemical zoning map. This clarified the specific geological-geochemical significance and interconnections of various sub-regions. Shi Lei and colleagues processed geochemical data from stream sediment in a certain area at a scale of 1:200,000 using a factor quantitative model, finding that the extracted factors closely matched the spatial distribution of geological bodies and structures within the survey area. This better reflected the correlation between regional geological structures and anomalies, with the resulting anomalies aligning well with local deposits, suggesting promising exploration targets in other areas. Zhang Hai conducted factor analysis on 39 elemental geochemical data from stream sediments in the Liwu working area of Sichuan as part of a national resource potential evaluation project. He identified nine factors, extracting a few that reflected geological structures and dominant mineralization processes, and created contour maps of the factor scores. These maps intuitively represented the migration and evolution processes of mineralizing fluids, providing comprehensive guidance for new rounds of exploration predictions and geological mapping. Wu Yue and colleagues utilized trend surface analysis to extract residual anomaly components from geochemical data of 12 elements in the western segment of the Feng-Tai mining area in the Western Qinling Mountains, followed by R-type factor analysis of these residual components to identify three factors closely related to mineralization. They described the distribution of geochemical anomalies related to mineralization in the study area using factor score maps, offering solid foundations for selecting exploration targets. Zhao Shaoqing and others analyzed geochemical measurement data from rock fragments in the Shiban Well area of western Inner Mongolia using R-type factor analysis, extracting six representative factors and creating geochemical zoning maps along with factor score contour maps. They discussed the correspondence between each zone and its geological background. Based on the zoning results, and considering the mineralization background of the Beishan area, geological features of the working area, and malachite mineralization points discovered during field investigations, they identified the Cu-Zn zone as a favorable mineralization area.
Although most scholars currently attempt to perform factor analysis on geological foundational data and continually clarify the geological significance represented by each factor, there is limited research on the extraction of structural information using factor analysis. Many researchers simply classify and summarize samples based on the magnitude of R-type factor scores without considering the differences in membership degrees among samples within the same factor group. Furthermore, there has been little analysis of the coupling relationship between geochemical field structures and tectonics. The southern extension of the Jiaojia fault zone has long been a focus for many geological researchers. The extensive Quaternary cover and large scale of the fault zone complicate engineering arrangements (Shi et al., 2022). This paper aims to provide strong evidence for the extension and direction of the fault zone through geological information obtained from fieldwork, combined with geochemical data processing and mapping, using factor analysis methods to support the southern extension of the Jiaojia fault. We have conducted a detailed study on the issue and proposed directions for mineral exploration.
2 Geological characteristics of Jiaojia south extension section
The research area is located in the south of Zhuqiao Town, Laizhou City, Shandong Province, adjacent to Sizhuang Gold Mine in the north, covering the Xucunyuan Gold Mine Exploration Area, to Yidao Town in the south, and Pinglitian Town in the west. It generally belongs to the southern extension of the famous Jiaojia Fault Zone. The study area is shown in Figure 1 below.
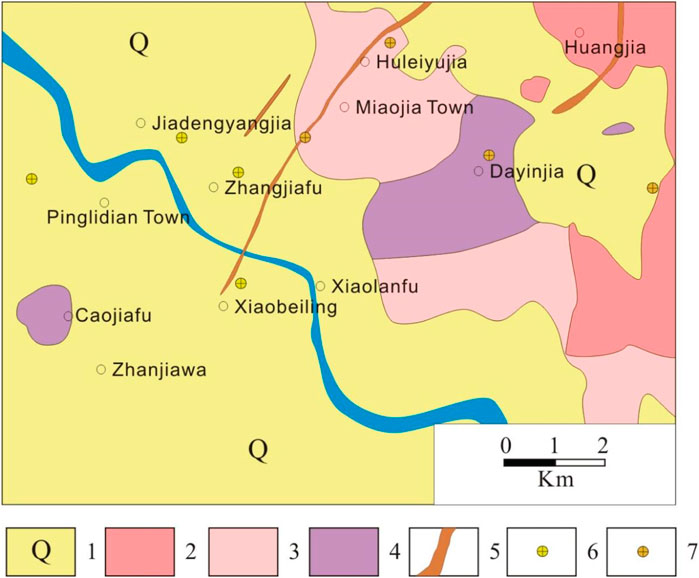
Figure 1. Geologic map of the study area. 1—Quaternary; 2—monzogranite; 3—Neoarchean amphibolite-biotite bearing tonalite; 4—Jiaodong Gr.; 5—alteration zone; 6—extra large and large gold deposits; 7—medium-small gold deposit.
The strata in the area are widely distributed as Cenozoic Quaternary strata, all of which are loose quaternary deposits and distributed in the form of cap layer. It is comprised of residual slope deposits and alluvial deposits composed of gray-brown loam, sandy loam and gravelly sand. The stratum thickness is 0.5–20 m, generally 3–8 m, and the thickest can reach more than 40 m. Archaean medium-fine-grained hornblende-biotite bearing tonalitic gneiss is sporadically exposed.
The Jiaojia Fault Zone is marked by the development of brittle fracture structures. According to the trend, it is divided into 2 groups: NNE-NE trending faults and NW trending faults. The former mainly controls the main structure of the ore body and a few late-stage mineralization structures, while the latter is distributed in the Linglong supertonic in the footwall of the Jiaojia fault zone is small in scale and not well developed. Most of it is occupied by late-stage dikes, and a few of the mineralized alteration zones formed also belong to post-metallogenic structures (Chen, 2017).
The Jiaojia Trunk Fault is part of the Longlai Fault in the region. It proceeds from Huangshanguan, Longkou City in the north, and ends at the south of Xucunyuan Village, Zhuqiao Town, Laizhou City. It is approximately 60 km long and extends from Sizhuang Village to Zhaoyuan along the NNE-NE direction. Gaojiazhuangzi, then pass Xinzhuang and turn NNE to Shuipan. The Xinzhuang-Shuipan section fault runs at about 75°, and enters Longkou City from Shuipan in the 25° direction. The south of Si Zhuang extends to the south of Xucun Yuan Village in a direction of 170°. The shape is very irregular, with an “S” shape on the plane, and obvious characteristics of branching, compounding, expansion and contraction. This fault is developed within the Guojialing supertonic or the Linglong supertonic or in the contact zone between the two. Where the fault structure is improved, thick gray-black fault gouge and fractured altered rock zones of varying sizes are often formed (Cao et al., 2012).
The Lingshangou-Beijie Fault is located on the east side of the Jiaojia Main Fault, with a trend of 50°–60° within the study area, a SE tendency, and a dip angle of 65°–70° (Xie and Sun, 2008).
The southern section of the Jiaojia Fault Zone, starting from Zhuqiao Town in the north, is strongly covered by the Quaternary System after passing through the Xucunyuan Gold Mine, which brings great difficulties to the study of fault trend inference. After many explorations, it was revealed that the fault zone in the Xucunyuan section of the Jiaojia Fault does exist. However, there has been little research on the south area of Ziluojijia. The direction of the fault zone has simply been roughly inferred through geophysical and geochemical exploration. This article will then comprehensively integrate existing data and field geological survey results to derive the direction of the fault zone in the study area.
The Quaternary coverage in the study area is severe, and the magmatic rocks are mainly dominated by the surrounding Neoarchean Qixia super-unit and the Mesozoic and Late Jurassic Linglong super-unit. The derived dikes in the area are not very developed.
2.1 Qixia super-unit
It is distributed in the northern and eastern areas of the area in the form of basement, and is in fault contact with the Linglong super-unit. The lithology is Xinzhuang Formation gneissic medium-fine-grained hornblende-biotite -containing tonalite (Ma, 2019).
The Qixia and Malianzhuang super-unit are a set of intermediate-basic metamorphic plutonic intrusive rock series, which are rock masses that have suffered multiple stages of metamorphic deformation. Through long-term geological research work, it is believed that this super-unit is closely related to the genetic evolution of gold deposits. During the emplacement process of intrusive magma, gold-bearing materials from the mantle were transported to the crust, establishing one of the primary “source layers” for gold deposits.
2.2 Linglong super-unit
The study area is mainly distributed in the east and south. It is produced in the form of basement and is in fault contact with the Qixia super-unit in the hanging wall. It includes medium-grained biotite-containing monzogranite in the Cuizhao Formation and medium-coarse-grained monzogranite in the Guojiadian Formation. This super-unit is related to the remelting and high migmatization of the Qixia super-unit and the Jiaodong Group, and is an “S” type granite (Cui et al., 2008). During the formation process, the Jiaodong Rock Group and Qixia Super-unit were remelted on a large scale, and the mineral-forming materials were successively captured and enriched again, laying a material foundation for further enrichment and mineralization in the later period (Wang et al., 2020).
3 1:50,000 soil geochemical characteristics of the study area
Most of the area is covered by the Quaternary System, mainly river alluvial and residual slope deposits. The lithology is gravelly sandy clay, subsand soil, subclay, etc. of the Linyi Formation, with a thickness of 0.5–20 m. Combined with the actual geological and landscape conditions of the survey area, the 1:50,000 soil geochemical measurement method was used for measurement, with a point spacing of 200 m × 500 m, and a total of 1,200 samples were collected.
3.1 Statistical characteristics of each element
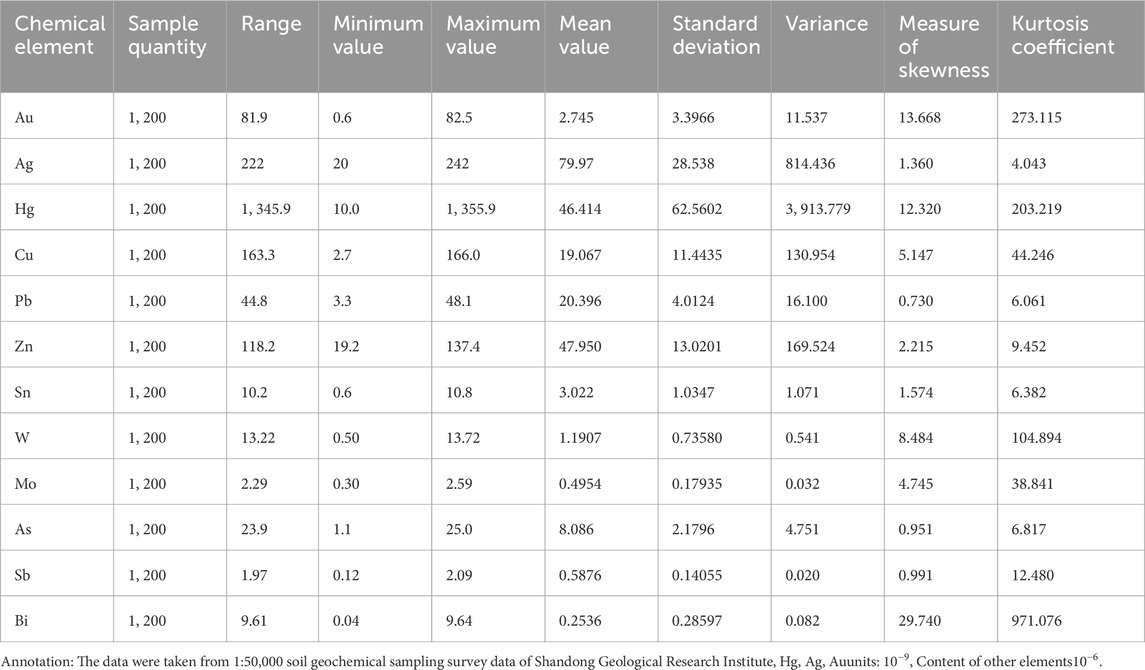
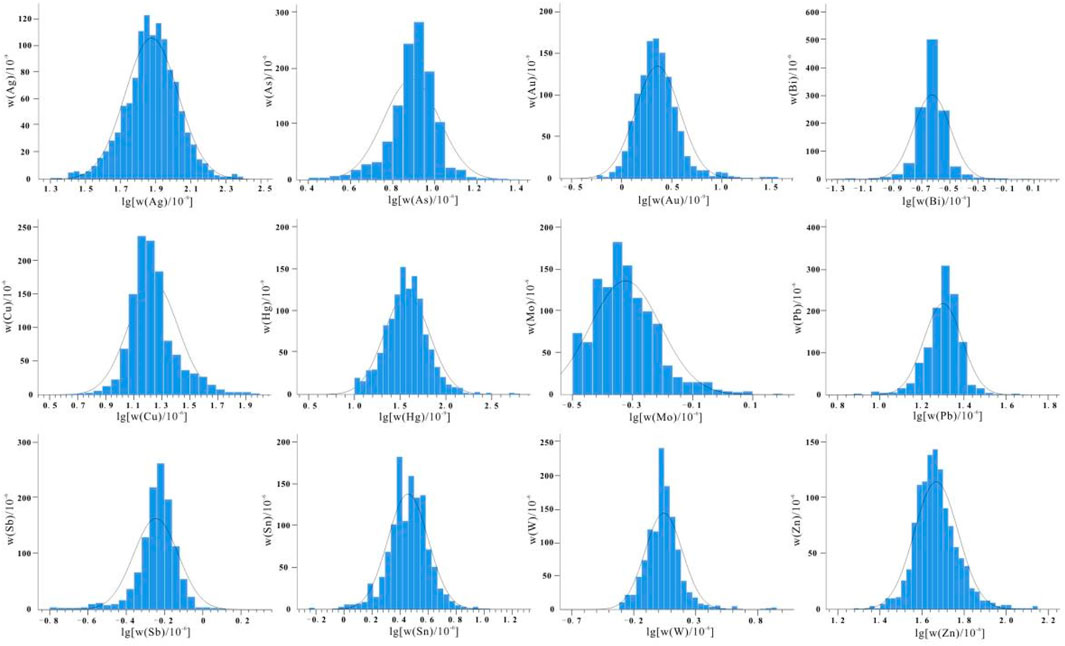
The sampling test data of the 1:50,000 soil geochemical profile in the study area analyzed 12 elements including Au, Ag, Hg, Cu, Pb, Zn, Sn, W, Mo, As, Sb, and Bi. The statistical characteristic values of each element are as follows Table 1. In order to display various indicators of the data more intuitively, SPSS is used to draw a histogram, as shown in Figures 1, 2. It is found that the skewness of the other elements except Bi is less than 20. The skewness of the Bi element is slightly higher, so the elements obey or approximately obey the positive direction. state distribution.
Combining Table 1 and Figure 2, it can be seen that: ① Reflects the large skewness of the element distribution form. If the Au element has a large skewness and approximately obeys a normal distribution, and the range value and variance are large, it means that Au has a tendency to be concentrated in this area, which is conducive to local enrichment and mineralization. There is no geological data that strictly obeys the normal distribution in nature. Li Fanglin et al. proposed that when the skewness coefficient is less than 20, it can be considered to be similar to the normal distribution, and when the skewness coefficient is greater than 20, it is similar to the lognormal distribution (Li FL. et al., 1999). ②The difference in Cu element reflected is not very obvious and is widely distributed. ③The kurtosis, which reflects the flatness of the data, varies greatly. Au, Hg, W, and Bi are several to hundreds of times larger than other elements, which determines the steepness of the normal distribution in the histogram. ④The coefficient of variation reflecting the degree of dispersion of each element varies greatly. The coefficients of variation of Au, Hg, W, Mo, Cu, and Bi in each geological unit are several to hundreds of times higher than those of other elements, so they are likely to be enriched in the study area.
3.2 Distribution of elements in various geological bodies
Different geological units have different geochemical backgrounds. Using the content change characteristics of elements in each geological unit, we can analyze the spatiotemporal distribution of elements, thereby exploring the relationship between element distribution and geological background, which will help us find more favorable conditions. Mineralizing geological unit.
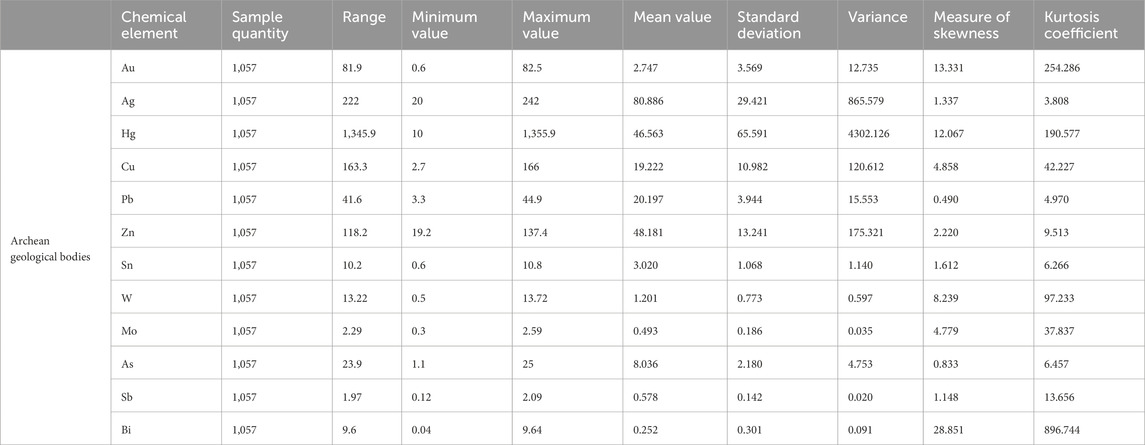
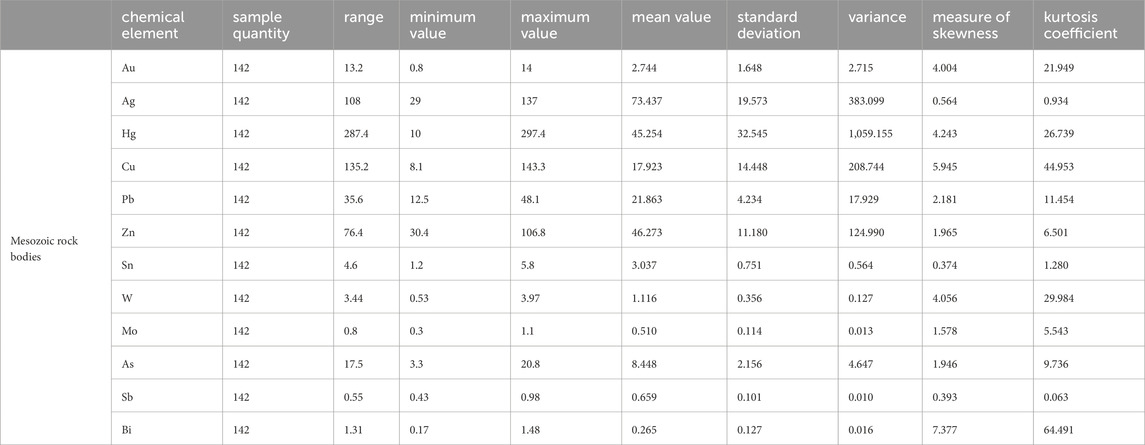
Based on the geological background of the study area, this paper divides it into two main geological units according to different ages and lithologies. They are the Mesozoic intrusions and Archean basement. The former mainly refers to the Linglong monzogranite., The latter includes medium-fine-grained amphibole-containing biotite tonalites in the Qixia Group, and fine-grained amphibole-containing biotite tonalitic gneisses in the Jiaodong Group. The contents of 12 elements for these two geological units have been statistically analyzed, and some representative values are shown in Table 2, 3.
The change trend of Au content varies greatly in these two geological units. The variance of Au content in the Archean basement is nearly 5 times higher than that of the Mesozoic intrusion, indicating that the degree of dispersion in the Archean basement is large and has a tendency of enrichment. This is consistent with the widely-distributed varying scales of mineral deposits (occurrences) throughout the region. The number of abnormal points and high-value points are also mostly concentrated in the Archean basement.
The changing trends of the element content of Ag, Cu, Pb, Zn, Sb, and As are very similar in different geological units, and the average values are almost equal. The degree of dispersion of the elements themselves is large, indicating that the elements are ubiquitous in the two geological units. This is mainly It is closely related to the low-temperature alteration prevalent in the study area.
The behavior of Hg in these two geological units is very different. The maximum value and variance in the Archean basement are several times higher than that of the Mesozoic intrusion rocks, indicating that the degree of dispersion in the Archean basement is relatively large. This is mainly caused by the two fault zones (Miaojia Fault and Jiaojia Fault) that extend into the Archean basement. Furthermore, the result also indicates that tectonic activity is relatively developed in the study area and fissure veins are widely distributed. However, the degree of data dispersion in Mesozoic intrusions is still large, which is closely related to the existence of two faults.
W, Sn, and Mo are all high-temperature elements that are easily active in acidic and alkaline environments and can easily form large-scale anomalies. The data shows that the three elements in the study area are mainly distributed in Archean geological bodies, but the two geological The difference between units is not obvious.
The maximum content of Bi element in Archean rock mass reaches 9.64 ppm, and the variance is 0.91, which is also several times higher than the content in Mesozoic rock mass, indicating a relatively large degree of dispersion. The Bi element kurtosis in the Archean rock mass indicates that the normal distribution of the element is sharper and the content difference is larger, while in the Mesozoic the normal distribution is sharper and the content difference is not obvious.
3.3 Combination relationship of elements
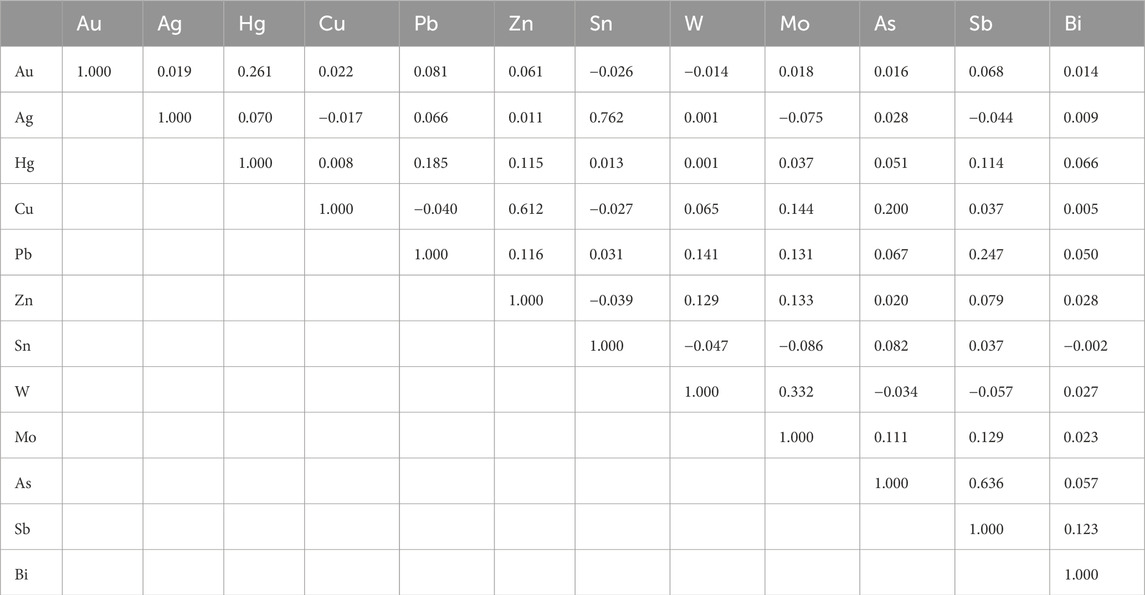
In order to better understand the relationship between various elements in the area, this paper applied SPSS software to conduct correlation analysis on 1,200 1:50,000 soil geochemical test data in the study area, as shown in Table 4. There is a close correlation between most elements. According to the correlation coefficient, the elements can be divided into the following groups: Au, Hg, Pb, W, Cu, Zn, Mo, As, Sb, Bi, Ag, Sn.
3.4 Element spatial distribution characteristics
When analyzing geochemical maps, the concentration value data of sampling points are usually compiled and processed, and the data are combined to estimate the large-scale variation at the regional or local level, and then compared with each section. Local outliers were eventually discovered, drawing attention to areas where detailed measurements could be made. Geochemical maps can intuitively reflect the spatial distribution status of element combinations or data elements. Therefore, to study the spatial distribution patterns of the two, it is often necessary to draw geochemical maps of elements or element combinations.
The production of 1:50,000 geochemical maps should try to reflect the spatial changes in the content of each element in an objective manner, and at the same time consider the impact of singular values on mapping distortion. Therefore, the production of geochemical maps uses data after robust processing of singular values. This article draws contour maps of 12 elements based on the 1:50,000 soil geochemical test data provided by the Shandong Institute of Geological Survey and Analysis, and analyzes the distribution characteristics of each element in the study area.
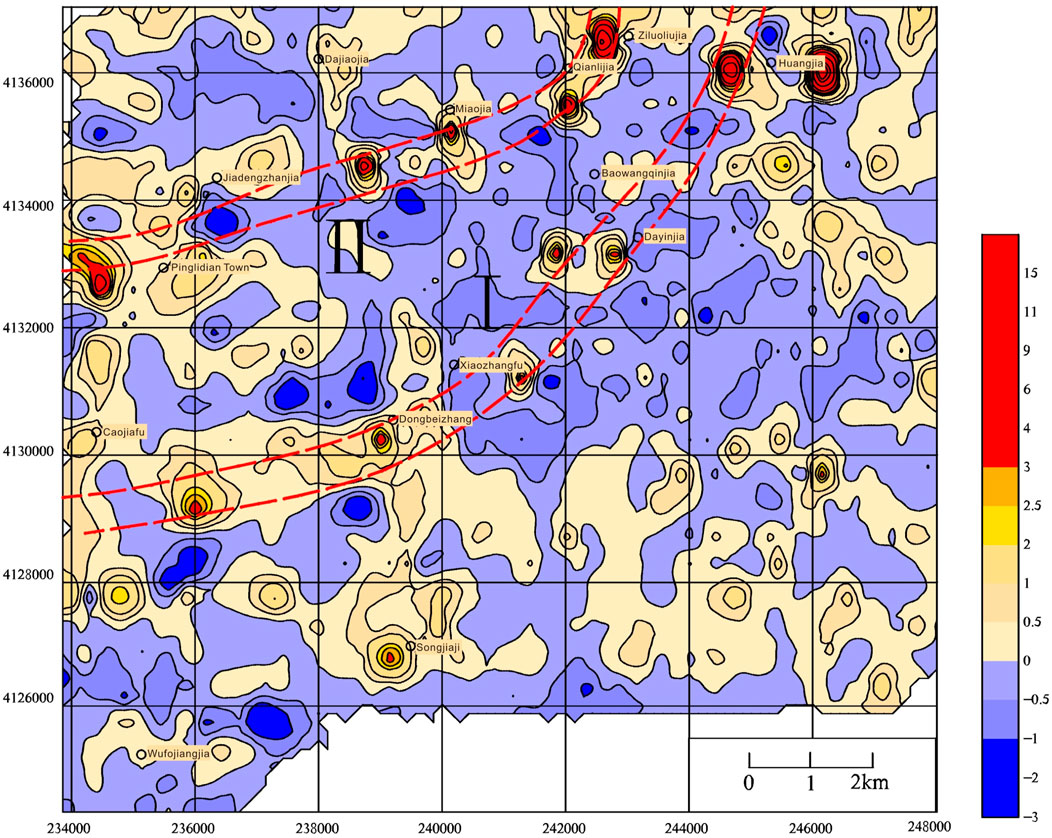
From Figure 3, it can be clearly seen that the distribution of Au in the study area is relatively concentrated, with the high-value areas with positive anomalies are regularly distributed in two belts. One belt starts from the Huangjia, to Baowangqinjia and Dayinjia, then to Xiaozhangbu, where areas with high gold value correspond to mineral deposits (occurrences). Due to the typical structural ore-controlling characteristics of Jiaojia, it is speculated that this belt is most likely to be the southern extension of the Jiaojia fault. The second belt extends southwestward from the Qianlijia area to Miaojia and Pinglidian towns. The high-value areas correspond to several quartz vein-type gold deposits (occurrences). The second belt is mainly controlled by the Miaojia Fault, but whether it extends to Pinglitian Town remains to be verified.
As an element with certain indicative significance for structure, the distribution of Hg element in the positive anomaly high value area is very similar to the distribution of Au element, with a distribution characteristic of approximate band-like shape. In the high-value area near the northeastern barrier, the long axis is nearly east-west. It is speculated that the trend of tectonic activity will change to the north-east during the process of southward extension. As and Sb elements are regional mineralization elements associated with Au, and their distribution patterns are also similar to Au elements.
The medium and high temperature elements W, Sn, Pb, and Bi are concentrated in the northwest and western region of the study area, showing a nearly east-west zoned distribution, and are located close to the medium-coarse-grained monzogranite of the Linglong in the south. It is speculated that the distribution of this group of elements is related to the weathering and denudation products of the rocks. Due to prolonged weathering and denudation processes affecting the rock mass, coupled with the infiltration of several rivers aligned nearly east-west, high-temperature elements have become extensively dispersed within the Quaternary cover in this region, resulting in a distinct abnormal distribution pattern. This anomalous distribution could potentially indicate the presence of a concealed rock mass beneath the affected areas. The high-temperature element Mo is mostly distributed within the Mesozoic intrusions. Ag, Cu, and Zn, as medium-low temperature elements, are also mainly distributed in the Quaternary cover, with few high-value areas occurring in the Mesozoic intrusions.
4 Factor analysis
Factor analysis is a type of multivariate statistical analysis method that uses the idea of dimensionality reduction to analyze the internal structure of the correlation matrix of the original variables and summarize some variables with intricate relationships into a few comprehensive factors (Xiang, 2005). As this discipline continues to develop, its uses have been widely introduced into other subject areas.
4.1 Analysis principles
The geological factor analysis method is to combine many geological observation factors (samples or variables) with intricate relationships and summarize them into a very few leading comprehensive factors (i.e., main factors), so as to facilitate the decomposition of superimposed geological processes, and then carry out the cause and analysis of geological factors. A multivariate statistical analysis method for classification studies. Utilizing this principle and using element geochemistry principles and research methods, we can find out the dispersion and aggregation laws of related elements from the ordered distribution characteristics of related factors, thereby providing scientific basis for structural inference, mineralization prediction, and mineral prospecting (Zhang et al., 2012).
Each comprehensive factor can quantitatively display the unobvious differences contained in samples or original geological markers, and they can better reflect the laws and essence of things. The division of comprehensive factors not only preserves important mineralization information, but also limits the number of variables, making it easier to classify and comprehensively analyze samples or geological markers. There are two main types of factor analysis models in the geological field, Q-type and R-type. Among them, R-type factor analysis is used primarily to study the relationship between variables. This article uses the R-type factor analysis model (Lv et al., 2002).
The specific method is as follows: There are n samples, and each sample observes p variables. First, the variables are standardized to eliminate the influence caused by the different magnitudes of the observation dimensions, and the factor model is obtained under the premise of meeting certain conditions:
Its matrix form is:
A=
Next, the initial factor loading matrix needs to be orthogonally rotated by the Varimax method. The purpose is to make the extracted common factors more interpretable and representative, and to effectively divide the element combinations based on the actual geological characteristics of the study area (Liu et al., 2015).
Geostatistics is mainly used in the following three aspects when studying geochemical information: 1) studying the spatial variation regularity of geochemical information and establishing a mathematical model of spatial variation of elements; 2) studying the spatial distribution characteristics of geochemical information and Enrichment trend; 3) Study the spatial distribution characteristics of element anomalies (Huang, 2007; Rice, 2006).
4.2 Application of factor analysis in structural information extraction
4.2.1 Factor identification related to constructs
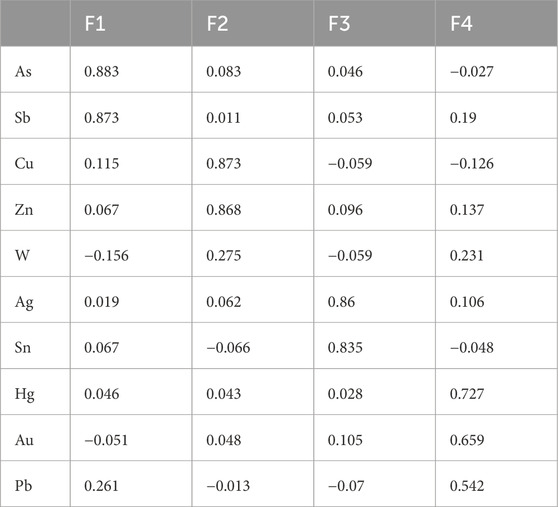
Factor analysis was conducted on the 1:50,000 soil geochemical test data in the study area in order to find a factor combination that reflects the structural characteristics. Four factors were determined based on the contribution rate (see Table 5). F1 represents the As-Sb element. Combination; F2 represents Cu-W-Zn element combination; F3 represents Ag-Sn element combination; F4 represents Hg-Au-Pb element combination.
Four factor groups are analyzed: F1 factor (As, Sb) represents low-temperature hydrothermal alteration, such as sericization, silicification and other alterations. The F2 factor (Cu, W, Zn) represents the polymetallic mineralization stage, and the F3 factor (Ag, Sn) can be combined into one factor as a regional combination of elements associated with metallurgy. The F4 factor (Hg, Au, Pb) represents the combination of mineralization elements. At the same time, Hg, as an element that indicates structure, is in the same group as Au, which also illustrates the characteristics of structural ore control in the Jiaojia fault zone.
In order to further verify, combined with the current research status of previous people, the alteration brought by the Xucunyuan exploration area project was selected to verify the correctness of the selection of factors. The F4 (Hg, Au, Pb) factor is used to draw a comprehensive geological-chemical prospecting profile, combined with the geological profile of the 512 line exploration line in the Xucunyuan exploration area, and the anomaly information is comprehensively compared with the actual geological information (see Figure 4).
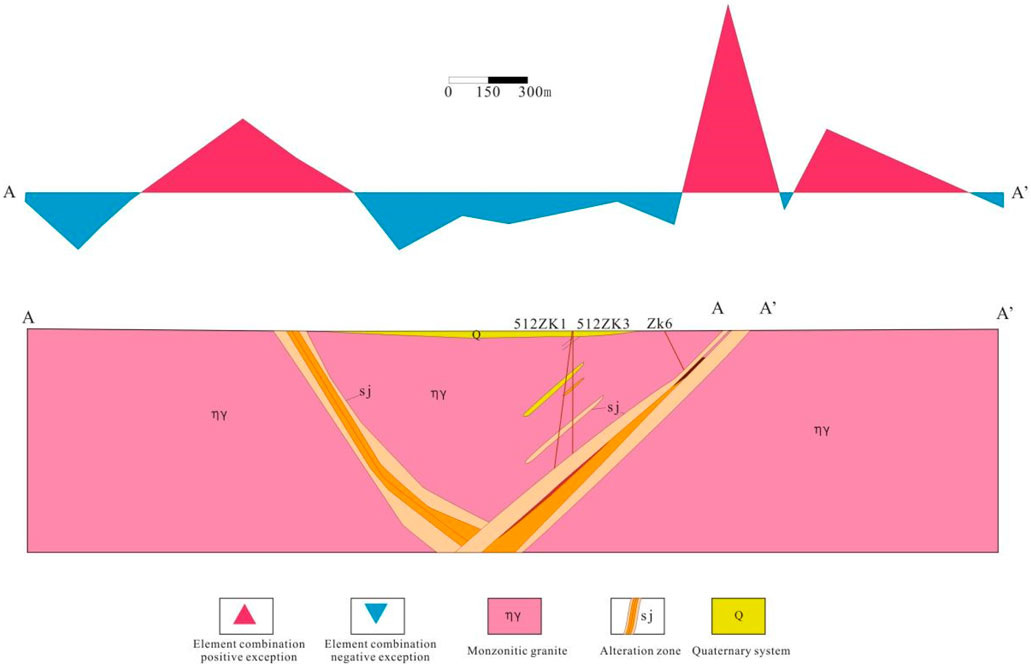
Figure 4. Comprehensive geological-geochemical profile of Exploration Line 512. Note: A-A’ is the 1:50,000 soil geochemical F4 (Hg, Au, Pb) geochemical profile of the south extension section of Jiaojia, and the geological survey of line 512 is shown in Figure 1.
The right side of the 512 line section in Figure 4 shows the southern extension of the Jiaojia main fault exposed by the project. Comparing the flat section of the test data, it can be clearly found that the peak position of the positive anomaly is accurately consistent with the main fault on the right and the main fault on the left. Corresponds to the secondary fracture location.
Figure 5 selects the geological profile of the exploration line of the Dayinjia Gold Mine in the study area. Comparing the location of the positive anomaly peak of the F4 factor with the actual geological bodies revealed in the profile, it is found that the location of the positive anomaly peak is where the tectonic activity is relatively high. Lots of locations. On the west side is the southern section of the Miaojia fault, which has the same shape as the northern section, and has a tendency to intersect with the inferred Jiaojia fault in the deeper parts. The exposure of diorite porphyry veins and alteration zones on the east side indicate the existence of faults in this area, and it is inferred that the southern section of the Jiaojia Fault passes here.
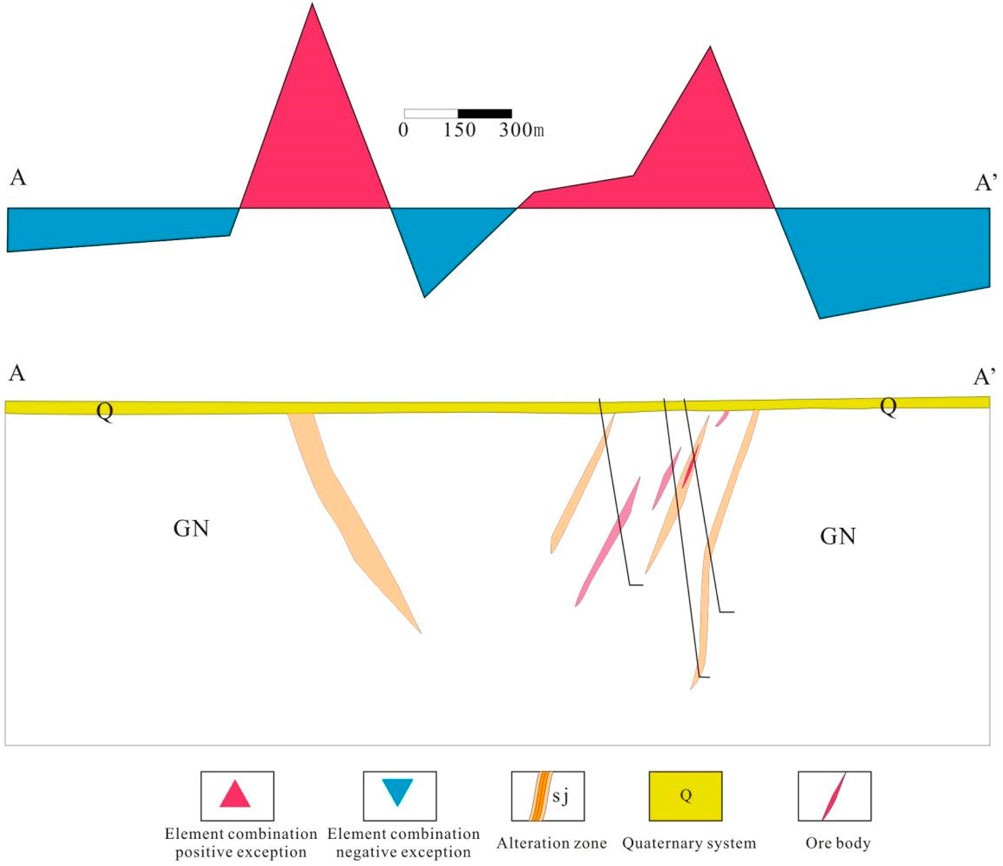
Figure 5. Comprehensive geological-geochemical of Dayinjia No. 8 exploration line. Note: A-A’ is the soil geochemical F4 (Hg, Au, Pb) geochemical profile of 1:50,000 in the south extension section of Jiaojia.
Through the above analysis, it is inferred that the selected F4 factor has important indicative significance for the identification of structural locations, and provides a very reliable basis for the subsequent trend of the southern extension of the Jiaojia Fault Zone.
4.2.2 Extraction of structural information and structural inference
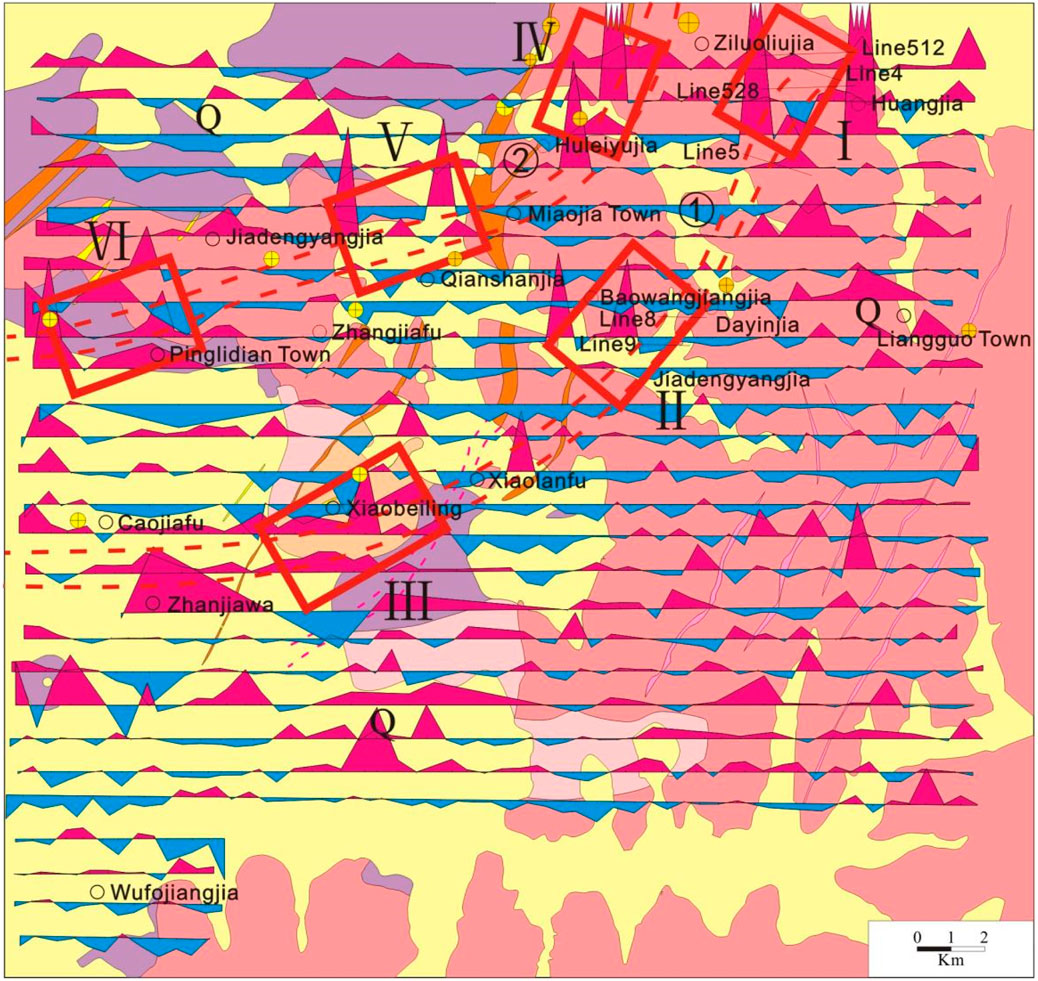
Draw a geological profile (Figure 6) based on the F4 factors (Hg, Au, Pb) obtained above that reflect structural information, and summarize the locations of positive and negative anomalies in order to extract effective information indicating the structure.
A total of two main fault structures have been demarcated within the study area. One is distributed on the west side of the study area, starting from the west side of Ziluo Liu’s house in the north and extending southward through Hu Lei’s Yujia, Miaojia Town, Jiadeng Yangjia, In Pinglitian Town, the direction changes near Miaojia Town, with a westward trend, which is speculated to be the Miaojia Fault. The other one starts from the vicinity of Xucunyuan in the north of Huang’s house, and extends southward through Dayin’s house, Baowang Jiang’s house, Xiaolanbu, Xiaobeiling, and Zhanjiawa. It starts from Dayin’s house and goes the same slow way. Changes, with a westward trend, are speculated to be the southern extension of the Jiaojiazhu fault.
Through the two main fault structures inferred in Figure 6, it is found that the inferred southern extension of the Jiaojia Main Fault has the characteristics of strong and weak zoning along the general trend. Comparing the geological maps, it was found that there are mineral deposits (points) distributed in all strong belts. Among them, the strong belt I is close to the Xucunyuan exploration area, and the current project has exposed the ore body; the strong belt II contains the Dayinjia deposit, and the survey work has discovered 5 gold-bearing alteration zones. The strong III zone is located near Zhangcun in the northeast, with small mineral spots scattered around it and no formed deposits. No mineral deposits (points) were found in the two weak zones, which illustrates the rationality of the zoning.
According to previous research, the ore deposits distributed in the northern section of the Jiaojia Fault Zone are also zoned (Li JX. et al., 1999; Lv et al., 1999). The distance between the main ore bodies of the two deposits is about 1,400 m. Combining the above analysis results, it was found that the northern section It is similar to the structural ore-controlling characteristics of the southern section, further enriching the theoretical basis for structural inference.
4.3 Application of factor analysis in extracting mineralization anomaly information
4.3.1 Identification of factors related to mineralization and alteration
Most of the gold deposits (points) in the Jiaojia Fault Zone exist near the main fault, and the corresponding mineralization and alteration are closely related to the structure. Analyzing the mineralization and alteration information in the study area can determine the location and direction of the fault To the role of verification. This article selects factors containing gold elements as the main analysis objects to explore the distribution characteristics of mineralization alteration in this area.
Through the above factor analysis of the 1:50,000 soil geochemical test data, it is found that the F4 (Hg, Au, Pb) factor contains the main mineralization element Au, the Hg element closely related to the structure, and the middle element related to the hydrothermal fluid. The low-temperature element Pb reflects specific tectonic activities to a certain extent (Han, 2019). Previous people have done factor analysis on the mineralized elements of the Jiaojia gold mine and found that the Au element is highly correlated with Hg and Pb elements (Guo et al., 2008). In Figure 3, on the plane section made using the F4 factor score data, two Xucunyuan gold deposits and Dayinjia gold deposits that fit well with the F4 factor peak positions were selected to analyze the mineralization conditions of the two deposits. authenticating.
Among them, 14 alteration zones have been discovered in the Dayinjia gold deposit, of which 5 have gold mineralization. The larger one is the No. 1 alteration zone, which has a surface control length of 600 m, a maximum width of 40 m in the middle, and an average width of 3 m. No. I-1 gold ore body is developed in the middle of the alteration zone. The ore body has a controlled length of 150 m, an average width of 2.43 m, and an average grade of 3.67 × 10⁻⁶.
Lines 504 and 488 of the Xucunyuan mining area saw two gold ore (chemical) bodies controlled by a single project respectively, with grades reaching 0.81 × 10⁻⁶ and 2.21 × 10⁻⁶, and thicknesses of 1.08 m and 1.18 m respectively. The gold ore (chemical) body controlled by 488ZK13 is distributed at the bottom of the pyrite-sericite cataclastic zone below the main fracture surface. The ore-controlling elevation is −52 m. Below it is the pyrite-sericite granitocatlastic rock. zone; 504 ZK14-controlled gold deposits are distributed in the pyrite-seritic granite zone, with an ore-controlling elevation of −55 m, and are controlled by secondary ore-controlling fissures (Cui, 2007).
Based on the previous examples, it can be inferred that the establishment of the F4 factor confirms that the southern extension of the Jiaojia Fault Zone has the same mineralization element combination characteristics as the northern section, which has important indications for the mineralization alteration in the area.
4.3.2 Delineation of abnormal information
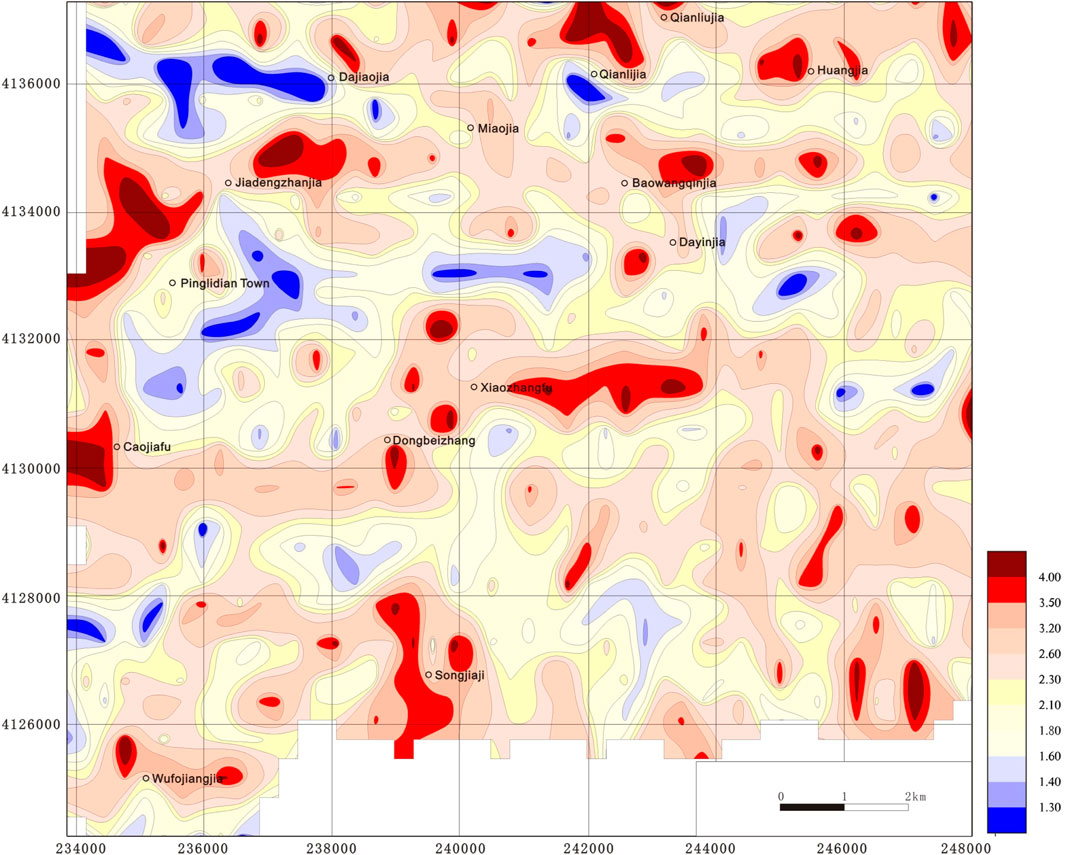
The factor scores obtained in R-type factor analysis are used to draw geochemical contour maps, which are widely used in current geological work. The factor score contour map can intuitively reflect the distribution of element combinations, and its geochemical and geological significance is more clear (Li et al., 2017). Drawing a contour map (Figure 7) based on the F4 (Hg, Au, Pb) factor score can clearly identify areas with abnormally higher background values. These areas provide directions for the search and development of mineral resources.
According to the position of the positive anomaly area in the factor score contour map 5–5, it is found that the high-value areas are mainly distributed in two belts, labeled No. I and No. II respectively. The shape of Zone I is very similar to the structural shape on the east side inferred in Figure 6. From north to south, the abnormally high value area is divided into Zone 1 (Huangjia), Zone 2 (Dayinjia), and Zone 3 (Northeast barrier, Xiaobeiling). The shape of Zone II is also very similar to the structural shape of the west side inferred in Figure 6. From north to south, it is divided into Zone 1 (Hu Lei Yujia), Zone 2 (Miaojia Town), and Zone 3 (Ping). Lidian Town.
4.3.3 Exception explanation and evaluation
Comparing the position of Zone I in Figure 7, it is found that it extends to the same position and direction as the fault zone revealed by the Xucunyuan Mineral Deposit Project, and is inferred to be the southern extension of the Jiaojia Main Fault Zone. The No. Ⅱ zone is inferred to be the southern extension of the Miaojia fault zone that is basically consistent with the trend of the Jiaojia fault zone.
Combined with the strong and weak zoning in Figure 3, it can be found that the isometric characteristics reflected in the two pictures are very similar. Previous studies have shown that there are isometric characteristics between the various deposits in the northern section of the Jiaojia Fault Zone. This paper believes that the mineralization patterns of the deposits in the study area have the same characteristics. There are dispersion and accumulation of elements in any area, and this feature is closely related to the geological background of the area (Zhao et al., 2012). Based on the above findings, it is proved that analyzing soil geochemical information through factor analysis and selecting appropriate factors can correctly reflect the actual geological information. Based on the abnormal distribution and the actual observed geological conditions in the field, the prospecting direction can be effectively clarified and the prospecting target area can be determined.
5 Conclusion
This paper addresses the main issues and shortcomings in the southern extension of the Jiaojia mineralization belt. Based on 1:50,000 soil geochemical exploration data from this area, R-type factor analysis was used to identify multiple factors (principal components) and clarify the geological significance of each. With careful consideration of the geochemical properties of various elements, the study examined the geochemical field structure information related to factors closely associated with tectonics in the region. Geological-geochemical comprehensive profile maps, geological cross-sections, and factor score contour maps were created, revealing that F4 (Hg, Au, Pb) has significant indicative value for discerning fault structures and identifying mineralization information. Continuing with the factor analysis approach, we processed 1:1,000 detailed exploration profile test data to extract the F2 (Pb, As, Sb, Hg) factor, which is significant for distinguishing fault structures. The positive anomaly peak positions aligned well, confirming that the F4 factor can reflect important structural and mineralization information in the area. This has notable implications for recognizing tectonic and mineralization information.
Based on the spatial enrichment patterns of mineralization in the Jiaojia mineralization belt from north to south, this paper suggests that the depth of ore body occurrence tends to increase gradually to the south. Additionally, the tectonic activity in the region is more developed compared to the northern section, which facilitates the migration and accumulation of mineralizing materials. This paper identifies two main longitudinal mineralization belts: the southern extension of the Jiaojia fault. Considering the current engineering control conditions, as well as the geological conditions, mineralization characteristics, and spatial distribution (isotropy) patterns of the gold deposits, it is proposed that this area may serve as a favorable zone for the formation of altered rock-type gold deposits.
Data availability statement
The original contributions presented in the study are included in the article/supplementary material, further inquiries can be directed to the corresponding author.
Author contributions
ZM: Methodology, Writing–original draft. YQ: Methodology, Resources, Validation, Writing–original draft. MJ: Supervision, Writing–review and editing.
Funding
The author(s) declare that financial support was received for the research, authorship, and/or publication of this article. This research was supported by the Cores and Samples Center of Natural Resources, China Geological Survey, “Selection, Collection and Service Application Demonstration of Strategic Mineral Physical Geological Data” (No: DD20240126).
Conflict of interest
The authors declare that the research was conducted in the absence of any commercial or financial relationships that could be construed as a potential conflict of interest.
Publisher’s note
All claims expressed in this article are solely those of the authors and do not necessarily represent those of their affiliated organizations, or those of the publisher, the editors and the reviewers. Any product that may be evaluated in this article, or claim that may be made by its manufacturer, is not guaranteed or endorsed by the publisher.
References
Cao, C. G., Yu, Y. W., Guo, G. Q., et al. (2012). Analysis on ore-forming model in deep part of jijia gold deposit in sanshandao by using integrated geophysical exploration method. Shandong Land Resour. 28 (04), 19–24.
Chen, Y. Y. (2017). Geochemical characteristics and deposit genesis of Jiaojia gold deposit in Shandong Province, China. Xi’an: Chang’an University.
Cui, S. X. (2007). Analysis on south widening and ore prospecting future of Jiaojia Fault belt. Shandong Land Resour. (10), 7–10.
Cui, S. X., Yuan, W. H., and Yang, Z. L. (2008). Geological characteristics in the deep of SizhuangGold deposit in Laizhou city. Northwest. Geol. 41 (04), 82–92.
Guo, T., Deng, J., Lv, G. X., et al. (2008). Factor analysis of elements related to mineralization in Jiaojia gold deposit. Contributions To Geol. Mineral Resour. Res. 90 (02), 106–112.
Han, B. N. (2019). Characteristics of Jiaodong gold deposits and mineralization prospection of southern and deep part of jiaojia fault. World Nonferrous Met. 535 (19), 84+86.
Huang, J. N. (2007). Delineation and estimation of geochemical AnomalyUsing geostatistical methods. Beijing: China University of Geosciences.
Li, F. L., Bao, Z. Y., and Pei, T. (1999a). Principle and software system of Geochemical date processing. Earth Science-Journal China Univ. Geosciences (03), 101–104.
Li, J. X., Guo, T., and Lv, G. X. (1999b). Discussion on gold mineralization type and its relation with tectonic in northwestern Jiaodong. J. precious metallic Geol. (2), 24–28.
Li, P. Y., Shi, W. J., and Wei, J. H. (2017). An evaluation of ore-prospecting potential for copper polymetallic deposits in a certain area of Xinghai County, Qinghai Province, based on processing and anomaly extraction for 1:50000 soil geochemical survey. Geophys. Geochem. Explor. 41 (02), 194–202.
Liu, H., Huang, H. X., Li, G. M., et al. (2015). Factor analysis in geochemical survey of the Shangdu gold deposit, northern Tibet. Geol. China 42 (04), 1126–1136.
Lv, G. X., Guo, T., and Liu, D. J. (2002). Ceological and structural characteristics of the linglong-jiaojia type cold deposits and FactorAnalysis of their metallogenic tectonic physicochemical parameters—exemplified by the fushan gold deposit. Acta Geol. Sin. (05), 409–416.
Lv, G. X., Wu, J. C., Zheng, X. L., et al. (1999). A study and prognosis of deep resources along the second enrichment belt of the Linglong gold orefield, Shandong Province. Mineral. deposits (2), 24–28.
Ma, J. S. (2019). Geological characteristics and prospecting direction of Shuangshan fluorite deposit in Penglai, Shandong Province. Technol. Innovation Appl. 262 (06), 79–80.
Shi, G. F., Qu, W. L., and Yu, Y. (2022). Geological characteristics of gold deposits in Jiaodong area andProspect of south extension and deep prospecting of Jiaojia Fault Zone. China Resour. Compr. Util. 40 (04), 79–82.
Wang, Q. Y., Du, L. M., Hu, C. Y., et al. (2020). Analysis and comprehensive of geophysical characteristics and prospecting prediction in Linglong fault belt, Shandong Province. Gold Sci. Technol. 35 (03), 1061–1067.
Xiang, D. J. (2005). Practical multivariate statistical analysis[M]. Wuhan: China University of Geosciences Press, 157–171.
Xie, Y. F., and Sun, Z. Q. (2008). Gold mine survey in xucunyuan area, Laizhou city, Shandong Province. Gansu Sci. T echnolo gy (02), 70–71+66.
Zhang, Y. H., Liu, Y. P., and Zhang, H. (2012). The application of factor analysis to geochemical prospecting by the example of the Liwu ore district. Acta Geol. Sichuan 32 (01), 112–115.
Keywords: factor analysis, geochemistry, prospecting potential evaluation, gold deposit, ore belt
Citation: Ma Z, Qiao Y and Jing M (2024) Prospecting potential evaluation based on geological factor analysis-a case study of Jiaojiacheng ore belt. Front. Earth Sci. 12:1464429. doi: 10.3389/feart.2024.1464429
Received: 14 July 2024; Accepted: 18 October 2024;
Published: 11 November 2024.
Edited by:
Peng Zeng, Chengdu University of Technology, ChinaReviewed by:
Gang Liu, Heilongjiang University of Science and Technology, ChinaWenjing Niu, Guangxi University, China
Copyright © 2024 Ma, Qiao and Jing. This is an open-access article distributed under the terms of the Creative Commons Attribution License (CC BY). The use, distribution or reproduction in other forums is permitted, provided the original author(s) and the copyright owner(s) are credited and that the original publication in this journal is cited, in accordance with accepted academic practice. No use, distribution or reproduction is permitted which does not comply with these terms.
*Correspondence: Ming Jing, am0xNjN5eHpoQDE2My5jb20=
 Zhaoyang Ma1,2
 Ming Jing