- 1SDGSAT Satellite and Data Processing Division, International Research Center of Big Data for Sustainable Development Goals, Beijing, China
- 2Key Laboratory of Digital Earth Science, Aerospace Information Research Institute, Chinese Academy of Sciences, Beijing, China
- 3Institute of Soil and Water Conservation, Northwest A&F University, Xianyang, Shaanxi, China
- 4Institute of Soil and Water Conservation, Chinese Academy of Sciences and Ministry of Water Resources, Yangling, Shaanxi, China
- 5Urumqi Comprehensive Survey Center on Natural Resources, China Geological Survey, Urumqi, Xinjiang, China
- 6School of Management, Tianjin University of Commerce, Tianjin, China
The warming and drying trend accompanying climate change challenges global ecosystem stability. Vegetation phenology, which can serve as a sensitive indicator of climate change, is crucial in understanding ecosystem carbon cycling and climate-carbon cycle feedback. Therefore, assessing the phenological responses to drought is essential for addressing climate change. In this study, vegetation phenology data [including the start and end of season (SOS, EOS) and length of growing season (LOS)] and the Palmer drought severity index (PDSI) were employed to analyze the impacts of drought on plant phenology in China by maximum Pearson correlation coefficients and partial least squares regression. The findings showed that drought significantly affected the timing of phenology, delaying senescence in approximately 62% of China and extending the growing season in about 53% of the country, indicating the critical role of water availability in vegetation biomass. Preseason nocturnal warming was found to advance SOS, delay EOS, and extend LOS across China, with significant effects observed in approximately 60% of the country. Meanwhile, daytime warming delayed SOS, delayed EOS and extended LOS in 50∼60% of the regions. Moreover, preseason precipitation is conducive to advanced SOS, delayed EOS and extended LOS in northern China and areas susceptible to drought. It is suggested that vegetation management should be strengthened to mitigate the impact of climate change in temperate and drought-prone regions in China since climate warming will lead to frequent droughts.
1 Introduction
Global temperature has been experiencing an unprecedented increase since the 20th century (IPCC, 2014). Climate warming has increased the frequency of extreme weather events, particularly floods and droughts (Cook et al., 2018; Li et al., 2020). Drought, as a complex and recurring natural disaster, has historically plagued civilizations (Heim, 2002). It can have adverse consequences on ecosystems, natural habitats, and the global socioeconomy (Heim, 2002), including exacerbated land degradation (Vicente-Serrano et al., 2015), noteworthy vegetation loss (Wang et al., 2014), and even increased social violence (Detges, 2016). As global climate change continues to intensify, the impact of drought on civilization has become increasingly severe. In this context, it is becoming urgent to integrate remote sensing technologies with advanced experimental and modeling analyses in order to fully understand the effects of climate change on vegetation and other natural resources, and to develop effective response strategies (Crimaldi and Lama, 2021; Lama and Crimaldi, 2021; Lama et al., 2021; Lense et al., 2023; Piao et al., 2019).
Vegetation phenology, as a sensitive indicator of climate change, plays a crucial role in the carbon and nutrient cycles of terrestrial ecosystems (Piao et al., 2019). With climate warming, vegetation phenology has significantly shifted globally (Richardson et al., 2013). The timing of spring phenology has notably advanced over decades, particularly in temperate and cold regions sensitive to temperature, such as the Tibetan Plateau (Shen et al., 2014; Zhang et al., 2018). On the other hand, autumn phenology has exhibited delays in certain regions due to global warming (Liu et al., 2016). However, recent studies have highlighted the increasing influence of extreme weather events, especially droughts, as striking factors disrupting vegetation growth (Cui et al., 2017; Kang et al., 2018; Shen et al., 2014). Therefore, it is crucial to quantify the response of vegetation phenology to droughts for effective vegetation management.
Droughts have notable impacts on vegetation, including stunted growth, decreased greenness, reduced biomass, and even plant mortality, leading to profound consequences for ecosystem functions and the carbon cycle (Zhang et al., 2017). Previous studies have primarily examined the spatial and temporal relationships between drought indices and the normalized difference vegetation index (NDVI) derived from satellite data (Klisch and Atzberger, 2016; Son et al., 2012). However, NDVI alone cannot capture specific vegetation physiological indicators, making it a less comprehensive measure for studying the effects of droughts on vegetation dynamics. In contrast, utilizing direct proxies of vegetation indicators, such as phenological metrics such as the start and end of the growing season (SOS and EOS) and net primary productivity derived from remote sensing data, may offer superior insights into understanding the impacts of droughts on vegetation (Cui et al., 2017; Kang et al., 2018).
With the third-largest land area and the largest agricultural area globally, China has been plagued by frequent and severe droughts for decades, attributed to the interaction between the monsoon climate and complex geographical landscapes (Wang Z. et al., 2017; Xu et al., 2015). These droughts occurred not only in the dry northern regions but also in the relatively humid southern areas of China (Wang et al., 2014; Zhang et al., 2019). The detrimental consequences of these frequent and severe droughts on economic and social development in China were substantial. Numerous studies have examined the impacts of drought on vegetation phenology in China, highlighting complex and varied responses (Qiao et al., 2024; Wu et al., 2022; Yuan et al., 2020). These studies demonstrated that drought can affect the SOS and EOS, with effects ranging from delayed senescence to advanced or delayed onset of spring phenology, depending on the region and ecosystem type. Building on this foundation, our study specifically focused on the use of phenological metrics (SOS, EOS, and LOS) combined with the Palmer Drought Severity Index (PDSI) to analyze the impacts of drought on vegetation across different regions of China and identify the driving factors (Busico et al., 2020).
Hence, this study aimed to quantify the responses of vegetation phenology to droughts and identify the driving factors using the Palmer drought severity index (PDSI) with different timescales and phenological metrics from 2001 to 2018. The specific objectives of this study were as follows: (1) to analyze the spatiotemporal characteristics of drought and vegetation phenology; (2) to explore the patterns of phenological responses to droughts at different timescales across China; and (3) to understand the influence of climate factors on vegetation phenology.
2 Datasets and methods
2.1 Study area
China, in the Northern Hemisphere, encompasses a vast territory and spans multiple climatic zones. The topography of China exhibits a high-to-low elevational gradient from west to east, dividing the country into three distinct regions. As a result, China showcases a diverse range of vegetation types. The eastern part of the country and the Chengdu Plain are predominantly characterized by forest, while grass dominates the western and northern regions. Forest, on the other hand, are extensively distributed across southern and northeastern China. Large unused land areas are notably prevalent in northwestern China (Figure 1).
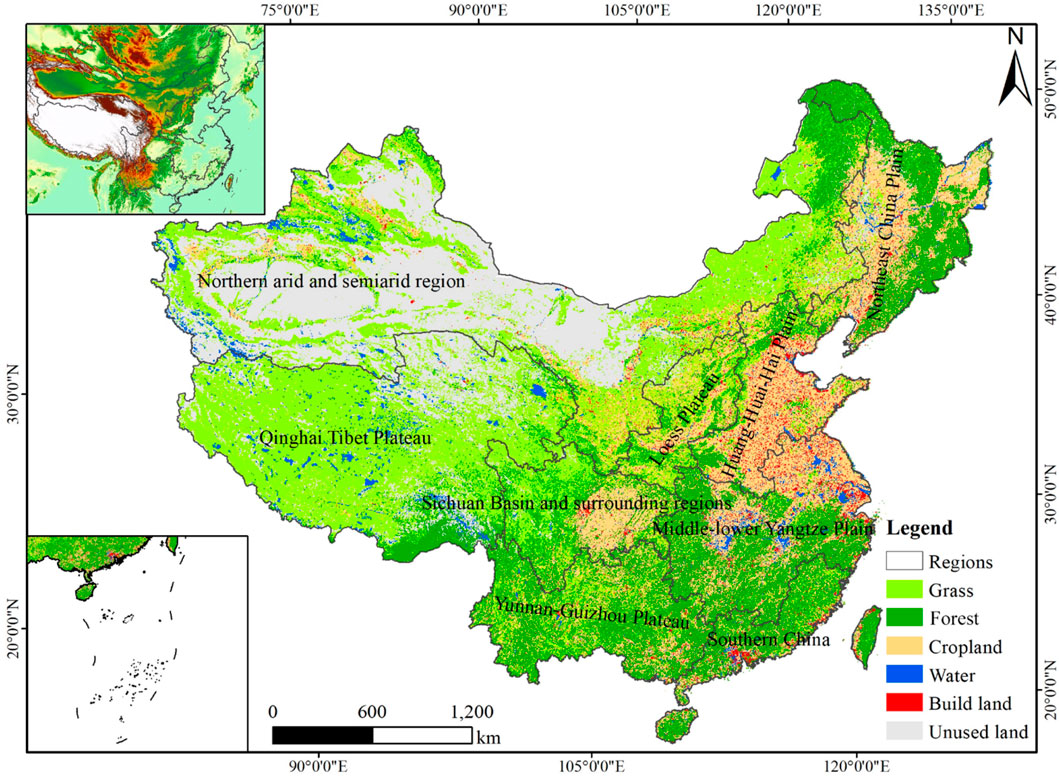
Figure 1. Vegetation distribution in China, modified from the Land use and Land cover dataset of 2015 provided by the Resources and Environment Science and Data Center (http://www.resdc.cn/).
2.2 Dataset
Phenological metrics obtained from the Moderate Resolution Imaging Spectroradiometer (MCD12 Q2) with 500 m spatial resolution were used to analyze the spatiotemporal variations in vegetation phenology and the relationships between vegetation phenology and drought index. The dataset was provided by the National Aeronautics and Space Administration and has been widely employed for studying global change (Meng et al., 2020; Zhang et al., 2004). The vegetation phenology product was derived from the enhanced vegetation index (EVI) time series, containing seven vegetation growth stages (Gray et al., 2019). The two commonly used phenological metrics, greenup (indicating the start of season, SOS) and senescence (indicating the end of season, EOS), were selected to examine the variations in vegetation phenology. Additionally, the growing season (LOS) length was calculated based on the timing of greenup and senescence.
The PDSI, a widely used meteorological drought index, was employed to evaluate moisture supply and demand based on temperature and precipitation data (Palmer, 1965). The PDSI was selected as the drought index to assess drought risk and vegetation drought resistance across China. The PDSI dataset used in this study was obtained from Abatzoglou et al. (2018) and has a spatial resolution of 4 km. The dataset covers the period from 2001 to 2018 and was acquired from the Climatology Lab (http://www.climatologylab.org/terraclimate.html). The PDSI was calculated for various timescales, including 1, 3, 6, 9, 12, 18, and 24 months to examine vegetation responses to droughts of different durations.
Monthly meteorological data, including maximum air temperature (i.e., daytime temperature, Tmax), minimum air temperature (i.e., nocturnal temperature, Tmin) and precipitation upscaled from the Climate Research Unit dataset (CRU Ts4.0) at the University of East Anglia by Abatzoglou et al. (2018), were also utilized to determine the responses of vegetation phenology to climate change. These metrological datasets, from 2001 to 2018, were also downloaded from the Climatology Lab with a spatial resolution of 1/24° (∼4 km).
2.3 Methods
2.3.1 Trend analysis
In this study, long-term trends of vegetation phenology, including SOS, EOS and LOS, as well as the PDSI, were determined using a linear regression model based on the least square method (Mao et al., 2012). The expression (Equation 1) is as follows:
where n is the research time, x is the ith year of vegetation phenology or drought index, and S is the variation trend. A positive S means an increasing variable, whereas a negative S indicates a decreasing variable (Luo et al., 2018). In addition, a t-test was used to verify the significance of trends.
2.3.2 Maximum Pearson correlation coefficients
The maximum Pearson correlation coefficients (MCC) between vegetation phenology and PDSI with multiple timescales were utilized to analyze the drought resistance of vegetation across China (Zhang et al., 2017). The expressions (Equations 2, 3) is:
where x is the annual vegetation phenology; i is the ith month (ranging from 1 to 12), j is the timescale of PDSI;
2.3.3 Partial least squares regression
In this study, we assumed that the time and intensity of climate factors are equally essential to reveal the temporal changes in vegetation phenology. Hence, partial least squares regression (PLSR) was applied to analyze the temporal and spatial effects of preseason climate factors on the phenology of different vegetation types. The PLSR method integrates the characteristics of principal component analysis and multiple linear regression, allowing correlations to be established between numerous independent factors and one or more dependent variables (Geladi and Kowalski, 1986). This approach was widely used to develop predictive models and project potential structures in various research fields (Guo et al., 2021; Li et al., 2020). There are two primary outputs of PLSR, i.e., the variable importance projection (VIP) and standard model coefficients (MC) (Guo et al., 2017). VIP is obtained by weighted calculation of the sum of squares loaded by PLS for each independent variable, reflecting the importance of all independent variables in explaining the change in the dependent variable. The VIP threshold was often set as 0.8 in previous studies (Guo et al., 2017; Luedeling et al., 2013). The standard MC represents the intensity and direction of the influence of each variable in the PLS model.
3 Results
3.1 Spatiotemporal characteristics of droughts and phenology
Conditions during the first 18 years of the 21st century were quite dry in China (Figure 2A). Generally, most of each month experienced dry conditions (PDSI ≤ −0.5). In addition, a severe drought occurred during 2009–2010 across China, especially in southwestern and northeastern China, resulting in tremendous agricultural and economic losses (Barriopedro et al., 2012). As depicted by the spatial trends of PDSI, during the study period, the Greater Khingan Mountains, Qinghai, the Sichuan Basin and the southeastern coastal areas gradually became wetter, while the southern Tibetan Plateau, Yunnan and North China Plain became progressively drier (Figure 2B).
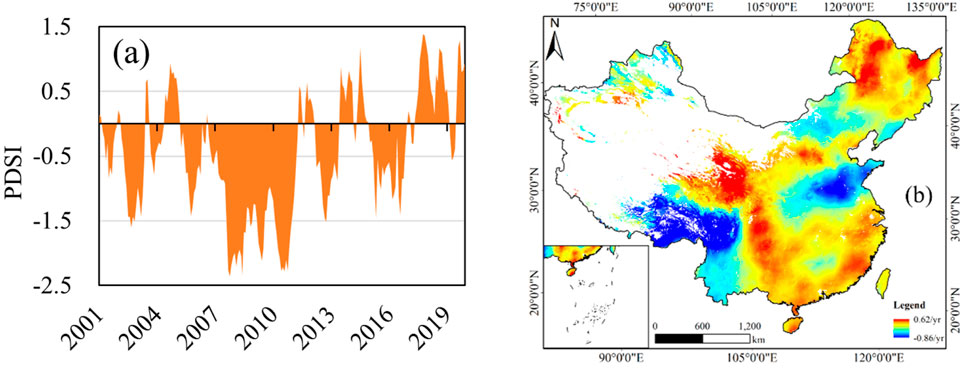
Figure 2. Temporospatial characteristics of droughts across China. (A) Temporal variation, and (B) long-term trend of PDSI across China from 2001 to 2018.
During the study period, the SOS was significantly advanced across China, with an advancement rate of 0.29 days/yr (p < 0.05). Affected by the intense drought episode, the SOS displayed a noticeable delay in 2010 (Figure 3A). Like the SOS, the EOS also showed significant advancement during the study period, with a rate of 0.17 days/yr (p < 0.05). Due to the synchronous variations in the SOS and EOS, the LOS in China was not significantly extended, with a rate of 0.12 days/yr (p = 0.23). Spatially, the SOS was advanced in most regions of China, with significant advances in the Tibetan Plateau, northern Loess Plateau, and southwestern and northeastern China (Figure 3B). In addition, phenology was delayed in a small number of plants scattered in the Loess Plateau, the Yungui Plateau and the North China Plain.
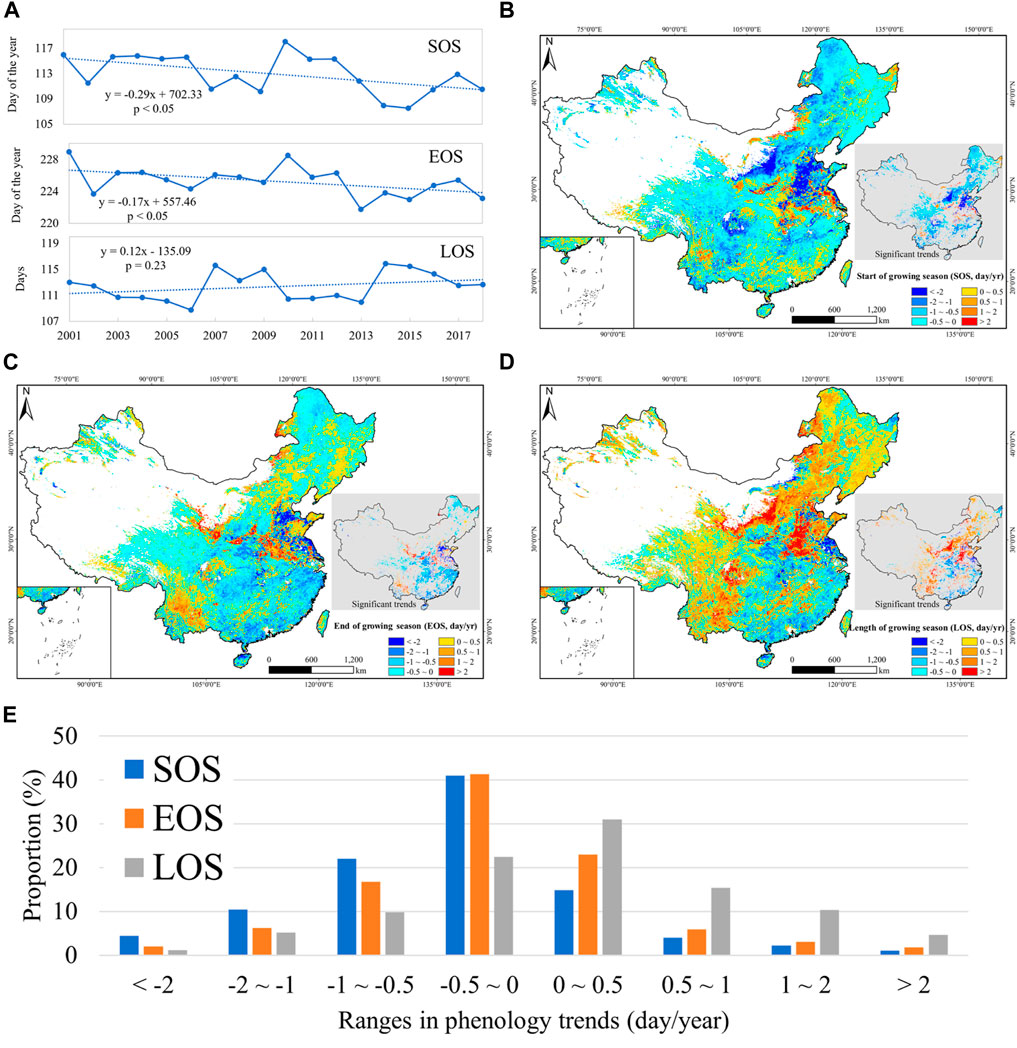
Figure 3. Temporal (A) and spatial (B–D) variations in vegetation phenology across China, (B) spring phenology (SOS), (C) autumn phenology (EOS) and (D) length of growing season (LOS) in vegetation from 2001 to 2018. In addition, (E) displays the proportion of ranges in phenology trends during the study period.
Corresponding to the temporal characteristics of autumn phenology (Figure 3A), vegetation in most regions of China exhibited an advanced EOS during the study period (Figure 3C). Significantly advanced EOSs were mainly distributed in the Tibetan Plateau, central China and the Greater Khingan Mountains. In addition, a small amount of vegetation showed delayed autumn phenology (Figure 3E), which was scattered in the Yungui Plateau, south of the Loess Plateau and the margin of the North China Plain. Significant variations in LOS were identified in eastern China, with substantial extension in northern and southwestern China and significant shortening in central and southern China (Figure 3D).
3.2 Relationships between phenology and drought index
The impacts of drought on vegetation phenology were explored by MCC, examining the relationship between vegetation phenology and PDSI with multiple timescales (Figure 4). A negative MCC between PDSI and SOS was found in most regions of China, occupying approximately 62% of the country. In contrast, positive MCC between PDSI and SOS were mainly distributed in the Tibetan Plateau, the North China Plain, central China, and the Changbai Mountains, which dominated only approximately 38% of grid cells (Figures 4A, D). The results demonstrated that droughts delayed spring phenology in most regions of China, especially in the Loess Plateau and southwest China. Nevertheless, the positive MCC between the SOS and PDSI indicated that wet weather might obstruct spring phenology in the Tibetan Plateau, the North China Plain, and the Changbai Mountains.
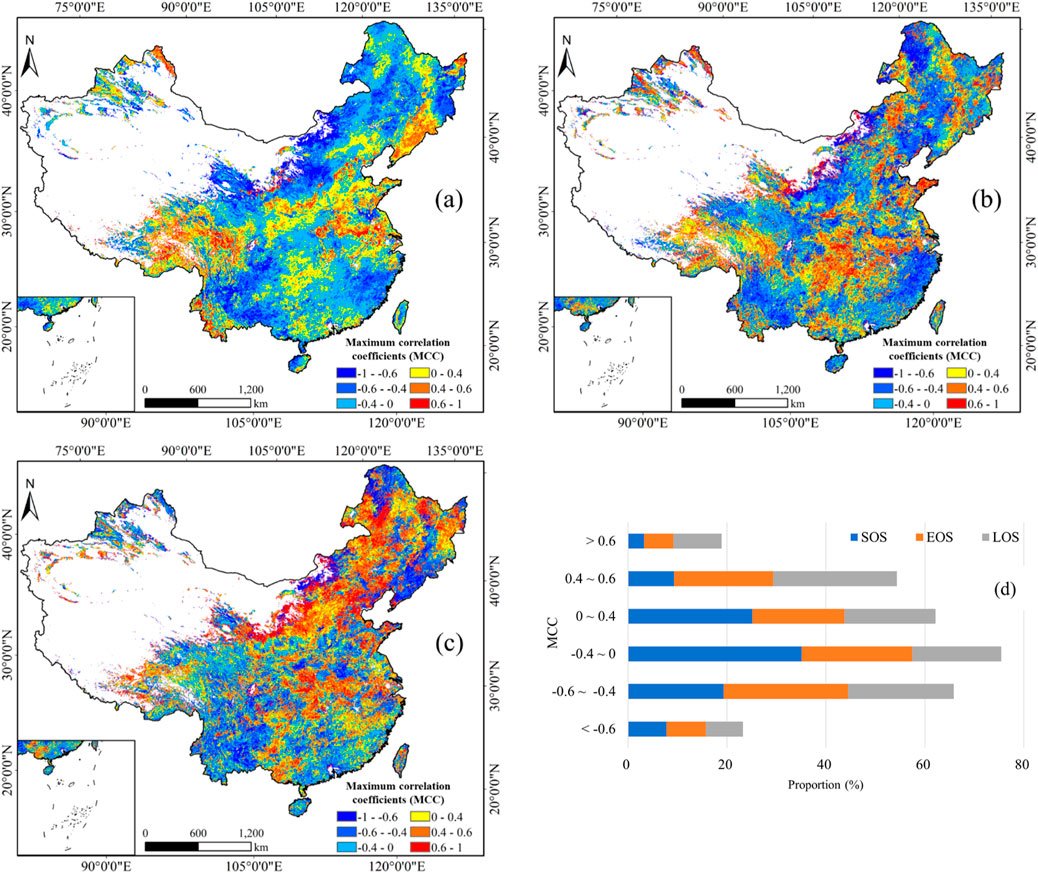
Figure 4. Maximum Pearson correlation coefficients (MCC) between vegetation phenology and PDSI at multiple timescales. MCC between (A) spring phenology (SOS), (B) autumn phenology (EOS) and (C) length of the growing season (LOS) and PDSI. (D) Displays the proportional area dominated by different ranges of MCC.
The MCC between the EOS and PDSI (Figure 4B) exhibited similar spatial characteristics to Figure 4A. Most of the positive MCC values were mainly distributed in the Tibetan Plateau, central China, the North China Plain and the Changbai Mountains, which occupied approximately 44% of grid cells. A negative MCC between the EOS and PDSI was found to be distributed in the Loess Plateau, the Northeast China Plain, the Yungui Plateau, and the southeast coastal regions. The MCC values of most vegetation in northeast China and the Loess Plateau were positive (approximately 53% of the whole country), indicating that droughts shortened the length of the growing season of vegetation in these regions, as shown in Figure 4C. In addition, the negative MCC values were distributed in the Yungui Plateau and the Changbai Mountains, demonstrating that droughts contributed to the extension of LOS.
3.3 Attribution of shifts in vegetation phenology to climatic factors
The critical impacts of three climate factors (Tmin, Tmax and precipitation) on the SOS based on the PLSR VIP are depicted in Figure 5. Approximately 57% of the pixels displayed greater-than-0.8 VIP scores and negative MC, mainly spread over China (Figure 5A), indicating that nocturnal warming promotes advanced SOS. Conversely, pixels with greater-than-0.8 VIP and negative MC were primarily distributed in northeast and southwest China, demonstrating that nocturnal warming inhibits advanced SOS. For Tmax, both positive MC and greater-than-0.8 VIP scores dominated approximately 41.6% of the study area, mainly spread in Southwest and North China (Figure 5B). In addition, pixels with negative MC and greater-than-0.8 VIP occupied 50% of the study region, mainly distributed in the central to the southeast coast of China, the Greater Khingan Mountains and Changbai Mountains. Pixels with greater-than-0.8 VIP and positive MC for precipitation were approximately 37.1%, mainly spread over the south coast of China, the Greater Khingan Mountains and Changbai Mountains. In addition, about 43.7% of the study region was dominated by negative MC and greater-than-0.8 VIP, distributed in southwest and northeast China and parts of the Tibetan Plateau.
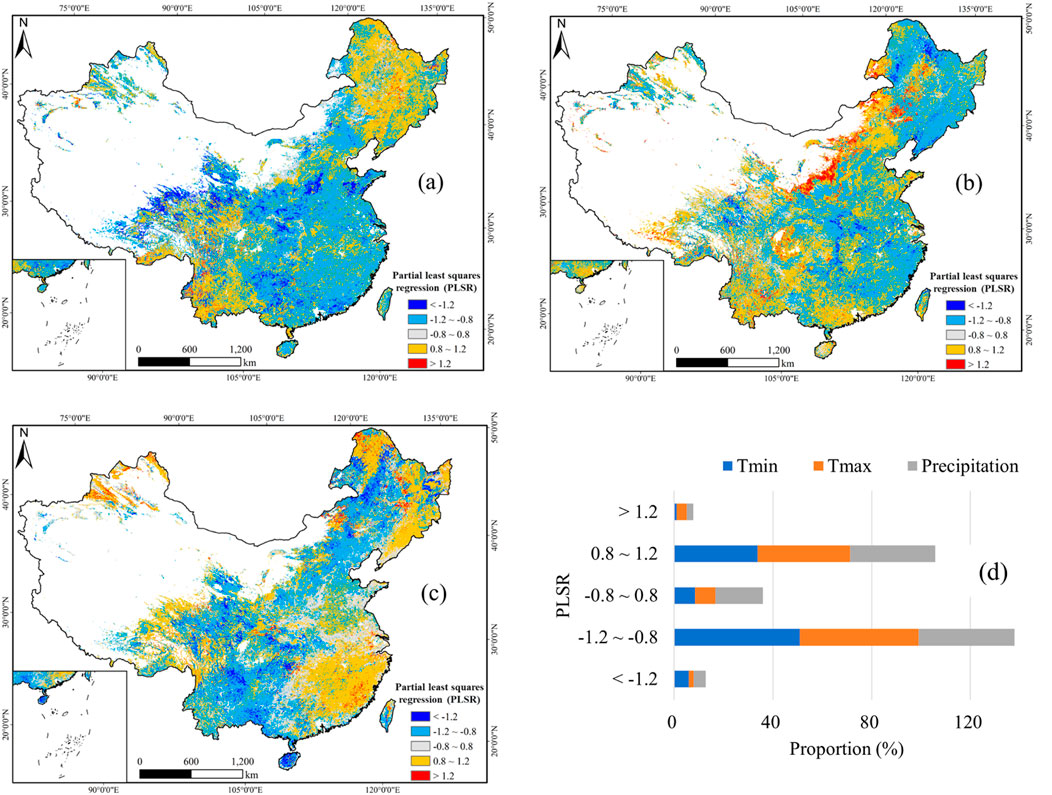
Figure 5. Spatial distributions of the partial least squares regression (PLSR) and variable importance projection (VIP) scores of monthly (A) minimum temperature (Tmin), (B) maximum temperature (Tmax) and (C) precipitation on the SOS. (D) Is the proportion of different VIP scores for various climate factors impacting the SOS.
The effects of climate factors on the EOS were significantly different from those on the SOS (Figure 6). Figure 6A shows that approximately 61.3% of pixels displayed both positive MC and VIP values greater than 0.8, indicating positive effects of nocturnal warming on the delayed EOS. In addition, pixels with both negative MC and greater-than-0.8 VIP represented approximately 32.4% and were mainly distributed in the Greater Khingan Mountains and the Tibetan Plateau, demonstrating the inhibitory effect of nocturnal warming on delayed EOS. Pixels with both positive MC and greater-than-0.8 VIP for Tmax represented approximately 60.6% (Figure 6B) and were mainly distributed in the Loess Plateau and northeast China, whereas the proportion with both negative MC and greater-than-0.8 VIP was approximately 35.5%. For precipitation, about 56.8% of pixels showed greater than 0.8 VIP scores. For these pixels, approximately 33.1% displayed a negative MC, while 66.9% exhibited a positive MC. In addition, pixels with positive MCs were mainly distributed in the Loess Plateau, the Tibetan Plateau, the North China Plain and Southwest China.
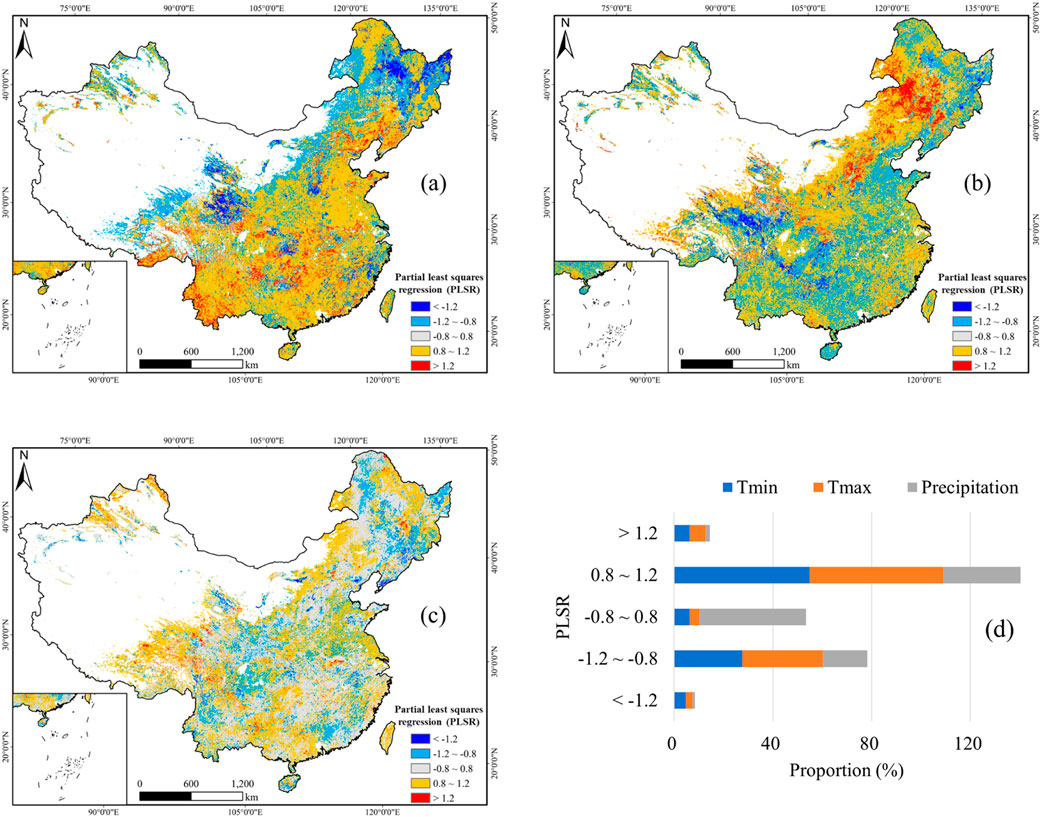
Figure 6. Spatial distributions of the partial least squares regression (PLSR) and variable importance projection (VIP) scores of monthly (A) minimum temperature (Tmin), (B) maximum temperature (Tmax) and (C) precipitation on the EOS. (D) Is the proportion of different VIP scores for various climate factors impacting the EOS.
Similar to the effects of Tmin on EOS (Figure 6A), approximately 60% of the study area displayed both positive MC and greater-than-0.8 VIP for Tmin on LOS (Figure 7A), indicating that nocturnal warming promotes extended LOS. In addition, pixels of both negative MC and greater-than-0.8 VIP were mainly distributed in the Northeast China Plain and the Tibetan Plateau, demonstrating that nocturnal warming inhibits extended LOS. Pixels with both positive MC and greater-than-0.8 VIP for Tmax occupied approximately 60.6% of the country, spread over most of China except the Tibetan Plateau (Figure 7B). Pixels with both negative MC and greater-than-0.8 VIP in Figure 7B demonstrate the inhibitory effect of daytime warming on LOS in the Tibetan Plateau. Approximately 61.8% of the study area showed greater-than-0.8 VIP scores which were distributed over most of China except for southeast China, illustrating the essential role of rain on LOS. For these pixels, 50.2% displayed negative MC, occurring mainly in northeast China and the Tibetan Plateau. In addition, approximately 49.8% of these pixels showed positive MC, distributed in the Loess Plateau and the Yungui Plateau, demonstrating the impact of increased precipitation on extending the LOS (Figures 7C, D).
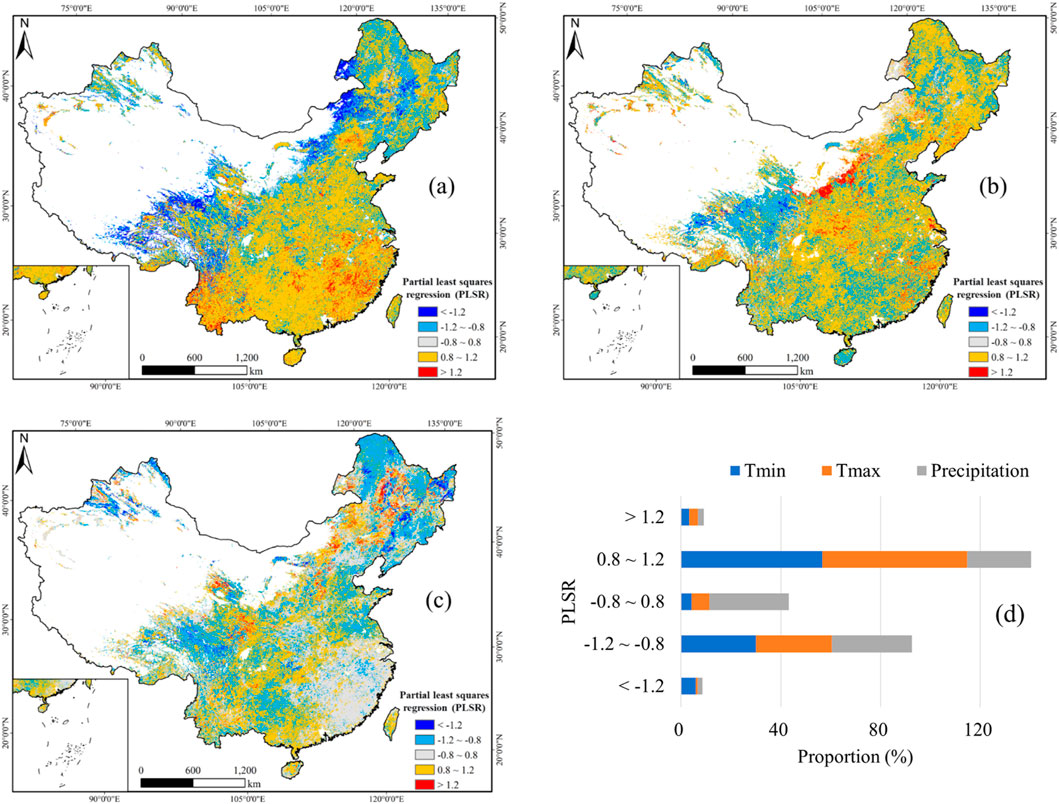
Figure 7. Spatial distributions of the partial least squares regression (PLSR) and variable importance projection (VIP) scores of monthly (A) minimum temperature (Tmin), (B) maximum temperature (Tmax) and (C) precipitation on LOS. (D) Is the proportion of different VIP scores for various climate factors impacting the LOS.
4 Discussion
The variability in precipitation and temperature induced by climate change has been proven to be the primary regulator of vegetation phenology in the Northern Hemisphere ecosystem (An et al., 2020; Li et al., 2018; Liu et al., 2016). Although much work has been carried out to explore the impacts of climatic factors on phenological shifts (Li et al., 2018; Shen et al., 2011), less attention has been given to the effect of warming-induced drought on phenology and the driving factors. Therefore, in this study, spatial responses of vegetation phenology to droughts were investigated using MCC between phenological metrics and preseason PDSI with multiple timescales. In addition, particular attention was devoted to the effects of preseason climatic factors on phenology using the PLSR method.
SOS was significantly advanced from 2001 to 2018 despite the overall dry conditions in China, especially in temperate China and the Tibetan Plateau, which was consistent with previous studies (Wang et al., 2017a; Wang et al., 2017b). Due to the strong interaction between spring and autumn phenology (Appendix A, Supplementary Figure S1; Liu et al., 2016), the overall EOS trend in China from 2001 to 2018 was significant advancement instead of delay.
4.1 Responses of phenology to drought
Dry conditions inhibited the onset of spring phenology in most areas of China, especially in semiarid and arid regions such as the Loess Plateau and Inner Mongolia. In contrast, the Changbai Mountains and the Qinling Mountains are dominated by massive forests, which are tolerant to dry conditions, thus resulting in low sensitivity of spring phenology to drought (Zhang et al., 2017). In addition, the lower reaches of the Yellow River are important wheat planting areas in China, where artificial irrigation is common. Moreover, mountains in the Yungui Plateau and Tibetan Plateau are mainly covered by snowpack and frozen soil, which can supply soil moisture (Zhang et al., 2017). Hence, plant phenology in these regions is insensitive to droughts.
Preseason nocturnal warming (Tmin) contributes to the increase in growing degree days (GDDs), thus triggering an advancement in spring phenology in most regions of China (Shen et al., 2018). Consistent with previous studies (Piao et al., 2015; Shen et al., 2018), increased preseason Tmax contributes to leaf onset in most parts of the country. Nevertheless, in semiarid and arid areas, the increase in preseason Tmax may cause droughts due to insufficient precipitation, leading to delayed spring phenology (Wang et al., 2019). In addition, the increase in daytime temperature contributes more to GDD than the increase in nocturnal temperature (Piao et al., 2015). Therefore, the interaction between lower preseason Tmin with higher Tmax in northeast and southwest China resulted in an advanced SOS, leading to both negative model coefficients and greater-than-0.8 VIP scores for Tmin in these regions. Preseason precipitation is an essential driving factor for advanced SOS in most parts of China, especially for temperate grass, alpine plants, and vegetation in drought-prone areas (e.g., the Yungui Plateau). Conversely, as explained above, the type of vegetation in parts of the northeast, tropical China and the Tibetan Plateau has high tolerance to droughts because of the massive forest or snowpack cover and frozen soil. Hence, lower preseason precipitation combined with higher preseason Tmax during the study period still triggered advanced SOS, resulting in both negative model coefficients and greater-than-0.8 VIP scores for precipitation in these regions.
Preseason water scarcity induced by droughts can accelerate leaf senescence, thereby advancing the EOS, especially in arid regions and areas that are susceptible to drought. Change in leaf color is mainly induced by nocturnal chilling (Tang et al., 2016). In addition, nocturnal warming can reduce frost damage to plants (Todisco and Vergni, 2008). Thus, the higher preseason nocturnal temperature contributed to the extension of the EOS in most regions of China. An increase in Tmax accelerates vegetation photosynthesis as the temperature in autumn drops, thus resulting in a positive correlation between EOS and Tmax (Wang et al., 2019), especially in northeastern China. In contrast, for grass or areas where autumn temperature drops slowly, the increase in daytime temperature may increase drought stress on vegetation, leading to an advanced EOS.
The overall trend of the LOS exhibited a nonsignificant change from 2001 to 2018 because of the strong interaction between the SOS and EOS. Similarly, the increases in preseason Tmin and Tmax in most regions of China both contributed to the extended LOS. Preseason precipitation in arid areas can extend the LOS, yet the vegetation in the Tibetan Plateau or forests still exhibited extended LOS despite the lack of rainfall because of the forest vegetation’s insensitivity to water scarcity or because of the external water supply available from frozen soil or snow.
4.2 Uncertainties and limitations
Diverse responses of vegetation phenology to droughts in China showed prominent spatial heterogeneity, consistent with previous studies (Ding et al., 2020; Zhang et al., 2017). Hence, the findings of this study are essential for mitigating droughts induced by climate change and improving ecosystem management. However, uncertainties remain in this study. First, several uncertainties may come from the satellite-derived phenological dataset due to several factors, such as sensors, viewing geometries, retrieval algorithms, length of time series, and vegetation types (White et al., 2009). In particular, the quality of detected NDVI values may be affected by massive snow cover in the Tibetan Plateau, leading to inaccurate results of vegetation phenology. In addition, as reported by Gray et al. (2019), there were limitations in the MCD12Q2 product that was applied in this study, such as early/late SOS in some high-latitude areas and low EVI variations in semiarid regions, which may also lead to uncertainties in this study.
Additionally, in this study, we only analyzed the impacts of droughts and three climatic factors (Tmin, Tmax and precipitation) on vegetation phenology. Nevertheless, there are other important factors that play roles in regulating vegetation phenology, such as photoperiod, CO2 fertilization, N deposition, human activities (e.g., farming, fertilization, grazing), other natural disasters (e.g., freeze‒thaw processes), and their combined effects (Bao et al., 2019; Li et al., 2018). Hence, further work is needed to quantitatively evaluate their effects on plant phenology, as well as the internal mechanisms.
5 Conclusion
In this study, the spatial responses of plant phenology to drought as well as their driving factors were evaluated across China. Noteworthy advancement was observed in the SOS and EOS across China, while spatially heterogeneous trends were detected in the LOS. Droughts inhibited earlier onset or delayed senescence in most regions of China. Droughts shortened the LOS in areas where vegetation is sensitive to drought because of the strong interaction between the SOS and EOS, particularly in temperate China. Preseason nocturnal warming induced earlier onset and delayed senescence and extended LOS across China. In addition, the increase in preseason Tmax contributed to an advanced SOS and extended LOS in most regions of China, whereas it accounted for a delayed EOS in temperate China. Moreover, preseason precipitation promoted an advanced SOS, delayed EOS and extended LOS in northern China and areas susceptible to drought.
Data availability statement
The raw data supporting the conclusions of this article will be made available by the authors, without undue reservation.
Author contributions
HD: Conceptualization, Data curation, Funding acquisition, Investigation, Writing–original draft, Writing–review and editing. WG: Conceptualization, Formal Analysis, Funding acquisition, Methodology, Validation, Visualization, Writing–review and editing, Writing–original draft. CW: Investigation, Methodology, Visualization, Writing–original draft. XL: Data curation, Validation, Visualization, Writing–original draft.
Funding
The author(s) declare that financial support was received for the research, authorship, and/or publication of this article. This research was jointly funded by the National Natural Science Foundation of China (42007063, U2243213), Space Technologies For Sustainable Development Goals International Partnership Program Of The Chinese Academy Of Sciences For Big Science. Grant No.313GJHZ2022040BS and Chinese Academy of Sciences (161461KYSB20200001).
Acknowledgments
The authors thank the National Aeronautics and Space Administration (NASA) and the Climatology Lab for providing the dataset.
Conflict of interest
The authors declare that the research was conducted in the absence of any commercial or financial relationships that could be construed as a potential conflict of interest.
Publisher’s note
All claims expressed in this article are solely those of the authors and do not necessarily represent those of their affiliated organizations, or those of the publisher, the editors and the reviewers. Any product that may be evaluated in this article, or claim that may be made by its manufacturer, is not guaranteed or endorsed by the publisher.
Supplementary material
The Supplementary Material for this article can be found online at: https://www.frontiersin.org/articles/10.3389/feart.2024.1454928/full#supplementary-material
References
Abatzoglou, J. T., Dobrowski, S. Z., Parks, S. A., and Hegewisch, K. C. (2018). TerraClimate, a high-resolution global dataset of monthly climate and climatic water balance from 1958–2015. Sci. data 5, 1–12. doi:10.1038/sdata.2017.191
An, S., Chen, X., Zhang, X., Lang, W., Ren, S., and Xu, L. (2020). Precipitation and minimum temperature are primary climatic controls of alpine grassland autumn phenology on the qinghai-tibet plateau. Remote Sens. 12, 431. doi:10.3390/rs12030431
Bao, G., Chen, J., Chopping, M., Bao, Y., Bayarsaikhan, S., Dorjsuren, A., et al. (2019). Dynamics of net primary productivity on the Mongolian Plateau: joint regulations of phenology and drought. Int. J. Appl. Earth Observation Geoinformation 81, 85–97. doi:10.1016/j.jag.2019.05.009
Barriopedro, D., Gouveia, C. M., Trigo, R. M., and Wang, L. (2012). The 2009/10 drought in China: possible causes and impacts on vegetation. J. Hydrometeorol. 13, 1251–1267. doi:10.1175/jhm-d-11-074.1
Busico, G., Kazakis, N., Cuoco, E., Colombani, N., Tedesco, D., Voudouris, K., et al. (2020). A novel hybrid method of specific vulnerability to anthropogenic pollution using multivariate statistical and regression analyses. Water Res. 171, 115386. doi:10.1016/j.watres.2019.115386
Cook, B. I., Mankin, J. S., and Anchukaitis, K. J. (2018). Climate change and drought: from past to future. Curr. Clim. Change Rep. 4, 164–179. doi:10.1007/s40641-018-0093-2
Crimaldi, M., and Lama, G. F. C. (2021). “Impacts of riparian plants biomass assessed by UAV-acquired multispectral images on the hydrodynamics of vegetated streams,” in In proceedings of the 29th European biomass conference and exhibition. Marseille, France, 1157–1161.
Cui, T., Martz, L., and Guo, X. (2017). Grassland phenology response to drought in the Canadian prairies. Remote Sens. 9, 1258. doi:10.3390/rs9121258
Detges, A. (2016). Local conditions of drought-related violence in sub-Saharan Africa: the role of road and water infrastructures. J. Peace Res. 53, 696–710. doi:10.1177/0022343316651922
Ding, Y., Xu, J., Wang, X., Peng, X., and Cai, H. (2020). Spatial and temporal effects of drought on Chinese vegetation under different coverage levels. Sci. Total Environ. 716, 137166. doi:10.1016/j.scitotenv.2020.137166
Geladi, P., and Kowalski, B. R. (1986). Partial least-squares regression: a tutorial. Anal. Chim. acta 185, 1–17. doi:10.1016/0003-2670(86)80028-9
Gray, J., Sulla-Menashe, D., and Friedl, M. A. (2019). User guide to collection 6 MODIS land cover dynamics (MCD12Q2) product. NASA EOSDIS Land Process. DAAC.
Guo, L., Cheng, J., Luedeling, E., Koerner, S. E., He, J. S., Xu, J., et al. (2017). Critical climate periods for grassland productivity on China’s Loess Plateau. Agric. For. Meteorology 233, 101–109. doi:10.1016/j.agrformet.2016.11.006
Guo, M., Wu, C., Peng, J., Lu, L., and Li, S. (2021). Identifying contributions of climatic and atmospheric changes to autumn phenology over mid-high latitudes of Northern Hemisphere. Glob. Planet. Change 197, 103396. doi:10.1016/j.gloplacha.2020.103396
Heim, R. R. (2002). A review of twentieth-century drought indices used in the United States. Bull. Am. Meteorological Soc. 83, 1149–1166. doi:10.1175/1520-0477-83.8.1149
Kang, W., Wang, T., and Liu, S. (2018). The Response of vegetation phenology and productivity to drought in semi-arid regions of Northern China. Remote Sens. 10, 727. doi:10.3390/rs10050727
Klisch, A., and Atzberger, C. (2016). Operational drought monitoring in Kenya using MODIS NDVI time series. Remote Sens. 8, 267. doi:10.3390/rs8040267
Lama, G. F. C., and Crimaldi, M. (2021). “Assessing the role of gap fraction on the leaf area index (LAI) estimations of riparian vegetation based on fisheye lenses,” in In proceedings of the 29th European biomass conference and exhibition. Marseille, France, 1172–1176.
Lama, G. F. C., Giovannini, M. R. M., Errico, A., Mirzaei, S., Chirico, G. B., and Preti, F. (2021). “The impacts of Nature Based Solutions (NBS) on vegetated flows’ dynamics in urban areas,” in 2021 IEEE international workshop on metrology for agriculture and forestry (MetroAgriFor), Trento-Bolzano, Italy, 03-05 November 2021, (IEEE), 58–63.
Lense, G. H. E., Lämmle, L., Ayer, J. E. B., Lama, G. F. C., Rubira, F. G., and Mincato, R. L. (2023). Modeling of soil loss by water erosion and its impacts on the cantareira system, Brazil. Water 15, 1490. doi:10.3390/w15081490
Li, K., Tong, Z., Liu, X., Zhang, J., and Tong, S. (2020). Quantitative assessment and driving force analysis of vegetation drought risk to climate change: Methodology and application in Northeast China. Agric. For. Meteorology 282, 107865. doi:10.1016/j.agrformet.2019.107865
Li, P., Peng, C., Wang, M., Luo, Y., Li, M., Zhang, K., et al. (2018). Dynamics of vegetation autumn phenology and its response to multiple environmental factors from 1982 to 2012 on Qinghai-Tibetan Plateau in China. Sci. Total Environ. 637, 855–864. doi:10.1016/j.scitotenv.2018.05.031
Liu, Q., Fu, Y. H., Zhu, Z., Liu, Y., Liu, Z., Huang, M., et al. (2016). Delayed autumn phenology in the Northern Hemisphere is related to change in both climate and spring phenology. Glob. change Biol. 22, 3702–3711. doi:10.1111/gcb.13311
Luedeling, E., Guo, L., Dai, J., Leslie, C., and Blanke, M. M. (2013). Differential responses of trees to temperature variation during the chilling and forcing phases. Agric. For. Meteorology 181, 33–42. doi:10.1016/j.agrformet.2013.06.018
Luo, L., Ma, W., Zhuang, Y., Zhang, Y., Yi, S., Xu, J., et al. (2018). The impacts of climate change and human activities on alpine vegetation and permafrost in the Qinghai-Tibet Engineering Corridor. Ecol. Indic. 93, 24–35. doi:10.1016/j.ecolind.2018.04.067
Mao, D., Wang, Z., Luo, L., and Ren, C. (2012). Integrating AVHRR and MODIS data to monitor NDVI changes and their relationships with climatic parameters in Northeast China. Int. J. Appl. Earth Observation Geoinformation 18, 528–536. doi:10.1016/j.jag.2011.10.007
Meng, L., Zhou, Y., Li, X., Asrar, G. R., Mao, J., Wanamaker, A. D., et al. (2020). Divergent responses of spring phenology to daytime and nighttime warming. Agric. For. Meteorology 281, 107832. doi:10.1016/j.agrformet.2019.107832
Piao, S., Liu, Q., Chen, A., Janssens, I. A., Fu, Y., Dai, J., et al. (2019). Plant phenology and global climate change: current progresses and challenges. Glob. Change Biol. 25, 1922–1940. doi:10.1111/gcb.14619
Piao, S., Tan, J., Chen, A., Fu, Y. H., Ciais, P., Liu, Q., et al. (2015). Leaf onset in the northern hemisphere triggered by daytime temperature. Nat. Commun. 6, 6911–6918. doi:10.1038/ncomms7911
Qiao, L., Xia, H., Zhao, X., Yang, J., Song, H., and Liu, Y. (2024). Divergent impacts of drought on autumn phenology in China. Ecol. Indic. 160, 111770. doi:10.1016/j.ecolind.2024.111770
Richardson, A. D., Keenan, T. F., Migliavacca, M., Ryu, Y., Sonnentag, O., and Toomey, M. (2013). Climate change, phenology, and phenological control of vegetation feedbacks to the climate system. Agric. For. Meteorology 169, 156–173. doi:10.1016/j.agrformet.2012.09.012
Shen, M., Tang, Y., Chen, J., Zhu, X., and Zheng, Y. (2011). Influences of temperature and precipitation before the growing season on spring phenology in grasslands of the central and eastern Qinghai-Tibetan Plateau. Agric. For. Meteorology 151, 1711–1722. doi:10.1016/j.agrformet.2011.07.003
Shen, M., Zhang, G., Cong, N., Wang, S., Kong, W., and Piao, S. (2014). Increasing altitudinal gradient of spring vegetation phenology during the last decade on the Qinghai–Tibetan Plateau. Agric. For. Meteorology 189, 71–80. doi:10.1016/j.agrformet.2014.01.003
Shen, X., Liu, B., Henderson, M., Wang, L., Wu, Z., Wu, H., et al. (2018). Asymmetric effects of daytime and nighttime warming on spring phenology in the temperate grasslands of China. Agric. For. Meteorology 259, 240–249. doi:10.1016/j.agrformet.2018.05.006
Son, N. T., Chen, C., Chen, C., Chang, L., and Minh, V. (2012). Monitoring agricultural drought in the Lower Mekong Basin using MODIS NDVI and land surface temperature data. Int. J. Appl. earth observation geoinformation 18, 417–427. doi:10.1016/j.jag.2012.03.014
Tang, J., Körner, C., Muraoka, H., Piao, S., Shen, M., Thackeray, S. J., et al. (2016). Emerging opportunities and challenges in phenology: a review. Ecosphere 7. doi:10.1002/ecs2.1436
Todisco, F., and Vergni, L. (2008). Climatic changes in Central Italy and their potential effects on corn water consumption. Agric. For. Meteorology 148, 1–11. doi:10.1016/j.agrformet.2007.08.014
Vicente-Serrano, S. M., Cabello, D., Tomás-Burguera, M., Martín-Hernández, N., Beguería, S., Azorin-Molina, C., et al. (2015). Drought variability and land degradation in semiarid regions: assessment using remote sensing data and drought indices (1982–2011). Remote Sens. 7, 4391–4423. doi:10.3390/rs70404391
Wang, H., Lin, H., and Liu, D. (2014). Remotely sensed drought index and its responses to meteorological drought in Southwest China. Remote Sens. Lett. 5, 413–422. doi:10.1080/2150704x.2014.912768
Wang, S., Wang, X., Chen, G., Yang, Q., Wang, B., Ma, Y., et al. (2017a). Complex responses of spring alpine vegetation phenology to snow cover dynamics over the Tibetan Plateau, China. Sci. Total Environ. 593, 449–461. doi:10.1016/j.scitotenv.2017.03.187
Wang, S., Zhang, B., Yang, Q., Chen, G., Yang, B., Lu, L., et al. (2017b). Responses of net primary productivity to phenological dynamics in the Tibetan Plateau, China. Agric. For. Meteorology 232, 235–246. doi:10.1016/j.agrformet.2016.08.020
Wang, Y., Luo, Y., and Shafeeque, M. (2019). Interpretation of vegetation phenology changes using daytime and night-time temperatures across the Yellow River Basin, China. Sci. Total Environ. 693, 133553. doi:10.1016/j.scitotenv.2019.07.359
Wang, Z., Li, J., Lai, C., Zeng, Z., Zhong, R., Chen, X., et al. (2017c). Does drought in China show a significant decreasing trend from 1961 to 2009? Sci. Total Environ. 579, 314–324. doi:10.1016/j.scitotenv.2016.11.098
White, M. A., de Beurs, K. M., Didan, K., Inouye, D. W., Richardson, A. D., Jensen, O. P., et al. (2009). Intercomparison, interpretation, and assessment of spring phenology in North America estimated from remote sensing for 1982–2006. Glob. change Biol. 15, 2335–2359. doi:10.1111/j.1365-2486.2009.01910.x
Wu, C., Peng, J., Ciais, P., Peñuelas, J., Wang, H., Beguería, S., et al. (2022). Increased drought effects on the phenology of autumn leaf senescence. Nat. Clim. Change 12, 943–949. doi:10.1038/s41558-022-01464-9
Xu, K., Yang, D., Yang, H., Li, Z., Qin, Y., and Shen, Y. (2015). Spatio-temporal variation of drought in China during 1961–2012: a climatic perspective. J. Hydrology 526, 253–264. doi:10.1016/j.jhydrol.2014.09.047
Yuan, M., Zhao, L., Lin, A., Wang, L., Li, Q., She, D., et al. (2020). Impacts of preseason drought on vegetation spring phenology across the Northeast China Transect. Sci. Total Environ. 738, 140297. doi:10.1016/j.scitotenv.2020.140297
Zhang, Q., Kong, D., Shi, P., Singh, V. P., and Sun, P. (2018). Vegetation phenology on the Qinghai-Tibetan Plateau and its response to climate change (1982–2013). Agric. For. Meteorology 248, 408–417. doi:10.1016/j.agrformet.2017.10.026
Zhang, Q., Kong, D., Singh, V. P., and Shi, P. (2017). Response of vegetation to different time-scales drought across China: spatiotemporal patterns, causes and implications. Glob. Planet. Change 152, 1–11. doi:10.1016/j.gloplacha.2017.02.008
Zhang, S., Wu, Y., Sivakumar, B., Mu, X., Zhao, F., Sun, P., et al. (2019). Climate change-induced drought evolution over the past 50 years in the southern Chinese Loess Plateau. Environ. Model. and Softw. 122, 104519. doi:10.1016/j.envsoft.2019.104519
Keywords: vegetation phenology, drought, PDSI, climate factors, China
Citation: Ding H, Ge W, Wang C and Li X (2024) Evaluation of the spatial responses in vegetation phenology to drought and the analysis of their driving factors in China. Front. Earth Sci. 12:1454928. doi: 10.3389/feart.2024.1454928
Received: 26 June 2024; Accepted: 15 October 2024;
Published: 25 October 2024.
Edited by:
Patrick G. Hatcher, Old Dominion University, United StatesReviewed by:
Giuseppe Francesco Cesare Lama, University of Naples Federico II, ItalyQin Ma, Nanjing Normal University, China
Copyright © 2024 Ding, Ge, Wang and Li. This is an open-access article distributed under the terms of the Creative Commons Attribution License (CC BY). The use, distribution or reproduction in other forums is permitted, provided the original author(s) and the copyright owner(s) are credited and that the original publication in this journal is cited, in accordance with accepted academic practice. No use, distribution or reproduction is permitted which does not comply with these terms.
*Correspondence: Wenyan Ge, Z2V3ZW55YW5AbndhZnUuZWR1LmNu
 Haifeng Ding
 Wenyan Ge
 Cuicui Wang
 Xiuxia Li6