- 1School of Earth Sciences, Yunnan University, Kunming, China
- 2Yunnan Earthquake Agency, Kunming School of Earth Sciences, Yunnan University, Kunming, China
- 3Kunming Institute of Earthquake Prediction, China Earthquake Administration, Kunming, China
- 4Key Laboratory of Sanjiang Metallogeny and Resources Exploration and Utilization, MNR, Kunming, China
- 5School of Earth and Space, Peking University, Beijing, China
The Ms 5.5 earthquake struck on 24 October 2023, in Subei County, Gansu Province, China, occurring along the eastern segment of the Altyn Tagh fault. It raises the question of whether this earthquake is linked to the ongoing shortening slip rate along this segment or triggered by other seismic events. Analyzing the fault geometry of the Subei earthquake and understanding the significance of the weakening activity rate for seismic hazards in neighboring regions is crucial. The surface deformation from small- and medium-sized earthquakes (magnitudes less than Mw5.5) is often subtle, and the coseismic deformation detected by interferometric synthetic aperture radar (InSAR) is vulnerable to atmospheric disturbances, leading to significant measurement errors. Moreover, inaccuracies in the regional crustal velocity structure can cause errors in earthquake localization based on seismic data. These challenges complicate the establishment of a rupture model for seismogenic faults and hinder the inversion of fault slip models. To overcome these limitations, we employed the time-series InSAR stacking method and aftershock relocation to determine the fault geometry of the Subei earthquake. A two-step inversion method was utilized to ascertain both the fault geometry and slip distribution. Our modeling indicates that the 2023 Subei earthquake had a thrust mechanism with a component of strike-slip. The rupture did not reach the surface, with the maximum fault slip measuring 0.45 m at a depth of 2.5–3.5 km. The fault dips westward, and the moment magnitude is calculated at 5.4. This earthquake is associated with the ongoing weakening of the left-lateral strike-slip rupture along the Altyn Tagh fault in the Subei region. Furthermore, retrograde thrust tectonics significantly contribute to the absorption of accumulated stress during this process.Our findings highlight the potential of utilizing time-series InSAR images to enhance earthquake catalogs with geodetic observations, offering valuable data for further studies of the earthquake cycle and active tectonics. This approach is also applicable in other tectonically active regions, enhancing understanding of seismic hazards and risk assessment.
1 Introduction
According to the China Earthquake Network Center (CENC), a Ms5.5 earthquake occurred on 24 October 2023, in Subei County, Gansu Province, with epicenter coordinates of latitude 39.43°N and longitude 97.275°E and a focal depth of 10 km (Figure 1). The epicenter was located in Shibao Township, Subei County, 119 km away from Shibao Township, 51 km away from Laojunmiao Town in Yumen City, 94 km away from Jiayuguan City, 98 km away from Yumen City, and 109 km away from Jiuquan City. According to reports, the earthquake was strongly felt in Jiayuguan City, Suzhou District of Jiuquan City, Dunhuang City, Guazhou County, Ganzhou District of Zhangye City, and Gaotai County. No casualties or property damage have been reported at this time. The Subei seismic region is located in the western part of the Qilian Mountains seismic zone. Due to regional geotectonic complexity, studies have shown that the slip rate of the eastern section of the Altyn Tagh fault in the Subei area has decreased (Xu et al., 2003). This has led to the formation of the Tanghe Nan Shan, Daxueshan, Qilian Mountains, and other northwest-trending mountain blocks, as well as the development of several retrograde thrust tectonics. Due to the continuous absorption of the northward movement of the Indian plate by the Altyn Tagh fault and the subsequent accommodation of the absorbed slip rate by northwesterly active reverse faults, the study area has experienced frequent earthquakes in the past 50 years. Since seismic records began in 1900, there has been one earthquake of magnitude 7.0–7.9, six earthquakes of magnitude 6.0–6.9, and 23 earthquakes of magnitude 5.0–5.9. During the past 50 years the largest earthquake within 100 km of the Subei epicenter was a magnitude 6.0 event that occurred in Delingha, Qinghai, on 26 March 2022, located 89 km from the current epicenter. Following the earthquake, relevant agencies promptly utilized seismic wave data to determine the focal mechanism solution for the Subei earthquake (Table 1). These results essentially represent measurements of the fault slip behavior at the seismic source. However, there is a certain degree of variability in focal mechanism solutions, posing challenges for making decisions in further establishing earthquake fault models and conducting seismic dynamic analyses. Therefore, further study of the seismic fault characteristics causing the Subei earthquake and exploration of the significance of the weakening activity rate in the eastern segment of the Altyn Tagh fault for seismic hazards in neighboring regions are crucial.
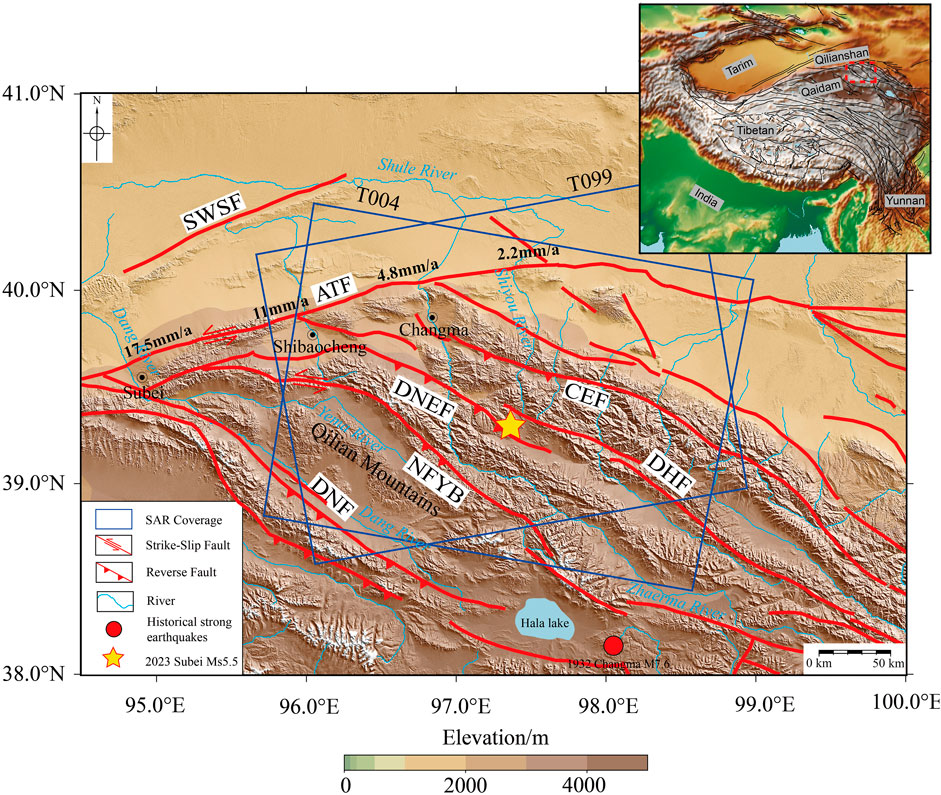
Figure 1. Regional tectonic context of the 2023 Subei earthquake. The red dashed box in the upper right panel indicates the extent of the study area; the red solid line indicates active faults; the blue box indicates the coverage of InSAR data; the red solid circles represent the distribution of earthquakes epicenters with historical M >5.0 within the extent of the study area; and the source-mechanism solved spheres in the lower right panel are the results of measurements made by different agencies, and the colors represent the depth of the source of the earthquakes. The faults are referred to Deng et al., 2003 (ATF: Altyn Tagh Fault; DNEF: Daxueshan Northern Edge Fault; CEF:Changma-Ebo Fault; DHF: Dashuiban-Heidaban Fault; NFYB: Northeast-trending fault of Yemahu Basin; DNF: Danghe Nanshan Fault; SWSF:Sanweishan Fault).

Table 1. Solution of the source mechanism of the 2023 Subei earthquake determined by different organizations.
Accurately determining the geometric parameters of seismogenic faults and understanding their movement characteristics are particularly crucial (Ben-Zion, 2008). Research indicates that underground ruptures are not singular but rather complex rupture surfaces, and the geometric characteristics of individual faults and their interactions with faults control the slip distribution and stress patterns and influence the rupture process (Duan, 2019; Nielsen and Knopoff, 1998). Studying the seismic rupture process and fault displacement direction and magnitude is highly important for guiding Earthquake disaster rescue, postdisaster damage assessments, and research on coseismic landslides (Chen et al., 2023). Current research on earthquake rupture processes primarily involves inverting detailed information about the rupture by analyzing seismic waveforms (Hartzell, 1978). With the advancement of global digital seismic networks and seismic source theories, researchers studying earthquake rupture processes on finite faults utilize local strong motion records and teleseismic record data inversion to obtain information such as the scale of earthquake faults, the direction of seismic rupture, and the distribution of slip on fault planes (Zhang et al., 2014; Yang et al., 2022). However, the former requires densely spaced and well-enclosed strong seismic station records, while the latter requires sufficiently large earthquake magnitudes to ensure clear waveform records in the teleseismic direction. These requirements undoubtedly pose greater demands for studying the rupture modes of small to moderate earthquakes, especially those with moment magnitudes (MW) less than 5.5.
In addition, geodetic data can also be used to infer earthquake rupture processes. Seismic fault models can also be inverted from geodetic data, and the advantage of using geodetic data for earthquake rupture inversion is that less uncertainties are involved, and the inversion results are relatively more stable than those of seismic data inversion (Johnson et al., 1994). Since the 1992 Landers earthquake, interferometric synthetic aperture radar (InSAR) has been widely used in earthquakes and has become an indispensable geodetic tool for the study of coseismic deformation and the inversion of seismic source parameters (Li and Wang, 2023; Luo and Wang, 2022; Liu et al., 2022). As a complement to seismic observation, InSAR imagery provides high-resolution and near-field deformation measurements of the ground surface, which is especially suitable for the deformation of remote seismic zones and sparsely vegetated ground surface areas. However, SAR image interferometry is susceptible to atmospheric influence to some extent, which generates overall deconvolution errors that affect the recovery of the radar line-of-sight (LOS) surface deformation field from the deconvolution of the original interferograms and causes errors in further estimations of the fault-slip distribution. In addition, in the past, when scholars inverted seismic faults, due to the uncertainty of the fault tendency when choosing the seismic source mechanism solution, especially for seismic faults dominated by forward or backlash motion, it was usually difficult to judge the tendency of seismic faults by a single use of InSAR observations. The usual practice is to invert both sets of sections using the solution of the earthquake origin mechanism given by an organization and evaluate the residuals between the observed and simulated values by determining the residuals of the observed and simulated values. In recent years, the use of high-precision small-seismic positioning to determine the fault geometry of rupture zones has been successful in numerous applications, such as using the spatial position of aftershocks to determine fault models, which has become one of the conventional methods for inverting the rupture process of large earthquakes (Ross et al., 2019; Sun et al., 2018; Bagnardi and Hooper, 2018). Then, the joint aftershock fine localization and InSAR surface coseismic deformation field can be used to more accurately determine the geometric characteristics of the originating faults, which can provide a reliable basis for further determining the slip distribution of the originating faults.
Since the occurrence of the Ms5.5 Subei earthquake in 2023, no InSAR studies have been conducted on its seismogenic structure. In this study, we first utilized a time series stacking technique based on European Space Agency (ESA) Sentinel-1A satellite data to form interferograms before and after the earthquake, effectively mitigating atmospheric errors through phase unwrapping and stacking. Second, precise localization of aftershock sequences was performed using fixed seismic station data. We employed small fault plane fitting to characterize the geometric features of the seismogenic fault plane and establish a finite seismogenic fault model. Finally, based on ascending and descending line-of-sight (LOS) downsampled datasets, we inverted the slip distribution of this earthquake and calculated the triggering relationship between the static Coulomb stress change induced by the 2022 Delingha M6.0 earthquake and this earthquake. Through these investigations, we gained a better understanding of the deformation field characteristics caused by the Subei earthquake, the seismogenic fault, and the movement properties of the seismogenic fault, thereby exploring the triggering factors of this earthquake.
2 Tectonic background
Due to the strong northward push of the Indian plate, there is a northeastward motion along the northeastern margin of the Qinghai‒Tibet Plateau (Xu et al., 2003; Xu et al., 2005). The northern and eastern sides of the Qinghai‒Tibet Plateau are also subjected to compression from uplifted blocks, resulting in a series of neotectonic mountain belts and faults (Elliott et al., 2008; Daout et al., 2018). This motion was hindered by the Alashan and Ordos blocks, which formed the Qilian Mountains seismic zone. Consequently, a series of WNW- to nearly E-W-oriented thrust-slip fault zones have developed, exhibiting south-to-north thrusting with steep-upward and gentlownward geometries. Among these zones, the most influential is the Altyn Tagh fault zone. Its sinistral strike-slip movement and adjacent compressional reverse fault-fold interactions absorb the northward movement of the Indian plate (Ding et al., 2008; Zheng et al., 2013). This directly affects the acceleration of crustal strain rates in the surrounding areas, leading to an increase in seismic activity, making this region prone to frequent strong earthquakes.
The study area is located in the eastern segment of the Altyn Tagh fault. Research indicates that its sinistral strike-slip displacement is transferred and absorbed by the North Qilian Shan thrust reverse fault zone, exhibiting geometric features of intersection with the Altyn Tagh fault in the western segment of the Qilian Shan (Liu et al., 2019; Jolivet et al., 2008; Shen et al., 2001; Zhang et al., 2007). These faults, including the Changma fault, the Yema-he-Daxueshan fault, and the Danhe-Nanshan fault, have been intensely active since the late Quaternary (Li et al., 2009; Meyer et al., 1998). They represent the leading edge of the Qinghai‒Tibet Plateau, extend northeastward and serve as a typical tectonic transition zone (Seong et al., 2011; He et al., 2018). The left-lateral slip rates of different segments of the Altyn Tagh fault vary during the Holocene: the central and western segments west of Akesai have left-lateral slip rates of up to 17.5 ± 2 mm/year, those of the Subei-Shibaicheng segment are approximately 11 ± 3.5 mm/year (Zheng et al., 2013), those of the Shule River mouth segment decrease to approximately 4.8 ± 1 mm/year, and those of the Kuangtan Shan segment in the eastern segment are only approximately 2.2 ± 0.2 mm/year (Luo et al., 2013; Zheng et al., 2009). The transition point of the left-lateral slip rate from west to the east of the Altyn Tagh fault is located at the junction of the Subei, Shibaicheng, and Shule River Mouths in the central to eastern segments. This region is also the area where the Subei Ms 5.5 earthquake occurred. The aforementioned tectonic activity provides the seismic background for the occurrence of the Subei earthquake, highlighting the importance of determining seismogenic faults for further understanding (Bendick et al., 2000; Mériaux et al., 2005; Gold et al., 2011; Cowgill et al., 2009).
3 Data and methods
3.1 Time series InSAR data processing
To address the shortcomings of weak surface deformation observed in small- and medium-sized earthquakes and the susceptibility to atmospheric interference, we employ a method of superimposing time-series synthetic aperture radar (SAR) phase maps (Luo et al., 2021). This method operates on the principle that interferometric SAR images contain random atmospheric errors, and by overlaying preseismic and postseismic views, the atmospheric influence can be effectively mitigated, enabling the extraction of surface coseismic deformation at centimeter-level precision. Specifically, we collect 11 and 33 Sentinel-1 SAR satellite images from ascending (AT4) and descending (DT99) tracks, respectively, covering the seismic deformation zone of Surbiton. The SAR images acquired on 2023/09/19 (AT4) and 2023/10/18 (DT99) are selected as reference images, following the principle that if N + M+1 (where N+1 are acquired before and M after the earthquake) SAR images are available around the time of an earthquake, N interferograms excluding coseismic deformation and M interferograms including coseismic deformation can be derived using the same reference image (Figure 2). Basic SAR interferometry data were processed using the Sentinel-1 interferometry processor (https://sarimggeodesy.github.io/software/). The SRTM Data Elevation Model (DEM) from NASA is utilized for alignment and terrain correction, with a resolution of 30 m (Farr et al., 2007). Interferograms are multiviewed in the azimuthal and distance directions at a ratio of four–16, and Goldstein’s method is applied to filter the interferograms to enhance the signal-to-noise ratio (SNR) (Baran et al., 2003). Precision orbital data (POE) obtained from the ESA are employed to correct orbital errors, retaining only the mean orbital error. Data points with an average intercorrelation threshold greater than 0.3 are retained after eliminating orbit errors. The statistical cost network-flow algorithm for phase unwrapping (SNAPHU) is then utilized for the unwrapping process (Costantini and Rosen, 1999), followed by estimating the linear relationship between the linear slope value and elevation. Finally, the output is geocoded. Throughout the study, interferograms with significant decoherence are discarded during processing.
3.2 Relocated sequence
A more precise delineation of the aftershock sequence can be used to effectively characterize the geometry of a seismic fault (Waldhauser and Ellsworth, 2002). The currently widely utilized double-difference localization method has proven effective in obtaining more accurate locations of earthquake sources. At the heart of the double-difference localization method lies the pairing of seismic events based on epicentral distance and the number of phases. This approach leverages the disparity between the observed and theoretical time differences of paired seismic events relative to the same seismic station. This disparity helps mitigate errors stemming from inaccuracies in the velocity model between the source and the station. Moreover, the method employs constraints imposed on both earthquake pairing and isolated localization inversion to infer the relative positions of seismic sources. Through this process, the relative positions of the seismic sources are inverted, resulting in the precise determination of the position of the entire seismic cluster (Shelly et al., 2016).
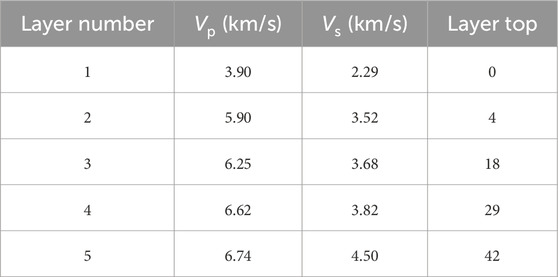
After the Ms 5.5 earthquake in Subei on 24 October 2023, we selected 12 fixed stations with epicentral distances of approximately 200 km, as illustrated in Figure 3. This station distribution provided better coverage of the Subei earthquake and enhanced the constraints on relocation events. We collected P-wave and S-wave data recorded at these stations for the 100 days following the mainshock. The time-dependent P-wave and S-wave data from the aforementioned stations were collected for 100 days after the main earthquake. Our study underscored the significant impact of the accuracy of the velocity model for the seismic source area on the calculation of the conjugate gradients methods (Yao et al., 2023). Therefore, the Crust1.0 crustal velocity model was chosen as the velocity model for relocation in the study area (Table 2).
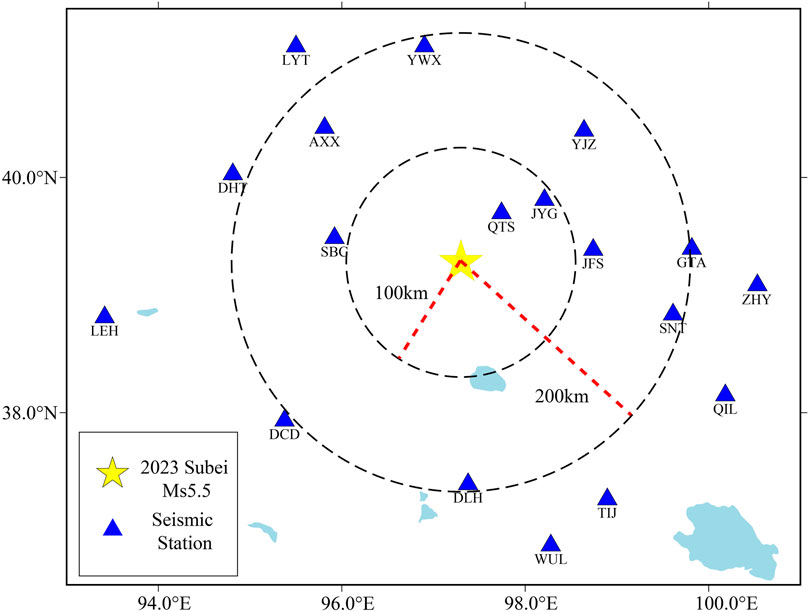
Figure 3. Distribution of stations around the epicenter of the 2023 Ms 5.5 Subei earthquake. The blue solid triangles represent the seismic stations. The yellow pentagon represents the epicenter of the Subi earthquake on 24 October 2023, while the two red dashed lines indicate the distances from the epicenter.
HypoDD2.1b software is used with the following specific parameters: a maximum epicentral distance of 300 km, a minimum requirement of six seismic pairs, and the use of conjugate gradient methods for inversion. The initial iteration of the inversion involves five groups, each iterated 27 times. Ultimately, the precise relocation of the aftershock sequence following the Subei earthquake is achieved.
3.3 Fault plane fitting
Based on the principle that clustered aftershocks tend to be located near significant earthquake faults, more accurate geometric parameters of the seismic fault plane can be determined by analyzing the spatial distribution of aftershock sequences. Determining these fault plane parameters is crucial for understanding the nature and morphology of seismogenic faults. Previous researchers have used a method proposed by Wan to fit parameters of small-seismic fault planes, which has seen widespread application in characterizing faults in regions such as Huoshan and Changdao in Anhui Province (Wan et al., 2008; Xu et al., 2022). In our study, we adopt Wan’s method, which assumes that aftershocks predominantly occur within the fault plane and its vicinity. This method approximates the seismic tectonic fault plane as one or multiple planes, establishing a mathematical model to solve for the fault plane parameters. We employ a combination of simulated annealing and Gaussian-Newton algorithms to calculate these parameters, enabling the determination of the geometrical parameters of the earthquake-generating faults.
3.4 Two-steps inversion strategy
Our inversion process for determining the earthquake source involved a two-steps strategy. Initially, we modeled the earthquake source as one planes with uniform slip in a homogeneous elastic half-space. This involved nonlinear processes to search for the optimum fault parameters, including size (length and width), depth, geometry (strike and dip), and slip, using the Geodetic Bayesian Inversion Software within a Bayesian framework, as described by Bagnardi and Hooper (2018).
Subsequently, we inverted the detailed fault slip distributions on the predetermined fault geometries. This was implemented using constrained least-square optimization with the steepest descent method (Wang et al., 2011).
In this paper, we use geodetic Bayesian inversion software (GBIS) to determine the fault geometry via nonlinear inversion. The GBIS software is used to determine the optimal parameters of the fault through the a posteriori probability density function (PDF) of the fault’s geometrical parameters and the a priori knowledge of the observed values, and the basic idea is to use the Bayesian method to invert the measurement data to obtain the parameters that can represent the basic idea is to use the Bayesian method to invert the measurement data to obtain the PDF that can represent the fault parameters; then, the Markov Monte Carlo method (MCMC) is used to obtain the PDF of the parameters for downsampling, and finally, a set of optimal parameters representing the fault geometry is extracted from the a posteriori PDF. The a posteriori probabilities are represented as follows:
where p (d|m) is the likelihood function determined by the model parameters m and the observations d. In Equation 1, p(m) represents the prior probability distribution of the model parameters, and p(d) is an arbitrary constant. For each iteration, Green’s function G is recalculated in Equation 2, and the likelihood function is updated.
Subsequently, a detailed inversion of the fault slip distribution is performed based on an accurate fault geometry model, whose methodology is constrained to be implemented by least squares optimization and the most rapid descent method. Based on Okada’s elastic halfspace dislocation model (Okada, 1985), the nonlinear function model between the fault parameters and surface deformation observations can be expressed as:
4 Results
4.1 InSAR coseismic deformation
The Sentinel-1A SAR data along the Line of Sight (LOS) clearly show the whole coseismic deformation field of this earthquake (see Figure 4), and the interferograms from different tracks show relatively obvious deformation information. The coseismic deformation field caused by the Subei earthquake on both the ascending track and descending track shows that surface deformation affected an area of 15 km×15 km, and the long axis of the deformation field was approximately oriented in the northwest-southeast direction. For the ascending track, the vertical and east‒west horizontal coseismic deformations cancel each other out on the LOS (Figure 4C), failing to recover the deformations of the fault downlifted block away from the satellite’s LOS. The distance from the satellite is defined with a negative sign, while the proximity to the satellite is denoted with a positive sign.The maximum uplift deformation of the fault downlifted block in the LOS direction is determined to be +6.8 cm. For the descending track, the maximum uplift deformation in the LOS direction is +6.2 cm, while the subsidence deformation is −2.9 cm. In the same region, the deformations observed in both the ascending and descending tracks exhibit opposite signs (Figure 4F). Combining the relationship between uplift and subsidence along the LOS directions of ascending and descending tracks with the operation of faults, it can be inferred that vertical deformation predominates on the Earth’s surface and is accompanied by horizontal deformation.
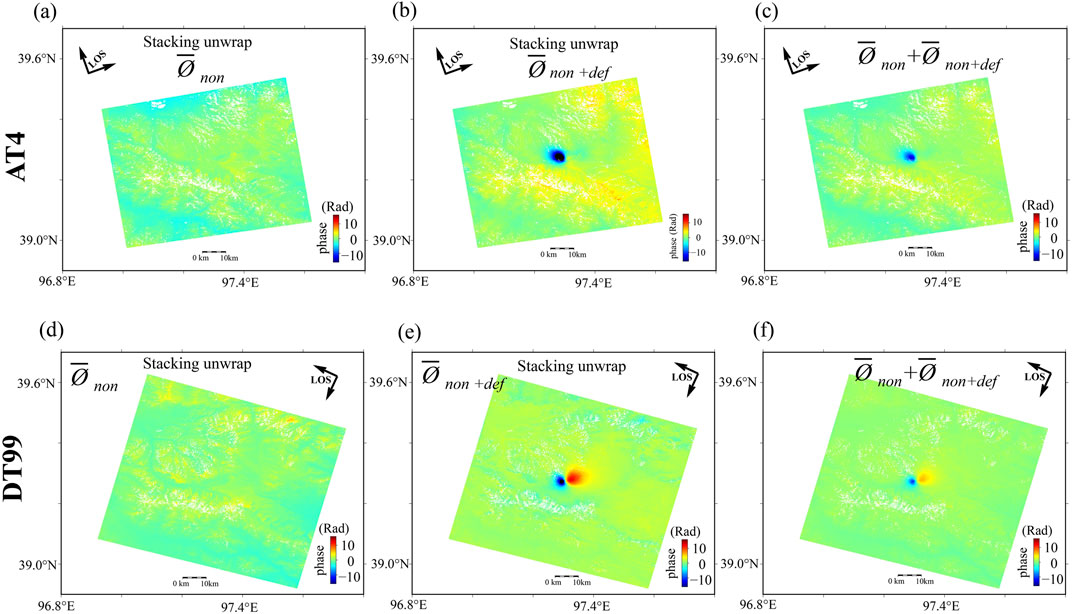
Figure 4. Proposed stacking processing for the 2023 M 5.5 Subei earthquake. (A–D) show the stacked results of unwrapped interferograms without the earthquake signal. (B–E) show the stacked results of unwrapped interferograms with the coseismic signals. (C–F) are the final measurements of coseismic deformation signals derived by summing the two previous stacked results in each track. Blue means moving towards the satellite.
4.2 Aftershock relocation and fault plane fitting
After relocation, we obtained the relative positions of the 141 seismic events of the Ms 5.5 earthquake sequence in Subei. To better constrain the depth of the mainshock, we used Hypoinverse2000 to determine the location of the mainshock, which was located at 97.3128°E, 39.3284°N, with a epicenter depth of 12 km, a horizontal error of 0.73 km and a vertical error of 0.95 km. Based on the solution of the seismic source mechanism given by the USGS and combined with the InSAR coseismic surface deformation field, we set the AA’ profile and the BB’ profile perpendicular to it (Figure 5A). All earthquakes in the depth direction are projected onto AA’ and BB’ along the BB’ direction. According to the results of the epicenter distribution shown in Figure 5A, aftershocks mainly occurred within 40 days after the earthquake, but there were still earthquakes occurring at the rupture location of the mainshock until 80–100 days after the earthquake, which is in line with the occurrence process of a slower release of energy from backlash-type earthquakes. The spatial distribution of aftershocks is mainly concentrated in the periphery of the mainshock, and the spatial distribution generally spreads in a nearly NNW direction, which is the basis of this paper, according to the results of the deep section projected onto the AA’ and BB’ sections from the BB’ direction. In this paper, based on the projection of the deep section from the BB, we fit a fault section in Figure 5C, and the trend of the seismic fault is southwestward, as shown by the fitted fault line.
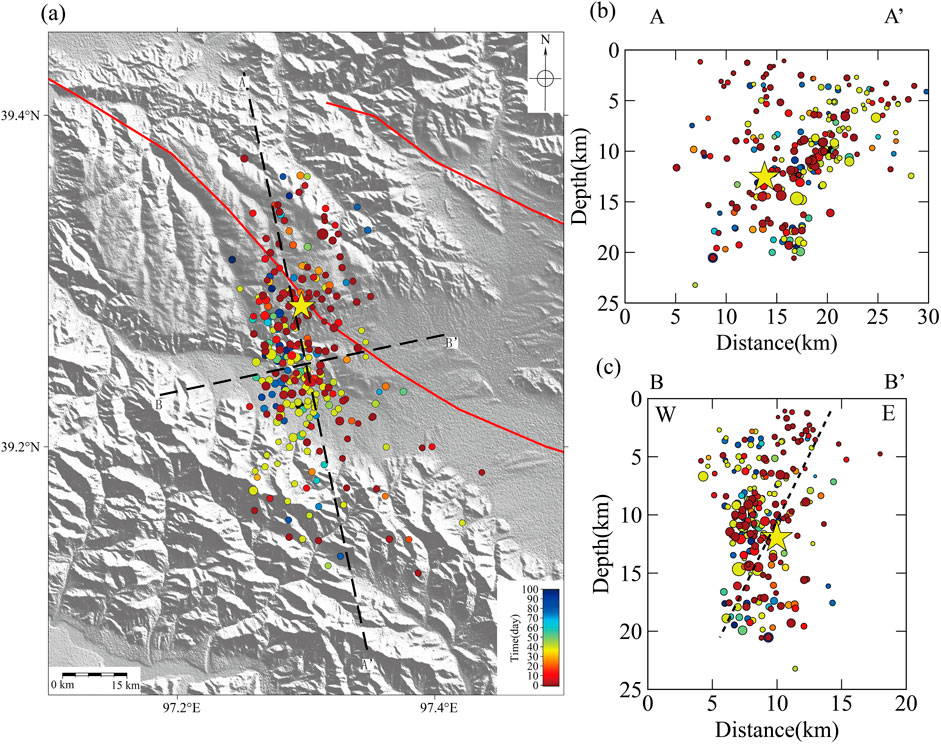
Figure 5. Spatial distribution of the MS5.5 Subei earthquake sequence and in 2023 after relocation. The colors represent the distribution of aftershocks in the 100 days following the occurrence of the Subi earthquake. There was a significant occurrence of aftershocks within the 100 days following the Subi earthquake. (A) Epicenter distribution. All earthquakes in the depth direction are projected onto AA’ and BB’ along the BB’ direction. According to the results of the epicenter distribution; (B, C) Depth profiles.
The geometric parameters of the fault obtained by inputting the final relocated earthquake source location into the small-seismic fault surface fitting program fit_planev2.0 are a strike of 340°, a fault dip of 65°, a fault length of 20 km, and a fault width of 10 km, which provide the basic parameters of fault modeling for the subsequent inversion of uniform-slip fault parameters.
4.3 Fault geometry inversion result
To improve the inversion efficiency and retain the deformation information of the seismic source area as much as possible when using the InSAR observation dataset for the inversion of the seismic fault model, it is necessary to reduce the original InSAR data. This study combines the quadtree method and uniform method for downsampling, and the basic information of the seismic faults obtained from the aftershock fine-location fitting is used (Wang et al., 2014). For part of the seismic source area, the quadtree downsampling method is used to downsample the dataset with the variance threshold set to 6×10⁻⁵ m, and for part of the farfield, uniform downsampling is used to retain the corresponding deformation information. This approach allows for effective extraction of deformation information from the source area while avoiding the sensitivity of the quadtree method to noise signals and maximizing data points in the farfield deformation area. Finally, 1353 and 1032 data vector points are obtained for the ascending and descending rails, respectively, as shown in Figure 6.
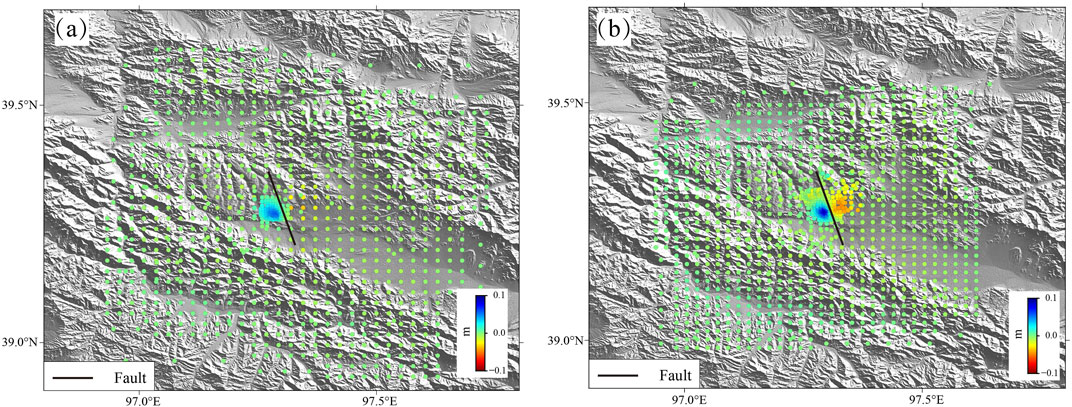
Figure 6. Data spatial distribution from Quadtree sampling. (A, B) show coseismic observations from ascending track and descending track. Black solid lines represent active faults model. Figures shows the downsampled data points, with blue indicating moving towards and red indicating moving away from the satellites along the radar’s LOS direction.
The inversion of fault geometric parameters based on the uniform slip model is carried out on the downsampled dataset using GBIS (Bagnardi and Hooper, 2018), and Figure 7 shows the histograms of the nine fault geometric parameters obtained after 106 iterations, while the maximum a posteriori probabilistic solution and the 95% credible intervals are given in the inversion results to obtain the optimal fault geometric parameters, and the results are shown in Table 3. In addition, from Figure 8, it can be seen that the residual error of the displacement field simulated by using the model parameters of the maximum a posteriori probabilistic solution is very small, indicating that the model parameters have a good fit to the observed data. The displacement field simulated with the maximum a posteriori probabilistic solution has very small residuals, indicating a high degree of fit between the model parameters and the observed data.
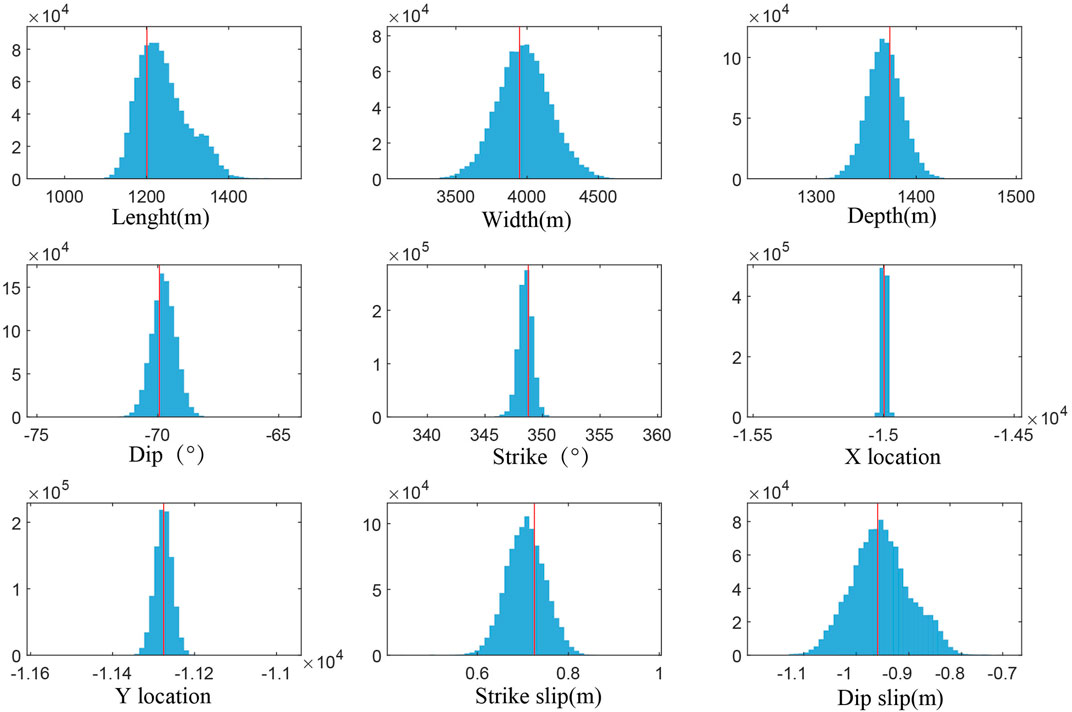
Figure 7. The posterior probability distributions of fault geometry parameters. The red lines represent the maximum a posteriori probability solution.
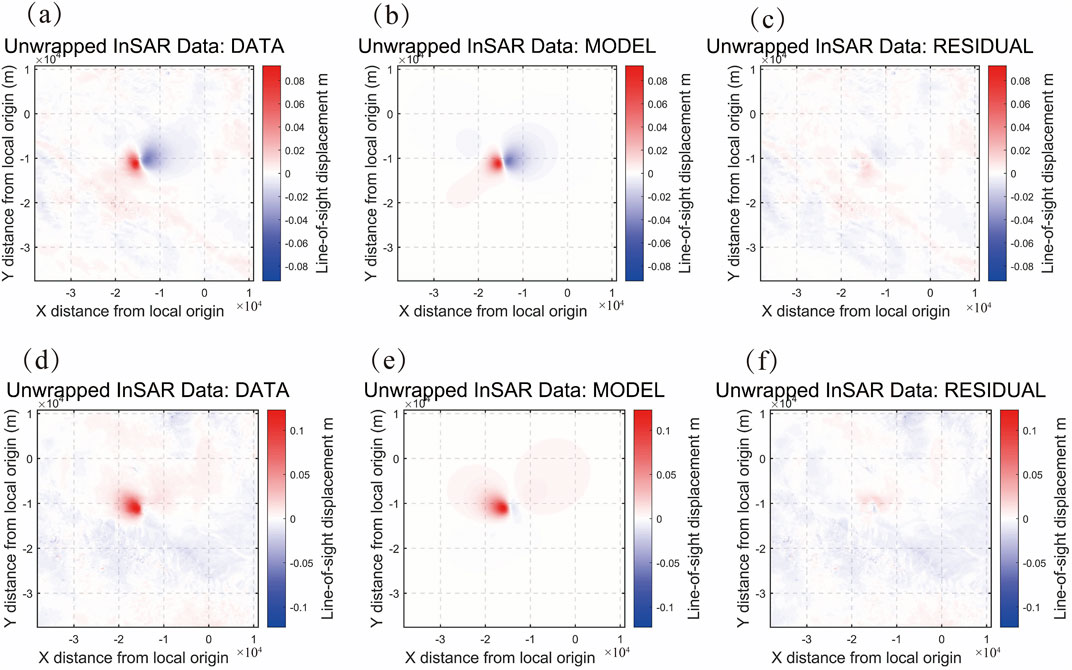
Figure 8. Observation data, simulation value and residual comparison result of the displacement field of the ascending and descending tracks (A–C) are the observation data, simulation value, and residual of the ascending track displacement field (D–F) are the observation data, simulation value, and residual of the descending track displacement field. The posterior probability distributions of fault geometry parameters. The red lines represent the maximum a posteriori probability solution.
The inversion results of the fault slip distribution are shown in Figure 9 (Wang et al., 2013). The earthquake rupture is mainly concentrated in the depth range of 2–5 km underground, indicating that the seismic activity did not rupture to the surface, and the maximum slip of the earthquake is 0.5 m, which occurs at 3–4 km underground, with an average slip angle of 69°. The shear modulus of this region is set to 30 GPa, and the moment magnitude of the inversion is Mw5.4, which shows that the rupture of the fault is reverse faulting with strike-slip components.
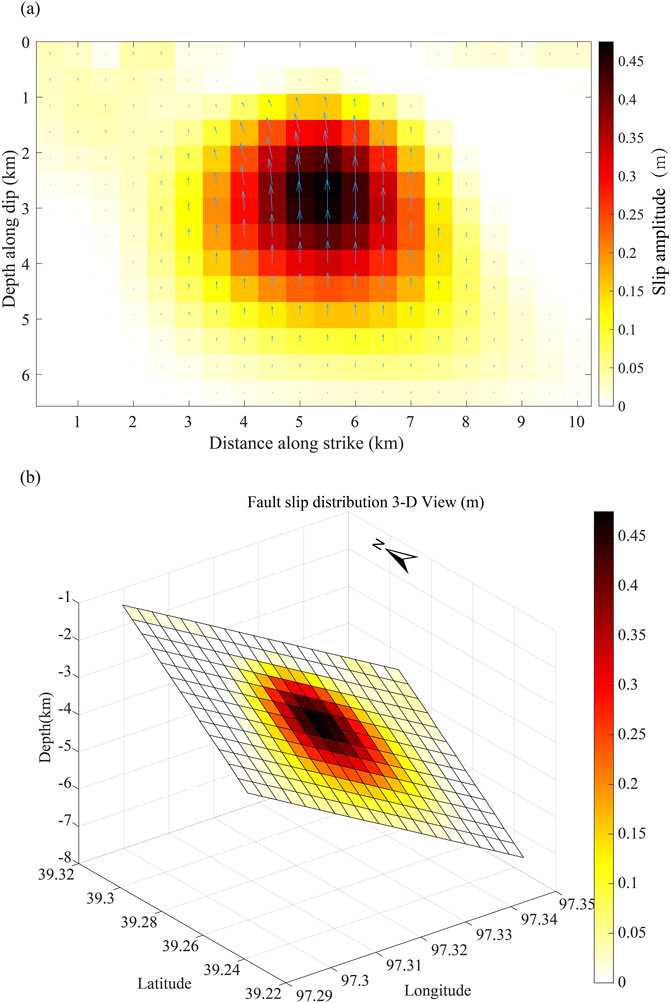
Figure 9. Fault slip distribution of Subei Ms 5.5 along strike. Depth profiles of slip distribution. Arrows represent the slip direction. Figure 2D. (A) planar view. The maximum slip of earthquake is 0.5 m, which occurs at 3–4 km underground. Figure (B) The 3D view of the proposed slip-distribution model with an average slip angle of 69°. The shear modulus of this region is set to 30 GPa, and the moment magnitude of the inversion is Mw5.4.
5 Discussion
5.1 Stacking atmospheric error improvement
To demonstrate the effectiveness of the adopted method in removing atmospheric delays, we recovered interferograms for the periods before and after the Subei earthquake on 24 October 2023. These periods are 19 September 2023, 12 December 2023 (AT4), 18 October 2023, and 30 October 2023 (DT99). Figure 10A presents the results of the ascending track interferograms. While the coseismic deformation signals are clearly discernible in the recovered phase images, the atmospheric phase signals dominate the overall imagery. This predominance is primarily due to the 84-day temporal baseline of the ascending track images, which amplifies the interference errors caused by the randomness of atmospheric phases. Consequently, the single interferogram obtained outside the epicentral area cannot provide reliable measurements of the ascending-track coseismic deformation for this event. After applying the stacking method, the impact of atmospheric phase signals is significantly reduced, as shown in Figure 10B. The coseismic signals across the entire study area become much clearer. Comparing the results of the two interferograms with those of the stacking method demonstrates that the stacking method enhances the coseismic surface deformation of the Subei earthquake.
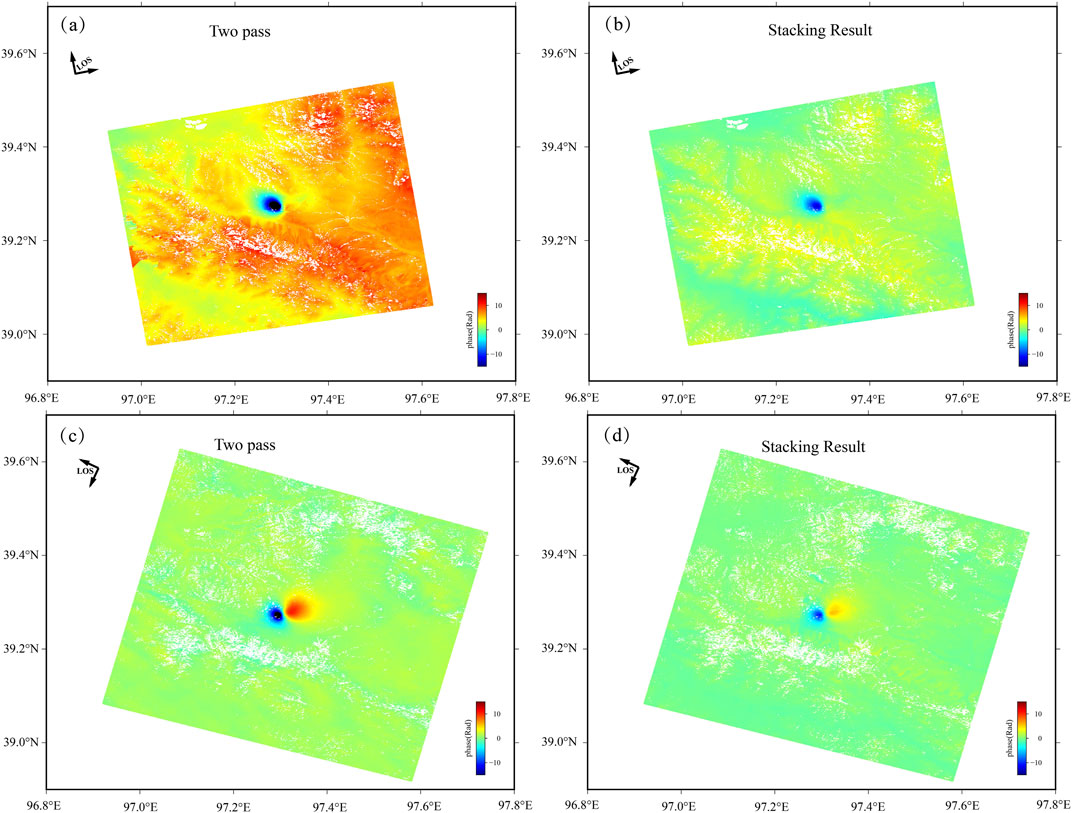
Figure 10. Comparison chart of DInSAR and Stacking methods. (A–C) are DInSAR images from ascending and descending perspectives, respectively; (B–D) are Stacking images from as-cending and descending perspectives, respectively.
We conducted a statistical analysis of the interferograms and DInSAR data points after applying the stacking method, as shown in Figure 11. It is apparent that the distribution of the overall phase values in the interferograms tends to approximate a normal distribution centered around zero after the stacking process. This is consistent with ideal InSAR observation conditions (excluding atmospheric delays and other topographic effects), where surface deformation values are expected to appear primarily near the fault zone of the earthquake rupture.
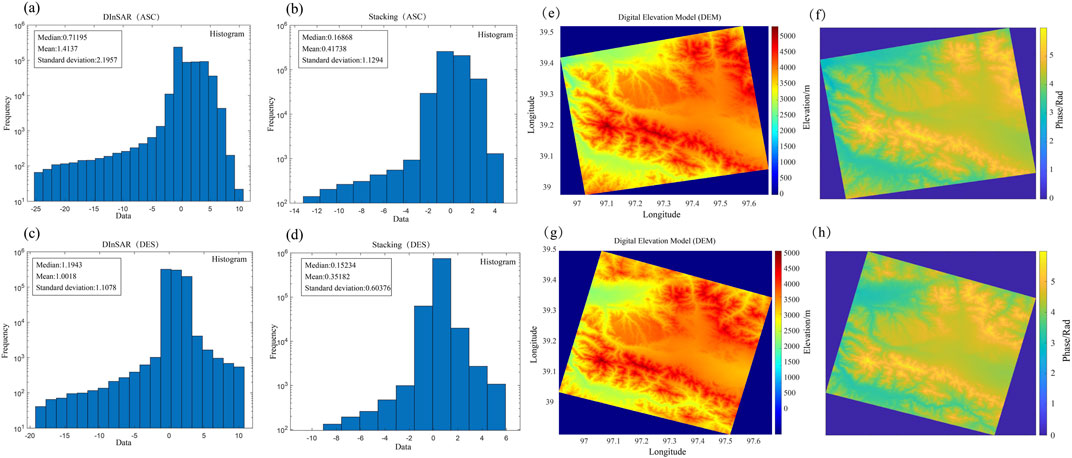
Figure 11. Phase unwrapping data histogram. (A–C) are DInSAR images from ascending and descending perspectives, respectively; (B–D) are Stacking images from ascending and descending perspectives, respectively; The distribution of the overall phase values in the interferograms tends to approximate a normal distribution centered around zero after the stacking process. (E–H) are DEM map of the study from ascending and descending perspectives, respectively; (F–H) are Simulated terrain phase map from ascending and descending perspectives, respectively.
We conducted the following procedures: In order to comprehensively evaluate the efficacy of the proposed stacking method, atmospheric corrections were individually applied to the results obtained at each imaging time. Subsequently, a comparative analysis was performed by comparing these corrected results with those before and after stacking, thereby ensuring a more comprehensive assessment. Consequently, Figure 12 was generated, where Figures 12A–C represent the stacking outcomes for ascending and descending orbits respectively. Additionally, Figures 12B–D illustrate the stacking outcomes for ascending and descending orbits after applying atmospheric corrections to individual interferograms using the GACOS method. Notably, it is evident that comparing the results with or without atmospheric corrections applied at each imaging time reveals that solely employing the stacking method does not yield significant improvements in outcomes. This implies that even when utilizing only the stacking method itself, satisfactory results can still be achieved. The interferograms for each imaging time are provided as supplementary materials to this paper.
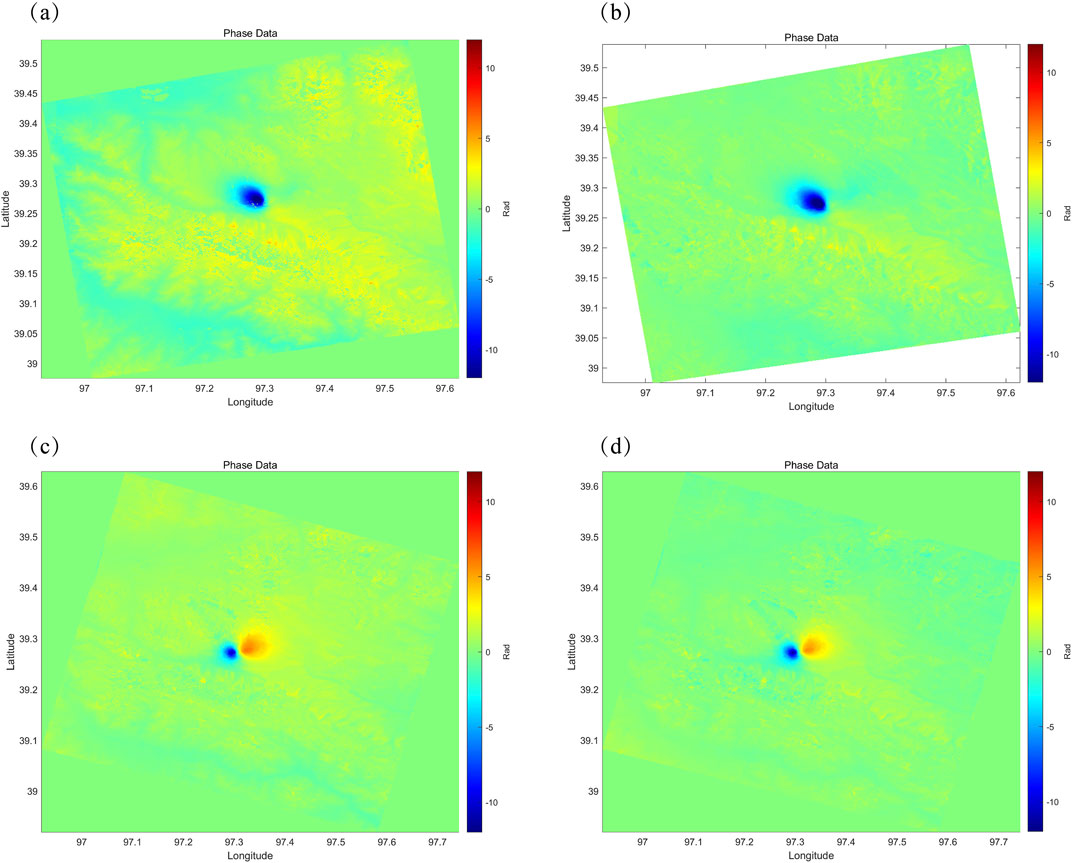
Figure 12. Comparison chart of Stacking and after GACOS Stacking methods (A–C) represent the stacking results for the ascending and descending orbits, respectively. (B–D) show the stacking results for the ascending and descending orbits after applying atmospheric corrections to individual interferograms using the GACOS method.
Previous studies utilizing DInSAR technology to obtain coseismic deformation fields have inferred parameters related to the fault responsible for the earthquake based on these observations. However, it is crucial to consider that both the magnitude of the earthquake and atmospheric noise in the study area can significantly impact these results. While most case studies have concentrated on larger earthquakes, such as the Mw7.8 Kahramanmaraş earthquake in Turkey in 2023 (Barbot et al., 2023), smaller magnitude earthquakes often exhibit subtle coseismic deformation fields that are susceptible to contamination from atmospheric delays. Furthermore, moderate to small earthquakes (e.g., ≤Mw5.5) occur more frequently than larger earthquakes (e.g., ≥Mw6.0). Thus, we propose a stacking method that utilizes time-series SAR images to effectively suppress atmospheric phase screens and extract weak coseismic deformations at the centimeter to sub-centimeter level.
Our study shows that InSAR stacking method for time-series analysis can be effectively applied to the extraction of coseismic deformation fields for moderate to small earthquakes, current research indicates that, generally, for earthquakes occurring in less vegetated areas, utilizing 10–30 SAR images can achieve substantial noise reduction. In highly vegetated regions, however, it is essential to carefully select interferograms with relatively high coherence to mitigate the effects of decorrelation noise, which consequently results in fewer SAR images being incorporated into our stacking method.
5.2 Seismogenic fault
The coseismic surface deformation observed via InSAR and the precise localization of the aftershock sequence reveal that the seismogenic fault is located at the northern margin of the Daxueshan Range (Figure 13). The western end of the northern margin fault of the Daxueshan Range intersects with the ATF. Starting from the west side of Xishuigou in Subei County to the east, it extends southeastward along the west side of the Danghe River, then turns northeastward, runs along the north side of the Yema River into the Daxueshan Range, and further extends eastward along the northern foothills of the Daxueshan Range. With an overall length of approximately 170 km, it exhibits an elongated S-shape and has a general NEE trend. Research indicates that the middle section of the Altyn Tagh Fault experiences a slip rate of 10 mm/year in the Subei region (Zhang et al., 2007), with the eastward movement being absorbed and distributed by active faults such as the Dangnan River Fault, the Shule South Mountain Fault, the Changma Fault, and the Yema River-Daxueshan Fault (Zheng et al., 2005; Qu et al., 2005; Li et al., 2023). The fault zones existing in the study area can be collectively referred to as the Qilian Mountain Western Fault. Current research indicates that the slip rate of the ATF gradually decreases from west to east. It is generally believed that the Qilian Mountain Western Fault absorbs some of the sinistral slip component of the Altyn Tagh Fault. Based on the fault model and the inverted slip mechanism obtained in this study, the Subei earthquake is characterized as a rupture event involving reverse faulting with strike-slip components. This indicates an adjustment in the stress orientation within the seismic zone due to strike-slip displacement. The earthquake likely represents a stress release event at the transition end, reflecting the release of stress in the eastern segment of the Altyn Tagh fault or the absorption of stress through the earthquake (Rong et al., 2005). The precise localization of aftershocks shows that the epicenter is predominantly distributed on the updip side of the fault, which is consistent with the thrust faulting mechanism.
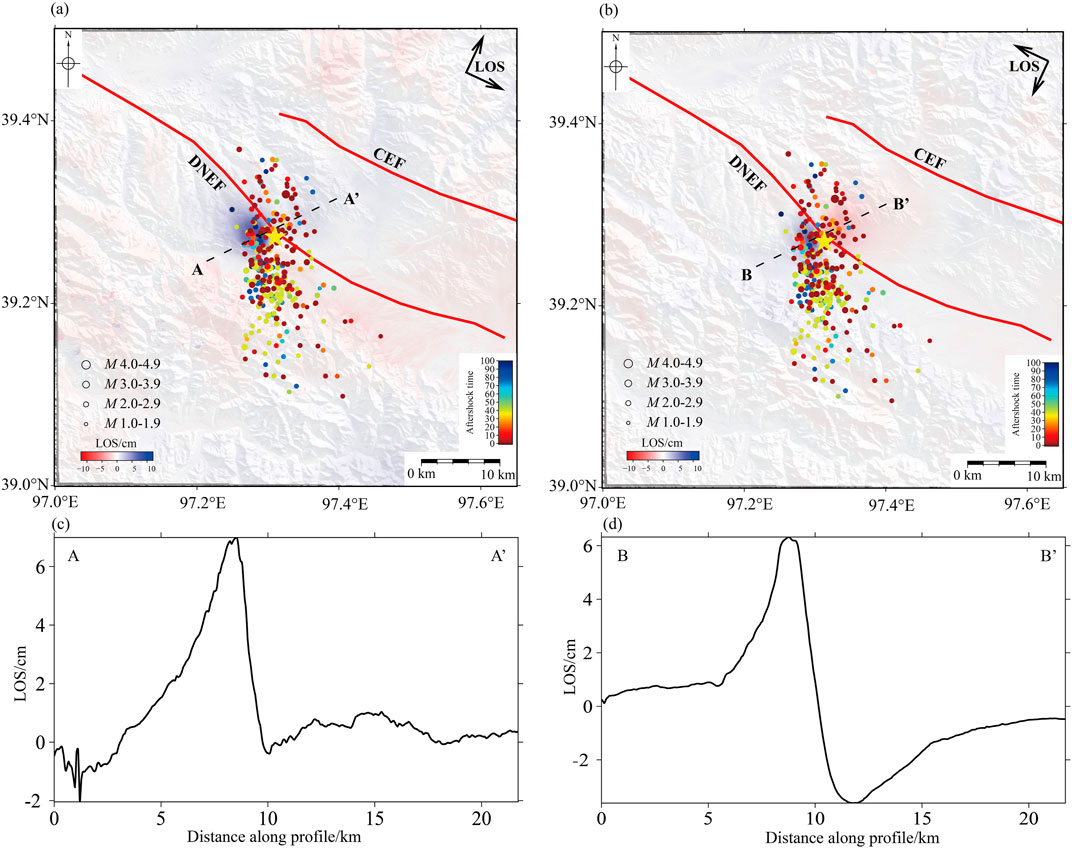
Figure 13. Coseismic Surface Displacement and Fault of 2023 Subei Earthquakes. Line-of-sight (LOS) velocities from descending tracks. Positive values indicate motion towards to the satellite. (A) The descending coseismic deformation of this Ms 5.5 event. (B) The ascending coseismic deformation of this Ms 5.5 event. The red lines donate the measured active fault zones in the region of investigation. (DNEF: Daxueshan Northern Edge Fault; CEF:Changma-Ebo Fault). (C, D) Represent the profiles along AA’ and BB’ for the ascending and descending orbits, respectively. It can be observed that there is a prominent uplift region on the western side of the DNEF, The maximum uplift deformation of the fault downlifted block in the LOS direction is determined to be +6.8 cm. For the descending track, the maximum uplift deformation in the LOS direction is +6.2 cm, while the subsidence deformation is −2.9 cm.
5.3 Seismic background and static coulomb stress triggering
To further discuss the seismogenic background of the Subei earthquake, this study calculated the triggering effect of strong earthquakes occurring within a 100 km radius of the Subei earthquake. Generally, the stress state of a seismogenic region changes after a strong earthquake, which can either delay or promote the occurrence of earthquakes on nearby active faults. Numerous studies on earthquake triggering relationships indicate that interactions exist between earthquakes. When the increase in Coulomb stress reaches 0.1 bar, the seismic hazard of a fault significantly increases (Jonsson, 2002; Stein, 1999; Shan et al., 2017).
On 25 March 2022, a Ms 6.0 earthquake occurred in Delingha, Qinghai, located at 38.50°N, 97.33°E, with a depth of 10 km, approximately 89 km from the Subei earthquake epicenter. Using the fault model obtained by Li (Li et al., 2023) and the Coulomb 3.3 software package (Toda et al., 2011a; Toda et al., 2011b), we conducted a Coulomb stress analysis. During this process, Poisson’s ratio was set to 0.25, and the friction coefficient was set to 0.4. The fault slip distribution of the 2022 Delingha earthquake was used as the source fault, with a strike of 170° and a dip of 90°. The fault geometry of the Subei earthquake was used as the receiver fault, and the fault parameters are listed in Table 3. The Coulomb stress changes induced by the 2022 Delingha earthquake were calculated at depths of 5 km, 10 km, and 15 km to assess their impact on the 2023 Subei earthquake. As shown in Figure 14, the fault slip of the 2022 Delingha earthquake did not induce positive Coulomb stress changes on the seismogenic fault of the 2023 Subei earthquake at depths of 5 km, 10 km, and 15 km. This indicates that the 2022 Delingha earthquake did not significantly trigger the occurrence of the 2023 Subei earthquake.
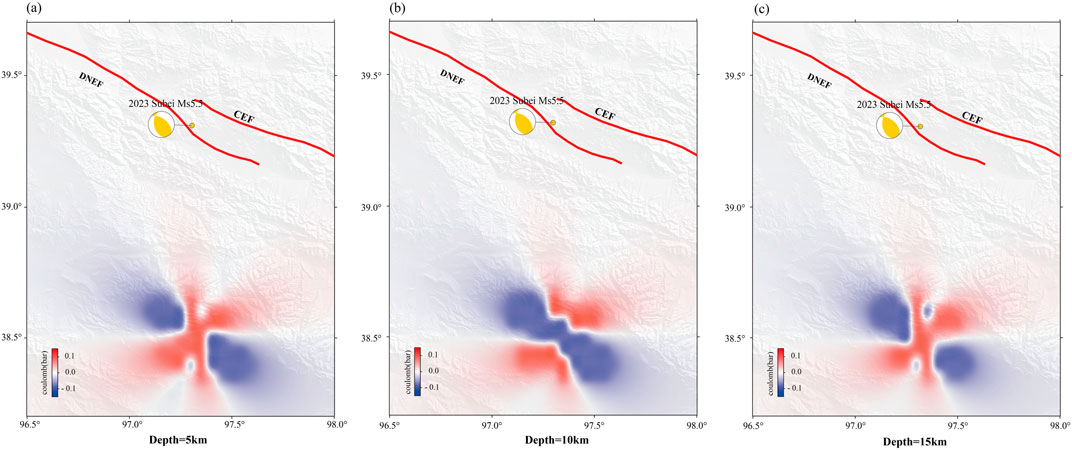
Figure 14. Static coulomb stress changs in subei regions caused by the 2022 Delingha earth-quake. (A) Depth at 5 km (B) depth at 10 km (C) depth at 15 km.
5.4 Postseismic shallow creep and regional seismic hazard
We processed all Sentinel-1A SAR images acquired within 3 months after the 2023 Subei earthquake. Neither the ascending nor descending interferograms revealed any clear postseismic slip signals within the coseismic rupture area. This suggests that there was no resolvable postseismic slip on the rupture fault within the noise level (Figure 15).
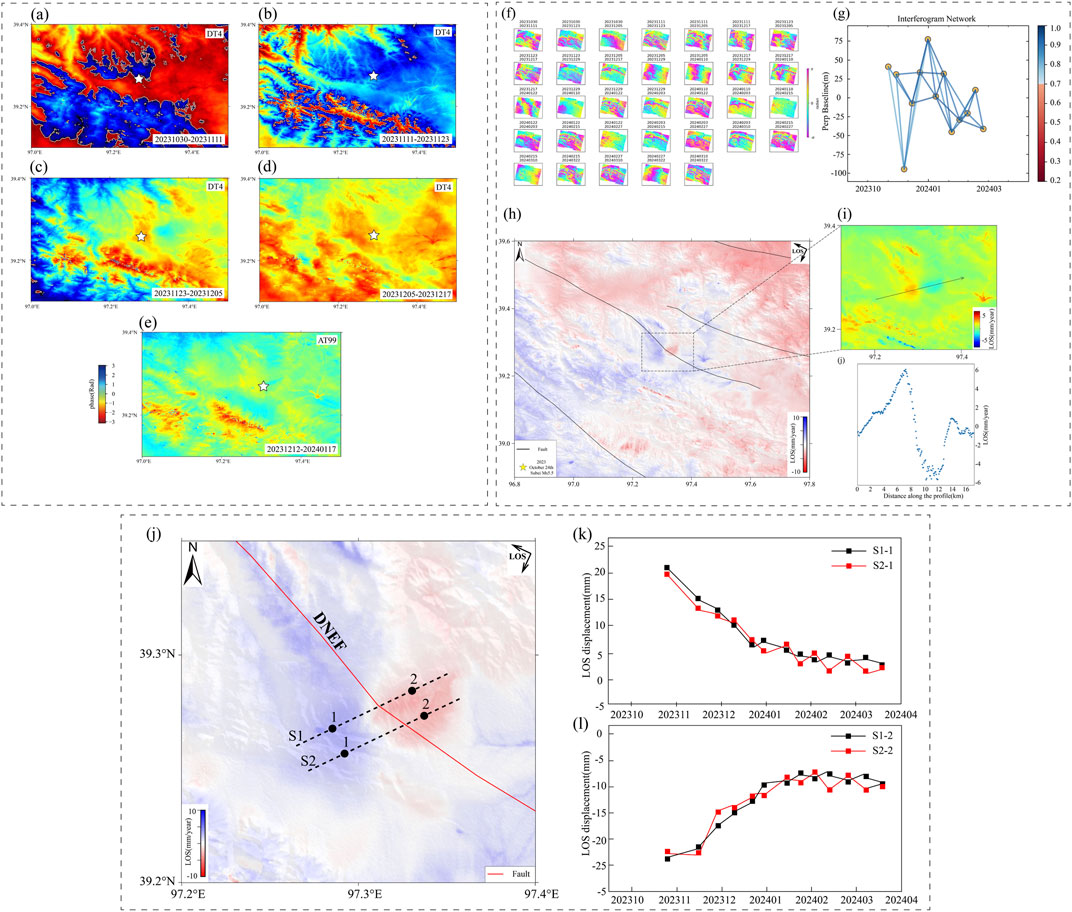
Figure 15. Postseismic interferograms at different spatial range and map and profile views of the measured ground velocities using InSAR. Panels (A–E) show the postseismic interferograms and acquisition time of Sentinel-1 from descending (DT4) and ascending (AT99) tracks, respectively. (F) Interferogram pair. (G) baseline plot. Line-of-sight (LOS) velocities from descending tracks. Positive values indicate motion towards to the satellite. Dashed black arrow in (I) are velocity profiles across the fault. Within the deformation zones on both sides of the fault, The red points S1-1 and S2-1 correspond to the area closer to the satellite, while black points S1-2 and S2-2 pertain to the area farther from the satellite. (J) In the LOS direction, movement towards the satellite is positive, while movement away from the satellite is negative. (H) Descending time series deformation map, (K) LOS displacement time series points for the uplift area, (L) LOS displacement time series points for the subsidence area.
The postseismic interferograms indicate the absence of resolvable afterslip within the rupture area, suggesting that the accumulated strain on the unruptured surface of the reverse fault has not yet been released through postseismic afterslip (Yu et al., 2018; Langbein et al., 2006). However, the accumulated shear strain might be partially mitigated by other seismic processes, such as interseismic creep and plastic deformation (Dolan and Haravitch, 2014; Hamiel et al., 2016; Roten et al., 2017; Marchandon et al., 2021). However, the sustained sinistral slip rate on the Altyn Tagh fault is currently being absorbed by the Yemahe-Daxueshan fault in the eastern segment. In the future, the potential for earthquakes resulting from shallow reverse thrust activity in this local area should be considered.
Despite the absence of significant postseismic deformation observed in individual interferograms, the region continues to absorb stress from the eastern segment of the Altyn Tagh Fault. To further investigate, we employed a time series analysis approach, processing 6 months of interferometric data following the earthquake. Using the SBAS-InSAR method (Berardino et al., 2002), we estimated the deformation rates in the study area. Due to limited ascending pass observations, we only analyzed descending pass data. We selected the Sentinel-1 InSAR products from ASF HyP3 for the interferograms (Nicolau et al., 2021), covering the period from 30 October 2023, to 22 March 2024, which includes a total of 16 scenes and 33 pairs of HyP3 GAMMA InSAR data, as shown in Figure 15F. All selected interferometric pairs were acquired post-earthquake, indicating that none of the interferograms contain coseismic deformation information, as illustrated by the baseline plot in Figure 15G. After generating geocoded interferometric products via HyP3, we conducted deformation time series analysis in MintPy (Zhang et al., 2019). We examined the time series of points across the fault and selected two profiles, S1 and S2. Along these profiles, we selected four points on either side of the DNEF fault. We analyzed the deformation of these points over time, as shown in Figure 11J. In the line-of-sight (LOS) direction, movement towards the satellite is positive, while movement away from the satellite is negative. Within the deformation zones on both sides of the fault, we selected points S1-1 and S2-1 in the area closer to the satellite, and points S1-2 and S2-2 in the area farther from the satellite. The LOS displacement time series for each of these points was extracted, as shown in Figures 11K,L.
Within the 6-month period following the earthquake, discernible movement was still observed on both sides of the coseismic deformation zone along the DNEF fault in Figure 15H. This movement pattern is consistent with the coseismic deformation, indicating that post-earthquake, the DNEF fault continues to experience slip, manifesting at the surface as what is commonly referred to as postseismic shallow creep. This further suggests that the thrust fault near the epicenter remains under compressive stress and continues to undergo rupture. The extensive distribution of aftershocks within 100 days after the event supports this observation in Figure 5A. Therefore, while partially releasing a portion of accumulated stress near the epicenter, it can be inferred from observations of shallow creep that subei Ms 5.5 earthquake has only provided partial relief for accumulated strain. Over time, from 30 October 2023, to 31 December 2023, we observed a clear trend of deceleration in deformation values across the fault. From January 2024 to April 2024, the deformation on both sides of the fault showed minimal variation. This indicates that within 40 days after the Subei earthquake, significant deformation occurred on both sides of the fault, primarily due to post-seismic afterslip.
Our study demonstrates that the time-series method utilizing InSAR technology is highly effective in regions along the margins of large active strike-slip faults, particularly in areas where plate boundary fault slip rates are accommodated. For example, in a region where the plate boundary fault accommodates nearly half of the left-lateral displacement between the North American and Caribbean plates, with velocities of approximately 6.8 mm/year of strike-slip and 5.7 mm/year of shortening, characteristic of transpressional motion (Calais et al., 2002; Calais et al., 2010; Calais et al., 2022a; Calais et al., 2022b; Benford et al., 2012; Corbeau et al., 2016), the method has demonstrated significant applicability.
6 Conclusion
The rapid response to the 2023 Subei earthquake was investigated in this study by utilizing ascending and descending tracks of the Sentinel-1A satellite to obtain the coseismic surface deformation field. In order to enhance the observation capabilities of InSAR for small to moderate earthquakes, a stacking method was employed. Precise locations of aftershocks within 100 days post-earthquake were determined by incorporating seismic phase arrival time data recorded by fixed seismic stations within a radius of 200 km. Furthermore, a fault model was established by integrating precise localization of earthquake sequences and fitting fault planes for minor earthquakes, allowing for discussions on the fault characteristics of the 2023 Subei earthquake. Through inversion techniques, geometric parameters and slip distribution models of the causative fault responsible for the Subei earthquake were determined, enabling exploration into its seismogenic structure and precursory background. The following conclusions were drawn.
(1) The 2022 Subei earthquake rupture was thrust mechanism with a component of right lateral strike-slip, which did not reach the surface. The uplifted and downlifted rails showed surface deformation affecting an area of 15 km × 15 km, with the direction of the long axis of the deformation field oriented in the NNS direction. The maximum uplift deformation of the fault downlifted block in the LOS direction was determined to be 6.8 cm. For the descending track, the maximum uplift deformation in the LOS direction is 6.2 cm, while the subsidence deformation is 2.9 cm.
(2) The earthquake rupture is mainly concentrated in the depth range of 2–5 km underground, indicating that the fault rupture did not reach surface, and the maximum slip of the earthquake is 0.5 m, which occurs at 3–4 km underground, with an average slip angle of 69°. It is preliminarily determined that the causative fault of the 2023 Subei earthquake was the Daxueshan Northern Edge Fault.
(3) The Coulomb stress changes induced by the 2022 Delingha earthquake were calculated using the causative fault of the 2023 Subei earthquake as the receiver fault. The results indicate that the fault slip from the 2022 Delingha earthquake at depths of 5 km, 10 km, and 15 km did not generate positive Coulomb stress changes on the seismogenic fault of the 2023 Subei earthquake. This suggests that the 2022 earthquake did not significantly facilitate the occurrence of the 2023 earthquake. The seismogenic structure of the 2023 earthquake is attributed to the northern margin fault of the Daxueshan range, representing a seismic event resulting from the release of accumulated stress due to sustained sinistral slip on the eastern segment of the Altyn Tagh Fault.
Data availability statement
The original contributions presented in the study are included in the article/Supplementary Material; further inquiries can be directed to the corresponding author.
Author contributions
YY: Conceptualization, Data curation, Formal Analysis, Methodology, Writing–original draft. ZZ: Formal Analysis, Funding acquisition, Writing–review and editing. ZeL: Software, Validation, Writing–review and editing. ZiL: Formal Analysis, Visualization, Writing–review and editing. GW: Resources, Visualization, Writing–review and editing. JJ: Conceptualization, Formal Analysis, Writing–review and editing.
Funding
The author(s) declare that financial support was received for the research, authorship, and/or publication of this article. This research was funded by “Science and Technology Project of Yunnan Earthquake Agency”, (Grant No. 2023ZX03), “Yunnan International Joint Laboratory of China-Laos-Bangladesh-Myanmar Natural Resources Remote Sensing Monitoring” (Grant No. 202303AP140015), “National Natural Science Foundation of China” (Grant No. 41872251), “National Natural Science Foundation of China” (Grant No. 42104060) “Key Research and Development Plan of Yunnan Province” (Grant No. 202203AC100003) “Spark Program of Earthquake Sciences” (Grant No. XH24037YB).
Acknowledgments
The authors thank editor, Nicola Alessandro Pino, and three reviewers for their thorough and thoughtful reviews of this article. We are grateful to ESA for providing the Sentinel-1A radar data, to GW Teng’s group at Peking University for providing the InSAR interferometric processing software, and to the Geotectonic Laboratory of Earthquakes and Volcanoes (GFZ) at the University of Leeds for providing the GBIS software. We are grateful to Prof. GW Rongjiang of GFZ, Germany, for providing the fault slip distribution inversion program SDM package. The maps were drawn with GMT6.0 (Wessel and Smith, 1998). We are grateful to Prof. Teng GW for meaningful discussions, and to the reviewers for valuable revisions that improved this paper.
Conflict of interest
The authors declare that the research was conducted in the absence of any commercial or financial relationships that could be construed as a potential conflict of interest.
Publisher’s note
All claims expressed in this article are solely those of the authors and do not necessarily represent those of their affiliated organizations, or those of the publisher, the editors and the reviewers. Any product that may be evaluated in this article, or claim that may be made by its manufacturer, is not guaranteed or endorsed by the publisher.
References
Bagnardi, M., and Hooper, A. (2018). Inversion of surface deformation data for rapid estimates of source parameters and uncer-tainties: a bayesian approach. Geochem. Geophys. Geosystems 19, 2194–2211. doi:10.1029/2018gc007585
Baran, I., Stewart, M. P., Kampes, B. M., Perski, Z., and Lilly, P. (2003). A modification to the Goldstein radar interferogram filter. IEEE Trans.Geosci. Remote Sens. 41, 2114–2118. doi:10.1109/tgrs.2003.817212
Barbot, S., Luo, H., Wang, T., Hamiel, Y., Piatibratova, O., Javed, M. T., et al. (2023). Slip distribution of the february 6, 2023 Mw 7.8 and Mw 7.6, Kahramanmaraş, Turkey earthquake sequence in the east anatolian fault zone. Seismica 2 (3). doi:10.26443/seismica.v2i3.502
Bendick, R., Bilham, R., Freymueller, J., Larson, K., and Yin, G. (2000). Geodetic evidence for a low slip rate in the Altyn Tagh fault system. Nature 404 (6773), 69–72. doi:10.1038/35003555
Benford, B., DeMets, C., and Calais, E. (2012). GPS estimates of microplate motions, northern Caribbean: evidence for a Hispaniola microplate and implications for earthquake hazard. Geophys. J. Int. 191 (2), 481–490. doi:10.1111/j.1365-246X.2012.05662.x
Ben-Zion, Y. (2008). Collective behavior of earthquakes and faults: continuum discrete transitions, progressive evolutionary changes, and different dynamic regimes. Rev. Geophys. 46, 2008RG000260. doi:10.1029/2008RG000260
Berardino, P., Fornaro, G., Lanari, R., and Sansosti, E. (2002). A new algorithm for surface deformation monitoring based on small baseline differential SAR interferograms. IEEE Trans. Geoscience Remote Sens. 40 (11), 2375–2383. doi:10.1109/tgrs.2002.803792
Calais, E., Mazabraud, Y., de Lépinay Mercier, B., Mann, P., Mattioli, G., and Jansma, P. (2002). Strain partitioning and fault slip rates in the northeastern Caribbean from GPS measurements. Geophys. Res.Lett. 29 (18), 3-1–3–4. doi:10.1029/2002GL015397
Calais, E., Symithe, S., Monfret, T., Delouis, B., Lomax, A., Courboulex, F., et al. (2022a). Citizen seismology helps decipher the 2021 Haiti earthquake. Science 376 (6590), 283–287. doi:10.1126/science.abn1045
Calais, E. A., Freed, G., Mattioli, F., Amelung, S., Jónsson, P., Jansma, S. H., et al. (2010). Transpressional rupture of an unmapped fault during the 2010 Haiti earthquake. Nature Geosci. 3, 794–799. doi:10.1038/ngeo992
Calais, E., Symithe, S. J., and de Lépinay, B. M. (2022b). Strain partitioning within the Caribbean–North America transform plate boundary in Southern Haiti, tectonic and hazard implications. Bull. Seismol. Soc. Am. 113 (1), 131–142. doi:10.1785/0120220121
Chen, Z., Huang, Y., He, X., Shao, X., Li, L., Xu, C., et al. (2023). Landslides triggered by the 10 June 2022 Maerkang earthquake swarm, Sichuan, China: spatial distribution and tectonic significance. Landslides 20, 2155–2169. doi:10.1007/s10346-023-02080-0
Corbeau, J., Rolandone, F., Leroy, S., Meyer, B., LépinayMercier de, B., Ellouz-Zimmermann, N., et al. (2016). How transpressive is the northern Caribbean plate boundary? Tectonics 35 (4), 1032–1046. doi:10.1002/2015TC003996
Costantini, M., and Rosen, P. A. (1999). “A generalized phase unwrapping approach for sparse data,” in Proceedings of the IEEE 1999 international geoscience and remote sensing symposium. IGARSS099 (cat. No.99CH36293) (Hamburg, Germany), 267–269.
Cowgill, E., Gold, R., Chen, X., Wang, X., Arrowsmith, J., and Southon, J. (2009). Low Quaternary slip rate reconciles geodetic and geologic rates along the Altyn Tagh fault, Northwestern Tibet. Geology 37 (7), 647–650. doi:10.1130/G25623A.1
Daout, S., Doin, M.-P., Peltzer, G., Lasserre, C., Socquet, A., Volat, M., et al. (2018). Strain partitioning and present-day fault kinematics in NW tibet from envisat SAR interferometry. J. Geophys. Res. Solid Earth. 123, 2462–2483. doi:10.1002/2017JB015020
Deng, Q., Zhang, P., Ran, Y., Yang, X., Min, W., and Chen, L. (2003). Active tectonics and earthquake activities in China. Earth Sci. Front. 10 (S1), 66–73. Available at: https://en.cnki.com.cn/Article_en/CJFDTotal-DXQY2003S1011.htm.
Ding, X., Chen, hanlin, and Zhang, W. (2008). SAR monitoring of nowaday deformation in the eastern segment of the Altyn Tagh Fault. Earth Sci. Front. 15, 370–375.
Dolan, J. F., and Haravitch, B. D. (2014). How well do surface slip measurements track slip at depth in large strike-slip earthquakes? The importance of fault structural maturity in controlling on-fault slip versus off-fault surface deformation. Earth Planet. Sci. Lett. 388, 38–47. doi:10.1016/j.epsl.2013.11.043
Duan, B. (2019). Multicycle dynamics of the aksay bend along the Altyn Tagh Fault in northwest China: 1. A simplified double bend. Tectonics 38, 1101–1119. doi:10.1029/2018TC005195
Elliott, J. R., Biggs, J., Parsons, B., and Wright, T. J. (2008). InSAR slip rate determination on the Altyn Tagh Fault, northern tibet, in the presence of topographically correlated atmospheric delays: Altyn tagh fault slip rate. Geophys. Res. Lett. 35, L12309. doi:10.1029/2008GL033659
Farr, T. G., Rosen, P. A., Caro, E., Crippen, R., Duren, R., Hensley, S., et al. (2007). TheShuttle radar topography mission. Rev. Geophys. 45. doi:10.1029/2005rg000183
Gold, R., Cowgill, E., Arrowsmith, J., Chen, X., Sharp, W., Cooper, K., et al. (2011). Faulted terrace risers place new constraints on the Late Quaternary slip rate for the central Altyn Tagh fault, Northwest Tibet. GSA Bull. 123 (5-6), 958–978. doi:10.1130/B30207.1
Hamiel, Y., Piatibratova, O., and Mizrahi, Y. (2016). Creep along the northern Jordan valley section of the dead sea fault. Geophys. Res. Lett. 43, 2494–2501. doi:10.1002/2016GL067913
Hartzell, S. H. (1978). Earthquake aftershocks as green’s functions. Geophys. Res. Lett. 5, 1–4. doi:10.1029/GL005i001p00001
He, W., Zhang, B., Wu, M., Wang, P., Zou, X., and Gao, X. (2018). Paleoseismology on the Yemahe segment of the Yemahe-Daxueshan fault revealed by trench study. Seismol. Geol. 40, 261–275. doi:10.3969/j.issn.0253-4967.2018.01.018
Johnson, H. O., Agnew, D. C., and Hudnut, K. (1994). Extremal bounds on earthquake movement from geodetic data: application to the Landers earthquake. Bull. Seismol. Soc. Am., 84 (3), 660–667. doi:10.1785/BSSA0840030660
Jolivet, R., Cattin, R., Chamot-Rooke, N., Lasserre, C., and Peltzer, G. (2008). Thin-plate modeling of interseismic deformation and asymmetry across the Altyn Tagh fault zone. Geophys. Res. Lett. 35 (2), L02309. doi:10.1029/2007GL031511
Jonsson, S. (2002). Fault slip distribution of the 1999 Mw 7.1 hector mine, California, earthquake, estimated from satellite radar and GPS measurements. Bull. Seism. Soc. Am. 92, 1377–1389. doi:10.1785/0120000922
Langbein, J., Murray, J. R., and Snyder, H. A. (2006). Coseismic and initial postseismic deformation from the 2004 Parkfield, California, earthquake, observed by global positioning system, electronic distance meter, creepmeters, and borehole strainmeters. Bull. Seismol. Soc. Am. 96, S304–S320. doi:10.1785/0120050823
Li, C. Y., Zhang, P. X., Yin, J. H., and Wen, M. (2009). Late Quaternary left-lateral slip rate of the Haiyuan Fault, northeastern margin of the Tibetan plateau. Tectonics 28. doi:10.1029/2008TC002302
Li, W., He, X., Zhang., , Y, P., Wang, Y., Liu, B., et al. (2023). The 2022 Delingha, China, earthquake sequence and implication for seismic hazard near the western end of the qilian–haiyuan fault. Seismol. Res. Lett. 94 (4), 1733–1746. doi:10.1785/0220220345
Li, Z., and Wang, T. (2023). Coseismic and early postseismic slip of the 2021 Mw 7.2 nippes, Haiti, earthquake: transpressional rupture of a nonplanar dipping fault system. Seismol. Res. Lett. 94, 2595–2608. doi:10.1785/0220230160
Liu, J., Hu, J., Li, Z., Ma, Z., Shi, J., Xu, W., et al. (2022). Three-dimensional surface displacements of the 8 january 2022 Mw 6.7 menyuan earthquake, China from sentinel-1 and ALOS-2 SAR observations. Remote Sens. 14, 1404. doi:10.3390/rs14061404
Liu, K., Li, H., Wang, C., Yao, S., Gong, Z., Xiao, G., et al. (2019). Comprehensive analysis of deep and shallow structures in the eastern Altyn Tagh fault zone. Acta Petrol. Sin. 35 (6), 1833–1847. doi:10.18654/1000-0569/2019.06.12
Luo, H., He, W. W., Wang, D. W., Yuan, D. Y., and Shao, Y. X. (2013). Study on the slip rate of changma fault in qilian mountains since late pleistocene. Seismol. Geol. 35 (4), 765–777. doi:10.3969/j.issn.0253-4967.2013.007
Luo, H., and Wang, T. (2022). Strain partitioning on the western haiyuan fault system revealed by the adjacent 2016 Mw5.9 and 2022 Mw6.7 menyuan earthquakes. Geophys. Res. Lett. 49, e2022GL099348. doi:10.1029/2022GL099348
Luo, H., Wang, T., Wei, S., Liao, M., and Gong, J. (2021). Deriving centimeter-level coseismic deformation and Fault geometries of small-to-moderate earthquakes from time-series sentinel-1 SAR images. Front. Earth Sci. 9, 636398. doi:10.3389/feart.2021.636398
Marchandon, M., Hollingsworth, J., and Radiguet, M. (2021). Origin of the shallow slip deficit on a strike slip fault: influence of elastic structure, topography, data coverage, and noise. Earth Planet. Sci. Lett. 554, 116696. doi:10.1016/j.epsl.2020.116696
Mériaux, A., Tapponnier, P., Ryerson, F., Xu, X., King, G., Van der Woerd, J., et al. (2005). The Aksay segment of the Northern Altyn Tagh fault:Tectonic geomorphology, landscape evolution, and Holocene slip rate. J. Geophys. Research:Solid Earth 110 (B4), B04404. doi:10.1029/2004JB003210
Meyer, B., Tapponnier, P. B. L., Métivier, F., Gaudemer, Y., Peltzer, G., Chen, G. S., et al. (1998). Crustal thickening in Gansu-Qinghai, lithospheric mantle subduction, and oblique and strike slip controlled growth of the Tibetan plateau. Geophys J. Int. 135 (1), 1–47. doi:10.1046/j.1365-246X.1998.00567.x
Nicolau, A. P., Flores-Anderson, A., Griffin, R., Herndon, K., and Meyer, F. J. (2021). Assessing SAR C-band data to effectively distinguish modified land uses in a heavily disturbed Amazon forest. Int. J. Appl. Earth Observation Geoinformation 94, 102214. doi:10.1016/j.jag.2020.102214
Nielsen, S. B., and Knopoff, L. (1998). The equivalent strength of geometrical barriers to earthquakes. J. Geophys. Res. Solid Earth. 103, 9953–9965. doi:10.1029/97JB03293
Okada, Y. (1985). Surface deformation due to shear and tensile faults in a half-space. Bull. Seismol. Soc. A 75, 1135–1154. doi:10.1785/bssa0750041135
Qu, W., Liu, B., Zhang, Q., Gao, Y., Chen, H., Wang, Q., et al. (2005). Sentinel-1 InSAR observations of co- and post-seismic deformation mechanisms of the 2016 Mw 5.9 Menyuan Earthquake, Northwestern China. Adv. Space Res. 68, 1301–1317. doi:10.1016/j.asr.2021.03.016
Rong, R. Z., Xu, X. W., Wang, F., Li, J. P., and Ji, F. J. (2005). The thrust activity of the Altyn fault zone since the middle and late Pleistocene. Seismol. Geol. 27 (3), 361–373.
Ross, Z. E., Idini, B., Jia, Z., Stephenson, O. L., Zhong, M., Wang, X., et al. (2019). Hierarchical interlocked orthogonal faulting in the 2019 ridgecrest earthquake sequence. Science 366, 346–351. doi:10.1126/science.aaz0109
Roten, D., Olsen, K. B., and Day, S. M. (2017). Off-fault deformations and shallow slip deficit from dynamic rupture simulations with fault zone plasticity. Geophys. Res. Lett. 44 (15), 7733–7742. doi:10.1002/2017GL074323
Seong, Y., Kang, H., Ree, J., Yi, C., and Yoon, H. (2011). Constant slip rate during the late quaternary along the sulu He segment of the Altyn Tagh fault near changma, Gansu, China. Isl. Arc 20 (1), 94–106. doi:10.1111/j.1440-1738.2010.00743.x
Shan, B., Zheng, Y., Liu, C., Xie, Z., and Kong, J. (2017). Coseismic Coulomb failure stress changes caused by the 2017 M7.0 jiu-zhaigou Earthquake,and its relationship with the 2008 wenchuan earthquake. Sci. China Earth Sci. 60 (12), 2181–2189. doi:10.1007/s11430-017-9125-2
Shelly, D. R., Ellsworth, W. L., and Hill, D. P. (2016). Fluid faulting evolution in high definition: connecting fault structure and frequency-magnitude variations during the 2014 long valley caldera, California, earthquake swarm. J. Geophys. Res. Solid Earth. 121, 1776–1795. doi:10.1002/2015JB012719
Shen, Z., Wang, M., Li, Y., David, D., Yin, A., Dong, D., et al. (2001). Crustal deformation along the Altyn Tagh fault system, western China, from GPS. J. Geophys. Research:Solid Earth 106 (B12), 30607–30621. doi:10.1029/2001JB000349
Stein, R. (1999). The role of stress transfer in earthquake occurrence. Nature 402 (6762), 605–609. doi:10.1038/45144
Sun, J., Yue, H., Shen, Z., Fang, L., Zhan, Y., and Sun, X. (2018). The 2017 jiuzhaigou earthquake: a complicated event occurred in a young fault system. Geophys. Res. Lett. 45, 2230–2240. doi:10.1002/2017GL076421
Toda, S., Stein, R. S., and Lin, J. (2011a). Widespread seismicity excitation throughout central Japan following the 2011 M=9.0 Tohokuearthquake and its interpretation by Coulomb stress transfer. Geophys. Res. Lett. 38 (7). doi:10.1029/2011GL047834
Toda, S., Stein, R. S., and Lin, J. (2011b). Coulomb 3.3 Graphic-rich deformation and stress-change software for earthquake, tectonic, and volcano research and teaching—user guide. U.S. Geol. Surv. Open-File Rep. 2011–1060, 63. Available at: https://pubs.usgs.gov/of/2011/1060/.
Waldhauser, F., and Ellsworth, W. L. (2002). Fault structure and mechanics of the hayward Fault, California, from double-difference earthquake locations. J. Geophys. Res. Solid Earth. 107. doi:10.1029/2000JB000084
Wan, Y., Shen, Z., Diao, G., Wang, F., Hu, X., and Sheng, S. (2008). An algorithm of fault parameter determination using distribution of small earthquakes and parameters of regional stress field and its application to Tangshan earthquake sequence. Chin. J. Geophys. 51 (3), 793–804. doi:10.1002/cjg2.1247
Wang, C. S., Ding, X. L., Li, Q. Q., and Jiang, M. (2014). Equation-based InSAR data quadtree downsampling for earthquake slip distribution inversion. IEEE Geoscience Remote Sens. Lett. 11 (12), 2060–2064. doi:10.1109/LGRS.2014.2318775
Wang, R., Schurr, B., Milkereit, C., Shao, Z., and Jin, M. (2011). An improved automatic scheme for empirical baseline correction of digital strong-motion records. Bull. Seismol. Soc. Am. 101 (5), 2029–2044. doi:10.1785/0120110039
Wang, R., Diao, F., and Hoechner, A. (2013). “SDM—a geodetic inversion code incorporating with layered crust structure and curved fault geometry,” in Proceedings of the EGU general assembly 2013.
Wessel, P., and Smith, W. (1998). New, improved version of generic mapping tools released. EOS Trans. AGU. 79, 579. doi:10.1029/98eo00426
Xu, X., Tapponnier, P., VanDer Woerd, J., Ryerson, F. J., Wang, F., Zheng, R., et al. (2003). Discussion on the late quaternary left-lateral slip rate and structural movement transition patterns of the altun fault zone. Sci. China Ser. D-Earth Sci. 33 (10), 967–974. doi:10.1360/zd2003-33-10-967
Xu, X., Wan, Y., Feng, X., Li, X., Liu, Z., and He, J. (2022). Study on three seismic fault segments and their sliding properties revealed by clustered seismic events in Huoshan area, Anhui province. Chin. J. Geophys. 65, 1688–1700. doi:10.6038/cjg2022P0768
Xu, X., Wang, F., Zheng, R., Chen, W., Ma, W., Yu, G., et al. (2005). Late Quaternary sinistral slip rate along the Altyn Tagh fault and its structural transformation model. Sci. China Ser. D:Earth Sci. 48 (3), 384. doi:10.1360/02yd0436
Yang, Z., Dai, D., Zhang, Y., Zhang, X., and Liu, J. (2022). Rupture process and aftershock focal mechanisms of the 2022 M6.8 luding earthquake in sichuan. Earthq. Sci. 35, 474–484. doi:10.1016/j.eqs.2022.12.005
Yao, Y., Yang, Z., and Zhou, S. (2023). Seismicity in Zemuhe fault zone based on dense seismic array. Acta Seismol. Sin. 45 (6), 985–995. doi:10.11939/jass.20220084
Yu, C., Li, Z., Penna, N. T., and Crippa, P. (2018). Generic atmospheric correction model for interferometric synthetic aperture radar observations. J. Geophys. Res. Solid Earth 123 (10), 9202–9222. doi:10.1029/2017jb015305
Zhang, P., Molnar, P., and Xu, X. (2007). Late Quaternary and present-day rates of slip along the Altyn Tagh fault, northern margin of the Tibetan plateau. Tectonics 26 (5), TC5010. doi:10.1029/2006TC002014
Zhang, Y., Fattahi, H., and Amelung, F. (2019). Small baseline InSAR time series analysis: unwrapping error correction and noise reduction. Comput. Geosciences 2019, 19. doi:10.1016/j.cageo.2019.104331
Zhang, Y., Wang, R., Zschau, J., Chen, Y., Parolai, S., and Dahm, T. (2014). Automatic imaging of earthquake rupture processes by iterative deconvolution and stacking of high-rate GPS and strong motion seismograms. J. Geophys. Res. Solid Earth. 119, 5633–5650. doi:10.1002/2013JB010469
Zheng, R., Xu, X., Wang, F., Li, J., and Ji, F. (2005). The thrust activity of the Altyn fault zone since the middle and late pleistocene. Seismol. Geol. 27 (3), 361–373.
Zheng, W., Zhang, P., He, W., Yuan, D. y., Shao, Y. x., Zheng, D. w., et al. (2013). Transformation of displacement between strike -slip and crustal shortening in the northern margin of the Tibetan Plateau: evidence from decadal GPS measurements and late Quaternary slip rates on faults. Tec-tonophysics 584, 267–280. doi:10.1016/j.tecto.2012.01.006
Zheng, W. J., Zhang, P. Z., He, W. G., Yuan, D. Y., Shao, Y. X., Zheng, D. W., et al. (2013). Transformation of displacement between strike-slip and crustal shortening in the northern margin of the Tibetan plateau: evidence from decadal GPS measurements and late Quaternary slip rates on faults. Tectonophysics 584, 267–280. doi:10.1016/j.tecto.2012.01.006
Keywords: 2023 subei earthquake, stacking, altyn tagh Fault, coseismic surface deformation, relocated aftershouck, fault geometry
Citation: Yao Y, Zhao Z, Li Z, Lai Z, Wang G and Jiang J (2024) Source mechanism of the 2023 Ms 5.5 earthquake in Subei, Gansu Province revealed by relocated aftershocks and InSAR: complement to the ‘shallow slip deficit’ of the eastern boundary of the Altyn Tagh fault. Front. Earth Sci. 12:1447789. doi: 10.3389/feart.2024.1447789
Received: 12 June 2024; Accepted: 28 October 2024;
Published: 06 November 2024.
Edited by:
Nicola Alessandro Pino, National Institute of Geophysics and Volcanology (INGV), ItalyReviewed by:
Guangyu Xu, East China University of Technology, ChinaLuca Guerrieri, Istituto Superiore per la Protezione e la Ricerca Ambientale (ISPRA), Italy
Lin Shen, Columbia University, United States
Copyright © 2024 Yao, Zhao, Li, Lai, Wang and Jiang. This is an open-access article distributed under the terms of the Creative Commons Attribution License (CC BY). The use, distribution or reproduction in other forums is permitted, provided the original author(s) and the copyright owner(s) are credited and that the original publication in this journal is cited, in accordance with accepted academic practice. No use, distribution or reproduction is permitted which does not comply with these terms.
*Correspondence: Zhifang Zhao, emhhb3poaWZhbmdAeW51LmVkdS5jbg==
 Yuan Yao
 Zhifang Zhao1,4*
 Guangming Wang
