- 1College of Energy, Chengdu University of Technology, Chengdu, China
- 2State Key Laboratory of Oil and Gas Reservoir Geology and Exploitation, Chengdu University of Technology, Chengdu, China
- 3Chengdu Longstar Natural gas liability Co., Ltd., Chengdu, China
Tight gas sandstone represents a significant unconventional resource extensively discovered across numerous sedimentary basins around the world. Tight sandstone reservoirs are characterized by low porosity, low permeability, variable source material, rapid spatial and temporal changes, poor reservoir properties, and strong heterogeneity. Traditional geophysical methods struggle to meet the demands of exploration and development of these types of reservoirs. This study applies a high-precision comparative approach using well-seismic integration to establish a relative isochronous stratigraphic framework. Based on this framework, extracting seismic properties can effectively predict tight sandstone reservoirs. This paper, focusing on the Penglaizhen Formation in the Luodai Gas Field of the Western Sichuan Jurassic system. This entire process accomplished in three steps: starting with regional marker layers as the initial framework; followed by the establishment of a relative isochronous framework through precise well-seismic integration; and finally stratigraphic slicing techniques to delineate isochronous stratigraphic framework with shorter time intervals. Thereby enhancing the reliability of subsurface stratigraphic information and data accuracy. The study posits that current technological means cannot create a truly isochronous stratigraphic framework; thus, “isochronous” is considered a relative concept in this context. The framework aims to ensure temporal consistency by minimizing discrepancies through mutual constraints between well and seismic data, serving to exploration and development requirements. Furthermore, analyses such as sensitive attribute extraction, impedance inversion, and assessment of hydrocarbon potential in tight sandstone reservoirs demonstrate strong correlation with drilling results. This validation underscores the framework’s efficacy in interpreting industrial gas production flows, thereby providing robust support for future oil and gas exploration.
1 Introduction
The Luodai Gas Field in the Western Sichuan Basin is rich in Tight thin gas resources, characterized by sand bodies typically thinner than one-quarter of a wavelength. The Luodai gas field is situated in the southeastern corner of the middle section of the West Sichuan Depression within the Sichuan Basin. The reservoir is predominantly located in the Jurassic Penglaizhen Formation and Suining Formation, the sedimentary facies are mainly of the shallow-water delta type (Zhu et al., 2010). Despite extensive research on the Western Sichuan Jurassic Tight thin sandstone reservoirs in recent years, problems in their exploration and development persist: multiple sand bodies within a single sand group complicate depositional microfacies delineation; the thinness of sand bodies (less than 1/4 wavelength) means that seismic reflections from the top and bottom of layers do not reflect true geological information (the phenomenon of seismic wave superposition interference occurs when the two-way travel time distance between the upper and lower reflection interfaces is shorter than the wavelet length), and it cannot ensure that the interpreted horizon is formed at the same time. The aims of this work establishing an effective isochronous stratigraphic framework to enhance the accuracy of depositional microfacies delineation and meet exploration and development needs.
The establishment of an isochronous stratigraphic framework is key and a prerequisite for the study of seismic stratigraphy and seismic sedimentology. It not only reflects subsurface geological information but also plays a crucial role in understanding the evolution of depositional structures, preventing multiple interpretations in lithologic identification (Zhu et al., 2011; Zeng and Kerans, 2003; Zeng, 2011). Since the 1970s, many experts have deeply studied isochronous stratigraphic frameworks, discussing whether seismic reflection phase axes can represent isochronous layers (Yang et al., 2013). Vail and others believe that seismic in-phase axes are isochronous (Vail and Mitchum, 1977). (except at unconformities); Brown and others argue that unconformities are often transgressive (except at fluid interfaces), and it is generally believed that the seismic response of stratigraphic interfaces is isochronous (Brown and Fisher, 1980). Zhu and others think that phase axes fundamentally reflect the isochronous framework (Zhu et al., 2013; Zhu et al., 2018). Zeng and others argue that the frequency of seismic data controls the angle and internal reflection structure of seismic reflection phase axes. Low-frequency seismic data tend to indicate lithologic significance, while high-frequency seismic in-phase axes reflect isochronous depositional interfaces (Zeng and Kerans, 2003). Zeng posits that the assertion that seismic in-phase axes and chronostratigraphic interfaces coincide is only suitable for low-level sequences (third-order sequences) or sedimentary layers thicker than 50 m (Zeng and Kerans, 2003). Therefore, seismic in-phase axes cannot be equated with isochronous stratigraphic frameworks. In other words, seismic event are only isochronous under specific conditions.
In terms of research methods, precise well-seismic calibration is crucial. By accurately matching well data in the depth domain with seismic data in the time domain and adjusting them mutually through feedback, the established time-depth relationships endow seismic data with geological significance (Shi et al., 2022). On this basis, Huang Renchun and others established a high-precision isochronous sequence stratigraphic framework through wavelet analysis of high-frequency layer sequences in 2019, which remains an effective method for studying isochronous stratigraphic frameworks today (Huang et al., 2019). Wavelet transforms enable time-frequency localization of well log signals, allowing for the extraction of stratigraphic time-frequency characteristics from well data, thereby obtaining geological features such as the cyclicity of sedimentary sequences. However, attribute extraction for large segments is challenging to reveal their spatial changes. Dong Jianhua and others also proposed building an isochronous stratigraphic framework using typical marker layers based on precise well-seismic calibration in 2018. Under the control of an existing isochronous framework, finer seismic stratigraphic slices are extracted (Dong et al., 2018). But the time spans between various marker layers are often large, making it difficult to achieve expected results with stratigraphic slicing based on an isochronous framework. Combining previous research, under an initial isochronous framework based on marker layers, the integration of well-seismic feedback and high-precision comparison can better constrain the isochronous nature after stratigraphic slicing, making the depiction of depositional facies more precise and the predictions more accurate.
2 Geological setting
The thickness of the Jurassic strata in the western Sichuan Depression is large, ranging from 2000 to 4,400 m, encompassing the lower Jurassic Baitianba Formation, the Middle Jurassic Qianfoya Formation and Shaximiao Formation, as well as the Upper Jurassic Suining Formation and Penglaizhen Formation (Hu et al., 2018). The western Sichuan Depression mainly formed after the Late Triassic and experienced three major tectonic cycles: Indosinian, Yanshanian and Alpine. In the late Middle Jurassic, under the influence of the Yanshan Movement, the eastern part of the basin was uplifted, and the former fluvial environment became a large lake, which deposited the main muddy formation of the Suining Formation, and then began to retreat, and deposited the sand-mudstone interlayer of the Penglaizhen Formation, which was widely developed in the fluvial delta facies.
The Luodai gas field is located in the eastern slope tectonic margin of the central depression belt (Figure 1), which is a nose-shaped anticline to the northeast, a complex tectonic belt of Longquanshan thrust to the east, and the east wing of Deyang-Pengxian syncline to the west.
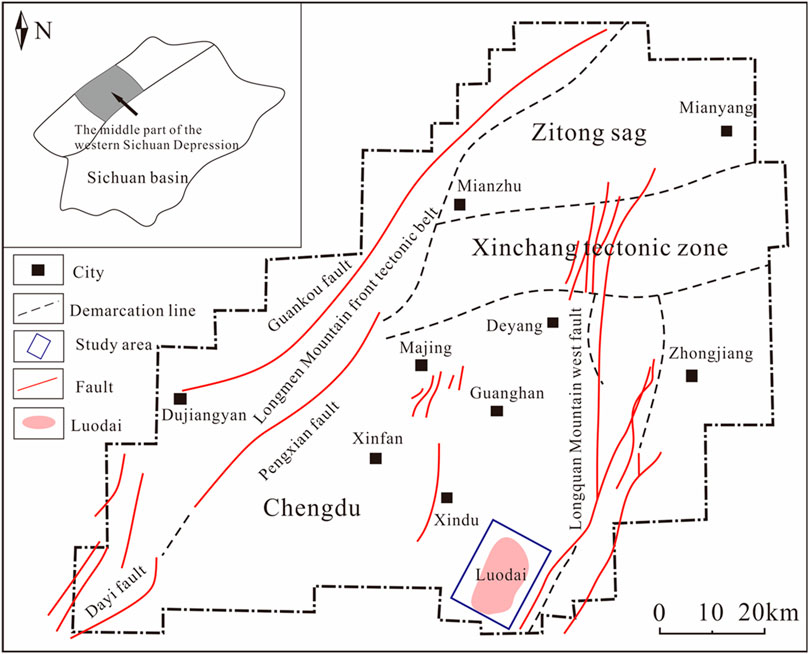
Figure 1. Regional structural division map of the central section of the Western Sichuan Depression (According to Hu et al., 2018; modified by Yang et al., 2018).
According to sedimentary cyclicity, previous researchers have subdivided the Penglaizhen Formation from bottom to top into four segments: Peng 1, Peng 2, Peng 3, and Peng 4. The entire Penglaizhen Formation has a thickness of about 900 m, consisting primarily of light gray, brown-gray fine to powder sandstones interbedded with brownish-red mudstones.
3 Data and methods
The 3D seismic data used in this study covers an area of about 200 square kilometers, the time depth includes the whole Penglaizhen Formation in the study area, and the main frequency is 40 Hz. The logging data of 40 representative Wells (including natural gamma curve, sonic lag curve, resistivity curve, etc.) were selected.
Based on the comprehensive analysis of lithology, seismic and logging data of Penglaizhen Formation in western Sichuan studied by predecessors, the position of marker layer in the three-dimensional seismic data of Penglaizhen Formation in the study area is determined, and it can also be used as the initial frame of isochronous stratigraphic framework.
Synthetic seismogram is an important “bridge” for the combination of well and earthquake, and also lays a foundation for the further subdivision of the initial isochronous stratigraphic framework. In this paper, 35 Hz Ricker theoretical wavelet is used to make a synthetic record and complete the well seismic calibration.
The purpose of the high-precision correlation of well shock cross-feed fusion lies in the close combination of earthquake and geology, which mainly takes advantage of the wide coverage of 3D seismic data, the advantages of lateral traceable and the advantages of longitudinal high resolution logging data. In the case of tight and thin sandstone reservoirs, the vertical resolution of seismic data will be multiple. Combined with the high vertical resolution of logging data, the longitudinal resolution of 3D seismic data can be improved indirectly through the combination of well pattern and sand body correlation between adjacent Wells, and the synthetic recording and calibration technology, and the isochronous stratigraphic framework can be established within the initial framework.
Finally, the formation slices are made in Geoscope software, and the isochronous stratigraphic framework established by well-vibration mutual feed fusion and high-precision correlation is further subdivided to obtain an isochronous stratigraphic framework with shorter time intervals.
4 Results
4.1 Marker layer division
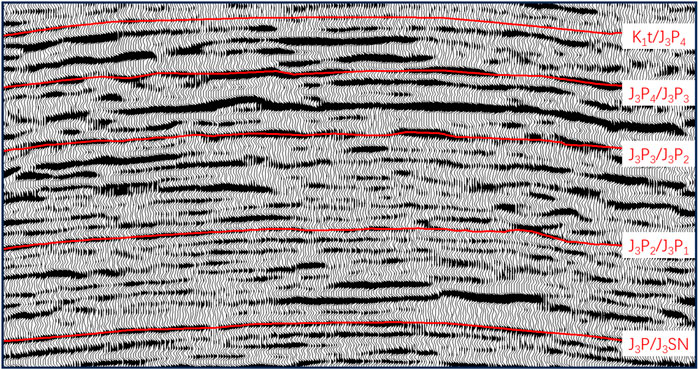
Marker layers, characterized by stable lithology, distinct features, and widespread distribution, are commonly used as benchmarks for isochronous stratigraphic divisions (Cui et al., 2023). The Penglaizhen Formation of the Western Sichuan Jurassic system mainly develops interbedded brown-gray fine to powder sandstones and brownish-red mudstones, with occasional thick layers of fine-grained feldspathic quartz sandstones. It often uses regional shales at Cangshan, Lishuwan, and Jingfuyuan for stratigraphic division (Yang et al., 2010). In the Luodai Gas Field, Tight thin sandstones in the Penglaizhen Formation are characterized by stacked and merged sand bodies, with a sedimentary period of about 9.70 Ma (154.7–145 Ma) (Qiu and Fu, 2000). Based on this, combined with well log response characteristics, seismic responses, and lithological differences above and below, the top and bottom boundaries of the Penglaizhen Formation are identified and subdivided from bottom to top into four segments: Peng 1, Peng 2, Peng 3, and Peng 4 (Figure 2).
4.1.1 Interface between Penglaizhen Formation and underlying Suining Formation (J3P/J3SN)
Lithological markers: The Peng 1 segment has an average thickness of about 330 m. The bottom of the formation develops light green, thick-layered, blocky, fine-grained calcareous powder sandstone; the middle mainly develops thick-layered, blocky, brownish-red sandstone and mudstone, with sandstone thicknesses varying from a few meters to over 20 m, showing parallel bedding and other features; the top is 4–6 m thick gray-green, yellow-green shale interbedded with thin-layered powder sandstone and mud limestone, known as “Cangshan Shale” (Zhao, 2013).
Seismic markers: The reflection interface is relatively stable, characterized by medium-strong amplitude, medium-low frequency, and medium-high continuous reflection structure (as shown in Figure 2).
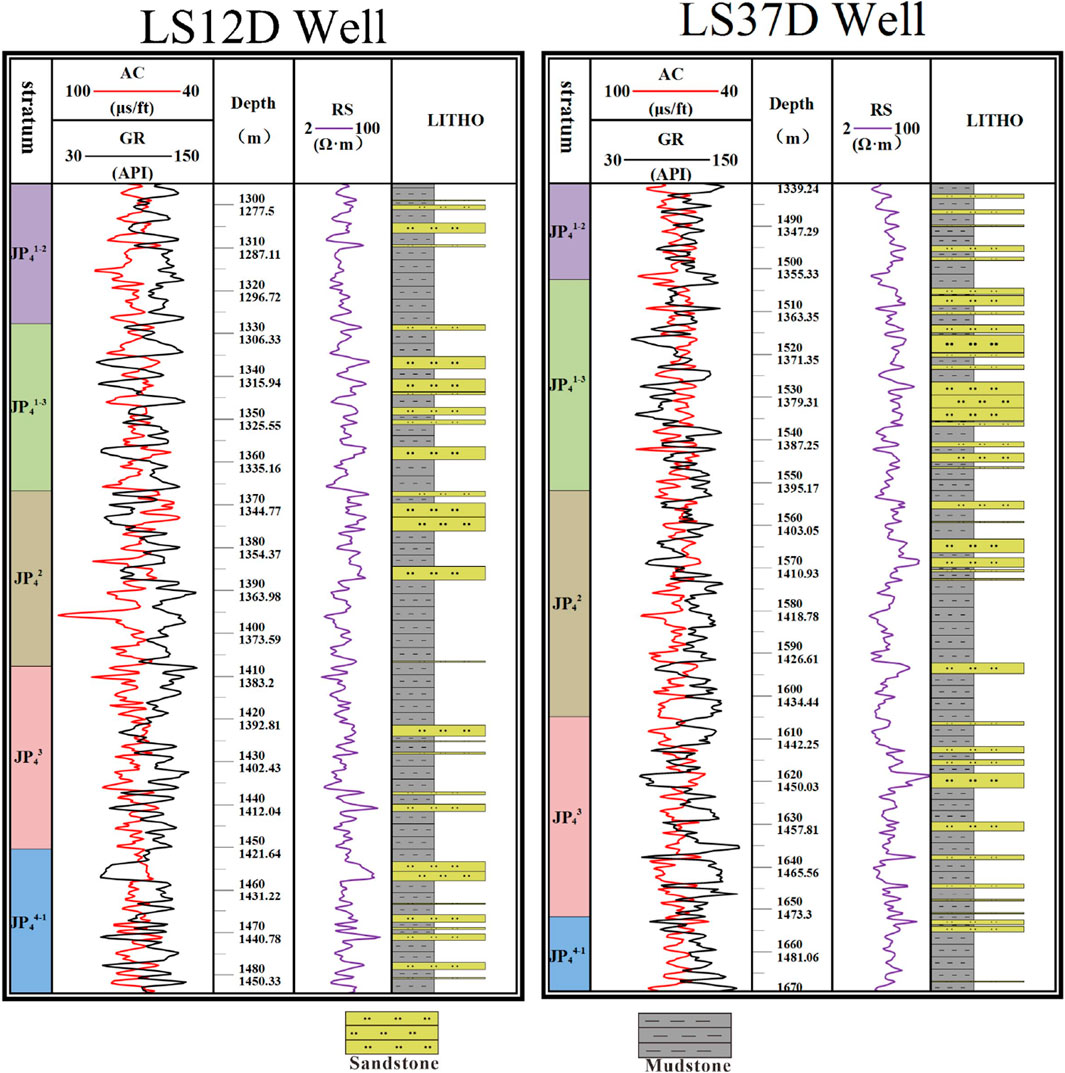
Well log markers: There is a clear abrupt contact relationship above and below the interface. The bottom of the overlying Penglaizhen Formation shows a relatively clear high-amplitude spiky well log characteristic, with natural gamma displaying low values. The top of the underlying Suining Formation has a large suite of mudstones with low-amplitude weakly toothed columnar well log characteristics, with high natural gamma values. The two are demarcated by “Penglaizhen Formation Sandstone,” with well log curves showing distinct differences (Figure 3A).
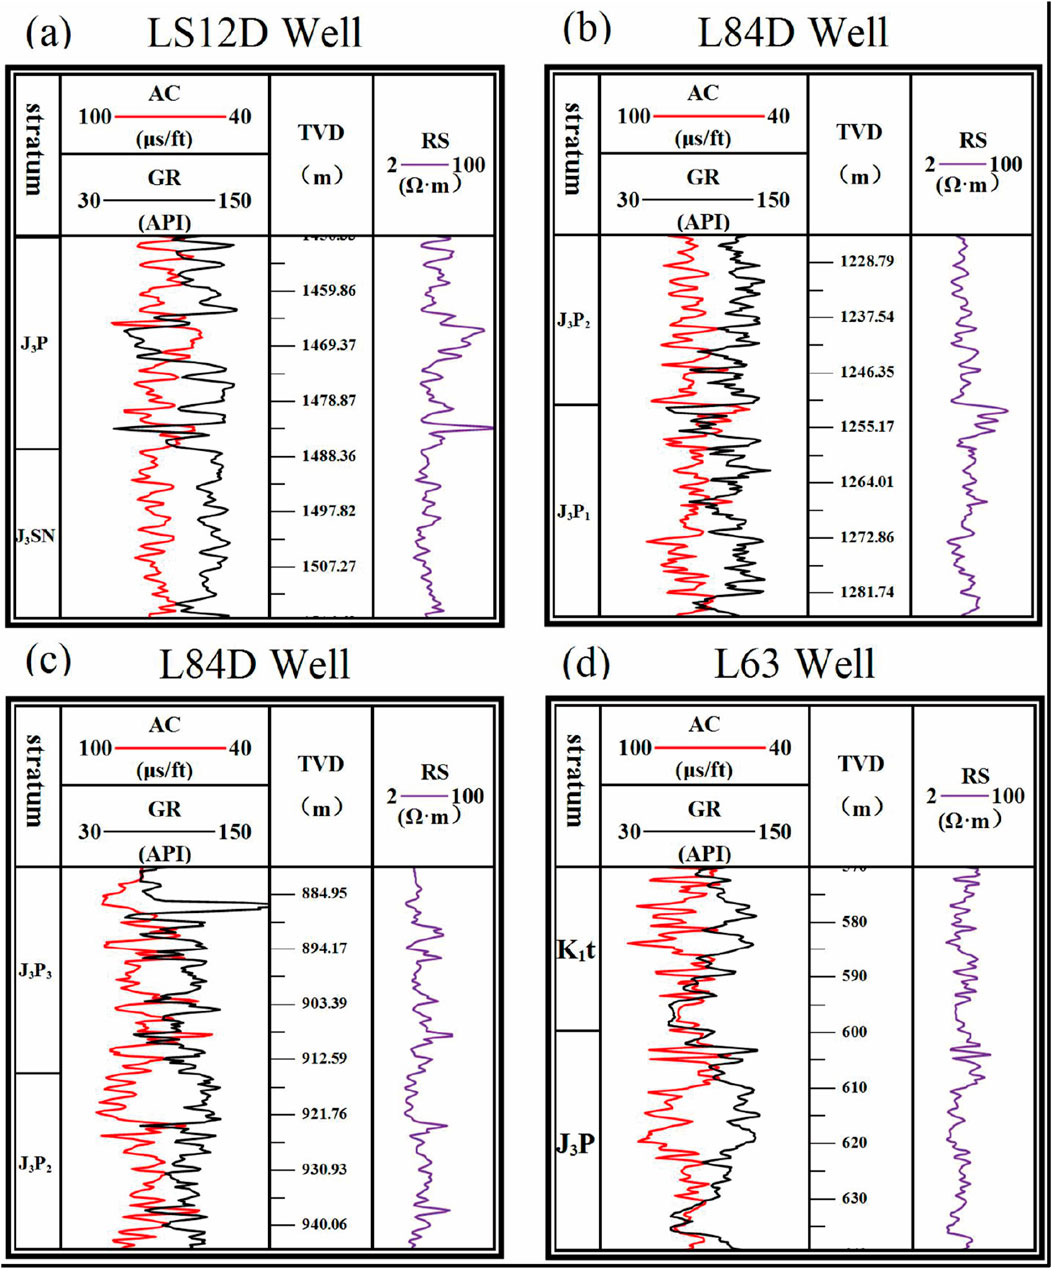
Figure 3. (A) Characterization of logging curve for well LS12D. (B) Characterization of logging curve for well L84D. (C) Characterization of logging curve for well L84D. (D) Characterization of logging curve for well L63.
4.1.2 Interface between peng 2 and peng one segments (J3P2/J3P1)
Lithological markers: The Peng 2 segment has an average thickness of about 300 m, with the top of “Cangshan Shale” as the base. It mainly develops light green fine sandstone, powder sandstone, and brownish-red mudstone, interbedded with brown-gray fine-grained lithic quartz sandstone, and locally includes coarse powder sandstone containing hard gypsum. The top develops about 3 m thick yellow-gray foliated “Lishuwan Shale” (Zhao, 2013).
Seismic markers: This interface shows medium-weak amplitude, medium-low frequency, and high continuous reflection characteristics compared to the J3P/J3SN reflection interface (as shown in Figure 2).
Well log markers: The bottom of the Peng 2 segment typically shows low-amplitude tooth-shaped spiky features on well log curves, with large AC values and high natural gamma values (Figure 3B).
4.1.3 Interface between peng 3 and peng 2 segments (J3P3/J3P2)
Lithological markers: The Peng 3 segment has an average thickness of about 190 m. The middle and lower parts of the formation develop rhythmically interbedded uneven-thickness purplish-red mudstone, powder siltstone, and silty powder sandstone. The middle and upper parts of the formation mainly develop thick-layered blocky, light green-gray fine-grained feldspathic lithic sandstone. The top develops widely distributed, about 4 m thick, dark gray “Jingfuyuan Shale,” the maximum lacustrine surface product (Zhao, 2013).
Seismic markers: This interface shows strong amplitude, medium-low frequency, and medium continuous reflection characteristics compared to the J3P/J3SN reflection interface (as shown in Figure 2).
Well log markers: There is a clear abrupt contact relationship above and below the interface. The “Taihe Town Sandstone” above the interface shows relatively clear weakly toothed bell-shaped well log characteristics, with low natural gamma values. The Peng 2 segment strata below the interface show low-amplitude columnar well log characteristics (Figure 3C).
4.1.4 Interface between cretaceous and Penglaizhen Formation (K1t/J3P)
Lithological markers: The Peng 4 segment has a thickness of about 170 m, with the top of “Jingfuyuan Shale” as the base, thicker in the west and thinner in the east. It develops light green-gray, light brown-gray powder sandstone and red-brown, purple-brown mudstone interbedded, with localized calcareous nodules, occasionally interbedded with lens-shaped mud limestone and light green shale. The grain size gradually increases upward, showing scouring structures, parallel bedding, and other features (Zhao, 2013).
Seismic markers: The seismic profile shows a relatively continuous reflection interface, with obvious overstepping phenomena, which are signs of sedimentary interruptions (as shown in Figure 2).
Well log markers: There is a clear abrupt contact relationship above and below the interface. The base of the Cretaceous above the interface often contains gravel, with low natural gamma values, high amplitude box-shaped or bell-shaped, and huge amplitude resistivity, low acoustic. The top of the Penglaizhen Formation below the interface consists of mudstone or sand-mud interbedded deposition, with well log curves showing low amplitude, weakly toothed characteristics (Figure 3D).
4.2 Synthetic seismic record calibration
Synthetic seismic records are created by constructing impedance curves and reflection coefficient sequences from well acoustic and density data, which are then convolved with seismic wavelets to produce synthetic seismic traces. These traces are compared with adjacent seismic traces to endow seismic data with geological attributes (Benac et al., 2023; Lu et al., 2020).
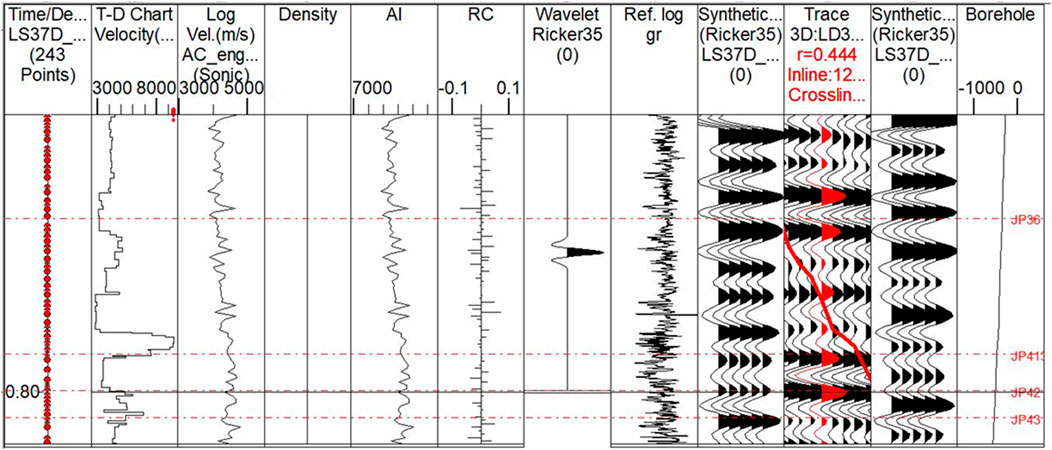
Wavelet extraction is a crucial step in the production of synthetic seismic records. Typically, the method of wavelet extraction is determined based on the quality of the seismic time profile. When seismic data quality is good, seismic wavelets can be extracted using adjacent seismic traces; if the quality is poor, the frequency spectrum of the seismic source wave in the study area can dictate the frequency band range of the seismic wavelets. In this paper, zero-phase seismic wavelets extracted from adjacent seismic traces and Ricker wavelets at 15 Hz, 35 Hz, and 55 Hz were used to create corresponding synthetic records, with the 35 Hz Ricker wavelet showing the best match with the frequency relationship of the seismic time profile. In the conversion of geological information to seismic information, it is necessary to establish a time-depth relationship, allowing the transformation of well depth domain information to seismic time domain information, which underscores the importance of synthetic records. For instance, the LS37D well shows good matching in terms of phase axes, energy, and wave group relationships (Figures 4–6).
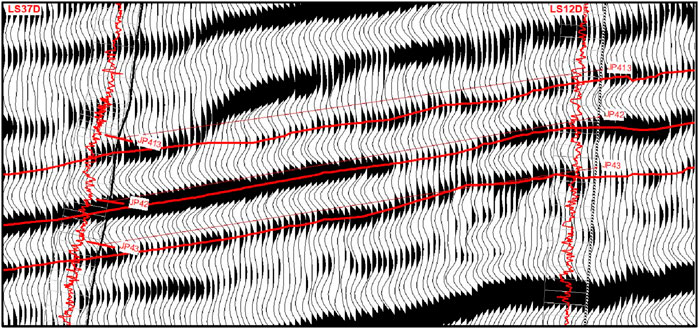
Figure 6. Seismic profile from LS37D to LS12D well (note: The red curve depicted represents the gamma ray curve, while the black line indicates the well trajectory.).
4.3 Establishment of the isochronous stratigraphic framework through high-precision well-seismic integration
The principle of high-precision well-seismic integration: (1) Under the results of synthetic seismic record calibration, a sand layer group corresponds to a separate seismic phase, so the comparison of results between adjacent wells within a seismic phase are more accurate. (2) Seismic horizons in a seismic profile may bifurcation, merge, or terminate, making layer tracking prone to misjudgment. Under synthetic seismic record calibration, fine comparison between adjacent wells can make layer tracking more reliable and the interpreted layers more isochronous. Thus, well and seismic data mutually enhance each other’s accuracy through feedback, achieving high-precision comparison.
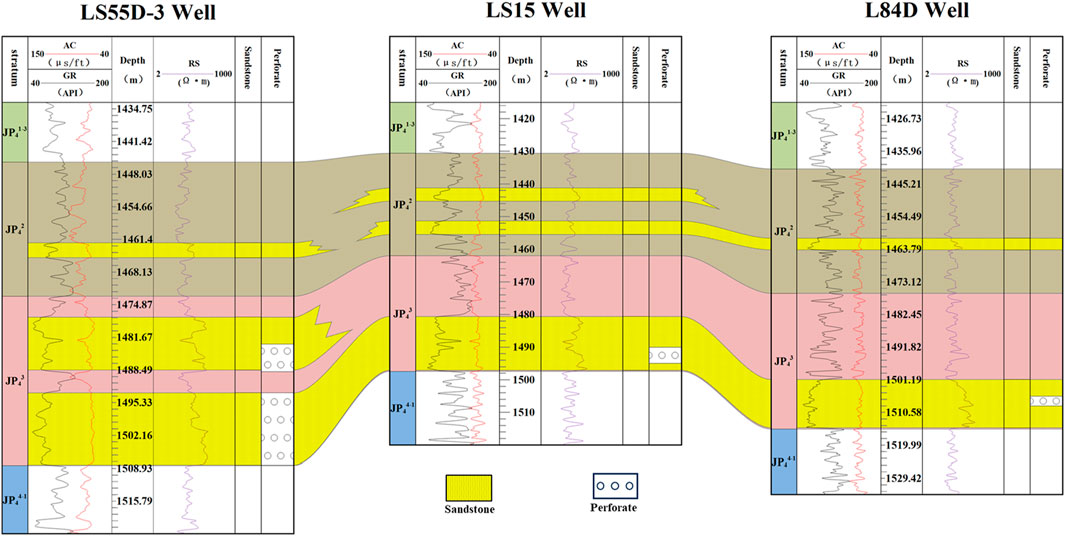
Through specific data analysis, key geological information can be obtained from the 3D seismic data and synthetic seismic record calibration results (Figure 7): (1) The thickness of the sand layer group for each well, JP43, is determined by the duration of the seismic profile; (2) Based on the continuity of the seismic horizons, it is determined that the sand bodies in the JP43 sand layer group of these three wells are continuous and believed to have been deposited during the same time period. This constraint allows for precise depiction in the cross-well comparison of wells LS55D-3, LS15, and L84D.
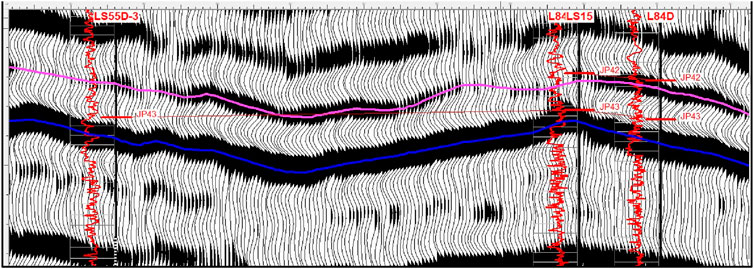
Figure 7. Seismic profiles across wells LS55D-3, LS15, and LS84D. (note: The red curve depicted represents the gamma ray curve, while the black line indicates the well trajectory).
The cross-well comparison diagram can determine the position of sand bodies within a sand layer group but cannot precisely determine the top and bottom positions of the layers. Often, the continuity of individual sand bodies within a sand layer group is difficult to judge. In Figure 8, firstly, the thickness of the JP43 sand layer group is used as a constraint, combined with single well layer division, to determine the top and bottom positions of the JP43 sand layer group for the three wells; secondly, through the similarity of GR curves combined with the continuity of seismic horizons, it is determined that the lower sand body in the JP43 sand layer group of well LS55D and the single sand bodies in the JP43 sand layer group of wells LS15 and L84D belong to the same river channel sand, believed to have formed during the same period, making the cross-well comparison diagram more reflective of the depositional microfacies.
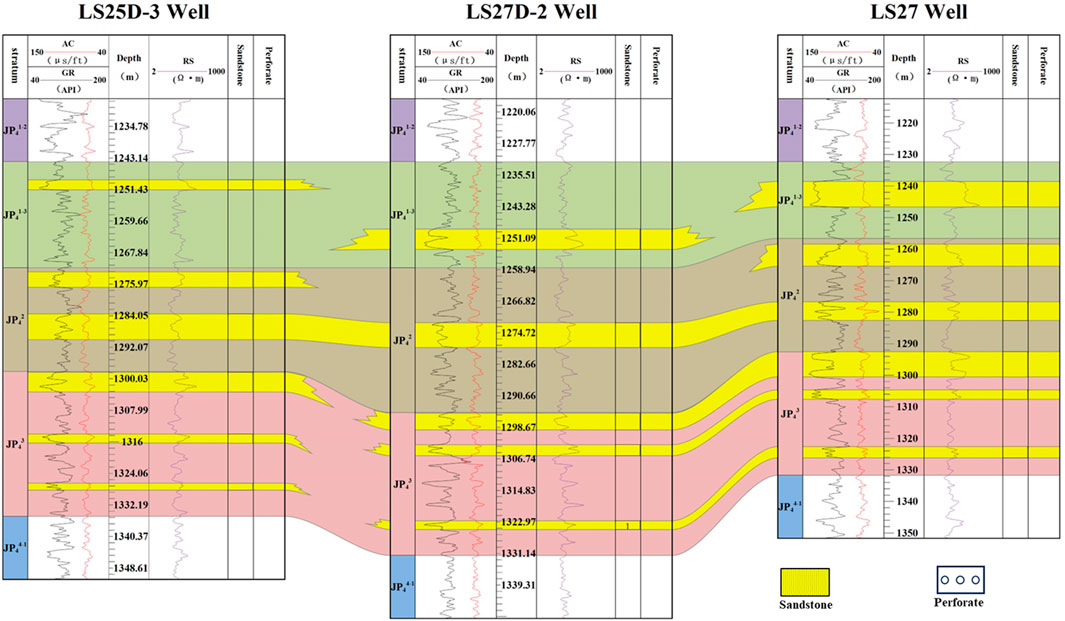
In the cross-well comparison diagram in Figure 9, two geological pieces of information can be obtained: (1) There is a sand body with good continuity at the top of the JP42 sand layer group between wells LS25D-3 to LS27, with similar GR curves, suggesting that these two sets of sand were deposited during the same time period; (2) There are two sets of mud-interbedded sand bodies at the top of the JP42 sand layer group between wells LS25D-3 to LS27. Comparing the entire GR curve section, these two sets of mud-interbedded sand bodies are judged to have been deposited during the same time period.
Figure 10: Seismic profile across wells LS25D-3 to LS27. It is not difficult to discern from the diagram that between wells LS25D-3 and LS27D-2, the seismic in-phase axes of layers JP41−3 and JP42 merge into a single phase axis. At this point, combining the geological information obtained from Figure 9, it can be determined during layer interpretation that this merged phase axis should be classified at the JP42 layer. At the same time, between these two wells at the JP41−3 layer, the continuity of seismic in-phase axes is very poor, and seismic layer tracking is prone to misinterpretation. Combining the geological information from Figure 9 with the synthetic seismic records, accurate layer interpretation can be ensured, ensuring that the tracked layers are isochronous within a short time period.
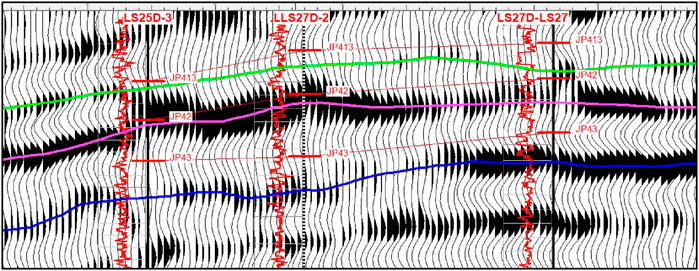
Figure 10. Seismic profile across wells L656 and LS46D. (note: The red curve depicted represents the gamma ray curve, while the black line indicates the well trajectory).
Combining geological, well logging, and seismic data for comprehensive comparative analysis, a cross-well comparison framework is established. In selecting cross-well comparison profiles, control wells covering the entire area are selected, and based on the fine seismic calibration of the target sand layer group and cross-well comparison tracking, the accuracy of cross-well sand body and minor layer comparisons is enhanced by seismic constraints, establishing a high-precision isochronous comparison framework consistent with well-seismic data, providing a basis for qualitative and quantitative reservoir prediction.
Taking the seismic profiles of the three east-west lines and the four northeast-southwest lines as examples, a three-dimensional display (Figure 11) is conducted to visually represent the longitudinal and transverse distribution characteristics and variations of sand bodies. The longitudinal high resolution of logging data is used to improve the isochronicity of stratigraphic framework.
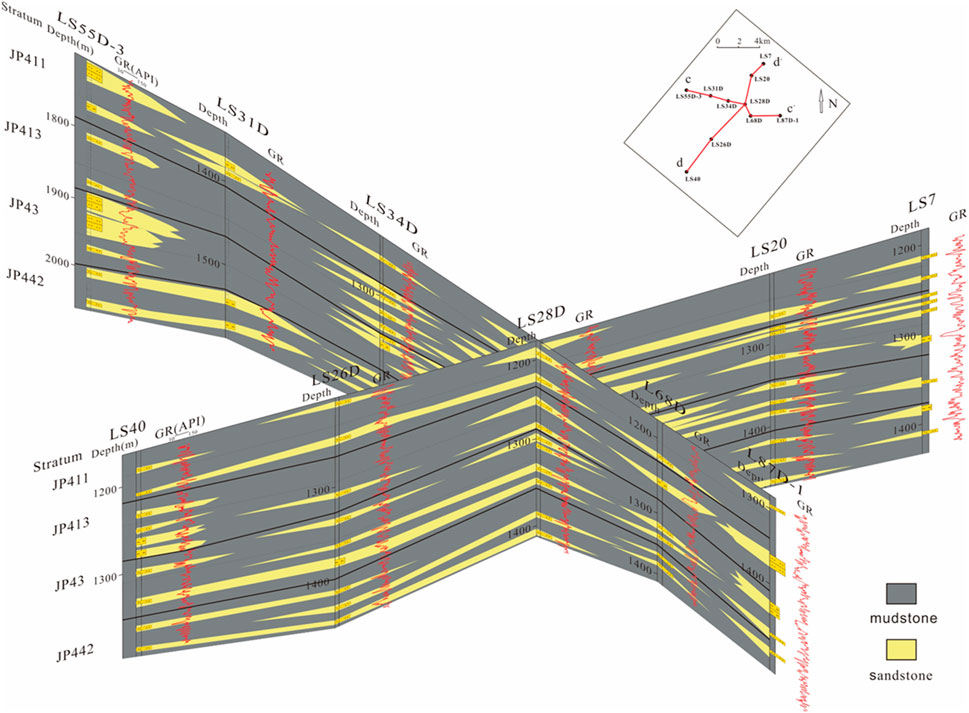
Figure 11. The three-dimensional display of the continuous well seismic profiles of the east-west 3 lines and the northeast-southwest 4 lines of the Penglai Town Formation, Luodai Gas Field.
4.4 Stratigraphic slicing
In Tight thin sandstone reservoirs, sand bodies are generally thin, and some sand bodies show very poor continuity on 3D seismic profiles, appearing as lens-shaped waveforms in isolated small segments. Under these conditions, the isochronous stratigraphic framework established through high-precision well-seismic integration cannot accommodate such cases; high-precision well-seismic integration is conducted under the premise that seismic in-phase axes are relatively continuous, otherwise, in most cases where seismic in-phase axes are missing, using lateral comparisons between adjacent wells as constraints for layer interpretation becomes meaningless. Adding stratigraphic slicing further subdivides layers, obtaining a shorter time interval isochronous stratigraphic framework, not only improving the reliability of subsurface stratigraphic information and data accuracy but also explaining hard-to-track thin sand layers.
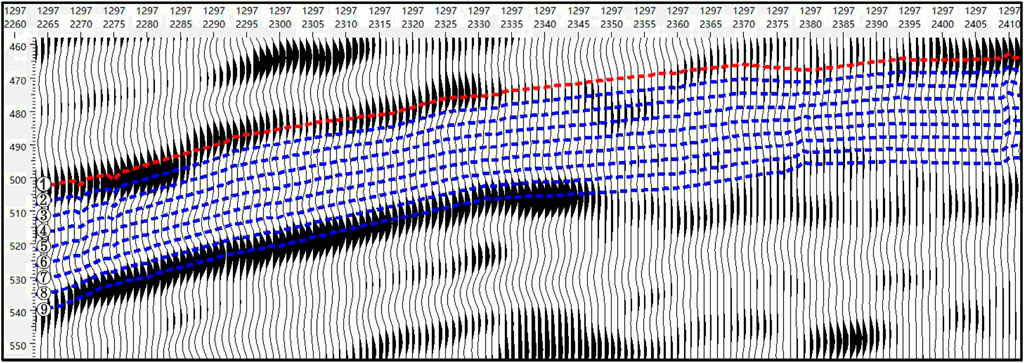
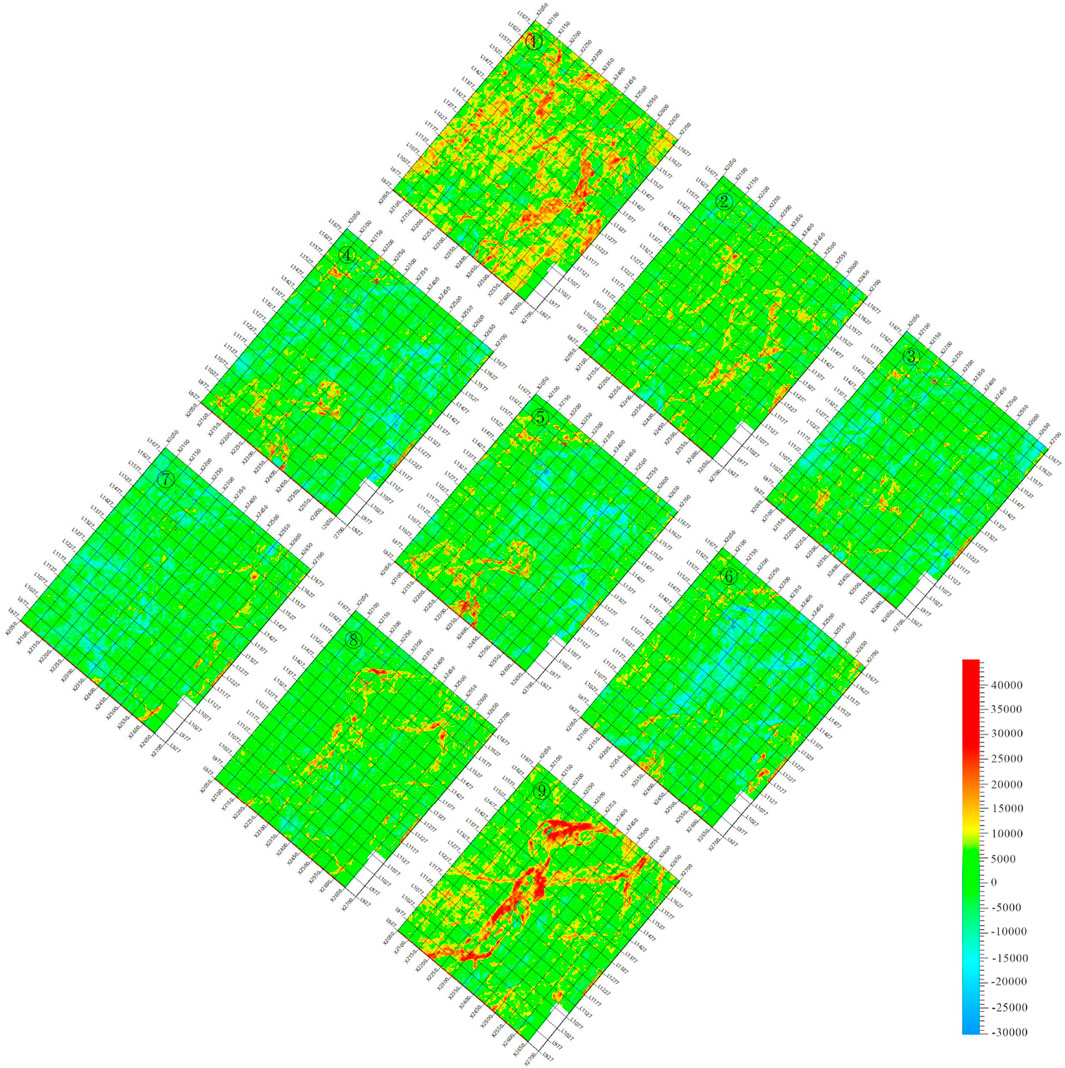
Figure 12: Stratigraphic slice profile between layers JP31 and JP33−1, showing that based on the isochronous stratigraphic framework established through high-precision well-seismic integration, using stratigraphic slicing technology for isochronous interpolation assigns a relative geological time scale to stratigraphic interfaces, further narrowing the isochronous time interval (about 77,000 years). At the same time, stratigraphic slicing can depict the vertical evolution and changes of sedimentary sand bodies. Figure 13 shows the stratigraphic slicing from the base of the Penglaizhen Formation JP33−1 layer to the top surface of the JP31 layer. From layers JP31 to JP33−1, nine stratigraphic slices are selected from bottom to top. It can be seen that the stratigraphic slice in Figure ⑤ corresponds to the JP32 layer. The seismic profile for this layer shows very poor continuity of phase axes. The isochronous stratigraphic framework established through high-precision well-seismic integration does not demarcate the JP32 layer. After stratigraphic slicing, the development scale, position, and distribution characteristics of the JP32 distributary channel sand body can be clearly seen. Studies have shown that stratigraphic slicing technology not only can establish a shorter interval isochronous stratigraphic framework but also effectively guide the depiction of sand body distribution and vertical evolution analysis.
4.5 Predictive analysis of tight thin sandstone reservoirs within the isochronous stratigraphic framework
The previous section revealed that establishing a high-precision isochronous stratigraphic framework in Tight thin sandstone reservoirs is necessary. Therefore, it is also essential to verify the effectiveness of the established isochronous stratigraphic framework in exploration and development. Seismic attribute analysis, impedance inversion, and hydrocarbon analysis are key factors in predicting Tight thin sandstone reservoirs (Gao et al., 2019; Guo et al., 2023). Combining drilled well data can validate whether the isochronous stratigraphic framework established through high-precision well-seismic integration meets exploration and development needs.
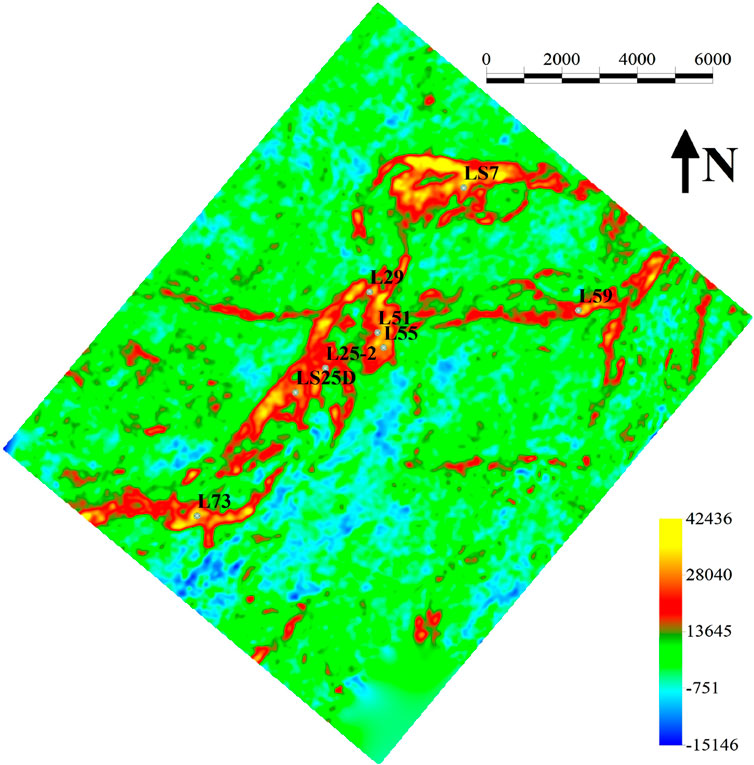
The Luodai Gas Field’s Penglaizhen Formation represents a delta front sub-facies, with sand bodies being Tight thin and thin, and the phenomenon of sandstone and mudstone interbedding is severe (Luo et al., 2006). Amplitude attributes are not affected by seismic phase and can differentiate mudstone and sandstone (Liu et al., 2011). The maximum amplitude characteristic is more sensitive to sandstone. This characteristic can identify bright and dim spots in the formation, clearly distinguishing meandering river depositional microfacies types. Selecting amplitude attributes for seismic attribute analysis is most suitable. Figure 14 shows the maximum amplitude attribute map extracted based on the established isochronous stratigraphic framework.
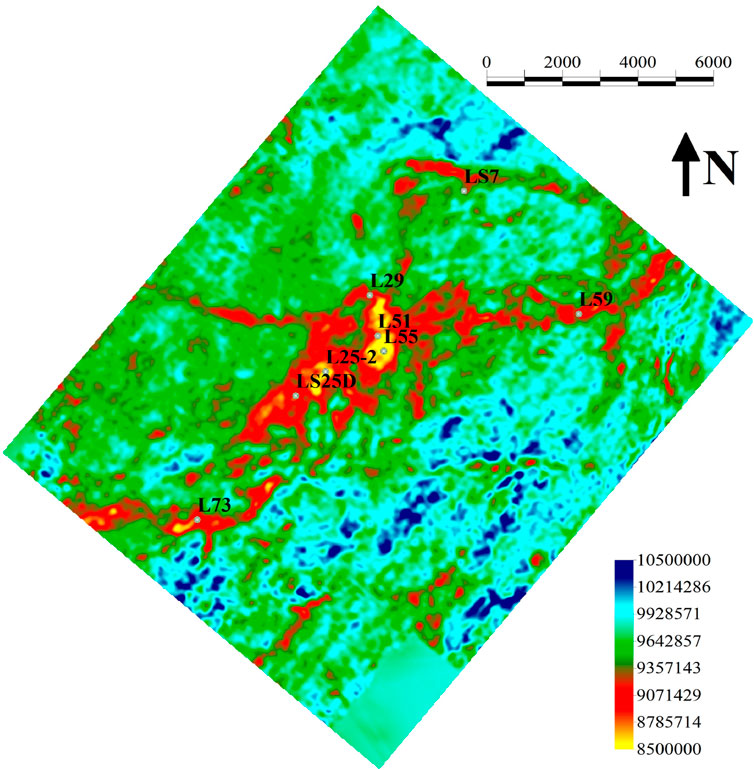
Impedance inversion uses the sparse spike inversion method. In establishing the initial model, high-resolution well log data vertically combined with continuously changing seismic interfaces laterally are used. This model can better reflect the geological characteristics of the sedimentary body. In Tight thin sandstone reservoirs, sandstone appears as low impedance, while mudstone appears as high impedance (as shown in Figure 15).
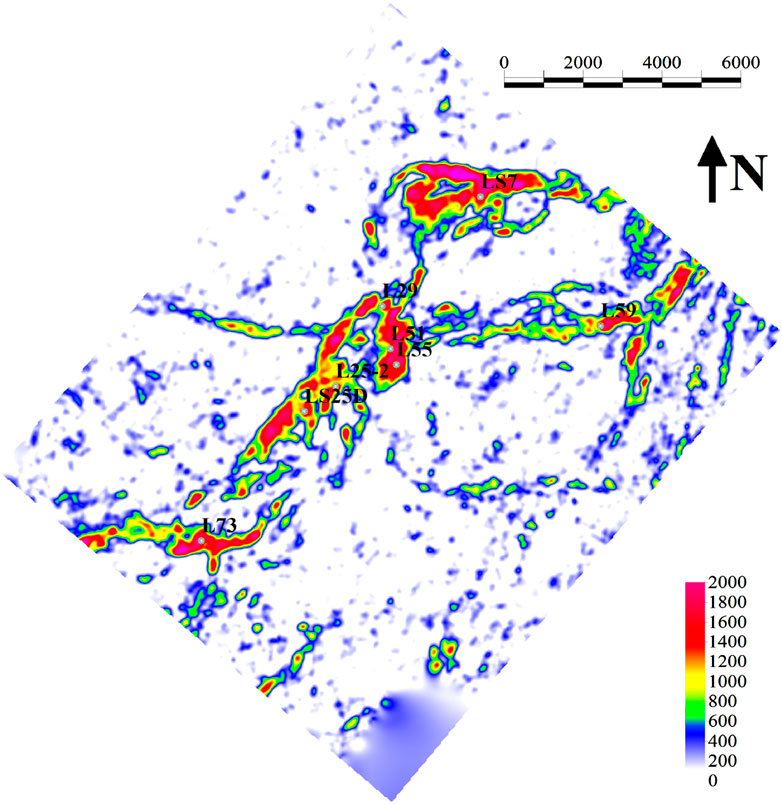
This study uses dual-medium oil and gas detection technology (Zhang et al., 2010), which can accurately depict the distribution of gas-bearing sand bodies (as shown in Figure 16). The principle is that when the relative velocity of movement between fluid and solid particles is slow, i.e., when the fluid is fixed within the skeleton, seismic wave attenuation is minimal, and amplitude is maximal. This phenomenon, known as “resonance,” mainly appears at a specific low frequency of seismic waves. As the frequency increases, due to inertial effects, the relative velocity of movement between fluid and solid also increases. At a certain frequency point, seismic wave attenuation reaches its maximum, and amplitude decreases, known as high-frequency attenuation. When the fluid is oil and gas, the seismic records will display more apparent “low-frequency resonance, high-frequency attenuation” dynamic characteristics.
Combining analysis of drilling test situations in the Luodai area (Table 1), it is evident that the seismic attributes extracted, impedance inversion results, and oil and gas distribution based on the high-precision well-seismic integration-established isochronous framework match very well with the actual drilled wells, increasing the credibility of the Tight thin sandstone reservoir predictions.
5 Discussion
In the study of Tight thin sandstone reservoirs, individual layer thicknesses are often less than 10 m, and gas-bearing sand bodies below 5 m are very common in the Luodai Gas Field (λ values approximately range from 30 m). These sand bodies have layer thicknesses far below the vertical resolution limit of 3D seismic data λ/4 (λ being the length of the seismic wavelet), making it difficult to display them independently as “seismic in-phase axes” on seismic profiles. Moreover, the porosity and permeability of these sand bodies are extremely low, generally reducing the efficiency of exploration and development. In Tight thin sandstone reservoirs, the higher the isochronism of the established stratigraphic framework, the higher the match of the predicted results.
Isochronism in the isochronous stratigraphic framework has always been a subject of study by many experts and scholars. Although it is currently impossible to establish a truly isochronous stratigraphic framework, after a long period of research by experts and scholars, the methods summarized generally fall into two categories: (1) By improving geophysical methods, continuously enhancing the resolution of 3D seismic data, and minimizing the interference of seismic wavelets with each other; (2) By subdividing research units as finely as possible to ensure that the position of stratigraphic slices matches the depositional time interface of the target sand body (Liu et al., 2018).
In other studies around the world, Harishidayat has improved 3D seismic interpretation by integrating seismic data, well logging data, and analog data to comprehensively analyze the sedimentary morphology and evolution of the mid-Late Triassic river system in the Hammerfest Basin, east of the Barents Sea, using a variety of geophysical methods (Harishidayat and Johansen, 2015). By analyzing the lacustrine delta-turbidite fan system of the third member of the Shahejie Formation (Es3 m) in the Dongying Sag, Bohai Bay Basin, eastern China, Lutome integrated seismic reflection data and well logging data to identify and map multiple fourth-order sequences. Then, the relative temporal geological model (RTG) was created to generate a high-quality and high-resolution geological consistency model through optimized interpretation methods, so as to achieve fine subdivision of the study unit and ensure the consistency of the sedimentary time interface (Lutome et al., 2020). Zeng’s analysis and reconstruction of the high frequency sequence stratigraphic framework in the Vermilion block off Louisiana identified and mapped the fourth level sequence and its system domain by focusing on horizontal seismic geometry information rather than traditional vertical seismic profiling, and reconstructed the high frequency sequence stratigraphic framework in a three-dimensional view of the seismic volume. Enable high-resolution formation analysis, especially in areas beyond logging control, to improve the accuracy of oil and gas reservoir prediction (Zeng and Hentz, 2004).
This study combines several methods, the Luodai Gas Field’s Penglaizhen Formation follows the principle of “big before small, hierarchical control, gradually refining” to establish a high-precision isochronous stratigraphic framework. This paper posits that the isochronous stratigraphic framework established through high-precision well-seismic integration is isochronous within the same time period, and stratigraphic slicing can further narrow this time period. In Tight thin sandstone reservoirs, this approach can depict hard-to-explain layers.
Of course, this method also has its limitations. Theoretically, the denser the well network in the work area, the higher the isochronism of the established stratigraphic framework. For research areas in the early stages of exploration and development, the applicability of the isochronous stratigraphic framework established by this method may not be high. Additionally, as geophysical technology continues to develop, combining technologies from other disciplines to improve the resolution of 3D seismic data and enhance stratigraphic slicing techniques can further improve the isochronism of the stratigraphic framework.
6 Conclusion
(1) Using the high-precision well-seismic integration comparative method, an isochronous stratigraphic framework was established. Based on this, seismic attribute extraction, impedance inversion, and oil and gas analysis were conducted for Tight thin sandstone reservoirs. Combining drilled well data, the method was validated as meeting the needs for predicting Tight thin sandstone reservoirs.
(2) This paper posits that “isochronous” in the establishment of an isochronous stratigraphic framework for the Western Sichuan Jurassic Tight thin sandstone is a relative concept. Theoretically, a time period can be infinitely subdivided, and it can be considered that sediments formed by the same event during a time period are contemporaneous and thus isochronous.
(3) The high-precision well-seismic integration comparative method mainly relies on the fact that a sand layer group corresponds to an independent seismic phase, so fine tracking of seismic phases can accurately determine sand layer group comparison. High-resolution well log data can accurately judge tracked layers when seismic in-phase axes cross, merge, or terminate, making the interpreted layers closer to isochronous.
(4) Achieving complete isochronism is very challenging. On the basis of the isochronous stratigraphic framework established through high-precision well-seismic integration, “gradually refining” production of stratigraphic slices assigns a relative geological time scale to stratigraphic interfaces, further narrowing the isochronous time interval. Combining stratigraphic slicing technology with high-precision well-seismic integration not only establishes a shorter interval isochronous stratigraphic framework but also enhances the accuracy of layer interpretation, avoiding “missing sand” phenomena during the interpretation process. Analyzing well-seismic data mutually adjusts and enhances data accuracy and reliability, providing a robust basis for oil and gas field exploration and geological research.
Data availability statement
The original contributions presented in the study are included in the article/supplementary material, further inquiries can be directed to the corresponding author.
Author contributions
LC: Conceptualization, Investigation, Methodology, Software, Validation, Writing–original draft, Writing–review and editing. WC: Conceptualization, Data curation, Formal Analysis, Methodology, Project administration, Writing–review and editing. LG: Data curation, Formal Analysis, Validation, Writing–review and editing. ZS: Data curation, Funding acquisition, Project administration, Resources, Writing–review and editing. LZ: Formal Analysis, Funding acquisition, Project administration, Resources, Writing–review and editing. LT: Data curation, Investigation, Validation, Writing–review and editing. DR: Investigation, Validation, Writing–review and editing. SJ: Formal Analysis, Investigation, Software, Writing–review and editing. HL: Investigation, Writing–review and editing.
Funding
The author(s) declare that no financial support was received for the research, authorship, and/or publication of this article.
Conflict of interest
Authors ZS and LZ were employed by Chengdu Longstar Natural gas liability Co., Ltd.
The remaining authors declare that the research was conducted in the absence of any commercial or financial relationships that could be construed as a potential conflict of interest.
Publisher’s note
All claims expressed in this article are solely those of the authors and do not necessarily represent those of their affiliated organizations, or those of the publisher, the editors and the reviewers. Any product that may be evaluated in this article, or claim that may be made by its manufacturer, is not guaranteed or endorsed by the publisher.
References
Benac, P., Faria, D. L. D. P., Maul, A., and Silva, C. G. (2023). Synthetic seismic-stratigraphic interpretation from a sedimentological forward model in a pre-salt field in the Santos Basin. Pet. Geosci. 29 (4), 29. doi:10.1144/petgeo2023-069
Brown, L. F., and Fisher, W. (1980). Seismic stratigraphic interpretation and petroleum exploration.
Cui, J. W., Zhu, R. K., Xu, W. L., Sun, Y. S., Mao, Z. G., and Bai, B. (2023). Chronostratigraphic correlation and new sedimentological insights for the yanchang Formation in the ordos basin. Acta Paleogeogr. Sin. (in Chinese) 1, 93–104. doi:10.7605/gdlxb.2023.01.007
Dong, J. H., Fan, T. G., and Song, L. M. (2018). “Methods and applications of fine isochronic stratigraphic framework construction,” in Abstract of the 15th national conference on palaeogeography and sedimentology (Cnooc Research Institute Limited liability Company), 338.
Gao, X. D., Wang, Y. B., and Li, Y. (2019). Characteristics of Tight thin sandstone reservoirs and controls of reservoir quality: a case study of he 8 sandstones in the linxing area, eastern ordos basin, China. Acta Geol. Sinica(English Edition) 93 (03), 137–159.
Guo, F., Peng, X., Ma, X., and Wang, H. (2023). Main controlling factors and oil-bearing potential characteristics of a tight sandstone reservoir: a case study of southwest Ordos Basin. Energy Explor. and Exploitation 41 (4), 1288–1307. doi:10.1177/01445987231171274
Harishidayat, D., and Johansen, S. E. (2015). 3D seismic interpretation of the depositional morphology of the middle to late triassic fluvial system in eastern Hammerfest Basin, Barents Sea. Mar. Petroleum Geol. 68, 470–479. doi:10.1016/j.marpetgeo.2015.09.007
Hu, X. Y., Li, H. T., Shi, Y. Q., Xiao, K. H., Guo, Y. D., Li, H., et al. (2018). Sedimentary characteristics and reservoir distribution of the third member of Penglaizhen Formation in the slope zone of west Sichuan Depression: a case study of JP_2∼3 Sand Formation in Shifang area. Nat. Gas. Geosci. (04), 468–480.
Huang, R. C., Xing, F. C., Fan, X. J., and Zou, Y. T. (2019). Establishment of high-precision sequence stratigraphic framework and prediction of reef-flat reservoir in Changxing Formation and Feixianguan Formation, Yuanba area, Sichuan Basin. J. Palaeogeogr. (02), 369–378.
Liu, H. Q., Su, M. J., Ni, C. K., Zhong, H., Cui, X. L., and Hu, K. F. (2018). Seismic sedimentological research method for thin sand body prediction. Lithol. Reserv. (02), 1–11. doi:10.12108/yxyqc.20180201
Liu, L. F., Sun, S. Z., Han, J., Gao, H., Jing, B., Yang, H. J., et al. (2011). Seismic attributes and integrated prediction of fractured and caved carbonate reservoirs in the tarim basin, China. Petroleum Sci. Engl. 8 (4), 455–461. doi:10.1007/s12182-011-0163-8
Lu, Y. C., Chen, L. Z., and Qin, J. (2020). Research on artificial synthetic seismic record based on adaptive positive definite least squares method. Int. J. Comput. Appl. Technol. 62 (4), 318. doi:10.1504/ijcat.2020.107422
Luo, X. Q., Guo, D. X., and Wei, L. M. (2006). Sedimentary facies and gas-bearing seismic response characteristics of Upper Jurassic Suining Formation in Luodai gas field. Sediment. Tethian Geol. (02), 47–54.
Lutome, M. S., Lin, C., Chunmei, D., Zhang, X., and Harishidayat, D. (2020). Seismic sedimentology of lacustrine delta-fed turbidite systems: implications for paleoenvironment reconstruction and reservoir prediction. Mar. Petroleum Geol. 113, 104159. doi:10.1016/j.marpetgeo.2019.104159
Qiu, D. Z., and Fu, P. (2000). Jurassic sequence stratigraphy and oil and gas in southern area of West Sichuan Depression. Nat. Gas. Ind. (04), 5–10+10. doi:10.3321/j.issn:1000-0976.2000.04.002
Shi, X., Zhou, J., Lei, M., and Xie, J. (2022). A comprehensive method to improve the accuracy of well-seismic calibration according to sedimentary facies. Geophys. Prospect. Petroleum 61 (2), 348–355. doi:10.3969/j.issn.1000-1441.2022.02.016
Vail, P. R., and Mitchum, R. M. J. (1977). Seismic stratigraphy and global changes of sea level, part 5: chronostratigraphic significance of seismic reflections. Seismic Stratigr. Appl. Hydrocarbon Exploration.mem.amer.assoc.petrol.geol.
Yang, P. J., Liu, S. H., and Sui, F. G. (2013). Discussion on seismic reflection isochronous and time-piercing problems of in-phase axis. Prog. Geophys. 28 (6), 2969–2976. doi:10.6038/petgeo20130618
Yang, Y. H., Liu, J., Zhao, Y. H., and Zhang, S. (2010). Study on sedimentary facies under sequence lattice of Penglaizhen Formation. Luodai Gas. field. Natural Gas Technology (01),21-23+31+77-78.
Zeng, H., and Hentz, T. F. (2004). High-frequency sequence stratigraphy from seismic sedimentology: applied to miocene, vermilion block 50, tiger shoal area, offshore Louisiana. AAPG Bull. 88 (2), 153–174. doi:10.1306/10060303018
Zeng, H., and Kerans, C. (2003). Seismic frequency control on carbonate seismic stratigraphy: a case study of the kingdom abo sequence, west Texas. AAPG Bull. 87 (2), 273–293. doi:10.1306/08270201023
Zeng, H. L. (2011). Seismic sedimentology in China: a review and prospects. J. Sedimentology 29 (3), 10.
Zhang, H. X., He, B. S., Jiang, X. D., and Zhang, J. C. (2010). Utilizing attenuation characteristic of seismic wave in dual-phase medium to detect oil and gas. Oil Geophys. Prospect. 45 (3), 343–349. doi:10.1016/S1872-5813(11)60005-4
Zhao, L. (2013). Master's degree in high-resolution sequence stratigraphy and sedimentary facies of upper jurassic Penglaizhen Formation, West Sichuan depression. Dissertation, Yangtze University. master.
Zhu, X. M., Dong, Y. L., Hu, T. H., Luo, Q., Wang, M., and Yang, D. Q. (2011). Study on fine sequence stratigraphic framework and seismic sedimentology: a case study of Huoyuan Formation in Biyang Depression. Oil and Gas Geol. 32 (4), 10. doi:10.11743/ogg20110416
Zhu, X. M., Pan, R. L., Shun, L., Wang, H., Zhang, X., Ge, J., et al. (2018). Seismic sedimentology of sand-gravel bodies on the steep slope of rift basins - a case study of the shahejie formation, dongying sag, eastern China. Interpretation 6, SD13–SD27. doi:10.1190/int-2017-0154.1
Zhu, X. M., Zhao, D. N., Zeng, H. L. S. Y., Zhu, R. K., and Huang, W. (2013). Sedimentary characteristics and seismic sedimentological response of the shallow water delta in the Qijia area of the Qingshankou Formation in the Songliao Basin. Acta Sedimentol. Sin. 31 (5), 9. doi:10.14027/j.cnki.cjxb.2013.05.009
Keywords: tight sandstone reservoirs, well-seismic integration, isochronous stratigraphic framework, attribute extraction, impedance inversion
Citation: Luo C, Wang C, Lu G, Zhang S, Lan Z, Li T, Dong R, Sun J and Huang L (2024) High-resolution isochronous stratigraphic framework through well-seismic integration in tight sandstone: a case study of Luodai gas field, Sichuan, China. Front. Earth Sci. 12:1445770. doi: 10.3389/feart.2024.1445770
Received: 08 June 2024; Accepted: 02 September 2024;
Published: 05 November 2024.
Edited by:
Dicky Harishidayat, Universitas Pembangunan Nasional Veteran Yogyakarta, IndonesiaReviewed by:
Osareni Ogiesoba, The University of Texas at Austin, United StatesZhaohui Xu, Research Institute of Petroleum Exploration and Development (RIPED), China
Copyright © 2024 Luo, Wang, Lu, Zhang, Lan, Li, Dong, Sun and Huang. This is an open-access article distributed under the terms of the Creative Commons Attribution License (CC BY). The use, distribution or reproduction in other forums is permitted, provided the original author(s) and the copyright owner(s) are credited and that the original publication in this journal is cited, in accordance with accepted academic practice. No use, distribution or reproduction is permitted which does not comply with these terms.
*Correspondence: Changcheng Wang, d2FuZ2NjQGNkdXQuZWR1LmNu
 Chuanjiang Luo
 Changcheng Wang1,2*
 Gang Lu