- 1Applied Geology Research Center, China Geological Survey, Chengdu, China
- 2Chengdu Center, China Geological Survey, Chengdu, China
- 3Sichuan Institute of Comprehensive Geological Survey, Chengdu, China
- 4Sichuan Geological Big Data Center, Chengdu, China
Three-dimensional (3D) geological models can visually present various underground geological body forms, geological structures, geological hazards, which is of great significance for urban spatial planning and urban geological hazard prevention and control. To overcome technical difficulties such as poor accuracy, poor aesthetics and the difficulty to modify and improve the model afterward, this paper proposes a 3D modeling technology for urban geology with multiple complex geological structures based on multi-source heterogeneous data with the common constraints of geological knowledge and geological laws. This technique can utilize various modeling data, such as DEM data, geological profiles, drillhole data, geophysical interpretation data and structure outline maps. Under the common constraints of geological prior knowledge and geological laws, the block modeling technique is used to complete the construction of 3D urban geological models under complex geological conditions. Taking the construction of 3D geological model in Chengdu as an example, this paper focuses on the theory and algorithm of 3D modeling of urban geology, the geological background of the demonstration area, the preparation and processing of 3D modeling data, and the research and demonstration application of 3D modeling technology for urban geology.
1 Introduction
With the rapid development of urbanization, the scope of urban planning is gradually expanding downward, the most important of which is the need to know enough information about the underground geological structure of the city (Zhuang et al., 2023). Three-dimensional (3D) geological modeling technology is one of the important means to obtain the underground geological structure, compared with the traditional two-dimensional display, the 3D model of the underground space display effect is more intuitive and flexible. It helps to obtain multi-angle characteristics of underground geological structures, which is helpful for the pre-planning and post-management of the utilization of urban underground space (Wang et al., 2016). As the only mega-city in the western region of China, Chengdu has outstanding characteristics in terms of urban geological survey and the urgency of the demand for underground space utilization. It is of great demonstrative significance to carry out Chengdu multi-element urban geological survey and urban underground space resources geological survey.
Research on 3D geologic modeling first originated in the 1970s. Notley and Wilson (1975) developed one of the earliest 3D spatial information systems in the mining industry and was a major groundbreaker. The system is based on a 3D wireframe model, obtains 3D coordinates by digitizing plan and section drawings, and then generates a variety of perspective drawings, which are mainly used for the design modeling of underground mines. In the 1980s, with the continuous progress of computer technology, a large number of surface modeling software appeared, the most famous is the French GOCAD, whose core technology is the “discrete smooth interpolation method” proposed by Mallet (1989). GOCAD is suitable for representing complex geologic formations but has limitations in representing property variations within non-homogeneous entities. In the 1990s, 3D geological modeling theories and methods began to develop in the direction of integration. The concept of 3D geologic modeling was first proposed by Houlding (1994) in Canada and refers to the science and technology that combines information management and statistics, geologic interpretation, and spatial entity modeling in a 3D perspective to reproduce the tectonic environment of complex geologic bodies. By the 21st century, more large-scale 3D geoscientific information visualization software has appeared internationally, such as Petrel of Schlumberger (Ali et al., 2020), Surpac of France (Wang et al., 2020a), Vulcan of Australia (Carter et al., 2024), 3DMine and MapGIS of China (Wu and Tong, 2004; Pan et al., 2023). The emergence of commercial software has largely contributed to the research on technical approaches to 3D spatial modeling. However, due to the limitation of geological bodies by folds, faults and other tectonic events, the existing software mainly adopts static modeling based on manual interaction for 3D modeling of geological space, and how to carry out large-scale urban 3D geological modeling under the constraints of multi-source data is still a difficult problem to be solved.
Traditional 3D geological modeling algorithms can be classified into the octree model (Wang et al., 2020b), triangular prism (Zhang et al., 2015), TEN model (He et al., 2022), and TIN model (Ouyang et al., 2023). The octree model is good for model updating but requires high computational cost to construct complex 3D models, while the triangular prism model is suitable for 3D models with complex morphology but is less efficient in storage (Sun et al., 2022). The TEN and TIN models are more accurate in representing complex surfaces while avoiding data redundancy, but the data storage structure is complex and computationally inefficient (He et al., 2023). In contrast, surface modeling algorithms require less data to construct complex 3D body models and facilitate model visualization and updating (Lyu et al., 2021). The discrete smooth interpolation algorithm proposed by Mallet (1992) can model the spatial connectivity of geologic bodies and solving the problem of spatial fracture. In addition, among the surface algorithms are the Cuberille algorithm proposed by Herman and Liu (1979), the Marching cube algorithm proposed by Lorensen and Cline (1987), and the decomposition cube method proposed by Cline et al. (1988). In addition, many scholars have improved the above methods or combined several methods to construct different 3D models. Frank et al. (2007) proposed a method for 3D reconstruction of complex geologic interfaces based on point cloud data, which can be effectively applied to the construction of faulted strata. Liu et al. (2020) used an improved inverse distance weighting method for 3D geologic modeling. Zhang et al. (2022a) proposed a fast 3D geological modeling method based on CAD borehole data. Zheng et al. (2021) used a combination of deterministic and stochastic modeling to establish a fine 3D geologic model that conforms to the developmental characteristics of discriminatory rivers in oil fields. However, these methods consider a single data source, lack of multi-source heterogeneous data and the common constraints of geological laws, for large-scale city-level 3D geological modeling should be based on different geological conditions using the technique of block modeling.
Although the research related to 3D geological modeling has achieved more comprehensive results, the following deficiencies still exist. The first is that the division of geological modeling units is not closely combined with geological elements, and the geological units are not well-spliced and do not conform to geological regularity. Secondly, the modeling of complex geologic bodies has few data sources, low modeling efficiency and poor accuracy, which makes it difficult to reflect complex geologic bodies in 3D form. This study aims to address the following scientific questions: (1) How to tightly integrate the relationship between the geological prior knowledge and geological laws with the 3D geological modeling unit division? (2) How to construct a 3D geologic model of urban multifaceted and complex geologic structure based on the joint constraints of heterogeneous data from multiple sources and geologic rules?
Chengdu has complex geological conditions and is a typical representative of a city with a diversified geological structure (Wang et al., 2023). Bounded by the Longmen Mountain Front Fracture, the northwestern region is a high mountain valley landscape with complex geological conditions, complicated regional fractures, fold development, extensive outcrops of intrusive rocks, and obvious stratigraphic deformation effects. Therefore, based on multi-source heterogeneous data, the study of feasible and efficient 3D geologic model construction methods suitable for different geologic conditions in the city is of great demonstrative significance for the development of urban geologic 3D modeling. In this study, Chengdu is firstly divided into four modeling areas, namely, the Longmen high mountainous area, the Chengdu plain area, the Longquan low mountainous area and the eastern hilly area, based on the block modeling technology method of geological elements. Then, according to the targeting modeling data, the modeling of six kinds of interfaces is completed, including the model boundary surface of each modeling area, the surface 3D geological model surface, the fault surface framework, the stratigraphic interface, the rock body interface and the quaternary interface. Finally, the integration and representation of the modeling results are accomplished using a no-trace splicing technique.
2 Study area and data
2.1 Study area
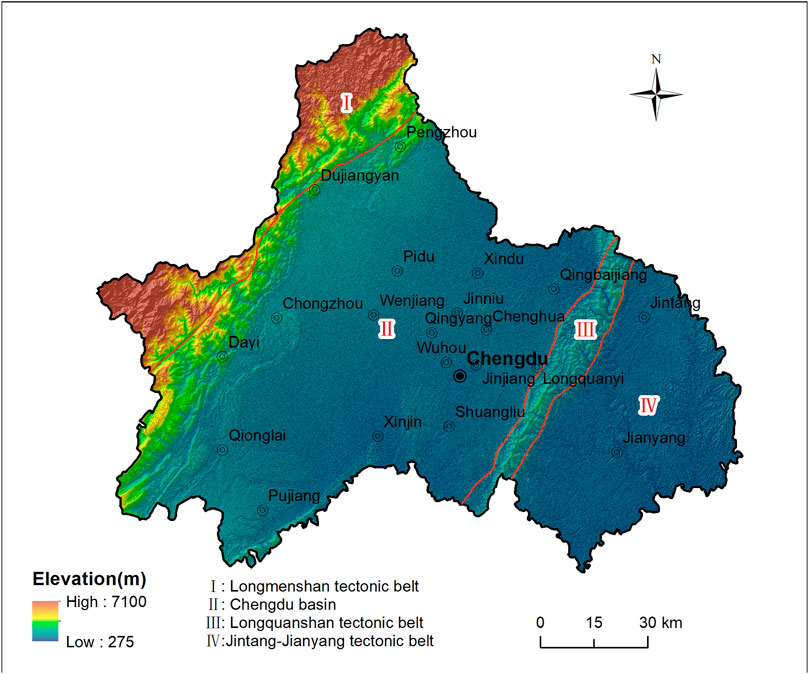
Chengdu city is located in the central part of Sichuan Province, in the western part of the Sichuan Basin, between 102°54′–104°53′E longitude and 30°05′–31°26′N latitude, with a total area of 14,335°km2. The terrain is high in the west and low in the east, dominated by hilly terrain, with an average elevation of 2,200 m. It belongs to the pre-Longmen Mountains Middle-Cenozoic foreland basin, encompassing most of the Chengdu Plain. The whole area of Chengdu is bounded by the Longmen Mountain Front Fracture, the Longquan Mountain West Slope Fracture, and the Longquan Mountain East Slope Fracture. The whole area is divided into four primary tectonic units: the Longmenshan tectonic belt (Ⅰ), the Chengdu basin (Ⅱ), the Longquanshan tectonic belt (Ⅲ), and the Jin-tang-Jianyang tectonic belt (Ⅳ), as shown in Figure 1.
2.2 Data sources
In this study, we use multi-source heterogeneous data and take the geological prior knowledge as the common constraint to construct a 3D geological model of Chengdu based on the idea of chunk modeling. Direct data for model construction include digital elevation models (DEM), geologic profiles, geologic drillhole data, physical interpretation data, and structure outline maps. Various types of geologic prior knowledge and geologic laws are integrated into the comprehensive geologic profile and indirectly participate in the construction of the 3D geologic model. (1) DEM data were obtained from the National Aeronal Aeronautics and Space Administration (NASA) and were mainly used to construct a 3D surface geologic model of Chengdu with a spatial resolution of 30 m (https://dds.cr.usgs.gov), as shown in Figure 2A. (2) Geological borehole data were obtained from the Sichuan Provincial Institute of Comprehensive Geological Survey, including 348 hydrogeological drill holes, 101 engineering geological drill holes, 25 shallow geothermal energy drill holes, and 59 geological exploration drill holes, with an average depth of ≥100 m, as shown in Figure 2B. (3) The structural outline map comes from the Chengdu Geological Survey Center, summarizing the morphology, yield and scale information of the geological formations and assigning this information to the corresponding ruptures or folds as attribute values to provide data support for building the tectonic grid of the 3D geological model of Chengdu City, as shown in Figure 2C. (4) Geological profile data were obtained from the Chengdu Geological Survey Center, and 25 comprehensive geological profiles were laid out according to the profile spacing of less than 10km, including 18 large profiles, two longitudinal profiles, and five encrypted profiles, with a total length of more than 2,000km, as shown in Figure 2D. (5) The physical exploration data were obtained from Chengdu Geological Survey Center, including the thickness contour map of the quaternary system, geological structural layer division and resistivity profile, as shown in Figure 2E.
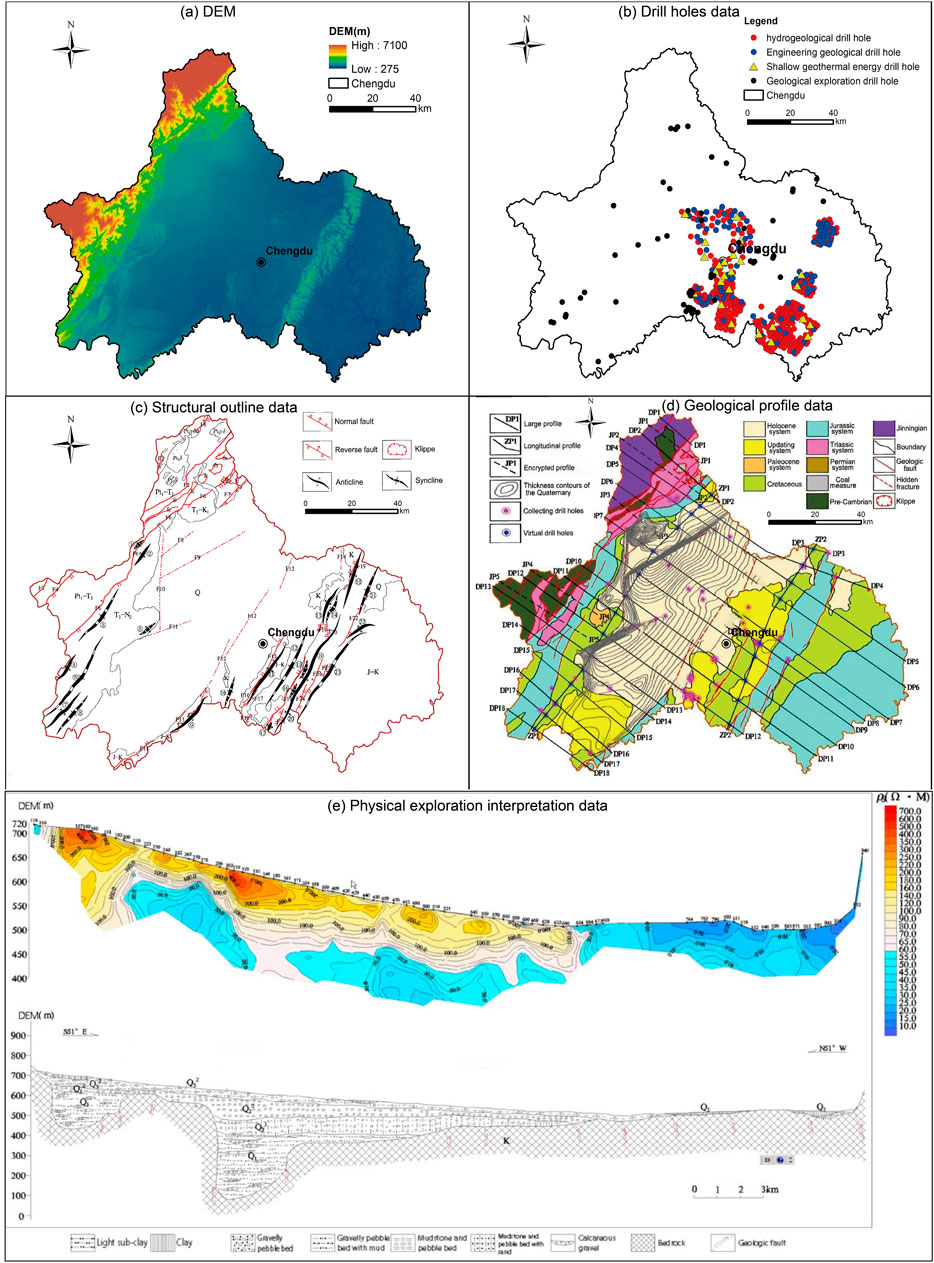
Figure 2. Data source diagram. (A) DEM in Chengdu; (B) Location map of drill holes; (C) Location map of structural outline; (D) Distribution of geological profiles; (E) Map of physical exploration interpretation data.
3 Methods
3.1 Modeling methodology
The 3D geologic modeling in this study aims to depict in detail the 3D distribution characteristics of various types of geotectonic surfaces and clarify the spatial topological connection between them, to construct a 3D geologic model of Chengdu City. Due to the extremely complex geology of Chengdu City, the scale of massifs within the region varies significantly and is variable and irregular in shape (Wang et al., 2023). Especially in the Longmen high mountains, geological phenomena such as faults, folds and fly-over peaks are prevalent, and these factors greatly increase the difficulty of 3D geological modeling (Li et al., 2022). Considering the TIN model in constructing the surface, the size and shape of the triangles can be optimally adjusted according to the complexity of the geological interfaces, the accuracy requirements of the model, and the visual effect, and it has a good fitting effect on the complex interfaces such as fractures and folds (Watson et al., 2015; He et al., 2022). Therefore, this study is based on MapGIS10.5 software using a coupled interpolation algorithm of TIN to construct the interface of various types of geological formations in Chengdu. Through the Kriging interpolation algorithm and discrete smoothing interpolation algorithm in the software change the shape of the size of the TIN, and increase the constraint data, so that the constructed interface can more realistically portray the actual geological structure interface, to complete the construction of the Chengdu City 3D geologic model.
Due to the diverse and intervening sources of modeling data in this study, a single process-oriented work or algorithm may not satisfy the modeling needs, so MapGIS 10.5 software was used to complete the construction of 3D geological models of each modeling geological unit. MapGIS10.5 is a GIS product developed by Wuhan Zhongdi Digital Technology Co., Ltd, which can effectively integrate multi-source geographic data, quickly construct complex 3D models, and realize the intelligent construction of geographic models in the whole process integration (Xu and Xu, 2018). The software provides more functions of human-computer interaction modeling, which facilitates the manual handling of complex geological phenomena.
Contour lines, as a linear representation of topography, do not adequately show the variation in elevation of the strata in the region. Therefore, it is necessary to estimate the elevation values of many unknown points with the help of known elevation data points and suitable spatial interpolation methods, to construct a stratigraphic relief model as close to the actual one as possible (Mezni et al., 2022). In this study, the Kriging interpolation algorithm and the discrete smoothing interpolation algorithm are mainly used. The core of the Kriging interpolation algorithm lies in utilizing the spatial autocorrelation of known sample points to estimate the value of an unknown location (Liu et al., 2023). The advantage of the method is that it takes into account the spatial autocorrelation of known points and the anisotropy of spatial attributes, and truly realizes the estimation of linear, unbiased and minimum estimation variance, and the interpolation results are more accurate (Jia et al., 2020; Song and Tsai, 2024). The core idea of the discrete smooth interpolation algorithm is to use known data points to construct a smooth interpolation function that allows this curve to fit the known discrete data points as closely as possible (Arienti et al., 2024). The advantages are that it reduces the sawtooth effect in the interpolation process, allows the introduction of a variety of constraints, such as boundary and constraint lines of the geologic surfaces, and can obtain more accurate interpolation results (Zhang et al., 2021).
3.2 Modeling process
In this study, we innovatively propose a block 3D modeling process based on the joint constraints of multi-source heterogeneous data and geological rules, As shown in Figure 3. Block modeling refers to dividing the modeling area into several modeling geological units by taking the boundaries of fracture boundaries, unconformity boundaries, rock intrusion boundaries and artificially constructed sections as the boundaries, and then completing the construction of 3D geologic models for each modeling geological unit under the unified 3D coordinate system (Wang et al., 2024). This is suitable for the construction of 3D geological models for large areas with complex geological conditions. The main processes are as follows: (1) Divide the modeling area into multiple modeling units using geologic boundary elements in combination with geologic patterns. (2) Within a single modeling unit, geologic surfaces are constructed using multiple data sources for constraints and increased accuracy based on geologic experience. (3) Errors between geologic surfaces are eliminated through human intervention and crossover algorithms. (4) Assign relevant geologic attributes to the block model to construct a complete geologic body model. Finally, we add geographic elements and color rendering to complete the construction of the 3D geological model of Chengdu City (Figure 3).
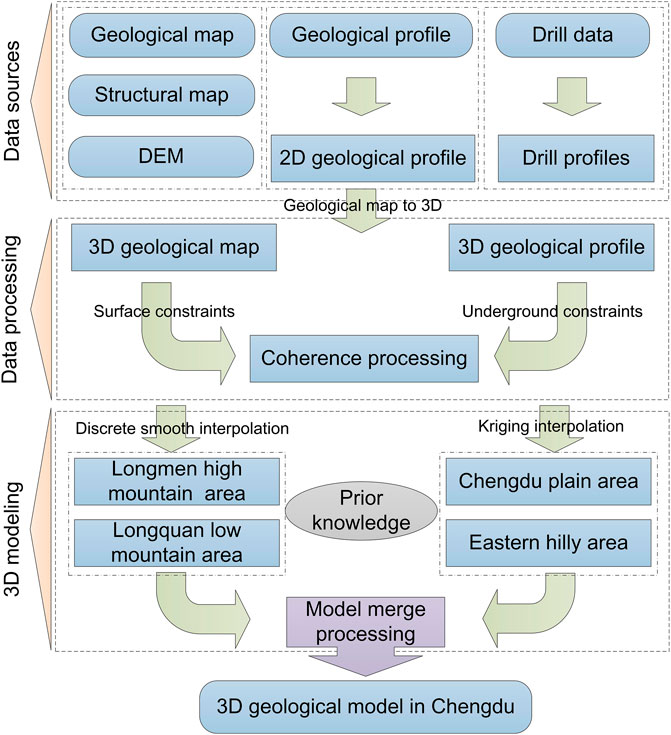
Figure 3. Workflow for 3D geologic model construction (Zhang et al., 2020).
Due to the vast area of Chengdu city, the complex geological structure, controlled by fractures, with the characteristics of an intra-land retrograde fault basin with steep west and slow east, this study adopts the process of block modeling for 3D geological modeling. The main advantages of block modeling are as follows: (1) The modeling process can be simplified by dividing the large-scale geologic body into multiple smaller blocks, making the geologic structure inside each block relatively simple, easy to handle and model, and improving the modeling efficiency. (2) Higher integration, block modeling can integrate the models of each block under a unified 3D spatial framework to form a complete regional 3D geological model. (3) When geologic data changes or updates to the model are required, only the affected blocks need to be modified, rather than having to re-model the entire area.
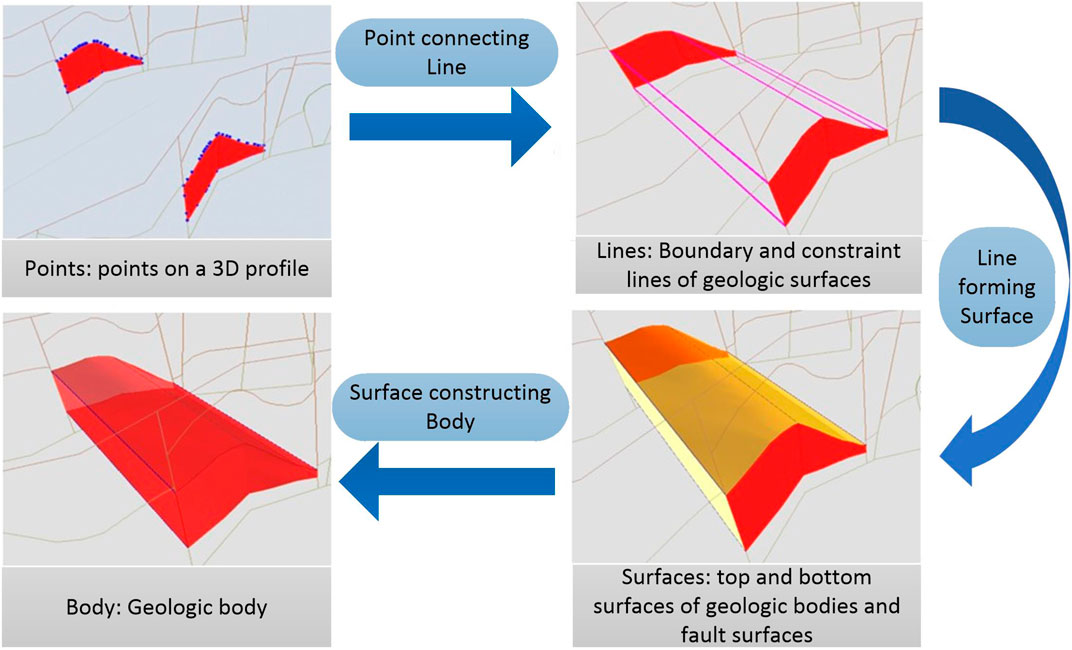
As shown in Figure 4, the core of interactive modeling of complex geologic bodies is a step-by-step modeling process in the manner of “point → line → surface → body” (Liu et al., 2022). The first step is to connect key geologic points, survey points, and construct boundary and constraint lines for the geologic surface. Secondly, the top and bottom surfaces of the geologic bodies and fault surfaces are established according to the geologic pattern. Finally, a model of the closed geologic body is constructed based on the fault plane and ground plane level.
Boundary conditions are important parameters that define the spatial extent and physical properties of a geological model. They are used to simulate the behavior of geologic bodies in the actual geologic environment and to ensure that the physical and geometric properties of the model match the real-world geologic conditions (Schuh-Senlis et al., 2024). In this study, they are categorized as fracture boundaries, unconformity boundaries, rock intrusion boundaries, and artificially constructed profiles. Constraints define the boundaries, behavior, and characteristics of the model to ensure accuracy, reliability, and consistency. It includes geological data constraints and geological prior knowledge constraints (Zhuang et al., 2024). Among them, the geological data constraints are the direct information provided by DEM, geological profiles, borehole data, physical interpretation data and tectonic outline maps; the geological prior knowledge constraints are based on the experience of geologists and the knowledge of regional geologic features, such as the yield of strata and the trend of lithology change to predict and infer the unknown or uncertain parts of the model. Trace-free splicing refers to the process of chunking model construction, using the adjacent chunk boundary line as its own 3D boundary constraint data, but also the neighboring modeling geological unit within a certain range of the modeling data source as its modeling data, participating in the construction of the model, to achieve the effect of the boundary between the chunks coincide with each other.
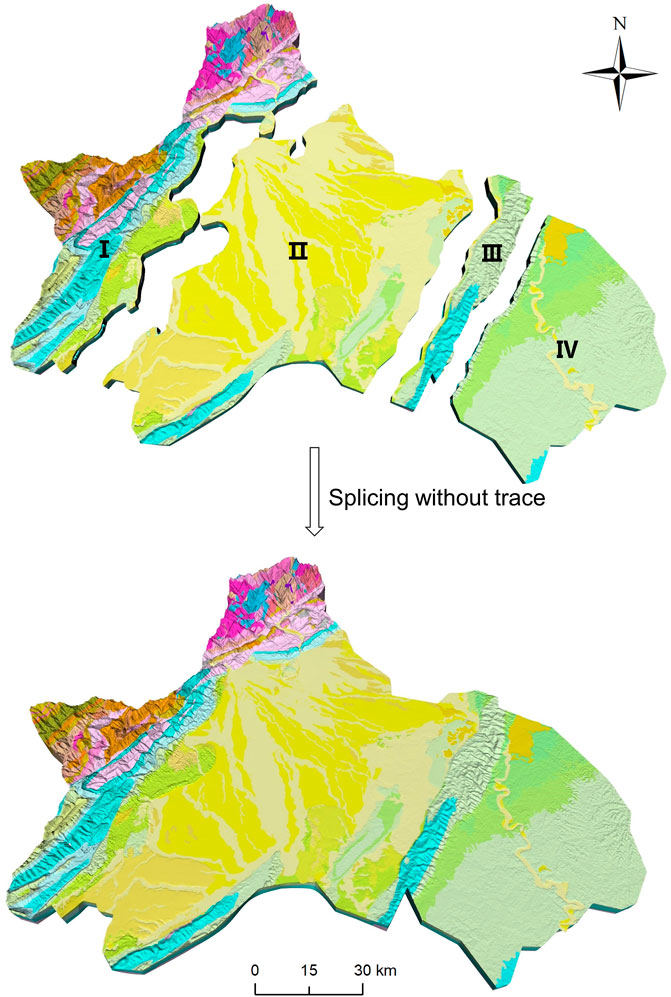
Due to the large distribution area of Chengdu, the complexity of geological conditions and geomorphological features in different areas have obvious differences. To improve the efficiency of 3D geologic modeling, this study comprehensively considers administrative area boundaries, important fault tectonic surfaces, geomorphic unit zoning lines, and important unconformity interfaces as the boundaries for block modeling. Based on this, Chengdu is divided into four primary modeling geologic structural units, namely, the Longmen high mountainous area, the Longquan low mountainous area, the Chengdu plain area, and the eastern hilly area (Figure 5).
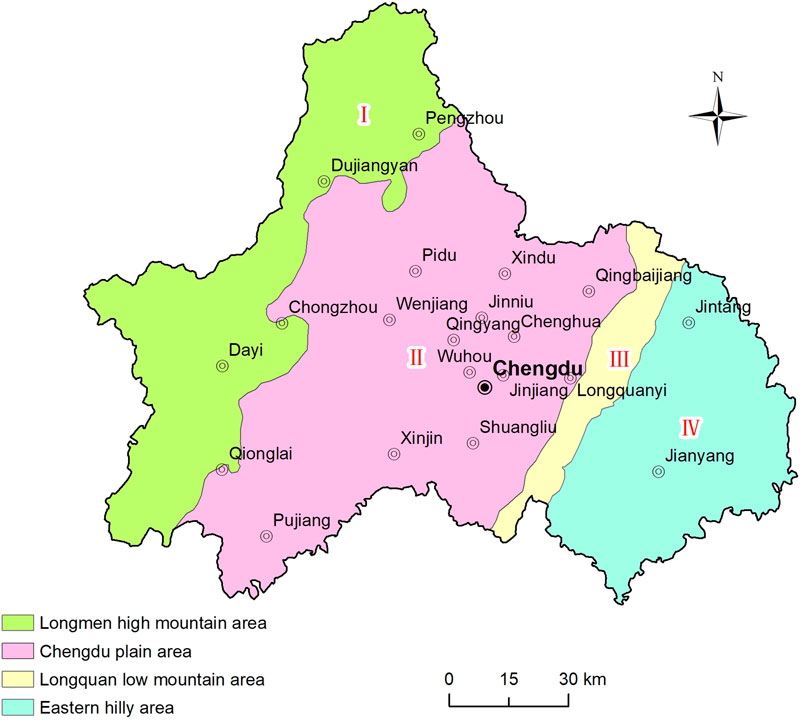
Figure 5. Block modeling in Chengdu, China (Chengdu Center of China Geological Survey, 2020). I: Geological structural unit of the high mountainous area of Longmen; II: Geologic structural units of the Chengdu plain area; III: Geologic structural unit of the low mountainous area of Longquan; IV: Geologic structural units of the eastern hilly region.
3.3 Construction of various interfaces
3D geological models mainly include surface models and solid models (Zhou et al., 2022). Surface models that are spatially topologically correct can be constructed as solid models by mesh splitting or filling. Solid models are the basis for dynamic profiling, spatial analysis and scenario applications (Olierook et al., 2021). Therefore, the accurate portrayal of various types of interfaces is the key to constructing a 3D geologic model. The order of construction of each type of interface is model boundary surface, surface 3D geologic model surface, fault surface framework, and other geologic interfaces. The various types of interfaces constructed should be slightly larger than the actual interfaces to facilitate later model integration and fusion (Ehsan et al., 2023).
3.3.1 Model boundary surface
The model boundary line must be identical to the boundary of the model to be constructed and be a closed curve (Guo et al., 2018). The 3D geologic model takes the administrative boundary line of Chengdu City as the boundary line, and automatically generates the boundary surfaces around the model with a depth of 2000 m. The bottom interface of the model is a plane bounded by the administrative boundary of Chengdu City.
3.3.2 3D geological model surface
To construct a more realistic model, it is necessary to constrain the model based on the construction outline drawing and DEM data at the same time (Shang et al., 2023). After consistent processing of the geological map and the tectonic outline map, the geological elements are edited in combination with the experienced judgment of the geological experts to form a new vector geological map, and a 3D geological model of the surface is constructed. This structural surface will serve as the top surface of the model, which effectively constrains the 3D spread of the subsurface geologic body during the modeling process. Import the DEM data in the modeling software, set up the spatial coordinate system, complete the spatial correction, and then triangulate the DEM data to generate a surface triangulation network. After modifying and optimizing the generated surface triangular mesh, the surface 3D surface mesh model is established (Zuo, 2020).
3.3.3 Fault structure surface
In this study, we first extracted the fault lines in the comprehensive geologic profile and performed line node encryption to ensure that the spacing of each fault line node is the same. Secondly, surface, physical interpretation and borehole data corresponding to the fault are imported and combined with the fault yield to jointly constrain the extension of the fault structural plane. Then connect adjacent fault lines to construct the initial fault structure surface. Finally, the face nodes of the initial fault structure surface are converted to point data, which are fitted to generate the fault structure surface through the discrete smooth interpolation function (Li L. et al., 2022; Chen et al., 2024).
3.3.4 Stratigraphic interface
In this study, we first extracted the stratigraphic boundaries in the geologic profile and the surface 3D geologic model, according to the fold type and morphology, so that they can express the fold morphology completely (Lyu et al., 2021). Secondly, line encryption is used to insert several stratigraphic boundaries between adjacent stratigraphic boundaries to provide some constraints on the morphology of the geologic body. Then, line-node encryption is applied to the stratigraphic boundaries to connect neighboring stratigraphic boundaries and generate the initial stratigraphic interface. Finally, the nodes of the initial stratigraphic structural surface are converted to point data, which are fitted to complete the construction of the stratigraphic structural surface by discrete smooth interpolation (Wu et al., 2024).
3.3.5 Rock interface
This study connects different horizontal sections of rock structural surfaces in a way to construct rock structural surfaces. Firstly, the rock body boundary structure surface is extracted from the surface 3D geological structure surface as a data source to constrain the surface morphology of the rock body. Secondly, the boundary line of the rock body in the geological section map and the morphological characteristics of the rock body interpreted by physical exploration are used as constraints to draw the boundary line of the rock body in different horizontal sections (Manzoor et al., 2024). Then the boundary lines are smoothed, line nodes are encrypted, and neighboring rock boundary lines are connected to generate the initial rock structure surface. Finally, the nodes of the initial rock interface are converted to point data, which are fitted to complete the construction of the rock interface through the discrete smooth interpolation function (Madsen et al., 2022).
3.3.6 Quaternary interface
The Quaternary structural surface is constructed using the thickness contour map of the Quaternary in the Chengdu Plain, which is derived from high-precision gravity data inversion, as the main data source (Zhu et al., 2022b). First, the line data in the thickness contour map of the fourth system were converted to point data. Secondly, based on the point data, the construction of the structural surface of the bottom boundary of the Quaternary system was completed by Kriging interpolation fitting. Finally, the structural surface of the bottom boundary of the Quaternary and the structural surface of the top boundary of the Quaternary in the surface 3D structural surface are fused to complete the construction of the structural surface of the Quaternary (Zhu et al., 2022a).
4 Results and discussion
4.1 Modeling of longmen high mountainous areas
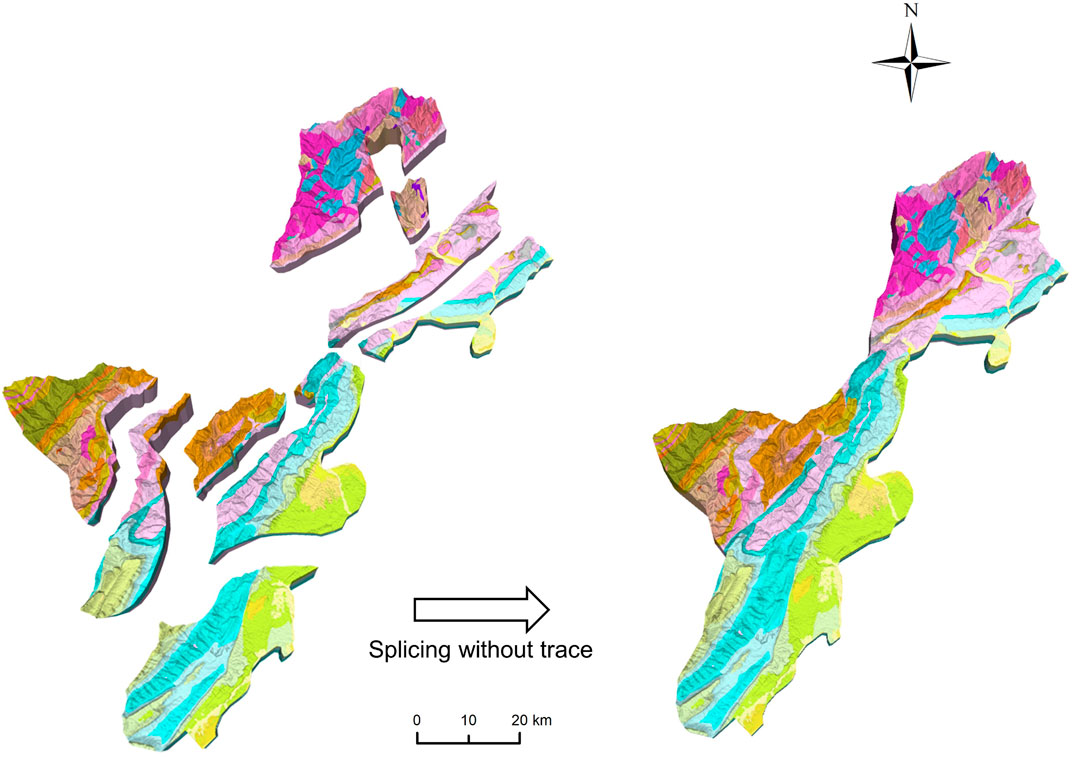
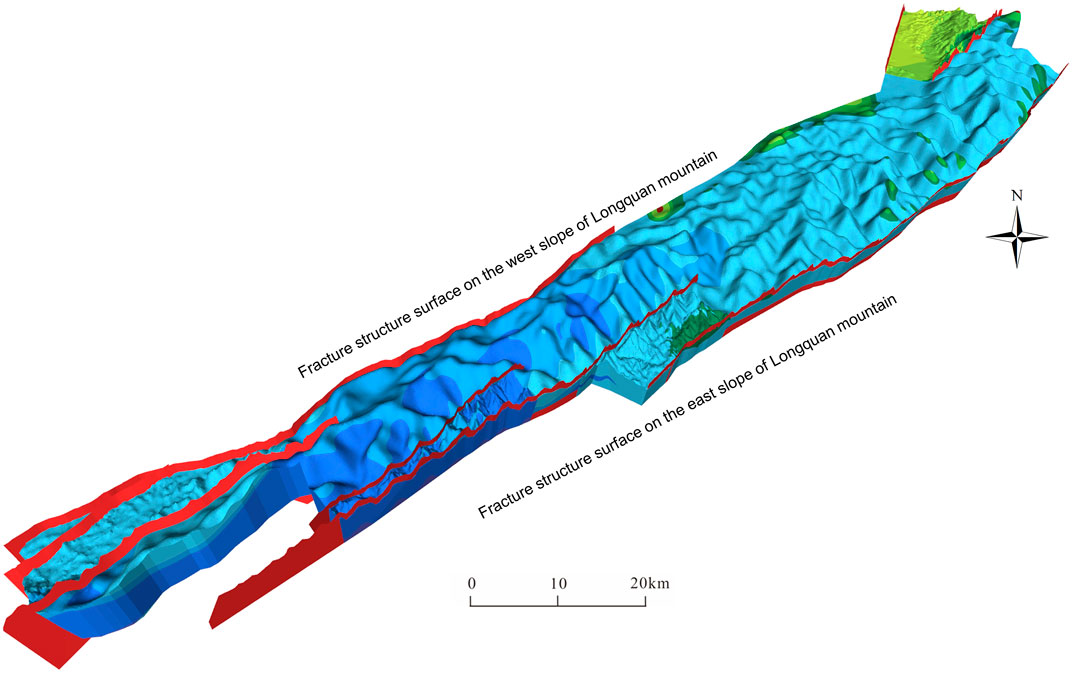
The Longmen high mountainous area is a huge-scale tectonic belt consisting of the Longmen Mountain central fault, the Longmen Mountain front fault and the north-east-southwest oriented rupture folds. In the area, pre-Mesozoic geological structural units are mainly exposed, with complex lithological combinations, and various types of geological structural units are fragmented by fractures. Under such complex geological conditions, it is difficult to deal with the logical relationship between various types of geological structure units and guarantee accuracy by using traditional modeling methods. The boundaries are first delineated by fracture-tectonic interfaces, intrusive rock interfaces, unconformity interfaces, and artificially constructed profiles. The Longmen high mountainous area was then further subdivided into nine secondary modeling geologic units to construct respectively. Finally, the constructed 3D geological model segments are spliced without traces to complete the construction of the 3D geological structure model of Longmen Mountain. (Figure 6).
4.2 Modeling the chengdu plain area
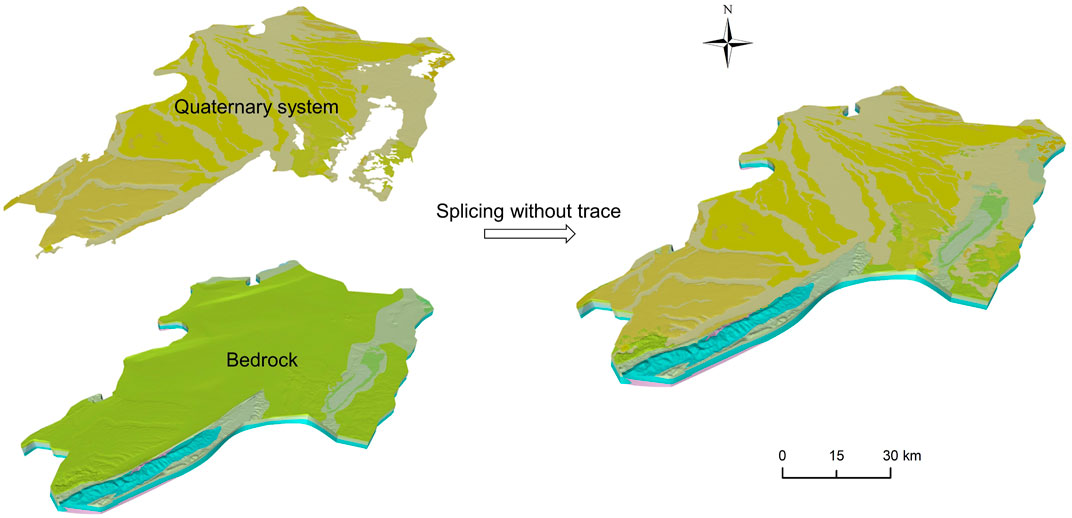
The Chengdu plain geological structure is characterized by typical “dualistic” features. The upper part is a loose quaternary accumulation and the lower part is a bedrock structure. The contact interface between the two is an unconsolidated base-cover interface, which is a typical sedimentary structural surface. The construction of the model is mainly coupled with rapid modeling of layered geologic bodies and layer-by-layer modeling techniques based on geologic maps. Firstly, complete the 3D geologic model construction of the quaternary loose stacked layer. Then complete the construction of the bedrock structural layer and the basement-cover interface. Finally, the construction of the Chengdu plain area model was completed by model splicing technology. Among them, the main process of constructing the Quaternary loose accumulation layer model is to convert the lines into model interpolation sample points by using the Quaternary contour map as the base data. The model constraints are then combined with data from DEM to complete the model.
After constructing the quaternary loose accumulation layer model and the bedrock structural layer model, 3D modeling software was used to complete the stitching of the two models. At the same time, the bottom surface of the quaternary loose accumulation layer is used to constrain the top interface of the bedrock structural layer. The model depth is used as a bottom interface to constrain the bottom-most structural layer. Finally, the construction of a 3D geologic l model of the Chengdu plain at the regional level has been completed (Figure 7).
4.3 Modeling of the longquan low mountainous area
The Longquan mountain backslope tectonic characteristics are obvious, the overall presentation of the “box-shaped backslope” structure. The key lies in the portrayal and expression of the morphology of the geo-structural layers on both flanks of the backslope core. The core and both flanks of the backslope in the low mountain area of Longquan mountain have been weathered and eroded, which cannot be accurately portrayed by automatic modeling technology. It was found that this challenge can be solved by using an automatic modeling technique for erosion folds.
First, extract the stratigraphic boundary data about folds from the modeling data source. Secondly, the stratigraphic boundaries in the cross-section are supplemented according to the fold type and morphology to express the complete fold morphology. Third, modeling is based on recovering the post-fold profiles. Finally, the modeled surface is intersected with the topographic data to obtain the final model. Geologic map constraints and drill-hole data constraints were added to the modeling process (Figure 8).
4.4 Modeling the eastern hilly area
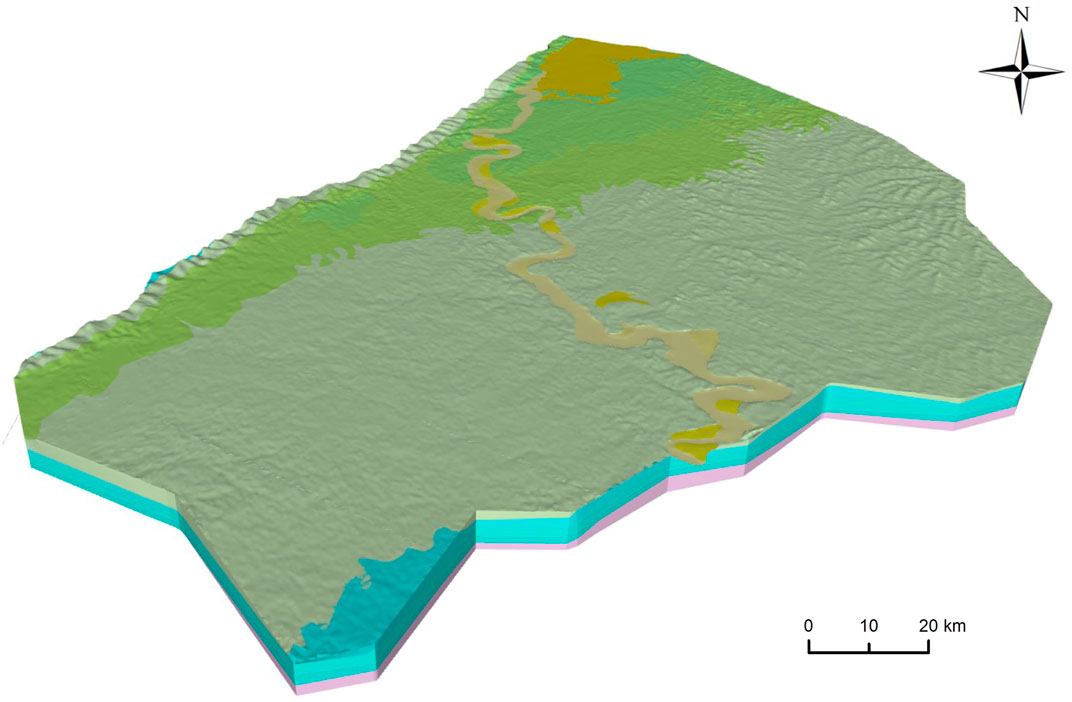
The geological structural unit in the eastern hilly area is characterized by gentle and relatively stable changes in the geological structural layers. Therefore, we use a multilevel stratigraphic constraint stepwise modeling technique to construct the model. Drillhole data are used as the basic data for model construction, and digital elevation model data, and comprehensive geologic profiles are used as comprehensive constraint data.
First, multilevel stratigraphic constraints level-by-level modeling techniques were used to construct the large-layer model. Because of the absence of complex sedimentary rhythms, modeling is relatively simple and provides a good representation of stratigraphic undulation trends. Then, the lithologic modeling approach is used to construct a fine-grained sublayer model of lithologic strata, constrained by a large geologic body. This approach is a good solution to the problem of multi-solvability of complex sedimentary rhythms, automatically constructing a fine model of the intercalated lenticular body while maintaining the stratigraphic undulation trend and overall morphology of the large layer constraints (Figure 9).
4.5 Integration and representation of modeling results
After completing the four geologic unit models, they were imported into the 3D modeling software. A complete 3D geologic model of Chengdu is obtained by adopting the non-trace stitching technology (Figure 10).
4.6 Model rationality analysis
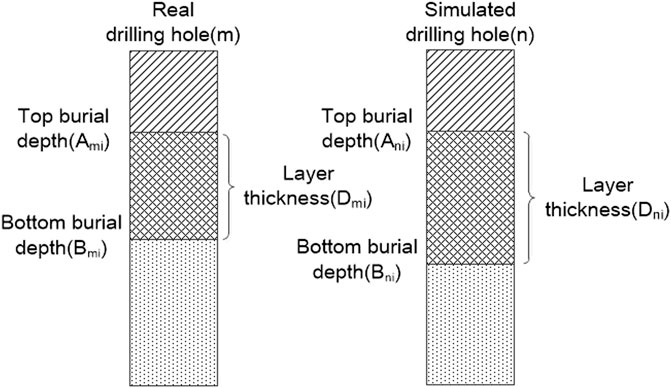
Due to the inconsistency of geological data accuracy and the uncertainty of the interpolation algorithm, the constructed 3D geological model and the actual situation may have some deviation. To check the rationality of the 3D geologic model of Chengdu City, this study refers to existing studies and proposes a rationality analysis scheme based on extracted dilute drill hole data (Ouyang et al., 2023). As shown in Figure 11, a portion of the reserved drill holes (Real holes) is compared with the simulated drill holes extracted at the same locations of the model (Simulated holes); The error in layering thickness and stratigraphic burial depth between the simulated and real holes is then calculated; The layered thickness error and the burial depth error of the entire drill hole are then combined as the error of the 3D geologic model in the vicinity of the drill hole. The formula is shown in Equations 1, 2.
Where
The layer thickness error value and burial depth error value for the whole simulated hole are the average of all layer thickness error values and burial depth error values. The formula is shown in Equations 3, 4.
Where
In this study, 70 drill holes were randomly selected within the study area. As shown in Table 1, the maximum value of the layered thickness error is 10.4 m, the average value is 1.61 m, and the standard deviation is 2.07 m. The maximum value of the buried depth error is 8.71 m, the average value is 1.62 m, and the standard deviation is 1.79 m. The results show that the 3D geologic model of Chengdu constructed in this study conforms to the geologic laws and has high reliability, which can provide important basic geologic data support for the urban planning of Chengdu and the siting of major projects.
4.7 Comparative analysis of 3D geologic modeling in different countries
In the world, 3D geological modeling has different modeling methods in different countries and regions, and the data sources used in different methods are different. In Europe, Ramajo et al. (2023) and others constructed a 3D geologic model of the Gallocanta Basin in Spain based on hydrogeologic data. Hassen et al. (2021) constructed a 3D geologic model of the Vaches Noires Cliffs in Normandy, France, based on the synergistic kriging algorithm and bit-field interpolation using 2D geological maps, DEM, and cross sections. In Africa, Mezni et al. (2022) combined DEM, geostructural maps, and drill hole data to construct a 3D geologic model of the Jeffara reservoir system in the Medenine Basin, Tunisia. In North America, Chen et al. (2021) constructed a 3D geologic model of the Profit Island vicinity levee in Louisiana, United States, based on hydrologic borehole data. In South America, Lopes de Araújo et al. (2024) constructed a 3D geologic model of the Morungava region of Brazil based on borehole, geochemical, and petrophysical data. In Asia, Zhang et al. (2022) proposed a rapid 3D geologic modeling method based on CAD drill hole data and verified the feasibility of the method in the western part of Kaifeng City, China. In summary, most of the 3D geologic models constructed in different countries are based on a single or fewer data sources. A single data source can only reflect the two-dimensional characteristics of the subsurface of the geological body from a certain aspect, and it is difficult to guarantee the accuracy of modeling. To accurately characterize the 3D morphology of complex geologic bodies, this paper adopts DEM data, digital geologic maps, comprehensive geologic profiles, drill hole data, physical exploration data and tectonic outline maps as modeling constraints. Different data can be constrained and verified with each other, which effectively avoids the problem of multiple solutions in a 3D geological model.
5 Conclusion
In this study, we propose a block modeling method based on the joint constraints of heterogeneous data from multiple sources and geological laws. Based on multiple data such as digital elevation models, comprehensive geologic profiles, physical exploration interpretation data, geologic drill hole data and structure outline maps, Chengdu is divided into four modeling units, namely, Longmen high mountainous area, Chengdu plain area, Longquan low mountainous area, and eastern hilly area, by adopting the idea of block modeling. After constructing four 3D geologic models, the 3D geological model of Chengdu was completed under the same spatial coordinate system by adopting the trace-less splicing technology. The main conclusions are as follows.
(1) Geological prior knowledge and laws can be reflected in the comprehensive geo-logical profile and participate in the construction of the 3D geological model, which effectively solves the uncertainty and multi-resolution of the modeling of complex geological regions.
(2) Consistency processing using heterogeneous data from multiple sources can realize mutual constraints and validation among data, which is of positive significance in reducing the multi-resolution of 3D geological models.
(3) The block modeling technology can effectively solve the problem of difficulty in constructing large-area 3D models, low efficiency, not easy to put together and later modify the problem.
(4) Without trace splicing technology uses the adjacent chunk boundary lines as constraints, combined with the geological unit data source, so that the boundaries coincide with each other, significantly improving the aesthetics of the 3D geological model.
Data availability statement
The raw data supporting the conclusions of this article will be made available by the authors, without undue reservation.
Author contributions
MH: Conceptualization, Data curation, Formal Analysis, Funding acquisition, Investigation, Methodology, Project administration, Resources, Software, Writing–original draft, Writing–review and editing. YZ: Conceptualization, Data curation, Formal Analysis, Methodology, Validation, Visualization, Writing–original draft, Writing–review and editing. QZ: Methodology, Writing–review and editing. DW: Resources, Supervision, Writing–review and editing. ZL: Supervision, Writing–review and editing. CL: Supervision, Writing–review and editing. MF: Project administration, Writing–review and editing.
Funding
The author(s) declare that financial support was received for the research, authorship, and/or publication of this article. This study was supported by the Science and Technology Innovation Fund Project of the Natural Resources Comprehensive Survey Command Center of China Geological Survey, “Research on the Risk Evaluation System of Underground Engineering Geological Safety in Highland Mountainous Areas” (KC20230007), the project of China Geological Survey, “Integration of Earth Science Data and Knowledge Services” (DD20230612), “Chengdu Multi-element City Geological Survey” (DD20189210), and the project of Chengdu Municipal Bureau of Planning and Natural Resources, “Development of Geological Survey Application System and Data Integration of Urban Underground Space Resources in Chengdu” (No. 5101012018002703).
Conflict of interest
The authors declare that the research was conducted in the absence of any commercial or financial relationships that could be construed as a potential conflict of interest.
Publisher’s note
All claims expressed in this article are solely those of the authors and do not necessarily represent those of their affiliated organizations, or those of the publisher, the editors and the reviewers. Any product that may be evaluated in this article, or claim that may be made by its manufacturer, is not guaranteed or endorsed by the publisher.
References
Ali, M., Abdelmaksoud, A., Essa, M. A., Abdelhady, A., and Darwish, M. (2020). 3D structural, facies and petrophysical modeling of C member of six hills formation, komombo basin, upper Egypt. Nat. Resour. Res. 29 (4), 2575–2597. doi:10.1007/s11053-019-09583-5
Arienti, G., Bistacchi, A., Caumon, G., Dal Piaz, G., Monopoli, B., and Bertolo, D. (2024). Regional-scale 3D modelling in metamorphic belts: an implicit model-driven workflow applied in the Pennine Alps. J. Struct. Geol. 180, 105045. doi:10.1016/j.jsg.2023.105045
Carter, S., Heinson, G., Kay, B., Boren, G., Liu, Y., Olivier, G., et al. (2024). Fuzzy c-mean (FCM) integration of geophysical data from an iron-oxide copper gold (IOCG) deposit under thick cover. Explor. Geophys., 1–12. doi:10.1080/08123985.2024.2391571
Chen, Y., Yang, H., Ye, Y., and Li, J. (2024). Generation of 3D finite element mesh of layered geological bodies in intersecting fault zones. PLOS ONE 19 (1), e0293193. doi:10.1371/journal.pone.0293193
Chen, Y.-H., Tsai Frank, T. C., Cadigan Jack, A., Jafari Navid, H., and Shih, T.-H. (2021). Relief well evaluation: three-dimensional modeling and blanket theory. J. Geotechnical Geoenvironmental Eng. 147 (8), 04021054. doi:10.1061/(ASCE)GT.1943-5606.0002547
Chengdu Center of China Geological Survey (2020). Geologic map of the Chengdu block modeling. China: Chengdu Center of China Geological Survey.
Cline, H. E., Lorensen, W. E., Ludke, S., Crawford, C. R., and Teeter, B. C. (1988). Two algorithms for the three-dimensional reconstruction of tomograms. Med. Phys. 15 (3), 320–327. doi:10.1118/1.596225
Ehsan, M., Latif, M. A. U., Ali, A., Radwan, A. E., Amer, M. A., and Abdelrahman, K. (2023). Geocellular modeling of the cambrian to eocene multi-reservoirs, upper indus basin, Pakistan. Nat. Resour. Res. 32 (6), 2583–2607. doi:10.1007/s11053-023-10256-7
Frank, T., Tertois, A.-L., and Mallet, J.-L. (2007). 3D-reconstruction of complex geological interfaces from irregularly distributed and noisy point data. Comput. & Geosciences 33 (7), 932–943. doi:10.1016/j.cageo.2006.11.014
Guo, J., Wu, L., Zhou, W., Li, C., and Li, F. (2018). Section-constrained local geological interface dynamic updating method based on the HRBF surface. J. Struct. Geol. 107, 64–72. doi:10.1016/j.jsg.2017.11.017
Hassen, I., Fauchard, C., Antoine, R., Roulland, T., Maquaire, O., Costa, S., et al. (2021). 3D geological modelling of a coastal area: case study of the Vaches Noires Cliffs, Normandy, France. Bull. Eng. Geol. Environ. 80 (2), 1375–1388. doi:10.1007/s10064-020-01955-z
He, L., Li, X., Lei, S., Bi, B., and Chen, S. (2023). A front advancing adaptive triangular mesh dynamic generation algorithm and its application in 3D geological modeling. Sustainability 15 (9), 7214. doi:10.3390/su15097214
He, L., Zhang, J., Chen, S., Hou, M., and Chen, J. (2022). Three-dimensional hydrogeological modeling method and application based on TIN-GTP-TEN. Earth Sci. Inf. 15 (1), 337–350. doi:10.1007/s12145-021-00727-x
Herman, G. T., and Liu, H. K. (1979). Three-dimensional display of human organs from computed tomograms. Comput. Graph. Image Process. 9 (1), 1–21. doi:10.1016/0146-664X(79)90079-0
Houlding, S. W. (1994). 3D geoscience modeling: computer techniques for geological characterization. Springer-Verlag.
Jia, Q., Li, W., and Che, D. (2020). A triangulated irregular network constrained ordinary kriging method for three-dimensional modeling of faulted geological surfaces. IEEE Access 8, 85179–85189. doi:10.1109/ACCESS.2020.2993050
Li, L., Li, Z., Sun, C., Wang, W., Dai, X., Zhang, Y., et al. (2022a). Three-dimensional fault model and activity in the arc-shaped tectonic belt in the northeastern margin of the Tibetan plateau. Front. Earth Sci. 10. doi:10.3389/feart.2022.893558
Li, X., Zheng, X., Dai, X., Almeida, R., and Sun, C. (2022b). Three-dimensional fault-fold growth deciphered from combined seismic and geological data: a case study from the xiongpo anticline, longmen Shan piedmont. Minerals 12 (11), 1405. doi:10.3390/min12111405
Liu, H., Chen, S., Hou, M., and He, L. (2020). Improved inverse distance weighting method application considering spatial autocorrelation in 3D geological modeling. Earth Sci. Inf. 13 (3), 619–632. doi:10.1007/s12145-019-00436-6
Liu, X., Zhang, P., Guo, Y., Ma, G., and Liu, M. (2023). Study of a high-precision complex 3D geological modelling method based on a fine KNN and kriging coupling algorithm: a case study for Jiangsu, China. Front. Earth Sci. 11. doi:10.3389/feart.2023.1325907
Liu, X.-Y., Li, A.-B., Chen, H., Men, Y.-Q., and Huang, Y.-L. (2022). 3D modeling method for dome structure using digital geological map and DEM. ISPRS Int. J. Geo-Information 11 (6), 339. doi:10.3390/ijgi11060339
Lopes de Araújo, L., Curto Ma, J. B., Yokoyama, E., and Victoria, A. M. (2024). Serra Geral Group plumbing system and 3D geological framework in Morungava region, southern Paraná-Etendeka LIP (Brazil): evidence from borehole, geochemical, and petrophysical data. J. S. Am. Earth Sci. 133, 104678. doi:10.1016/j.jsames.2023.104678
Lorensen, W. E., and Cline, H. E. (1987). Marching cubes: a high resolution 3D surface construction algorithm. SIGGRAPH Comput. Graph. 21 (4), 163–169. doi:10.1145/37402.37422
Lyu, M., Ren, B., Wu, B., Tong, D., Ge, S., and Han, S. (2021). A parametric 3D geological modeling method considering stratigraphic interface topology optimization and coding expert knowledge. Eng. Geol. 293, 106300. doi:10.1016/j.enggeo.2021.106300
Madsen, R. B., Høyer, A.-S., Andersen, L. T., Møller, I., and Hansen, T. M. (2022). Geology-driven modeling: a new probabilistic approach for incorporating uncertain geological interpretations in 3D geological modeling. Eng. Geol. 309, 106833. doi:10.1016/j.enggeo.2022.106833
Mallet, J.-L. (1989). Discrete smooth interpolation. ACM Trans. Graph. 8 (2), 121–144. doi:10.1145/62054.62057
Mallet, J. L. (1992). Discrete smooth interpolation in geometric modelling. Computer-Aided Des. 24 (4), 178–191. doi:10.1016/0010-4485(92)90054-E
Manzoor, U., Ehsan, M., Hussain, M., and Bashir, Y. (2024). Improved reservoir characterization of thin beds by advanced deep learning approach. Appl. Comput. Geosciences 23, 100188. doi:10.1016/j.acags.2024.100188
Mezni, I., Chihi, H., Bounasri, M. A., Ben Salem, A., and Ayfer, S. (2022). Combined geophysical–geological investigation for 3D geological modeling: case of the Jeffara reservoir systems, Medenine Basin, SE Tunisia. Nat. Resour. Res. 31 (3), 1329–1350. doi:10.1007/s11053-022-10067-2
Notley, K. R., and Wilson, R. B. (1975). Three dimensional mine drawings by computer graphics. Cim. Bull. 2, 60–64.
Olierook, H. K. H., Scalzo, R., Kohn, D., Chandra, R., Farahbakhsh, E., Clark, C., et al. (2021). Bayesian geological and geophysical data fusion for the construction and uncertainty quantification of 3D geological models. Geosci. Front. 12 (1), 479–493. doi:10.1016/j.gsf.2020.04.015
Ouyang, J., Zhou, C., Liu, Z., and Zhang, G. (2023). Triangulated irregular network-based probabilistic 3D geological modelling using Markov chain and Monte Carlo simulation. Eng. Geol. 320, 107131. doi:10.1016/j.enggeo.2023.107131
Pan, Y., Chen, J., Zuo, X., Zhang, C., and Wu, S. (2023). The stability of dams with different stoping elevations in the tongling valley-type tailings impoundment: a case study in yunnan China. Minerals 13 (11), 1365. doi:10.3390/min13111365
Ramajo, J., Orellana-Macías, J. M., Galé, C., Arce, M., and Causapé, J. (2023). A 3D geological model of the Gallocanta Basin (Spain). The basis to update the hydrogeological model. Earth Sci. Inf. 16 (2), 1797–1809. doi:10.1007/s12145-023-01001-y
Schuh-Senlis, M., Caumon, G., and Cupillard, P. (2024). What does it take to restore geological models with “natural” boundary conditions? Solid earth. 15 (8), 945–964. doi:10.5194/se-15-945-2024
Shang, H., Shen, Y.-G., Li, S., Li, A.-B., and Zhang, T. (2023). An automated mapping method of 3D geological cross-sections using 2D geological cross-sections and a DEM. ISPRS Int. J. Geo-Information 12 (4), 147. doi:10.3390/ijgi12040147
Song, Y., and Tsai, F. T. C. (2024). Borehole-based interval kriging for 3D lithofacies modeling. Water Resour. Res. 60 (6), e2023WR035020. doi:10.1029/2023WR035020
Sun, L., Wei, Y., Cai, H., Xiao, J., Yan, J., and Wu, S. (2022). Adaptive interpolation method for generalized triangular prism (GTP) geological model based on the geometric smoothness rule. Front. Earth Sci. 10. doi:10.3389/feart.2022.808219
Wang, L., Li, H., Wang, D., Zhou, S., Zhang, W., Long, X., et al. (2023). Urban geophysical exploration: case study in Chengdu International Bio-City. J. Geophys. Eng. 20 (4), 830–840. doi:10.1093/jge/gxad049
Wang, X., Guo, J., Fu, S., Zhang, H., Liu, S., Zhang, X., et al. (2024). Towards automatic and rapid 3D geological modelling of urban sedimentary strata from a large amount of borehole data using a parallel solution of implicit equations. Earth Sci. Inf. 17 (1), 421–440. doi:10.1007/s12145-023-01164-8
Wang, Y., Chen, J., and Jia, D. (2020a). Three-dimensional mineral potential mapping for reducing multiplicity and uncertainty: kaerqueka polymetallic deposit, QingHai Province, China. Nat. Resour. Res. 29 (1), 365–393. doi:10.1007/s11053-019-09539-9
Wang, Y., Lv, H., and Ma, Y. (2020b). Geological tetrahedral model-oriented hybrid spatial indexing structure based on Octree and 3D R*-tree. Arabian J. Geosciences 13 (15), 728. doi:10.1007/s12517-020-05752-6
Wang, Z., Qu, H., Wu, Z., Yang, H., and Du, Q. (2016). Formal representation of 3D structural geological models. Comput. & Geosciences 90, 10–23. doi:10.1016/j.cageo.2016.02.007
Watson, C., Richardson, J., Wood, B., Jackson, C., and Hughes, A. (2015). Improving geological and process model integration through TIN to 3D grid conversion. Comput. & Geosciences 82, 45–54. doi:10.1016/j.cageo.2015.05.010
Wu, X., Liu, G., Fan, W., Peng, S., Chen, G., Cheng, J., et al. (2024). Cross-sections compilation-adjustment method based on 2D-3D linkage in regional three dimensional geological modeling. Earth Sci. Inf. 17 (2), 1067–1092. doi:10.1007/s12145-024-01221-w
Xu, K., and Xu, Y. (2018). Discussion on urban three-dimensional geological modeling method based on MapGIS-K9 software: a case study of wuhan. Geol. Mineral Resour. South China 34 (03), 244–252.
Zhang, Q.-H., Su, H.-D., Lin, S.-Z., and Shi, G.-H. (2020). Algorithm for three-dimensional curved block cutting analysis in solid modeling. Comput. Methods Appl. Mech. Eng. 360, 112721. doi:10.1016/j.cma.2019.112721
Zhang, R.-c., Li, H., Wu, M.-f., and Wang, Y.-q. (2015). An automatic unified modeling method of geological object and engineering object based on tri-prism (TP). J. Central South Univ. 22 (4), 1419–1426. doi:10.1007/s11771-015-2659-7
Zhang, X., Chen, C., Xu, Z., and Li, H. (2022a). Method and application of urban 3D rapid modeling of geology based on CAD borehole logs. Geofluids 2022, 1–12. doi:10.1155/2022/4959887
Zhang, Z., Wang, G., Ding, Y., and Carranza, E. J. M. (2021). 3D mineral exploration targeting with multi-dimensional geoscience datasets, Tongling Cu(-Au) District, China. J. Geochem. Explor. 221, 106702. doi:10.1016/j.gexplo.2020.106702
Zheng, H., Yang, Z., Lu, Z., Zhang, L., Zhu, Z., and Su, X. (2021). Research on high-precision 3D geological modeling of bohai X oilfield. J. Chongqing Univ. Sci. Technol. Sci. Ed. 23 (04), 56–59. doi:10.19406/j.cnki.cqkjxyxbzkb.2021.04.010
Zhou, F., Li, M. H., Huang, C. J., Liang, H., Liu, Y. J., Zhang, J. L., et al. (2022). Lithology-based 3D modeling of urban geological attributes and their engineering application: a case study of guang'an city, SW China. Front. EARTH Sci. 10. doi:10.3389/feart.2022.918285
Zhu, J., Lu, Y., Zhang, G., Zhou, X., and Ji, G. (2022a). Study on the construction of 3D geological model of quaternary loose sedimentary strata based on the global stratigraphic discrete points. Water 14 (1), 75. doi:10.3390/w14010075
Zhu, J., Zhou, X., Zhang, G., and Wang, Q. (2022b). Quaternary depositional framework of the xiong’an new area: a 3D geological modeling approach based on vector and grid integration. Sustainability 14 (6), 3409. doi:10.3390/su14063409
Zhuang, C., Liu, C., Zhu, H., Ma, Y., Shi, G., Liu, Z., et al. (2024). Constraint information extraction for 3D geological modelling using a span-based joint entity and relation extraction model. Earth Sci. Inf. 17 (2), 985–998. doi:10.1007/s12145-024-01245-2
Zhuang, C., Zhu, H., Wang, W., Liu, B., Ma, Y., Guo, J., et al. (2023). Research on urban 3D geological modeling based on multi-modal data fusion: a case study in Jinan, China. Earth Sci. Inf. 16 (1), 549–563. doi:10.1007/s12145-022-00897-2
Keywords: three-dimensional geological modeling, multi-source heterogeneous data, complex geological conditions, block modeling, Chengdu city
Citation: Hao M, Zhang Y, Zhan Q, Wang D, Liu Z, Lei C and Fan M (2024) Research and application of urban three-dimensional geological modeling technology based on multiple and complex geological structures: a case study of Chengdu, China. Front. Earth Sci. 12:1444861. doi: 10.3389/feart.2024.1444861
Received: 06 June 2024; Accepted: 24 October 2024;
Published: 01 November 2024.
Edited by:
Gordon Woo, Risk Management Solutions, United KingdomReviewed by:
Muhsan Ehsan, Bahria University, PakistanYongqiang Zhou, Chinese Academy of Sciences (CAS), China
Copyright © 2024 Hao, Zhang, Zhan, Wang, Liu, Lei and Fan. This is an open-access article distributed under the terms of the Creative Commons Attribution License (CC BY). The use, distribution or reproduction in other forums is permitted, provided the original author(s) and the copyright owner(s) are credited and that the original publication in this journal is cited, in accordance with accepted academic practice. No use, distribution or reproduction is permitted which does not comply with these terms.
*Correspondence: Yuxiang Zhang, enl4Z2lzZXJAb3V0bG9vay5jb20=
 Ming Hao1
 Yuxiang Zhang