- 1State Key Laboratory of Oil and Gas Resources and Exploration, China University of Petroleum (Beijing), Beijing, China
- 2School of Petroleum Engineering, China University of Petroleum (Beijing), Beijing, China
Addressing the lack of measurement methods for dynamic contact angles of mercury meniscus in mercury intrusion porosimetry experiments and the unclear understanding of the impact of dynamic contact angles on the interpretation of pore throat radius in rocks, a new type of closed mercury intrusion characteristic curve (O-R curve) is constructed utilizing the withdrawal curve O and the secondary injection curve R obtained from the experiments. Based on the excellent wetting and de-wetting correlation characteristics at the equal mercury saturation points on this curve, a method for measuring the dynamic contact angles of mercury meniscus (O-R loop method) is established. Taking the Chang 63 tight oil reservoir samples from the Nanliang Oilfield in the Ordos Basin of China as an example, this method is applied to investigate the dynamic contact angles of mercury meniscus in mercury intrusion porosimetry experiments and the impact on the interpretation of pore throat radius in rocks. The results indicate that the dynamic contact angles of mercury meniscus changes significantly during the experiments, which cannot be ignored. And the smaller pore throats lead to more severe deformation of mercury meniscus, resulting in higher wetting resistance coefficients and hysteresis angles. Calculations reveal that the pore throat radius interpreted using the modified Washburn equation (which adopts dynamic contact angles) are generally larger than those interpreted using the conventional Washburn equation (which adopts static contact angles), with relative errors ranging from 12.2% to 54.7%. The smaller the pore throats, the larger the relative errors. The analysis shows that the conventional Washburn equation significantly underestimates the reservoir pore throat radius due to the neglect of the dynamic contact angle, while the modified Washburn equation provides more accurate interpretation. Overall, this research provides a method for calculating the dynamic contact angle in mercury intrusion porosimetry experiments and has important reference significance for the accurate interpretation of rock pore throat radius.
1 Introduction
The mercury intrusion test is one of the most important and commonly used methods for measuring the capillary pressure curve of rocks (Zhu et al., 2015; Zheng, 2023). And the rock capillary pressure curve measured by mercury intrusion method can be used to study the micro pore structure of reservoir rocks, estimate the storage and permeability capacity of the reservoir, evaluate reservoir quality, and study the oil displacement mechanism and recovery ratio in porous media, which has a wide range of applications in oilfield development (Li and Wu, 2022; Tian et al., 2023; Cardona, A. et al., 2023; Dai and Lin, 2021).
The mercury intrusion experiment uses mercury as a displacement fluid to measure the capillary pressure curve of rocks, and the entire process can be completed in 1–2 h. Due to the short testing time and high speed, the flow of mercury within the tiny pores of the rock during the experiment is always in a dynamic non-equilibrium state. At this time, the contact angle of the mercury meniscus is not a static contact angle, but a constantly changing dynamic contact angle (He et al., 2011). Currently, there have been numerous studies on the dynamic contact angle of liquid droplets on solid surfaces, and commonly used experimental methods include the volumetric method (Tao et al., 2021), the inclined plate method (Bezuglyi et al., 2001), the hanging drop method (Robert and John, 1993), and the capillary rise method (Morrow, 1975). However, these methods are only suitable for measuring the dynamic contact angle on the surface of porous media, and are not applicable to the dynamic contact angle of mercury meniscus inside porous media. Compared to solid surfaces, rock pores are extremely small and complex. And with the continuous migration of pressurized mercury meniscus and the constant changes in rock contact conditions, the dynamic contact angle of mercury meniscus cannot be directly measured. Due to the lack of direct experimental and calculation methods, the current understanding of the dynamic contact angle of the mercury meniscus in mercury intrusion experiments is only qualitative, without measured data (Tang et al., 2015). Accordingly, due to he lack of quantitative data support, the dynamic contact angle and its variation patterns of mercury meniscus in mercury intrusion experiments have been unclear, which has adversely affected the interpretation of rock pore throat radius using mercury intrusion methods. For a long time, people have mainly relied on the conventional Washburn equation (using static contact angles) to interpret rock pore throat radius (Bai et al., 2014; Gong et al., 2015; Xiao et al., 2021). This traditional data processing method, which assumes a constant contact angle, cannot truly reflect the wetting hysteresis behavior of the mercury meniscus in rock pores during mercury intrusion, resulting in inevitable deviations in the interpretation of rock pore throat radius from the actual values. And it is not conducive to a correct understanding of the microscopic pore structure, storage, and permeability capacity of the reservoir. Therefore, to address the above issues, this article focuses on the influence of dynamic contact angle of mercury meniscus on the interpretation of rock pore throat radius in mercury intrusion experiments.
Firstly, in order to obtain the dynamic contact angle of mercury meniscus, a secondary injection process is added after the injection and withdrawal processes of conventional mercury intrusion experiment. Utilizing the withdrawal curve O and the secondary injection curve R measured during the experiments, a new type of closed composite mercury intrusion characteristic curve (O-R curve) is constructed. Based on the good wettability and dewetting correlation characteristics at the equal mercury saturation points of this curve, a method for calculating the dynamic contact angle of mercury meniscus (O-R loop method) is established. Afterwards, taking the Chang 63 tight oil reservoir rock samples in Nanliang Oilfield in Ordos Basin of China as an example, mercury intrusion experiment is carried out. And the O-R loop method is used to obtain the dynamic contact angle (receding angle and advancing angle) of mercury meniscus in the mercury intrusion experiment, and to analyze the variation laws of the dynamic contact angle. Finally, the conventional Washburn equation (using static contact angle) and the modified Washburn equation (using dynamic contact angle) are used to interpret and compare the rock pore throat radius, and to evaluate the influence of dynamic contact angle on the interpretation of rock pore throat radius. Overall, this research can provide reference for a deeper understanding of the deformation law of mercury meniscus in tiny rock pores, as well as for an accurate interpretation of rock pore throat radius using capillary pressure curves.
2 Material and methods
2.1 Mercury intrusion curve and dynamic contact angle
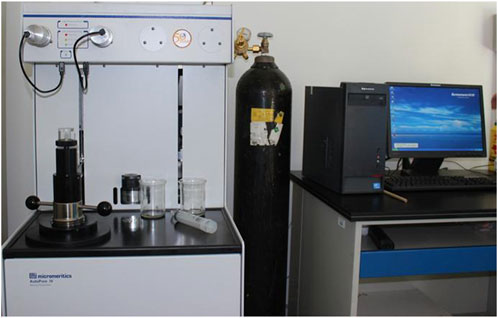
The mercury intrusion experiment adopts Micromeritics AutoPore IV 9520 mercury intrusion porosimetry instrument (Figure 1). Before the experiment, the rock samples are dried to remove the bound water in the samples. And the experimental steps are based on the national standard GB/T 21650.1–2008 (Standardization Administration of the People’s Republic of China, 2008). The detailed experimental steps are as follows: ① Turn on the computer, then turn on the nitrogen cylinder switch and the mercury intrusion apparatus switch. ② Transfer the sample into the dilatometer, seal it properly, weigh it, and evacuate it. ③ Fill in relevant information on the software interface, and then apply pressure in stages. And conduct mercury injection test, mercury withdrawal test and secondary mercury injection test in sequence. ④ After the test is over, take out the dilatometer, pour out the waste mercury and waste sample. Clean it and put it back in place. ⑤ Close the software interface and the computer, then turn off the mercury intrusion apparatus. Finally, close the nitrogen cylinder. The specific test conditions are as follows: the mercury surface tension is 0.475 N/m, the mercury contact angle is 135°, the dilatometer volume is 0.5 mL, and the equipment pressure range is 0.1–414.0 MPa. The actual measurement adopts a maximum mercury injection pressure mainly ranging from 100 to 206 MPa.
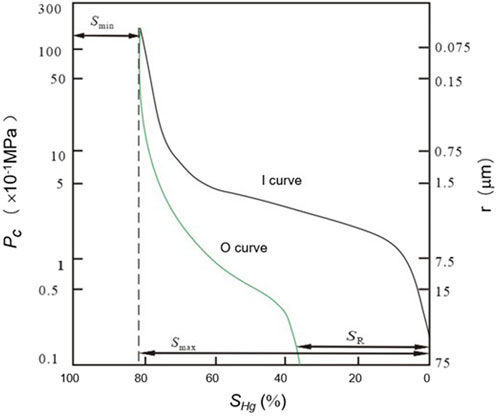
During the mercury injection process of the mercury intrusion experiment, the non-wetting phase displaces the wetting phase. As the injection pressure breaks through the capillary pressure of smaller pore throats, the mercury saturation gradually increases. Conversely, during the mercury withdrawal process, the wetting phase displaces the non-wetting phase, resulting in a gradual decrease in mercury saturation. In the experiment, the amount of mercury intrusion at a constant pressure is measured to obtain the relationship curve between the mercury injection pressure and mercury saturation, which is known as the capillary pressure curve or mercury intrusion curve. And in the conventional mercury intrusion experiment, after reaching the designed maximum experimental pressure, the pressure is gradually reduced to withdraw the mercury. When the pressure drops to the lowest pressure, the mercury no longer withdraws, and the injection curve (I) and withdrawal curve (O) of a sample are completed (Figure 2). Specifically, ① the I curve is the injection curve. The pressure increases from 0 to maximum experimental pressure, while the wet-phase saturation decreases from 100 to minimum value Smin, and non-wet-phase saturation increases from 0 to maximum value Smax. ② The O curve is the withdrawal curve. The pressure decreases from the maximum experimental pressure to 0, while the wet-phase saturation increases from Smin to (100-SR), and the non-wet-phase saturation decreases from the maximum value Smax to the residual mercury saturation SR.
Due to the fast injection (or withdrawal) rate of mercury during the experiment, the meniscus of mercury in the rock capillary pore will change accordingly under the influence of the dynamic wetting hysteresis effect. At this time, the contact angle is not a static contact angle θ, but a dynamic contact angle θ’. Accordingly, the injection curve (I) corresponds to the receding angle θR of the non-wet-phase displacing the wet-phase, while the withdrawal curve (O) corresponds to the advancing angle θO of the wet-phase displacing the non-wet-phase, and θO > θ > θR (Figure 3). Specifically, the advancing angle reflects the wetting process of the three-phase contact line on the unwetted area of the solid surface, while the receding angle reflects the de-wetting process of the three-phase contact line on the wetted area of the solid surface.
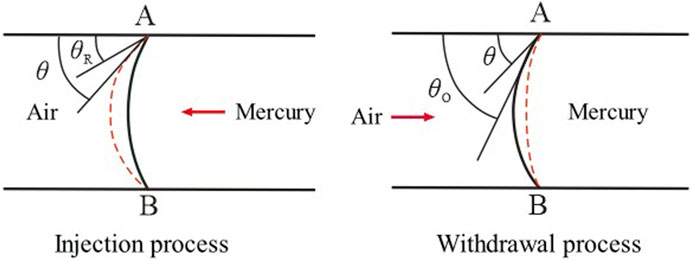
Figure 3. Schematic diagram of static and dynamic contact angles during mercury intrusion experiments.
2.2 Dynamic contact angle calculation method–O-R loop method
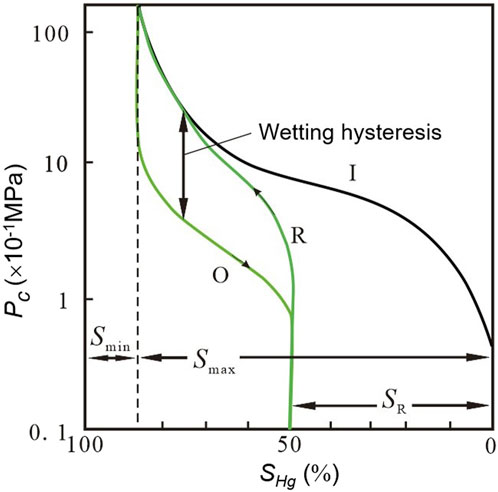
Obtaining the dynamic contact angle θ’ during mercury intrusion is a highly challenging problem. On the one hand, the dynamic contact angle is a variable affected by multiple factors, which is not only related to the properties of rock materials and pore throat size, but also related to the diffusion and migration of mercury, displacement pressure and displacement direction (Johnson et al., 1977; Ustohal et al., 1998). Moreover, the pore throats of rocks are extremely small and complex, making it difficult to directly measure the receding angle and advancing angle through experiments. On the other hand, for the conventional mercury intrusion test (Figure 2), although the I curve and the O curve can reflect the dynamic wetting hysteresis effect, the mercury saturation ranges corresponding to the two curves are different, indicating that the pore structures of the two are not comparable. Thus, using the conventional mercury intrusion curve cannot calculate the dynamic contact angle. Taking into account the both factors mentioned above, to obtain the dynamic contact angle of the mercury meniscus during mercury intrusion experiments, the conventional mercury intrusion test process has been modified. The main idea is to add a secondary injection process after the injection and withdrawal processes, thereby increasing the number of mercury injection curves from two to three, including the injection curve (I), the withdrawal curve (O), and the secondary injection curve (R). Specifically, the O curve and the R curve constitute a new type of closed composite mercury intrusion characteristic curve, referred to as the O-R closed loop in this article (Figure 4).
For the O-R loop, the following are its main characteristics: ① For O-curve, the pressure decreases from maximum experimental pressure to 0, the wet-phase saturation increases from Smin to (100-SR), and non-wet-phase saturation decreases from maximum Smax to residual mercury saturation SR. ② For R-curve, the pressure increases from 0 to maximum experimental pressure, the wet-phase saturation decreases from (100-SR) to minimum value Smin, and non-wet-phase saturation increases from SR to maximum value Smax. ③ Obviously, the saturation ranges of the withdrawal curve (O) and the secondary injection curve (R) are consistent. ④ Because of the fixed overall pore structure and pore throat distribution of the rock sample, and the consistent range of mercury saturation in the O-R loop, the pore throat radius corresponding to the mercury intrusion saturation point in the O-R loop is also equal. ⑤ At the point of equal mercury saturation, the displacement pressure corresponding to the same pore throat radius is significantly higher than the suction pressure, which reflects the change in contact angle in the process of mercury injection (dewetting) and mercury withdrawal (wetting). And the relative magnitude of the two pressures indicates the degree of wetting hysteresis. ⑥ The wetting hysteresis phenomenon of O-R loop can be explained by the theory of heavy metal migration and saturation (Bai et al., 2020; Bai et al., 2024). In 2020, Bai et al. have established nonlinear coupled heat-moisture-contaminant transport equations to analyze the temperature-driven movement of moisture and migration of heavy metal Pb2+ in unsaturated soils. It is found that the migration rate of heavy metal Pb2+ increases with increasing initial moisture content (Bai et al., 2020). And this indicates that an increase in initial moisture content (equivalent to the wet-phase saturation) is conducive to the migration of heavy metal Pb2+, thereby reducing migration resistance. Furthermore, in 2024, Bai et al. have conducted adsorption-desorption experiments for three heavy metal ions (lead, copper, cadmium) in unsaturated silty soil at different temperatures, analyzing the microscopic characteristics of silty soil loaded with three heavy metal ions. The research shows that the types and concentrations of heavy metal ions play an important role in the moisture migration of unsaturated soil under constant temperature. The greater the ion concentration is, the stronger the penetration of heavy metal ions in silty soils (Bai et al., 2024). And this indicates that a higher heavy metal ion concentration (equivalent to a higher non-wet-phase saturation) results in a stronger interaction with silty soil, which is unfavorable for the migration of heavy metals and increases their migration resistance. Accordingly, in the mercury intrusion porosimetry test, Hg is a non-wetting heavy metal. The O curve reflects the wetting process of the three-phase contact line on the unwetted region of the solid surface, during which the wet-phase saturation continuously increases, favoring Hg migration. And the capillary pressure at the equal mercury saturation point is relatively low. While the R curve reflects the dewetting process of the three-phase contact line on the already-wetted region of the solid surface, during which the wet-phase saturation continuously decreases, inhibiting Hg migration. And the capillary pressure at the equal mercury saturation point is relatively high. Therefore, the newly constructed O-R curve can reflect the wetting hysteresis degree of the rock and exhibits good wetting and dewetting correlation characteristics at the equal mercury saturation point (Figure 4).
Based on the characteristics of the O-R loop, a calculation method for the dynamic contact angle of the air-mercury interface during mercury intrusion, referred to as the O-R Loop Method, is proposed for the first time. The specific calculation model is as follows:
Considering any point of equal mercury saturation within the O-R loop, the cosine of the receding angle cosθR corresponding to the R curve can be expressed as:
where θR is the corresponding receding angle of the R curve [°], r is the pore throat radius [μm], σ is the interfacial tension [N/m], and PcR is the secondary mercury injection pressure [MPa].
where θO is the corresponding advancing angle of the O curve [°], r is the pore throat radius [μm], σ is the interfacial tension [N/m], and PcO is the mercury ejection pressure [MPa].
According to Adam’s theory of static friction (Adam, 1925), the static friction force during the wetting (advancing angle) and dewetting (receding angle) processes of liquid droplets on solid surfaces are equal. Therefore, the static contact angle can be expressed as:
where θ is the static contact angle [°], θO is the advancing angle [°], and θR is the receding angle [°].
Substituting Eqs 1, 2 into Eq. 3 yields:
where r is the pore throat radius [μm], σ is the interfacial tension [N/m], PcR is the secondary mercury injection pressure [MPa], PcO is the mercury withdrawal pressure [MPa], and θ is the static contact angle [°].
During the mercury intrusion process, the contact angle of the air-mercury interface is a dynamic contact angle. The capillary pressure Pc can be expressed as:
where Pc is the capillary pressure [MPa], r is the pore throat radius [μm], σ is the interfacial tension [N/m], and θ′ is the dynamic contact angle [°].
Substituting Eq. 4 into Eq. 5 and considering the secondary mercury injection pressure PcR, the cosine of the receding angle can be obtained:
where θR is the receding angle [°], θ is the static contact angle [°], PcR is the secondary mercury injection pressure [MPa], and PcO is the mercury ejection pressure [MPa].
Substituting Eq. 6 into Eq. 3 and considering the mercury withdrawal pressure PcO, the cosine of the advancing angle can be obtained:
where θO is the advancing angle [°], θ is the static contact angle [°], PcR is the secondary mercury injection pressure [MPa], and PcO is the mercury ejection pressure [MPa].
The combination of Eqs 6, 7 constitutes a calculation model for the dynamic contact angle of the air-mercury interface during the mercury injection process. It can be seen that the calculation of the dynamic contact angles (receding angle and advancing angle) only requires the static contact angle, mercury injection pressure, and mercury ejection pressure measured through the mercury intrusion experiments.
3 Results
3.1 The variation law of the dynamic contact angle
The Nanliang Oilfield is located in the southwestern part of the Yishan Slope in the Ordos Basin, China, within the territories of Huachi and Qingyang in Gansu Province. Its main production layer is the Chang 63 oil formation in the Upper Series of the Triassic Yanchang Group, which belongs to the deep lake to semi-deep lake gravity flow deposition. Through analyzing the Core physical property shows that the porosity of the Chang 63 reservoir ranges from 4% to 15%, with an average porosity of 9.1%. The permeability ranges from 0.01 to 0.8×10⁻³ μm2, with an average permeability of 0.152×10⁻³ μm2, making it a typical tight oil reservoir. Based on the geological characteristics of the oilfield’s reservoir and the collection and analysis of samples, an improved high-pressure mercury intrusion experiment is conducted using the Micromeritics AutoPore IV 9520 mercury injection apparatus. Taking the No. 5 rock sample from Well Wu 85 (well depth 1991.79 m) as an example, the dynamic contact angle variation is analyzed. And the characteristics of the rock sample are presented in Table 1.
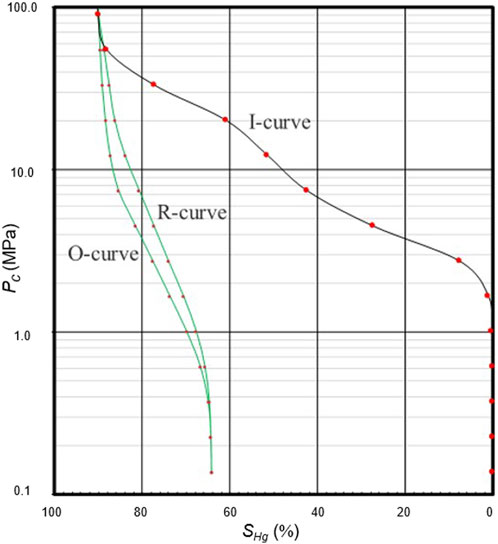
According to the data in the table, the gas-measured porosity of the rock sample is 6.86%, and the gas-measured permeability is 0.035×10⁻³μm2. The static contact angle is 45°, and the interfacial tension is 0.475N/m. Using the improved mercury intrusion experiment, the mercury injection curve of the rock core is measured, as shown in Figure 5. It can be seen that the maximum mercury saturation of the rock sample is 90.21%, the residual mercury saturation is 64.35%, and the mercury withdrawal efficiency is 28.7%, which is relatively low. Specially, the O curve and the R curve constitute an O-R closed loop, which is a curved long strip with thin ends and a thick middle, with a mercury saturation range between 64.35% and 90.21%.
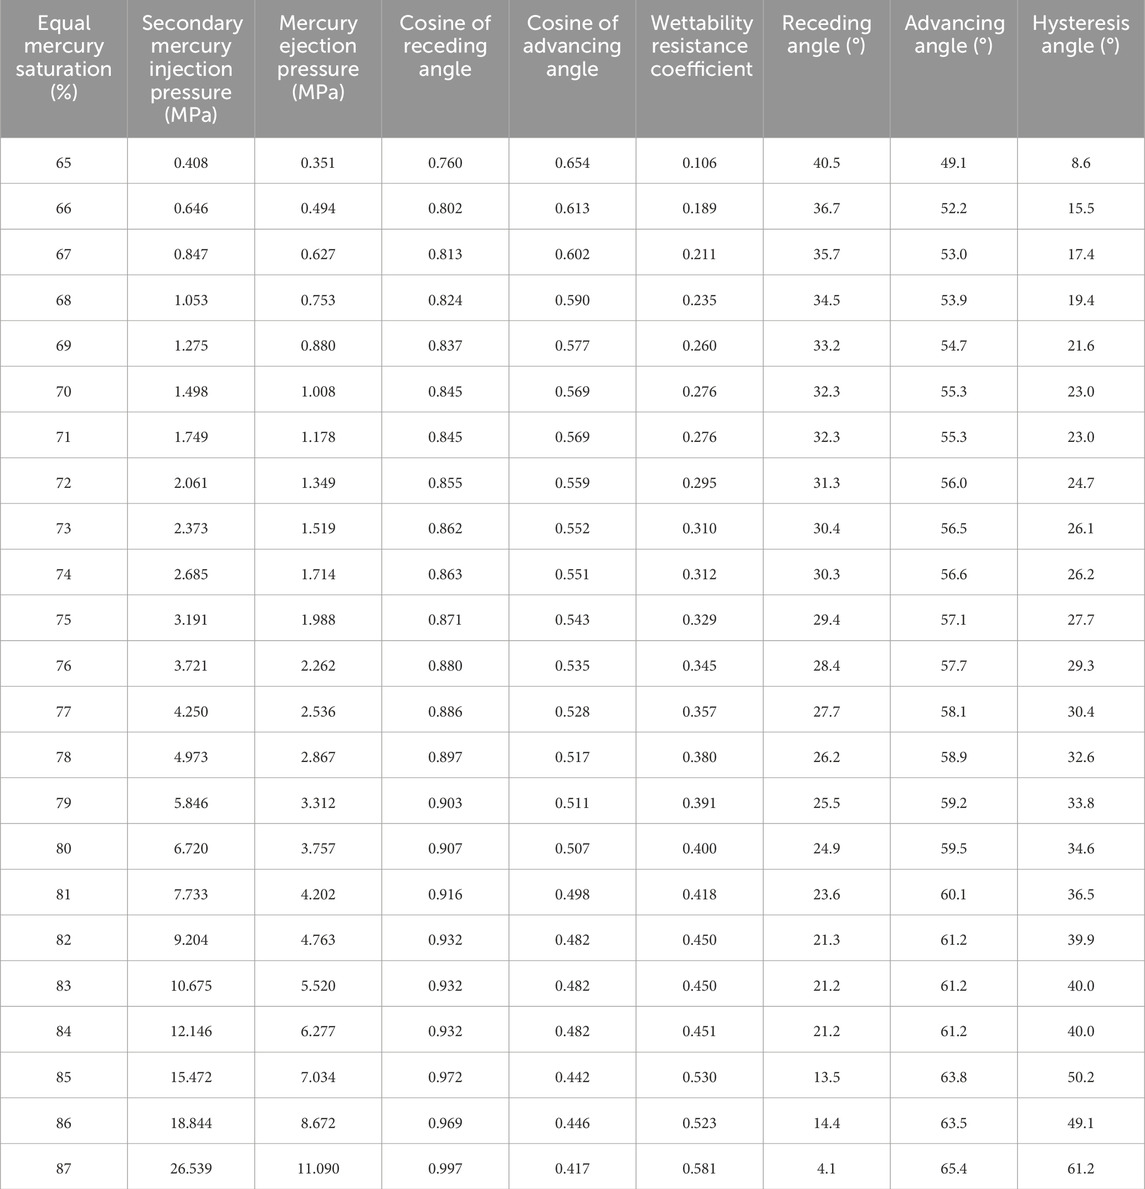
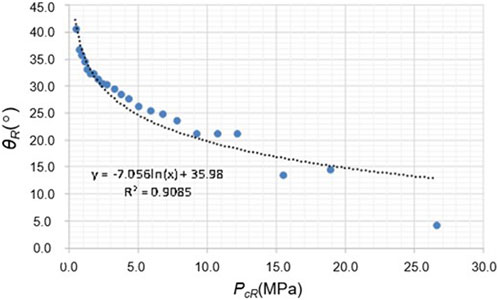
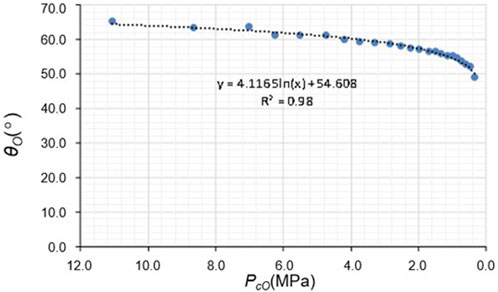
Based on the mercury injection experiment data, the secondary mercury injection pressure PcR and mercury ejection pressure PcO at equal mercury saturation points within the O-R loop are collated, and the dynamic contact angles (receding angle and advancing angle) are calculated using Eqs 6, 7. The results are presented in Table 2 and Figures 6, 7. The following conclusions can be drawn:
(1) During the mercury injection process, as the injection pressure increases and the pore throat radius decreases, the receding angle gradually decreases (Figure 6). While during the mercury withdrawal process, as the mercury ejection pressure decreases and the pore throat radius increases, the advancing angle also continuously decreases (Figure 7).
(2) During the mercury injection process, the capillary pressure acts as a resistance. As mercury gradually moves from larger pore throats to smaller ones, the mercury saturation gradually increases, the Hg migration ability decreases, and the capillary resistance gets greater. Therefore, the deformation of the mercury meniscus intensifies, resulting in a gradual decrease in the receding angle (from 40.5° to 4.1°). Additionally, the smaller the pore throat, the greater the deformation of the meniscus and the lower the receding angle.
(3) During the mercury withdrawal process, the capillary pressure acts as a driving force. As mercury is withdrawn by reducing the pressure, it exits in the order of smaller to larger pore throats, with the mercury saturation gradually decreasing, the migration ability of mercury increasing, which causes the deformation of the mercury meniscus to continuously decrease, and the advancing angle gradually decreases (from 65.4° to 49.1°). Furthermore, the smaller the pore throat, the greater the deformation of the meniscus and the larger the advancing angle.
(4) The wettability resistance coefficient is the difference between the cosine of the receding angle and the cosine of the advancing angle (cosθR–cosθO), while the hysteresis angle is the difference between the advancing angle and the receding angle (θO–θR). A larger wettability resistance coefficient and hysteresis angle indicate a higher degree of wettability hysteresis, reflecting the greater difficulty of a liquid droplet detaching from a solid surface. As can be seen from Table 2, as the pore throat size decreases from large to small, the wettability resistance coefficient significantly increases (from 0.106 to 0.581), and the hysteresis angle significantly widens (from 8.6° to 61.2°). Thus, the smaller the pore throat, the more severe the wettability hysteresis, and the greater the deformation of the mercury meniscus.
3.2 The impact of dynamic cntact angle on the interpretation of rock pore throat radius
It is generally believed that the injection curve (I) reflects the characteristics of all pore throats in the rock. Consequently, by utilizing the I curve to calculate the pore volume and pore throat radius controlled by pore throats under different mercury injection pressures, the pore throat distribution of the rock can be obtained, which provides a possibility for studying the pore structure of the rock (Zhang et al., 2015; Wang et al., 2022).
The Washburn equation is the fundamental equation for calculating the pore throat radius of rocks (Wang et al., 2016), which assumes that the pores in the rock are regular cylindrical shapes, thus the following relationship is established:
where Pc is the capillary pressure [MPa], r is the pore throat radius [μm], σ is the interfacial tension [N/m], and θ is the static contact angle [°].
Eq. 8 indicates that when the interfacial tension s and static contact angle q are fixed, there is an inverse proportional relationship between the capillary pressure Pc and the pore throat radius r, meaning that for a given capillary pressure, there is a unique corresponding pore throat radius (Figure 1).
For a long time, people mainly used the conventional Washburn equation (with static contact angle, see Eq. 8) to interpret the pore throat radius of rocks. However, this traditional data processing method that takes the contact angle as a fixed value cannot truly reflect the wetting hysteresis behavior of the mercury meniscus in the rock pores during mercury intrusion. It is inevitable that there is a deviation between the interpretation results of rock pore throat radius and the actual rock pore throat radius, which is not conducive to the correct understanding of the microscopic pore structure, storage and permeability of the reservoir. Since the contact angle of the mercury meniscus is not a static contact angle, but a changing dynamic contact angle during the mercury intrusion process, it is more practical to use the modified Washburn equation (with dynamic contact angle, see formula 5) for data processing. From formula 5, it can be seen that because the dynamic contact angle is a variable, there will be no one-to-one correspondence between the capillary pressure Pc and the pore throat radius r in the modified Washburn equation.
To evaluate the impact of dynamic contact angle on the interpretation of rock pore throat radius, the calculation results of the dynamic contact angle for rock sample No. 5 (Table 2) are used to respectively interpret and compare the pore throat radius of the NO.5 rock sample using the conventional Washburn equation (with static contact angle) and the modified Washburn equation (with dynamic contact angle).
For the No. 5 rock sample, by substituting the static contact angle of 45 and the interfacial tension of 0.475 N/m into Eq. 8, the analytical expression for the pore throat radius using the conventional method is obtained as:
where r is the pore throat radius [μm], and PcI is the mercury injection pressure [MPa].
To determine the modified analytical expression for the pore throat radius, it can be done in two steps: ① Using the calculated cosine values of the receding contact angles at different equal mercury saturation points within the O-R closed loop, establish a relationship between the mercury injection pressure and the cosine of the receding contact angle of the secondary injection curve (R). ② Substituting the relationship into Eq. 5 to obtain the modified analytical expression for the pore throat radius.
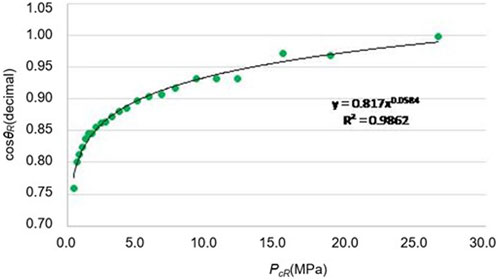
Firstly, using the calculated cosine values of the receding contact angles (Table 2), a correlation analysis is performed between the secondary mercury injection pressure and the cosine of the receding contact angle (Figure 8). It can be observed that there is a significant power function relationship between the secondary mercury injection pressure and the cosine of the receding contact angle for rock sample No.5:
where θR is the receding angle [°], and PcR is the secondary mercury injection pressure [MPa].
Multiple correlation coefficient:
Although Eq. 10 is derived from the secondary injection curve (R), the cosine of the receding contact angle for the injection curve (I) can be calculated using this equation because the secondary injection curve (R) and the injection curve (I) have the same displacement properties. Therefore, by substituting Eq. 10 into Eq. 5 and considering the mercury injection pressure PcI, the modified analytical expression for the modified pore throat radius is obtained as:
where r is the pore throat radius [μm], σ is the interfacial tension [N/m], and PcI is the mercury injection pressure [MPa].
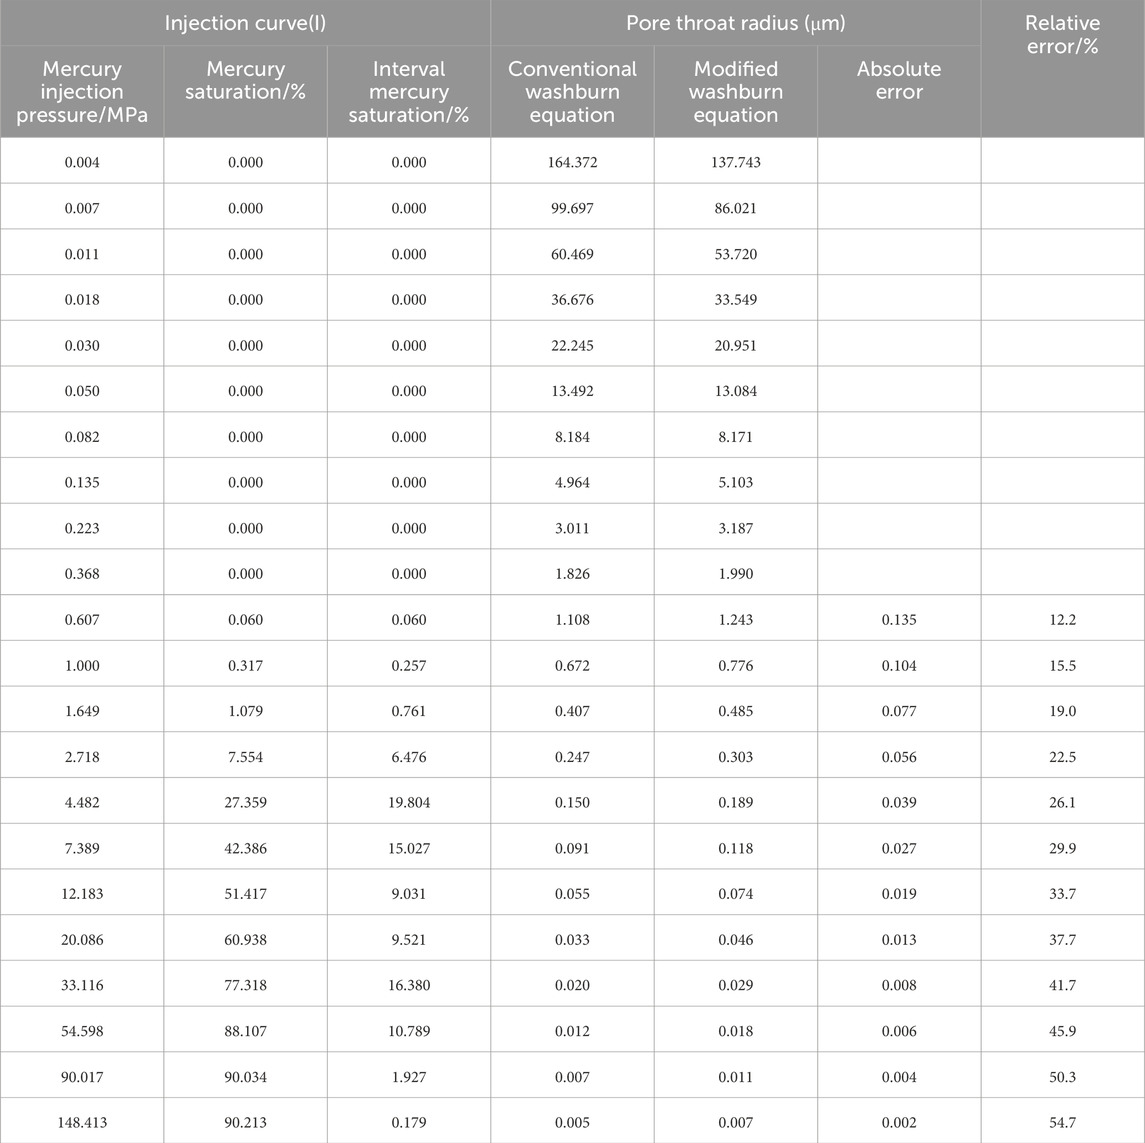
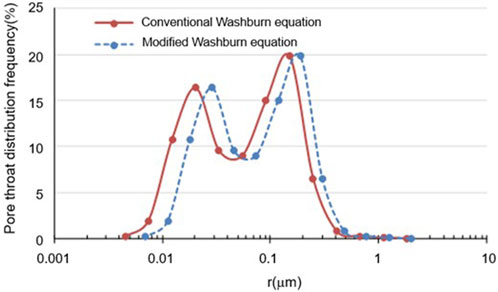
Using Eqs 9, 11 to calculate the throat radius of rock sample No.5, and the results are shown in Table 3 and Figure 9. By comparison, it can be seen that:
(1) Within the effective mercury saturation range where the mercury saturation is greater than 0%, the pore throat radius interpreted by the conventional Washburn equation is smaller (pore throat distribution range of 0.005–1.108 μm); while the pore throat radius interpreted by the modified Washburn equation is larger (pore throat distribution range of 0.007–1.243 μm). Compared with the conventional Washburn equation, the pore throat distribution curve of the modified Washburn equation exhibits a significant positive shift (Figure 9). This indicates that the impact of the dynamic contact angle on the interpretation of rock pore throat radius is significant and cannot be ignored.
(2) It can also be seen from Figure 9 that the smaller the pore throat radius is, the greater the relative error of the two methods in explaining the pore throat radius. The main reason is that in the mercury intrusion experiment, with the decrease of the pore throat radius, the non-wet phase (Hg) saturation in the rock sample is higher. According to the research of Bai et al. (Bai et al., 2020; Bai et al., 2024), the higher the Hg saturation is, the stronger the interaction between Hg and rock is, which increases the migration resistance of mercury and leads to the enhancement of wetting hysteresis of the mercury meniscus. At this time, the error of the conventional Washburn equation in explaining the rock pore throat radius becomes larger. Therefore, in order to improve the accuracy of the rock pore throat radius explanation, it is necessary to use the modified Washburn equation to explain the rock pore throat radius.
(3) The comparison of the two methods for explaining the pore throat radius (as shown in Table 3) indicates that the absolute error ranges from 0.002 to 0.135 μm, and the relative error ranges from 12.2% to 54.7%. While the conventional Washburn equation significantly underestimates the pore throat size and reservoir quality due to its failure to consider the dynamic contact angle. Therefore, using the modified Washburn equation to interpret the rock pore throat radius is crucial for accurately characterizing the pore throat structure of the reservoir.
4 Conclusion
Through the improvement of the conventional mercury intrusion test, this paper proposes a new type of closed composite mercury intrusion characteristic curve (O-R curve). Based on the excellent wetting and de-wetting correlation characteristics at the same mercury saturation point of this curve, a calculation method (O-R ring method) for the dynamic contact angle (receding angle and advancing angle) of mercury meniscus in mercury intrusion experiments is established. Taking the Chang 63 tight oil reservoir rock samples from Nanliang Oilfield in the Ordos Basin of China as an example, this method is used to study the influence of the dynamic contact angle of mercury meniscus on the interpretation of rock pore throat radius in mercury intrusion experiments. The study found that the dynamic contact angle of mercury meniscus in mercury intrusion experiments changes significantly. And the smaller the pore throat is, the more severe the deformation of mercury meniscus is. Additionally, the calculation of pore throat radius shows that the dynamic contact angle has a significant impact on the interpretation of rock pore throat radius, which cannot be ignored. Besides, the rock pore throat radius interpreted by the modified Washburn equation (with dynamic contact angle) is generally larger than that of the conventional Washburn equation (with static contact angle), with a relative error ranging from 12.2% to 54.7%. The smaller the pore throat is, the greater the relative error is. Overall, the conventional Washburn equation significantly underestimates the pore throat radius and reservoir quality due to its failure to consider the dynamic contact angle. Therefore, using the modified Washburn equation to interpret the rock pore throat radius is crucial for accurately characterizing the pore throat structure of the reservoir. This research provides a method for calculating the dynamic contact angle in mercury intrusion experiments and has important reference significance for accurately interpreting the rock pore throat radius.
Data availability statement
The original contributions presented in the study are included in the article/supplementary material, further inquiries can be directed to the corresponding author.
Author contributions
JD: Writing–original draft, Writing–review and editing. SP: Writing–review and editing. JW: Writing–review and editing. YZ: Writing–review and editing.
Funding
The authors declare that financial support was received for the research, authorship, and/or publication of this article. This study was supported by the project of “Formation and enrichment conditions, area selection evaluation technology and application of shale gas in Sichuan Basin and its surrounding areas” (2017ZX05035004) under the National Science and Technology Major Project of “large oil and gas fields and coalbed methane development” in China, which is gratefully acknowledged.
Conflict of interest
The authors declare that the research was conducted in the absence of any commercial or financial relationships that could be construed as a potential conflict of interest.
Publisher’s note
All claims expressed in this article are solely those of the authors and do not necessarily represent those of their affiliated organizations, or those of the publisher, the editors and the reviewers. Any product that may be evaluated in this article, or claim that may be made by its manufacturer, is not guaranteed or endorsed by the publisher.
References
Adam, N. K., and Jessop, G. (1925). CCL.—angles of contact and polarity of solid surfaces. J. Chem. Soc. Trans. 127, 1863–1868. doi:10.1039/CT9252701863
Bai, B., Bai, F., and Hou, J. (2024). The migration process and temperature effect of aqueous solutions contaminated by heavy metal ions in unsaturated silty soils. Heliyon 10 (9), e30458. doi:10.1016/j.heliyon.2024.e30458
Bai, B., Xu, T., Nie, Q., and Li, P. (2020). Temperature-driven migration of heavy metal Pb2+ along with moisture movement in unsaturated soils. Int. J. Heat Mass Transf. 153, 119573. doi:10.1016/j.ijheatmasstransfer.2020.119573
Bai, B., Zhu, R., Wu, S., Cui, J., Su, L., and Li, T. (2014). New micro-throat structural characterization techniques for unconventional tight hydrocarbon reservoir. China Pet. Explor. 19 (03), 78–86. doi:10.3969/j.issn.1672-7703
Bezuglyi, B. A., Tarasov, O. A., and Fedorets, A. A. (2001). Modified tilting-plate method for measuring contact angles. Colloid J. 63 (6), 668–674. doi:10.1023/A:1013255432655
Cardona, A., Liu, Q., and Santamarina, J. C. (2023). The capillary pressure vs. Saturation curve for a fractured rock mass: fracture and matrix contributions. Sci. Rep. 13 (1), 12044. doi:10.1038/s41598-023-38737-y
Dai, J., and Lin, L. (2021). Study on the minimum flow pore throat radius and the lower limit of petrophysical properties of a reservoir under three seepage States. Chem. Technol. Fuels Oils 7 (1), 196–207. doi:10.1007/s10553-021-01239-6
Gong, Y., Liu, S., and Zhu, R. (2015). Low limit of tight oil flowing porosity: application of high-pressure mercury intrusion in the fourth Member of Cretaceous Quantou Formation in southern Songliao Basin, NE China. Petroleum Explor. Dev. 42 (05), 681–688. doi:10.11698/PED.2015.05.17
He, S., Jiao, C., Wang, J., Luo, F., and Zou, L. (2011). Discussion on the differences between constant-speed mercury injection and conventional mercury injection techniques. Fault-Block Oil Gas Field 18 (02), 235–237.
Johnson, R. E., Dettre, R. H., and Brandreth, D. A. (1977). Dynamic contact angles and contact angle hysteresis. J. Colloid ang Interface Sci. 62 (2), 205–212. doi:10.1016/0021-9797(77)90114-x
Li, X., and Wu, H. (2022). Classification evaluation and application of heterogeneous reservoirs based on improved capillary pressure curve. Special Oil Gas Reservoirs 29 (02), 128–134. doi:10.3969/j.issn.1006-6535.2022.02.019
Morrow, N. R. (1975). The effects of surface roughness on contact angle with special reference to petroleum recovery. J. Can. Petroleum 14 (4), 42–53. doi:10.2118/75-04-04
Robert, A. H., and John, R. (1993). Forced liquid movement on low energy surfaces. J. Colloid Interface Sci. 159 (2), 429–438. doi:10.1006/jcis.1993.1343
Standardization Administration of the People’s Republic of China (2008). GB/T 21650.1-2008 Pore size distribution and porosity of solid materials by mercury porosimetry and gas adsorption: Part 1: mercury porosimetry[S]. Beijing: Standards Press of China.
Tang, Y., Wang, P., and Shao, Z. (2015). Mercury intrusion porosimetry and error analysis. Exp. Technol. Manag. 32 (05), 50–54. doi:10.3969/j.issn.1002-4956.2015.05.014
Tao, G., Li, Z., Liu, L., Chen, Y., and Gu, K. (2021). Effects of contact angle on the hysteresis effect of soil-water characteristic curves during dry-wet cycles. Adv. Civ. Eng. 2021, 1–11. doi:10.1155/2021/6683859
Tian, J., Wang, L., Sima, L., Fang, S., and Liu, H. (2023). Characterization of reservoir properties and pore structure based on micro-resistivity imaging logging: porosity spectrum, permeability spectrum, and equivalent capillary pressure curve. Nat. Gas. Geosci. 50 (03), 628–637. doi:10.1016/s1876-3804(23)60415-x
Ustohal, P., Stauffer, F., and Dracos, T. (1998). Measurement and modeling of hydraulic characteristics of unsaturated porous media with mixed wettability. J. Contam. Hydrology 33, 5–37. doi:10.1016/s0169-7722(98)00063-1
Wang, S., Javadpour, F., and Feng, Q. (2016). Confinement correction to mercury intrusion capillary pressure of shale nanopores. Sci. Rep. 6 (10), 1–12. doi:10.1038/srep20160
Wang, Y., Zhao, X., Zhou, B., Li, Q., Liu, Z., Li, L., et al. (2022). Evaluation of pore structure in low-permeability sandstone reservoirs based on high-pressure mercury injection and constant-rate mercury injection. Fault-Block Oil Gas Field 29 (06), 824–830.
Xiao, Y., Xiao, H., and Jiang, Z. (2021). Analysis on difference of pore-throat structure of tight sandstone reservoirs characterized by constant-rate mercury intrusion and high-pressure mercury intrusion experiments. China Energy Environ. Prot. 43 (03), 59–63. doi:10.19389/j.cnki.1003-0506.2021.03.012
Zhang, Q., Liu, C., Mei, X., and Qiao, L. (2015). Status and prospect of research on microscopic shale gas reservoir space. Oil Gas Geol. 36 (04), 666–674. doi:10.11743/ogg20150417
Zheng, X. (2023). Comparative analysis of the application of capillary pressure curve method and CT scanning digital core technique. Offshore oil. 43 (04), 18–23. doi:10.3969/j.issn.1008-2336.2023.04.018
Keywords: mercury intrusion experiment, dynamic contact angle, change rule, rock pore throat radius, interpretation
Citation: Dai J, Pi S, Wu J and Zhang Y (2024) Research on the influence of dynamic contact angle of mercury meniscus on the interpretation of rock pore throat radius in mercury intrusion experiments. Front. Earth Sci. 12:1434211. doi: 10.3389/feart.2024.1434211
Received: 17 May 2024; Accepted: 22 July 2024;
Published: 05 August 2024.
Edited by:
Guochang Wang, Saint Francis University, United StatesCopyright © 2024 Dai, Pi, Wu and Zhang. This is an open-access article distributed under the terms of the Creative Commons Attribution License (CC BY). The use, distribution or reproduction in other forums is permitted, provided the original author(s) and the copyright owner(s) are credited and that the original publication in this journal is cited, in accordance with accepted academic practice. No use, distribution or reproduction is permitted which does not comply with these terms.
*Correspondence: Jinyou Dai, MTA1NTg0ODc3N0BxcS5jb20=
 Jinyou Dai1,2*
 Sha Pi
 Junzhe Wu
 Yang Zhang