 Sergey G. Skublov
 Nazifullah Hamdard2
94% of researchers rate our articles as excellent or good
Learn more about the work of our research integrity team to safeguard the quality of each article we publish.
Find out more
DATA REPORT article
Front. Earth Sci., 25 July 2024
Sec. Geochemistry
Volume 12 - 2024 | https://doi.org/10.3389/feart.2024.1432222
The scarcity of lithium raw materials has become widely recognized as one of the most extensively researched aspects of the economic, industrial-technological, and resource status of mineral bases in many countries worldwide (Balaram et al., 2024). It is evident that as reserves of actively mined lithium raw material deposits and hydrothermal solution deposits near depletion, interest in lithium (spodumene) pegmatites is growing. These lithium pegmatites play a crucial role in the shift towards green energy, making them primary targets for mineral exploration.
Afghanistan has large lithium pegmatite deposits, spatially and genetically associated with leucogranites from the third phase of the Laghman complex of the Cretaceous-Paleogene age. Specializing in lithium, cesium, and tantalum, the rare-metal LCT-type (Li–Cs–Ta) pegmatites, including spodumene pegmatites, are found prominently in the eastern part of the country, particularly in Nuristan Province (Benham and Coats, 2007). Soviet geologists significantly contributed to the discovery and subsequent study of these pegmatites in the 1970s (Rossovskiy and Chmyrev, 1977). However, a comprehensive mineralogical and geochemical study of these ore deposits has not been undertaken. This article presents some findings from the fieldwork conducted in 2023 by Nazifullah Hamdard in Nuristan Province at the Pashki deposit, where a variety of colorless transparent beryl, known as goshenite, was discovered in one of the veins of spodumene pegmatites (Figure 1A).
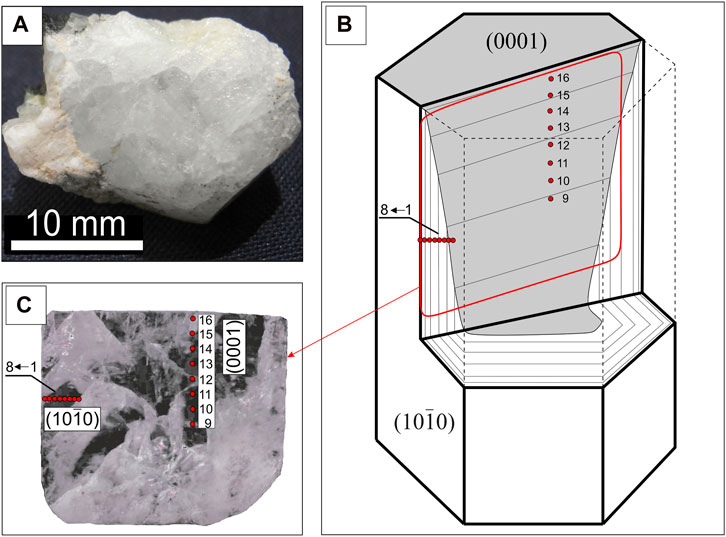
Figure 1. Sampled beryl crystal (A); the orientation of the section in the crystal (B), the position of the points in the mount, a photograph in reflected light (C).
Beryl, with an ideal formula of Be3Al2Si6O18, is the most common beryllium mineral in rare-element granitic pegmatites, particularly in complex types of LCT-pegmatites (Černý and Ercit, 2005; Sardi and Heimann, 2014). The variations in minor and trace elements (Fe, Mg, Sc, Li, Na, Cs, and others) and their substitution mechanisms in beryl reflect the pegmatite environment and the degree of fractionation (Aurisicchio et al., 2012; Simmons et al., 2012). The evolution of beryl composition during pegmatite formation, which shows an increase in alkali content (Na, Li, and Cs) and a decrease in Fe and Mg content, has been observed in various pegmatites worldwide (Duan et al., 2024). Compared to other varieties, colorless beryl (goshenite) remains relatively understudied in terms of its minor and trace element content (Hu and Lu, 2020). This study presents findings on minor and trace elements in goshenite from the spodumene pegmatites of the Pashki deposit in Nuristan Province, Afghanistan.
The Pashki deposit is located within the Parun pegmatite field, in the mountains at an altitude of 3,000–4,300 m. Here, over an area of 2 × 3.5 km, series of extended (up to 1 km and more with a thickness of several tens of meters) steeply dipping pegmatite bodies of north-eastern strike with rich spodumene mineralization are exposed. The host rocks are metamorphic rocks of the Kashmund series of the Upper Triassic, represented by crystalline schists, quartzite-sandstones, and marbleized limestones (Supplementary Figure S1). The composition of ore-bearing pegmatites of the Pashki deposit is quartz-spodumene-microcline-albite. Within its boundaries, pegmatites are represented by two relatively large bodies: veins No. 1, and No. 3, and vein zone No. 2, which are “net” junctions of a multitude of differently oriented vein forms. The preliminary estimated reserves of the deposit to a depth of 100 m are 127,000 tonnes of Li2O (Benham and Coats, 2007). Vein No. 3, in which goshenite crystals were found, has a corkscrew shape and lies mainly in accordance with the host rocks (thin-layered garnet- and staurolite-quartz-biotite schists). The vein extends for 600 m along the strike and is 2–8 m thick. The following vertical zonality is observed in the vein: the lower visible part is composed mainly of large-crystalline quartz-microcline-albite pegmatoid granites containing small crystals of spodumene. Higher along the section, the number of nests and veins of quartz-microcline-albite pegmatites of block structure increases in pegmatoid granites, giant pegmatoid segregation structure with quartz separations and large spodumene is noted. The vein is characterized by the presence of voids containing kunzite, light green muscovite and rock crystal. The contacts of the vein with the schists are distinct. Exocontact changes are expressed in muscovitization and tourmalinization of schists at a distance of 5–15 cm from vein contacts. The vein is characterised by the widespread distribution of sugar-like aggregates of fine crystalline albite. Tourmaline (schorl), whose crystals reach 5 × 10 cm in length, is often found in areas of blocky and pegmatoidal structure. Beryl (aquamarine and goshenite) crystals up to 2–3 cm in size are usually observed in the upper (head) part of vein No. 3. Crystals of transparent colourless beryl, the composition of which is the subject of this article, were found in vein No. 3 (at an altitude of 3,800 m) in association with spodumene, microcline, albite (cleavelandite), tantalite and polychrome (“watermelon”) tourmaline.
A colorless and transparent beryl crystal, with a columnar habit and about 1 cm in size, was cut along the prism faces (elongation axis) and placed in a standard epoxy mount with a one-inch diameter. The zonation of beryl was studied from the centre to the edge of the crystal in the plane perpendicular to the basal pinacoid. Points 1–8 are located in the growth zone of the prism (10
The contents of minor and trace elements, water, and volatiles in beryl were determined by secondary ion mass spectrometry (SIMS) using a Cameca IMS-4f ion microprobe at the Yaroslavl branch of the Institute of Physics and Technology named after K. A. Valiev, Russian Academy of Sciences. The basics of the measurement technique corresponded to those reported in (Nosova et al., 2002; Fedotova et al., 2008; Portnyagin et al., 2008).
The analyses were carried out in two steps using different protocols for the determination of volatile (Cl, F, H) and light (B, Li) impurity elements, and the main set (Na, Mg, K, Ca, Sr, Sc, Ti, V, Cr, Mn, Fe, Co, Ni, Ga, Rb, Cs). Primary 16O2− ions were accelerated to about 14.5 keV and focused at the sample surface into a spot about 20–30 µm in diameter. The intensity of the primary ion current was 5 nА (protocol «volatiles») and 1.5 nА (main protocol). Positive secondary ions were collected from an area of 10 𝜇m (protocol «volatiles») or 25 𝜇m (main protocol) in diameter, limited by a field aperture. Molecular and ion clusters were energy filtered using an offset voltage of −100 V, with an energy window of 50 eV. Three counting cycles were carried out with a discrete transition between mass peaks within a given set. The counting time was varied depending on signal intensity and was determined automatically by statistical control. The maximum counting time for any species in each cycle was 30 s.
The absolute concentrations of each element were calculated from the measured intensities of positive single-atom secondary ions, which were normalized to the intensity of secondary 30Si+ ions using the relative sensitivity factors (RSFs). Calibration curves were based on the measurements of the set of well-characterized standard samples (Jochum et al., 2000). Quantification of Sc, Fe, Ni, and Co was carried out taking into account isobaric mass peak interference (Skublov et al., 2022).
Ion analysis of water required established approaches to decrease the background level. Prior to measurements, each sample was kept for at least 12 h in the analytical chamber of the mass-spectrometer, where high vacuum conditions were maintained. The analysis was preceded by ion sputtering of conducting gold film and a surface pollutant layer on the area to be analyzed. Then, the procedure of automatic adjustment of the sample potential was applied. The static primary beam spot overlapped the field of view of the secondary ion optics (10 µm in diameter) centered at the pre-sputtered crater (∼40 × 40 μm). An anhydrous silicate (olivine) grain introduced into each sample mount was used to measure the 1H+ signal background. Water concentration was calculated from the 1H+/30Si+ ion current ratio based on calibration relationships: C[H2O]/C[SiO2] = (I(1H+) – I(1H+)bg)/I(30Si+) × RSF × K(SiO2). Here, C[H2O] and C[SiO2] are H2O and SiO2 concentrations in wt%; I(1H+), I(1H+)bg, and I(30Si+) are measured secondary ion intensities in imp/sec; I(1H+)bg is background signal intensity. The correction coefficient K(SiO2) accounts for dependence of RSF on SiO2 concentration for which a linear approximation was used as: K(SiO2) = (1–(SiO2–50) × 0.0185).
Calibrations were obtained using samples of natural and experimental glasses (in all, 28 standard samples) covering a wide range of the variation in SiO2 and water concentrations (Skublov et al., 2022). The results of calibration show that maximum deviation from the reference value was no more than 15% and the calculation error is 7%. A similar approach was used for calculating fluorine and chlorine concentrations. The method for determining fluorine in silicate matrices was published in (Portnyagin et al., 2008). Standard glass NIST-610 was used as a monitor before an analytical session. The trace element measurement error did not exceed 10% for concentrations higher than 1 ppm and 20% for concentrations ranging from 0.1 to 1 ppm, respectively. The trace element detection limit ranges mainly from 0.005 to 0.010 ppm.
The results of the trace element study are presented in Figure 2 and Supplementary Table S1.
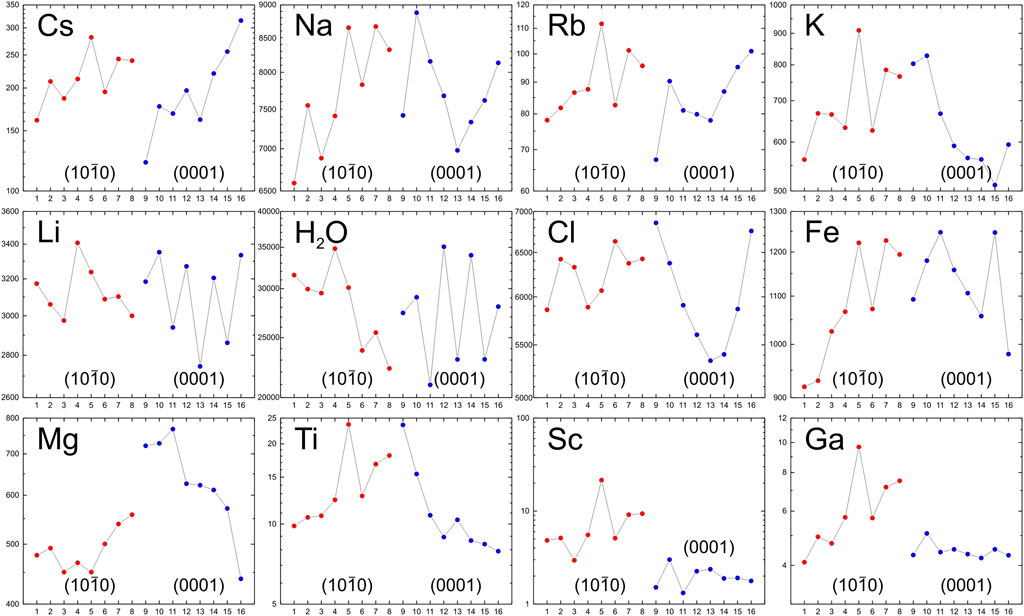
Figure 2. Trace element distribution in the beryl from spodumene pegmatites of Pashki deposit.
Na and Ca are included in the channels of the beryl structure except for Li which substitutes Be in the tetrahedral position. Cs content varies from 121 to 315 ppm with an average of 209 ppm. Moreover, Cs content increases with crystal growth both in the prism growth zone (points 1–8 – from 161 to 281 ppm) and the pinacoid growth zone (points 9–16 – from 121 to 315 ppm). Na content varies from 6,591 to 8,879 ppm with an average of 7,756 ppm. In the prism growth zone, Na content increases monotonically from 6,591 to 8,666 ppm, while in the pinacoid growth zone, it has a more complex distribution – decreasing from point 10 to point 13 (8,879 to 6,979 ppm) and then increasing to 8,134 ppm by point 16. The Rb distribution generally mirrors the Na distribution. In the prism growth zone, Rb content increases from 78.1 to 112 ppm, while in the pinacoid growth zone it decreases from point 10 to point 13 (90.3–78.1 ppm) before increasing to 102 ppm by point 16. Ca content, except at point 9 as outlier, ranges relatively narrowly from 45.1 to 179 ppm, with an average of 114 ppm. Both profiles belonging to the prism and the pinacoid growth zones show a decreasing Ca content towards the crystal edge. K content varies from 511 to 910 ppm, averaging 671 ppm. In the prism growth zone, K content increases from 562 to 863 ppm, while in the pinacoid growth zone, it decreases from 828 to 511 ppm. Li content is high, ranging from 2,746 to 3,408 ppm, averaging 3,121 ppm, with no systematic zonality observed in its distribution. Sr content is generally low, usually not exceeding 1.5 ppm.
In addition to LILE, the channels in the crystal structure of beryl may include H2O molecules, as well as Cl, F, and B. H2O content varies from 20,973 to 35,069 ppm, with an average of 28,016 ppm. In the profile corresponding to the prism growth zone, H2O content decreases from 31,558 to 22,299 ppm. In the pinacoid growth zone, no systematic zonation in the H2O distribution is observed. Cl content varies from 5,345 to 6,857 ppm, with an average of 6,132 ppm. In the prism growth zone, Cl content increases from 5,860 to 6,632 ppm; in the pinacoid growth zone, the Cl distribution has a more complex character from point 9 to point 13 it decreases from 6,857 to 5,345 ppm, and then by point 16, it increases to 6,757 ppm. F content ranges from 76.0 to 172 ppm at points 1–3 and does not exceed 21 ppm at the remaining points. B content is low, and, except for point 9, does not exceed 0.4 ppm.
Which include Fe, substitute Al in the octahedral position. Fe content varies from 920 to 1,248 ppm with an average of 1,108 ppm. Fe content increases from 920 to 1,228 ppm in the prism growth zone and decreases from 1,248 to 981 ppm in the pinacoid growth zone. The behavior of Mg differs: as the prism grows, its content increases insignificantly from 450 to 558 ppm. In the pinacoid growth zone, the drop in Mg content is much more noticeable – from 768 to 440 ppm. In the distribution of Mn, zonality is not fixed: its content mainly ranges from 70 to 90 ppm. Cr content varies from 13.0 to 51.1 ppm with an average of 35.7 ppm. In the prism growth zone, there is a downward trend in Cr content as the crystal grows, from 42.6 to 16.6 ppm. The pinacoid growth zone does not show such a trend. Ti content varies from 7.91 to 23.7 ppm, with an average of 13.1 ppm. Ti content increases with crystal growth in the prism growth zone from 9.83 to 23.7 ppm, while in the pinacoid growth zone, on the contrary, it decreases from 23.6 to 7.91 ppm. Ni content varies from 56.3 to 249 ppm, with an average of 165 ppm, demonstrating zonation. Sc content contrasts with simple crystallographic shape. In the prism growth zone, Sc content increases smoothly with crystal growth from 2.96 to 9.38 ppm, with the exception of point 5 – a probable outline. In the pinacoid growth zone, zonality is absent and Sc content is at a low level from 1.32 to 3.01 ppm. The content of Co and V does not demonstrate zonality and does not exceed 2.5 ppm. The content of Ga varies from 4.10 to 9.68 ppm and averages 5.33 ppm. At the same time, in the prism growth zone Ga content increases during crystal growth from 4.10 to 7.52 ppm (excluding point 5). In the pinacoid growth zone, Ga content is in a narrow range of 4.23–5.08 ppm, and zonality is not observed.
The study of the distribution of minor and trace elements in colorless beryl (goshenite) from LCT-pegmatites of the Pashki deposit (Nuristan province, Afghanistan) allowed us to establish:
(1) Li content in goshenite averages over 3,000 ppm, which is significantly higher than in other pegmatites (e.g., less than 1,239 ppm for goshenite from Pakistan; Hu and Lu, 2020). Li content greater than 3,000 ppm in beryls (goshenites) can be used for prospecting of LCT-pegmatites in the region.
(2) Cs, Na, and Rb content increases as beryl grows from the centre to the crystal edge, which is consistent with the general trend of geochemical evolution of pegmatite melt (Černý et al., 2003; Sardi and Heimann, 2014; Bačík et al., 2021).
(3) Sector zoning is established in the goshenite crystal. In the process of crystal growth (from centre to edge), Fe, Mg, Sc, Ti, Ga and K accumulate in the prism growth zone. In the pinacoid growth zone, on the contrary, the content of these elements either decreases from the centre to the edge of the crystal (Fe, Mg, Ti and K) or remains unchanged at a low level (Sc and Ga). Sector zoning of trace elements in beryls is a relatively rare phenomenon and probably testifies to difference in the mechanisms of growth of faces of different simple forms (Scandale and Lucchesi, 2000).
The original contributions presented in the study are included in the article/Supplementary Material.
SS: Writing–review and editing, Writing–original draft, Investigation, Formal Analysis, Conceptualization. NH: Writing–review and editing, Writing–original draft, Investigation, Conceptualization. MI: Writing–review and editing, Project administration, Formal Analysis, Conceptualization. VS: Writing–review and editing, Visualization.
The author(s) declare that financial support was received for the research, authorship, and/or publication of this article. This work is carried out under state assignments of IPGG RAS, St. Petersburg (Project No. FMUW-2022-0005).
S. G. Simakin and E. V. Potapov assisted with measuring beryl trace element composition.
The authors declare that the research was conducted in the absence of any commercial or financial relationships that could be construed as a potential conflict of interest.
All claims expressed in this article are solely those of the authors and do not necessarily represent those of their affiliated organizations, or those of the publisher, the editors and the reviewers. Any product that may be evaluated in this article, or claim that may be made by its manufacturer, is not guaranteed or endorsed by the publisher.
The Supplementary Material for this article can be found online at: https://www.frontiersin.org/articles/10.3389/feart.2024.1432222/full#supplementary-material
Aurisicchio, C., Conte, A. M., De Vito, C., and Ottolini, L. (2012). Beryl from miarolitic pockets of granitic pegmatites, Elba, Italy: characterization of crystal chemistry by means of EMP and SIMS analyses. Can. Mineral. 50, 1467–1488. doi:10.3749/canmin.50.6.1467
Bačík, P., Fridrichová, J., Uher, P., Vaculovič, T., Bizovská, V., Škoda, R., et al. (2021). Beryl crystal chemistry and trace elements: indicators of pegmatite development and fractionation (Damara Belt, Namibia). Lithos 404, 106441. doi:10.1016/j.lithos.2021.106441
Balaram, V., Santosh, M., Satyanarayanan, M., Srinivas, N., and Gupta, H. (2024). Lithium: a review of applications, occurrence, exploration, extraction, recycling, analysis, and environmental impact. Geosci. Front. 15, 101868. doi:10.1016/j.gsf.2024.101868
Benham, A. J., and Coats, S. (2007). Minerals in Afghanistan: rare-metal deposits. Afghanistan Geological Survey website. Available at: https://nora.nerc.ac.uk/id/eprint/10924.
Černý, P., Anderson, A. J., Tomascak, P. B., and Chapman, R. (2003). Geochemical and morphological features of beryl from the Bikita granitic pegmatite, Zimbabwe. Can. Mineral. 41, 1003–1011. doi:10.2113/gscanmin.41.4.1003
Černý, P., and Ercit, T. S. (2005). The classification of granitic pegmatites revisited. Can. Mineral. 43, 2005–2026. doi:10.2113/gscanmin.43.6.2005
Duan, Z., Jiang, S. Y., Su, H. M., Salvi, S., Monnier, L., Zhu, X., et al. (2024). Beryl as an indicator for elemental behavior during magmatic evolution and metasomatism in the large Shihuiyao Rb-Nb-Ta-Be deposit, Inner Mongolia, NE China. Ore Geol. Rev. 166, 105940. doi:10.1016/j.oregeorev.2024.105940
Fedotova, A. A., Bibikova, E. V., and Simakin, S. G. (2008). Ion-microprobe zircon geochemistry as an indicator of mineral genesis during geochronological studies. Geochem. Int. 46, 912–927. doi:10.1134/S001670290809005X
Hu, Y., and Lu, R. (2020). COLOR characteristics of blue to yellow beryl from multiple origins. Gems Gemology 56, 54–65. doi:10.5741/GEMS.56.1.54
Jochum, K. P., Dingwell, D. B., Rocholl, A., Stoll, B., Hofmann, A. W., Becker, S., et al. (2000). The preparation and preliminary characterisation of eight geological MPI-DING reference glasses for in-situ microanalysis. Geostand. Newsl. 24, 87–133. doi:10.1111/j.1751-908X.2000.tb00590.x
Nosova, A. A., Narkisova, V. V., Sazonova, L. V., and Simakin, S. G. (2002). Minor elements in clinopyroxene from Paleozoic volcanics of the Tagil island arc in the Central Urals. Geochem. Int. 40, 219–232.
Portnyagin, M., Almeev, R., Matveev, S., and Holtz, F. (2008). Experimental evidence for rapid water exchange between melt inclusions in olivine and host magma. Earth Planet. Sci. Lett. 272, 541–552. doi:10.1016/j.epsl.2008.05.020
Rossovskiy, L. N., and Chmyrev, V. M. (1977). Distribution patterns of rare-metal pegmatites in the Hindu Kush (Afghanistan). Int. Geol. Rev. 19, 511–520. doi:10.1080/00206817709471047
Sardi, F. G., and Heimann, A. (2014). Pegmatitic beryl as indicator of melt evolution: example from the Velasco district, Pampeana Pegmatite Province, Argentina, and review of worldwide occurrences. Can. Mineral. 52, 809–836. doi:10.3749/canmin.1400032
Scandale, E., and Lucchesi, S. (2000). Growth and sector zoning in a beryl crystal. Eur. J. Mineral. 12, 357–366. doi:10.1127/ejm/12/2/0357
Simmons, W. B., Pezzotta, F., Shigley, J. E., and Beurlen, H. (2012). Granitic pegmatites as sources of colored gemstones. Elements 8, 281–287. doi:10.2113/gselements.8.4.281
Skublov, S. G., Gavrilchik, A. K., and Berezin, A. V. (2022). Geochemistry of beryl varieties: comparative analysis and visualization of analytical data by principal component analysis (PCA) and t-distributed stochastic neighbor embedding (t-SNE). J. Min. Inst. 255, 455–469. doi:10.31897/PMI.2022.40
Keywords: Pashki deposit, beryl, goshenite, spodumene pegmatites, SIMS method, trace elements
Citation: Skublov SG, Hamdard N, Ivanov MA and Stativko VS (2024) Trace element zoning of colorless beryl from spodumene pegmatites of Pashki deposit (Nuristan province, Afghanistan). Front. Earth Sci. 12:1432222. doi: 10.3389/feart.2024.1432222
Received: 13 May 2024; Accepted: 17 June 2024;
Published: 25 July 2024.
Edited by:
Alcides Nobrega Sial, Federal University of Pernambuco, BrazilReviewed by:
Ricardo Scholz, Universidade Federal de Ouro Preto, BrazilCopyright © 2024 Skublov, Hamdard, Ivanov and Stativko. This is an open-access article distributed under the terms of the Creative Commons Attribution License (CC BY). The use, distribution or reproduction in other forums is permitted, provided the original author(s) and the copyright owner(s) are credited and that the original publication in this journal is cited, in accordance with accepted academic practice. No use, distribution or reproduction is permitted which does not comply with these terms.
*Correspondence: Sergey G. Skublov, c2t1YmxvdkB5YW5kZXgucnU=
†Deceased
Disclaimer: All claims expressed in this article are solely those of the authors and do not necessarily represent those of their affiliated organizations, or those of the publisher, the editors and the reviewers. Any product that may be evaluated in this article or claim that may be made by its manufacturer is not guaranteed or endorsed by the publisher.
Research integrity at Frontiers
Learn more about the work of our research integrity team to safeguard the quality of each article we publish.