 Wenfeng Tao
 Qing Liang
 Chao Chen
- Hubei Subsurface Multi-Scale Imaging Key Laboratory, School of Geophysics and Geomatics, China University of Geosciences, Wuhan, China
The East African Rift System (EARS) provides an ideal natural laboratory for studying the mechanisms of tectonic plate breakup and continental drift, as well as a unique perspective for exploring the maturation process of continental rifting and its drivers. This study combines high-resolution satellite gravity data and seismic tomography model with an integrated geophysical approach to reveal the density structures in the upper mantle of the EARS. The results show that the northeastern to central Congo and Zimbabwe Craton exhibit significant high-density anomalies extending up to 250 km, which is indicative of a thicker and more intact lithosphere. In contrast, the Uganda, Tanzania, eastern and southern Congo, and Kaapvaal Craton show shallow high-density anomalies underlain by low-density anomalies that are clearly derived from the deeper mantle, indicating a thining of the lithosphere with some degree of possible melting at the base. The various rift segments of the EARS exhibit different rift morphologies. The Main Ethiopian Rift and the Kenya Rift of the Eastern Rift Branch show strong low-density anomalies, indicating intense melting, which is much stronger than that observed in the Western Rift Branch. However, the two rifts may have originated from the same mantle uplift in which the low-density anomalies of the Eastern and Western Rift Branches connected in the deep upper mantle. The lower portion of the Malawi Rift exhibits weaker low-denstiy anomalies, which can be observed to the south of the Malawi Rift, extending further south as a continuation of the EARS. Combining the results of previous kinetics simulations and our density perturbation results, it can be inferred that the Eastern Rift Branch is mainly affected by active rifting, while the Western Rift Branch is affected by both active and passive rifting.
1 Introduction
The East African Rift System (EARS) is a prominent continental rift that extends through eastern Africa (Figure 1) and is characterized by extensive rift morphologies, rifting rates, volcanic and seismic activity reflecting the complexity of its geological processes (Adams et al., 2018).
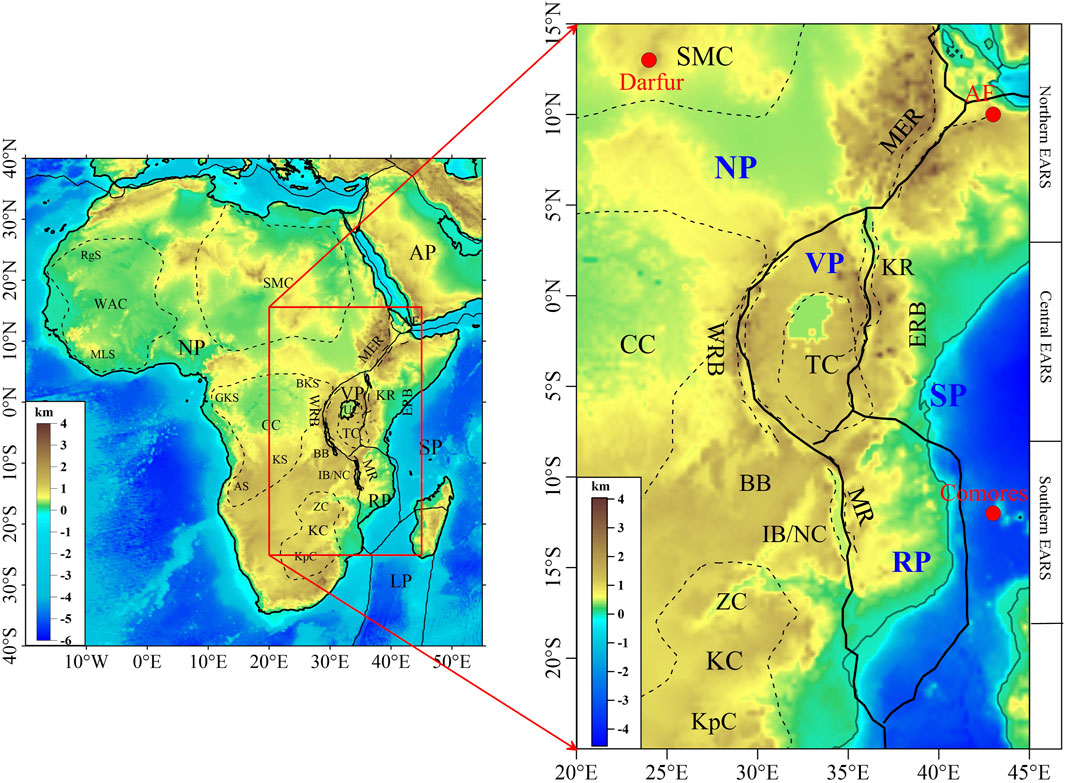
Figure 1. Tectonic map of the EARS. Topographic datas are from the ETOPO1 global topographic/bathymetric model (Amante and Eakins, 2009); solid black lines are plate boundaries, dashed black lines are major tectonic units, and red dots are hotspots (Courtillot et al., 2003); Plate names: NP, Nubian Plate; SP, Somalian Plate; VP, Victoria Microplate; RP, Rovuma Microplate; Tectonic unit names: CC, Congo Craton; KC, Kalahari Craton; TC, Tanzania Craton; SMC, Saharan MetaCraton; ZC, Zimbabwe Craton; KpC, Kaapvaal Craton; NC, Niassa Craton; MER, Main Ethiopian Rift; KR, Kenya Rift; MR, Malawi Rift; BB, Bangweulu Block; IB, Irumide Belt; East African Rift is divided into two branches: ERB, Eastern Rift Branch; WRB, Western Rift Branch.
The EARS is a significantly spreading plate boundary embedded in the vast plateaus of eastern and southern Africa and is thought to be supported in part by dynamic processes in the lower mantle (e.g., Nyblade and Robinson, 1994; Bagley and Nyblade, 2013; Braun et al., 2014). The development of the EARS involves multiple stages and styles. In the northern EARS, which begins at the Afar Triple Junction, a single magmatically active rift, the Main Ethiopian Rift, forms with well-defined boundary faults. To the south, the central EARS splits into the Eastern and Western Rift Branches, which formed preferentially within the Proterozoic mobile belts that surrounds the Tanzania Craton, highlighting the key role of preexisting tectonics in rift positioning (e.g., Kendall and Lithgow-Bertelloni, 2016). The Western Rift Branch consists of linear rift segments with numerous lakes whose volcanism is confined to isolated volcanic fields. Despite low volcanic activity, the Western Rift Branch has been one of the most seismically active regions in the entire rift system over the past decade, with earthquakes focus deeper than 20 km showing brittle failure deep in the crust (Foster and Jackson, 1998; Yang and Chen, 2010; Mulibo and Nyblade, 2016). The southern Malawi Rift is the terminus of the Western Rift Branch, a weakly extended zone about 800 km long with asymmetric bounding faults and deep seismicity, less defined extension continuing to the coast (e.g., Jackson and Blenkinsop, 1993; Craig et al., 2011; Fagereng, 2013). In contrast, the Eastern Rift Branch is less seismic but more magmatically active. The northern Kenya Rift is highly magmatic, with surface deformation concentrated in an area only 50 km wide. To the south, volcanics and deformation spreads to form the Tanzania Divergence Zone (TDZ; e.g., Ring, 2014), which spans 300–400 km.
Through body wave tomography, surface wave tomography, and receiver function analysis (e.g., Weeraratne et al., 2003; Begg et al., 2009; Hansen et al., 2009; Fishwick, 2010; Adams et al., 2012; Mulibo and Nyblade, 2013; O'Donnell et al., 2013; Wölbern et al., 2012), the lithosphere of the Tanzania Craton is determined to be significantly thicker than that of the surrounding area, with a maximum estimated thickness of between 150 and 200 km, whereas the lithosphere of the surrounding area does not typically exceed 120 km. It is worth noting that although these estimates suggest that the lithosphere of the Tanzania Craton is thicker. It is still thinner than other African cratons, such as the West African craton in the west of the continent, the Congo craton in the center, and the Kalahari craton in the south. On its eastern side, the dramatic decrease in lithospheric thickness has led some scholars to suggest that the Craton may have been altered or eroded by processes associated with the mantle plume (e.g., Weeraratne et al., 2003; Park and Nyblade, 2006; Adams et al., 2012). Within the rift segments, cylindrical low-velocity zones are found beneath the Western Rift Branch volcanically active zone (Adams et al., 2012; O'Donnell et al., 2013), while wide low-velocity zones are prevalent beneath the more magmatically active Eastern Rift Branch. In the south, the low-velocity zone beneath the central EARS typically extends below the northern end of the Malawi Rift, but no low-velocity zone is observed below the central Malawi Rift (O'Donnell et al., 2013). The distinctive rapidity feature beneath the Bangweulu Block suggests velocities comparable to those of the Tanzania Craton at depths of less than 80 km, with a distinctive southern boundary in eastern Zambia (O'Donnell et al., 2013).
The location, nature, and even the number of terminal rift segments in the EARS remain controversial. It is generally accepted that the southernmost major rift segment in the EARS is the Malawi Rift, although GPS evidence suggests the presence of less obvious extensions southward to the coast (Saria et al., 2014). Below the northern end of the Malawi Rift, there is significant low-velocity motion associated with the active rift, but no similar low-velocity motion is observed below the central Malawi Rift (O'Donnell et al., 2013). Within the Kibaran Belt north of the Bangweulu Block, a second hypothesis for a terminal rift segment is proposed, in which the low-velocity region extends westward from the southern margin of the Tanzania Craton to western Zambia. This is spatially related to the previously inferred embryonic rift segment of the Kibaran Belt between the Bangweulu Block and Congo Craton (e.g., Fairhead and Girdler, 1969; Fairhead and Henderson, 1977; Foster and Jackson, 1998; Mulibo and Nyblade, 2016).
Some scholars, based on geologic mapping and geophysical data, have suggested that the Eastern Rift Branch extends southward along the Tanzania Craton boundary and connects to the Western Rift Branch north of the Malawi Rift (Le Gall et al., 2008). Other scholars have found tomography evidence of a low-velocity diffuse zone extending from the TDZ toward the east coast of Tanzania to a depth of 100–200 km, indicating the presence of the northern boundary of the Ruvuma Microplate, one of a number of small cohesive lithospheric blocks thought to be responsible for the separation of the Nubian and Somalian Plates. However, they found no evidence to support a similar low-velocity feature along the southwesterly boundary of the Ruvuma Microplate (O'Donnell et al., 2013). Mulibo and Nyblade (2016) identified a region of seismicity extending southeastward from the TDZ dominated by normal faulting and in contrast to O'Donnell et al. (2013) found a low-velocity zone that overlaps. They also identified a region of less pronounced seismicity that extends southwest to Lake Malawi, includes normal and strike-slip faults, and matches the southwestern connection proposed by Le Gall et al. (2008).
Previous studies have shown a lateral bifurcation of the EARS subsurface rift process that overlaps with the northern boundary of the Ruvuma Microplate. The bifurcation is located at the southern end of the Eastern Rift, a southeast extension of the Southwest Rift Branch consistent with GPS studies and plate motion models that divide the region between the Nubian and Somalian Plates into the Victoria and the Ruvuma Microplates (e.g., Saria et al., 2014). However, the limited station coverage in the region restricts detailed imaging of deep lithospheric and asthenosphere. Through the inversion of combined seismic tomography and gravity anomaly data, we provide a detailed resolution of the 3D density structure of the upper mantle of the EARS to a depth of 600 km, which is important for understanding tectonic and geodynamic processes in the EARS region.
2 Data and methodology
The method employed in this work (Figure 2), which is the same as some scholars (Liang et al., 2019; Finger et al., 2022). First, the mantle gravity anomaly of the study area can be obtained by subtracting the topography and crustal gravity effects from the Free air gravity anomaly; second, the S-wave velocity perturbation model is used to obtain the initial density model by means of an empirical transformation formula; and lastly, the upper mantle density structure of the EARS can be obtained by combining the two for inversion.
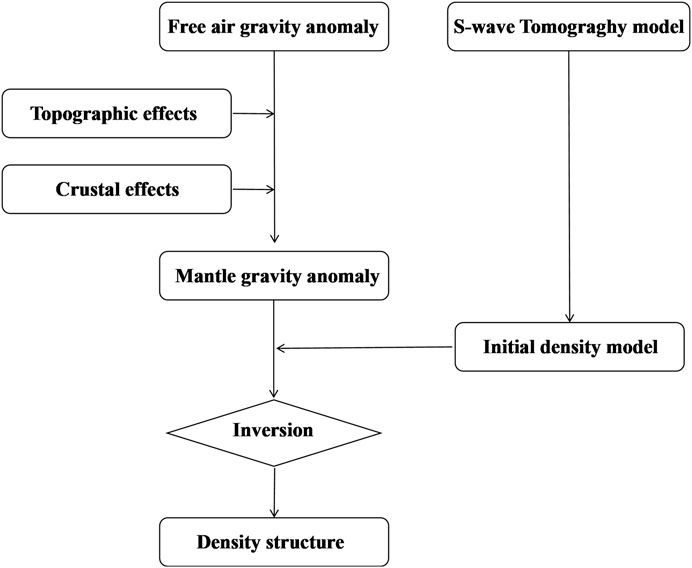
Figure 2. Methodology flow chart to obtain the denstiy structure of EARS.
2.1 Mantle gravity anomalies
The mantle gravity anomalies used in this paper were obtained by subtracting the gravity effects of topography and crust from the initial gravity field (EIGEN-6C4, Förste et al., 2014). We compute the effect of density deviations from a 1D reference model (Table 1) as in previous studies (Liang et al., 2019; Finger et al., 2022). A topographic map of the EARS was obtained using ETOPO1 data (Figure 1), topographic effects (Supplementary Figure S1) were subtracted from the Free air gravity anomaly (Figure 3A) to obtain the Bouguer gravity anomaly (Figure 3B) for the study area, and gravity effects due to sedimentary layer, crystalline crust, and Moho relief were calculated using the ECM1 (Mooney et al., 2023) global crustal model (Supplementary Figure S2). These crustal effects (Figure 4A) were subtracted from the initial gravity field and filtered on a certain scale to obtain the adopted mantle gravity anomaly (Figure 4B).
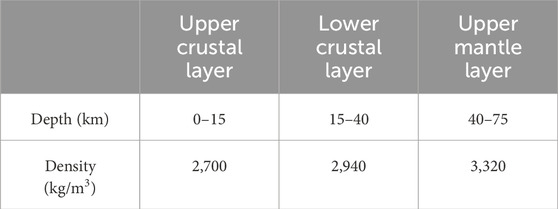
Table 1. 1-D Reference model of the crust and uppermost mantle.
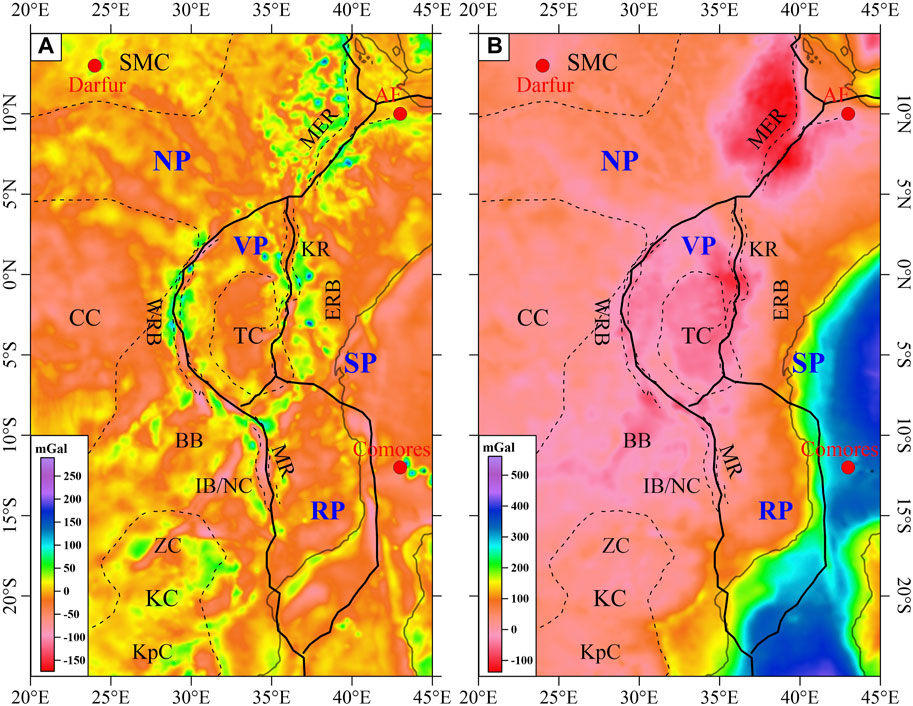
Figure 3. (A) Free air gravity anomaly according to the model EIGEN-6C4 downscaled to 0.5° × 0.5° (Förste et al., 2014). (B) Bouguer gravity anomaly after subtracting the effect of topography (see Supplementary Figure S1) from the Free air gravity anomaly.
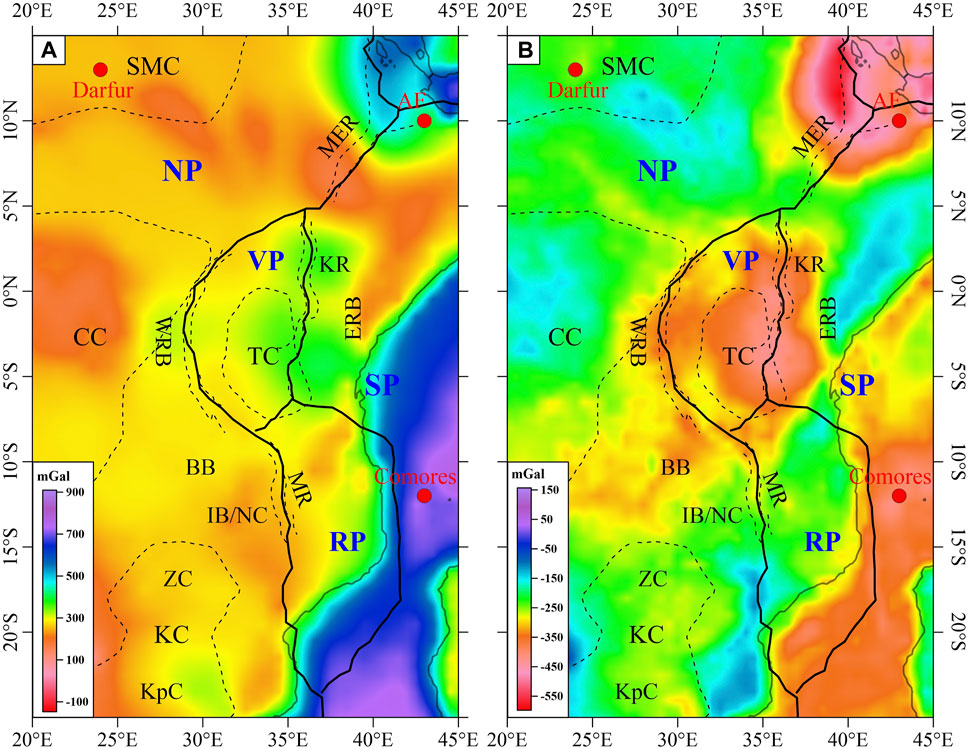
Figure 4. (A) Gravity effects of crust due to sediments, crustal density variation and the Moho relief. (B) Mantle gravity anomalies after subtracting the effect of crust from the Bouguer gravity anomaly.
2.2 Initial density modeling
In this study, the initial density model was obtained by converting the AF2019 model provided by Celli et al. (2020). The S-wave velocity perturbations were converted to temperature and then to density perturbations using mineral physics methods.
Velocity-temperature and density-temperature curves for mantle peridotites were obtained by fitting six minerals common to the upper mantle (Fo90, Fo92, orthoclase, ferrofeldspar, garnet, and spinel) using available mineralogical information (Levandowski et al., 2015); through extensive mineralogy, density varies with respect to a reference value (assumed to be solid) at a reference density ρ0 = 3,200 kg/m3 and velocity V0 = 4,500 m/s, and density perturbations at depth z can be obtained:
This equation assumes that changes in seismic transverse wave velocity are caused by temperature alone, and is estimated from regressions of transverse wave velocity on density data for olivine rocks at different temperatures. This velocity-density relationship ignores compositional variations, the most important of which may be the difference between the enriched and deficient upper mantle. Empirical correlations between the magnesium number of the lithospheric mantle, Mg# (Mg# = [Mg]/[Mg + Fe]), seismic velocity, and density suggest that a unit increase in Mg# leads to an ∼0.4% (∼13 kg/m3) decrease in density and a 0.25% (∼0.01 km/s) increase in wave velocity (Schutt and Lesher, 2010). Thus, using this relation with a unit increase in the magnesium number Mg# leads to an overestimation of the density by 15 kg/m3. In other words, this relation overestimates the density of rocks in the deficit mantle and underestimates the density of rocks in the enriched mantle.
Therefore, the initial velocity perturbation model and the initial density model are obtained by referring to the above article (Equations 1a, 1b), and the velocity perturbation models at depths of 75 km, 125 km, 175 km, 225 km, 300 km, and 500 km are shown in Figure 5 below. The initial density model obtained from the conversion is shown in Supplementary Figure S3.
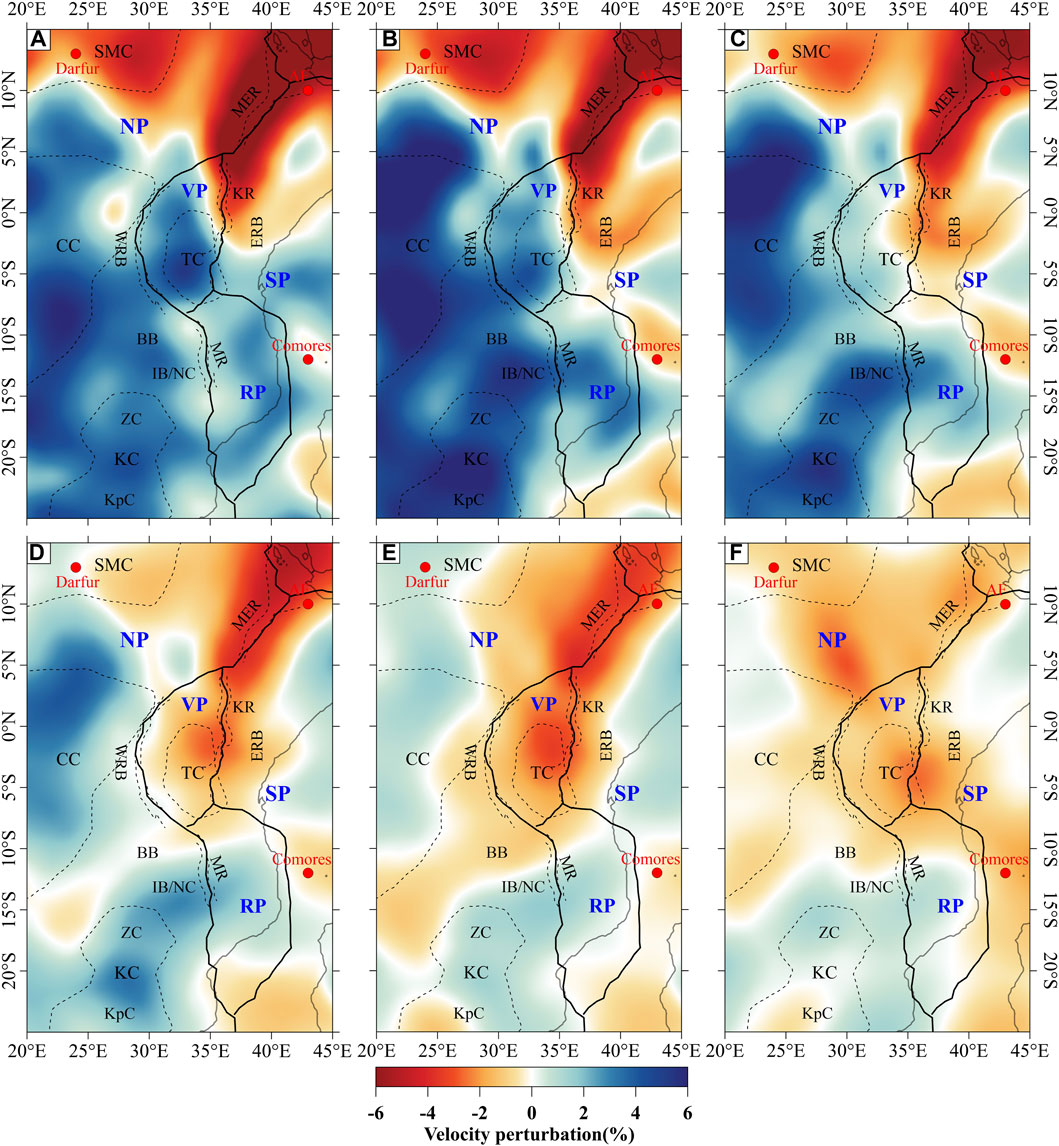
Figure 5. S-wave velocity perturbation of the tomography model AF2019 (Celli et al., 2020) at the depths of (A) 75 km, (B) 125 km, (C) 175 km, (D) 225 km, (E) 300 km and (F) 500 km.
2.3 Gravity inversion algorithm and parameters
The 3D inversion algorithm of Liang et al. (2014) is used in this study. This method considers the topography of the Earth and is suitable for large-scale inversion. Usually, 3D gravity inversion is performed in a Cartesian coordinate system, which approximates the surface as a plane. Since our study area spans 20°E–45°E in longitude and 25°S–15°N in latitude, a spherical coordinate system inversion must be performed for the study area. Since the resolution of the solved gravity anomaly is 0.5° × 0.5°, the initial density model is also represented on the same grid with a step size of 25 km in depth.
In gravity data inversion, it is necessary to constrain geological and geophysical information to limit the non-uniqueness and instability of the inversion. We follow Li and Oldenburg (1998) (Equations 2, 3) in proposing a density model based on seismic stratigraphic imaging, and use this initial density model as a constraint on the inversion. Thus, the objective function can be defined as:
where,
where G is the kernel matrix or the integral operator that converts the density to a gravity field, g is the mantle gravity anomaly, ρ and ρ0 denote the density to be solved and the initial density vector, respectively, and Wρ is one of the important parameters of the model’s objective function, which is defined as a weighting matrix in the spherical coordinate system (Liang et al., 2014).
Liang et al. (2019) used this method to conduct tests on a numerical model to analyze the resolution of this inversion method and the effect of uncertainty in the initial density structure based on seismic tomography. The test results show that the inversion results are able to reproduce the shape of the predefined density body well, including lateral and vertical variations, although the density anomaly amplitude may be reduced due to damping.
3 Inversion result
The inversion density model produces gravity anomalies that are very close to the mantle gravity anomalies, with error amplitudes of ±20 mGal (see Supplementary Figure S4). The main difference between the inversion model and the initial model is the variations in the mantle density anomaly. For example, the initial model obtained from seismic tomography imaging shows low-density anomalies under the Saharan MetaCraton, while the mantle gravity anomalies show large high-value anomalies. Thus, our approach offers another possibility for resolving additional features of the upper mantle structure that are not visible in seismic tomography models because of the lack of resolution or low sensitivity of seismic wave velocities to compositional variations. The inversion results reveal density variation features that reflect the lateral variations of density structures in the upper mantle (Figure 6).
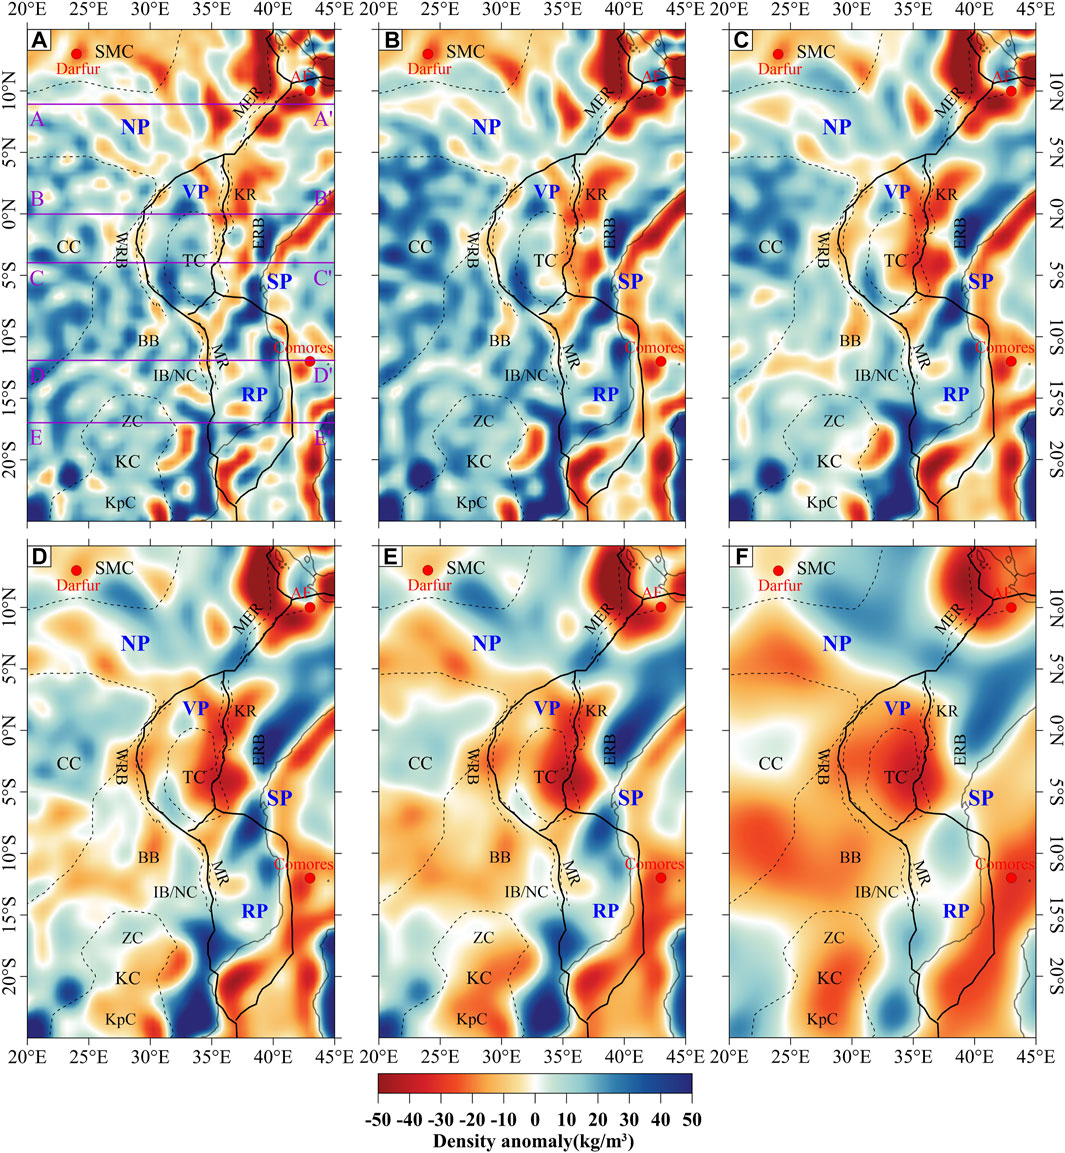
Figure 6. Inversion density variations at the depths of (A) 75 km, (B) 125 km, (C) 175 km, (D) 225 km, (E) 300 km and (F) 500 km. Five profiles (AA’, BB’, CC’, DD’ and EE’) at the 75 km plot show locations of vertical cross-sections in Figure 7. Solid black lines are plate boundaries, dashed black lines are major tectonic units, and red dots are hotspots (Courtillot et al., 2003); Plate names: NP, Nubian Plate; SP, Somalian Plate; VP, Victoria Microplate; RP, Rovuma Microplate; Tectonic unit names: CC, Congo Craton; KC, Kalahari Craton; TC, Tanzania Craton; SMC, Saharan MetaCraton; ZC, Zimbabwe Craton; KpC, Kaapvaal Craton; NC, Niassa Craton; MER, Main Ethiopian Rift; KR, Kenya Rift; MR, Malawi Rift; BB, Bangweulu Block; IB, Irumide Belt; East African Rift is divided into two branches: ERB, Eastern Rift Branch; WRB, Western Rift Branch.
The inversion results show strong density heterogeneity in the EARS. Overall, the inversion results for shallow (75–225 km, Figures 6A–C) profile reveal that the Congo, Zimbabwe, Kaapvaal, and Tanzania Cratons exhibit obvious high-density anomalies, with low-density anomalies mainly in the various rift segments and in the Saharan MetaCraton. The Tanzania Craton still shows a strong high-density anomaly at a depth of 175 km compared to several other Cratons in the EARS, but the results observed at a depth of 225 km show a low-density anomaly. Meanwhile, we can see that the southeastern and northern parts of the Congo Craton do not show a strong high-density anomaly, which, in comparison with the previous Mg# results (Finger et al., 2022), infers that it may have undergone reactivation. In the Saharan MetaCraton, we can see a high-density anomaly, inferring that it may be a residual Saharan MetaCraton with cratonic roots. Notably, the Eastern and Western Rift Branches show different density anomalies in the shallow part, the Western Rift Branch shows a weak low-density anomaly, and the Eastern Rift Branch shows a strong low-density anomaly, which may be related to the different modes of action of the Eastern and Western Rift Branches. Overall, low-density anomalies are present below each rift section, but the areas corresponding to the low-density anomalies is much larger than those corresponding to the surface rifting. In the shallow depth (Figures 6A–C), we observe an independent low-density anomalies below the rift segments, which is referred to the model of multiple mantle plumes below the African continent proposed by the previous studies (Rajaonarison et al., 2023). For the density variation in depth of 225–500 km (Figures 6D–F), the low-density anomalies below the rift segments are connected in the deep part of the inversion results. We infer that the low-density anomalies are from the existence of a super-mantle plume beneath the East African continent, suggesting a form of northward flow of mantle-sourced materials (Qian and Yang, 2023).
4 Discussion
According to the global seismic data (see Supplementary Figure S5), there are few earthquakes of magnitude 7 or greater within the study area with low tectonic correlation. There are many earthquakes of magnitude 4–7, mainly in the eastern and southern parts of the continent, especially in the EARS. The earthquakes are frequently occurred in the Red Sea region, starting from the Afar Triple Point and following the East African Rift all the way up to the Kalahari Craton. It is obvious that the Western Rift Branch is significantly more seismic than the Eastern Rift Branch, and the magmatic activity of the Eastern Rift Branch is much greater than that of the Western Rift Branch, which may be related to the different modes of action of the Eastern and Western Rift Branches. At the same time, seismicity is less common in the Saharan MetaCraton and the western and central parts of the Congo Craton, which may indicate that these cratons are still very stable and have experienced less geological activity, which corresponds well with the results of Mg# measured by previous researchers (Finger et al., 2022); in contrast, seismicity is more frequent in the southeastern part of the Congo, Tanzania, and Kalahari Craton, indicating that they are still subjected to complex geotectonic activity and that their craton’s roots have suffered a certain degree of damage.
4.1 Northern EARS
The northern EARS consists mainly of the Afar hotspot and the Main Ethiopian Rift. Profile AA’, a profile that passes mainly through the Main Ethiopian Rift, has an overall topography that is significantly higher than that of surrounding area, and may have a clear connection to the mantle upwelling below (Al-Hajri et al., 2009). The inversion results reveal more lateral density variations than the seismic S-wave velocity perturbation results (see Figure 7 AA’ and Supplementary Figure S6 AA’). The very pronounced low-density anomalies beneath the Main Ethiopian Rift, which are deeply extended and of high amplitude, indicate that intense melting occurred beneath the former and that a large number of volcanics formed at the surface, with the main development of Eocene-Oligocene and Miocene-Pliocene volcanics, with the age of volcanics progressively increasing away from the rift section (Ebinger, 1989). The difference between the rifting effects is that the low-density anomalies are not located directly below the Main Ethiopian Rift, but rather below the Somalian Plate, which better distinguishes the two plates. The density anomalies below the rift show a clear low-high-low pattern from west to east. The low-density anomalies in the western part of the Main Ethiopian Rift with no deep continuation may be the result of magma chambers forming at violent plate boundaries, and may also originate from the migration of mantle-sourced thermal material in the eastern part of the rift. The apparent high-density anomalies in the middle part of the rift may be the result of upwelling of mantle-sourced thermal material from below, leading to lithospheric dismantling and sinking. The upwelling of mantle-sourced hot material beneath MER has led to intense melting, resulting in a change in the composition of uppermost mantle or lithospheric material, possibly with an increase in density, which is also consistent with previous results (Finger et al., 2022). The inverted density anomalies include the effects of thermal and compositional changes in upper mantle material, where the compositional changes may be due to partial melting. However, our inversion does not include the effect of partial melting, and does not differentiate between the two factors.
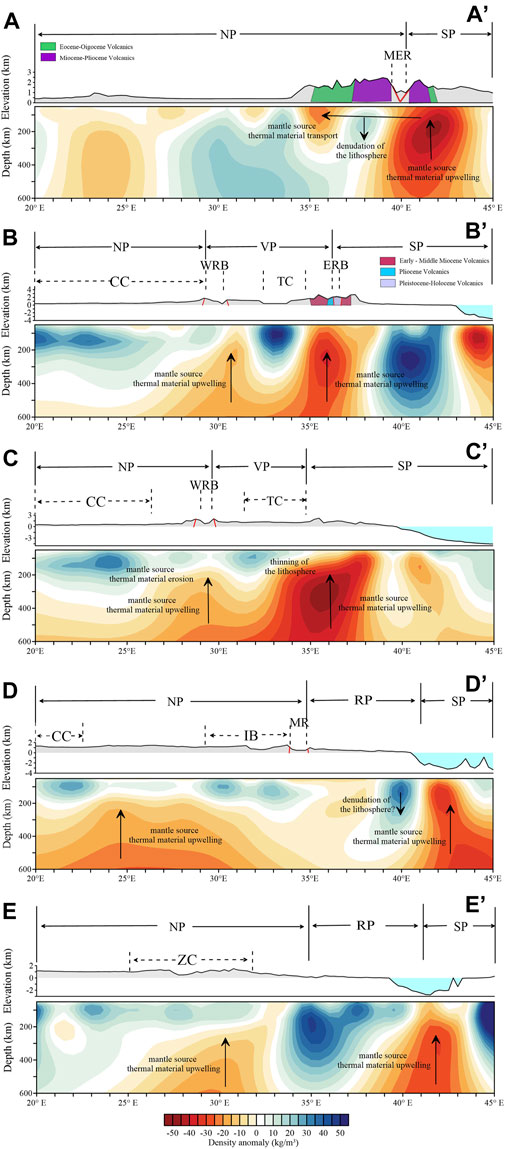
Figure 7. Vertical profiles of the inverted density structure along five lines (AA’–EE’), shown in Figure 6. Each profile contains two results, topographic and density inversion results from top to bottom. The different colored blocks in the figure represent different ages of volcanics exposed at the surface and the solid red lines respresnt the faults (quoted from https://www.brgm.fr/en/reference-completed-project/new-edition-110000000-geological-map-africa). Solid black lines are plate boundaries, dashed black lines are major tectonic units; Plate names: NP, Nubian Plate; SP, Somalian Plate; VP, Victoria Microplate; RP, Rovuma Microplate; Tectonic unit names: CC, Congo Craton; TC, Tanzania Craton; ZC, Zimbabwe Craton; MER, Main Ethiopian Rift; KR, Kenya Rift; MR, Malawi Rift; IB, Irumide Belt; East African Rift is divided into two branches: ERB, Eastern Rift Branch; WRB, Western Rift Branch.
4.2 Central EARS
The central EARS consists mainly of the Kenya Rift of the Eastern Rift Branch, the Western Rift Branch and the Tanzania Craton. The two profiles mainly pass through the Eastern and Western Rift Branches of the EARS, with the difference that profile CC’ does not pass through the area of surface rifting of the Eastern Rift Branch. The topography of the Eastern Rift Branch is significantly higher than that of the Western Rift Branch, and the low-density anomalies beneath the Eastern Rift Branch and the Western Rift Branch also show differences. Both the Eastern and Western Rift Branches have obvious low-density anomalies beneath them, with higher amplitudes, but slightly weaker amplitudes than those of the Main Ethiopian Rift in the northern part of the country; at the same time, these low-density anomalies continue very deeply and are connected together, which indicates that mantle-sourced thermal materials beneath the Eastern and Western Rift Branches have the same origin. The difference is that the low-density anomalies beneath the Eastern Rift Branch rise to the top of the upper mantle, while those beneath the Western Rift Branch rise only to a depth of 200 km, and the low-density anomalies beneath the Eastern Rift Branch are stronger than those beneath the Western Rift Branch. The differences between these low-density anomalies beneath the Eastern and Western Rift Branches may to some extent reflect their different surface expression. The Kenya Rift surface of the Eastern Rift Branch is exposed to a large number of volcanics, mainly early-middle Miocene, Pliocene, and Pleistocene-Holocene volcanics, with less seismic activity in recent years (Yang and Chen, 2010), while the surface of the Western Rift Branch does not have any significant volcanics exposed, and volcanic activity is more limited; However, a large number of earthquakes have occurred, indicating brittle failure deep in the crust (Foster and Jackson, 1998). At the same time, we can see that the eastern part of the Congo Craton and the lower part of the Tanzania Craton show weak high-density anomalies, and the depth of continuation is relatively shallow, and below the high-density anomalies there are obvious low-density anomalies originating from the deeper mantle, which indicates that they may have been eroded by mantle-sourced thermal material from the lower part of the mantle and led to the thinning of the lithosphere (e.g., Weeraratne et al., 2003; Park and Nyblade, 2006; Adams et al., 2012).
4.3 Southern EARS
The southern EARS consists mainly of the Malawi Rift of the Western Rift Branch, which is generally considered to be the southern terminus of the entire EARS, based on both surface observations and seismic tomography (e.g., Jackson and Blenkinsop, 1993; Craig et al., 2011; Fagereng, 2013). Seismic tomography results show that the Malawi Rift exhibits significantly high velocities below it, with significant rift-related low velocities observed only in the northern part of the Malawi Rift, and no trend toward southward extension is observed (see Figure 5). Our inversion results provide a different interpretation from seismic tomography, showing that the Malawi Rift exhibits a very weak low-density anomaly beneath the rift, which, although much weaker than the intensely magmatic Main Ethiopian Rift and Kenya Rift, can continue into the deep mantle, possibly due to upwelling of deep mantle-sourced thermal material and the formation of small magma chambers at shallow depths (see Figure 7 DD’). Profile EE’ better shows this low-density anomaly structure, showing a low-high-low pattern, the obvious low-density anomalous structure underneath the Nubian and Somalian plates is sandwiched by a high-density anomaly of the Ruwuma Microplate, which may have led to the detachment of the Ruwuma Microplate, and this may be one of the driving forces of the rotation of the Ruwuma Microplate (Stamps et al., 2018). Although the seismic tomography imaging results do not show obvious low-velocity anomalies south of the Malawi Rift, our inversion results profile EE’ can still clearly show low-density anomalies, so it can be inferred that the Malawi Rift is not the end point of the southern part of the EARS, and that there are still low-density anomalies underneath the southern Malawi Rift, which may be a continuation of the southern part of the East African Rift.
4.4 Tectonic evolution
The southern African Mega plume is moving to the NE along the EARS and is divided into two main mantle plumes: the Afar mantle plume and the Kenya mantle plume (Ebinger et al., 2000). The Afar mantle plume began to uplift in the Eocene-Oligocene and the Kenya mantle plume was uplifted vigorously in the early-middle Miocene. Mantle plume uplift and volcanism are well matched, with intense volcanism usually accompanying the core of mantle plume uplift, resulting in the formation of widely distributed volcanic overflow-phase deposits. Mantle plume uplift coincided with or slightly preceded rift tensioning (George et al., 1998; Ebinger et al., 2000; Rogers, 2006). The Eastern Rift Branch was formed at the end of the Eocene and the beginning of the Oligocene, and mainly developed Oligocene-Holocene stratigraphy, with a wide distribution of volcanic rocks and a large thickness; the Western Rift Branch began to experience tension at the beginning of the Miocene, and developed Miocene-Holocene stratigraphy, with clastic deposition, and sporadic distribution of volcanics (Ebinger, 1989). There were two major volcanic events in the study area: the early-middle Miocene and the early Pliocene. The early-middle Miocene (ca. 20–10 Ma) was characterized by intense volcanic activity, and the volcanics in this period were mainly basaltic, with a thickness of more than a kilometer and a wide distribution (Ebinger, 1989). The early Pliocene volcanic events (3–5 Ma) were weaker, and the volcanic rocks were basalt or tuff, with a thickness of several tens of meters, but also with a wider distribution range (Ebinger, 1989).
Depending on the driving mechanism, lithospheric tensioning includes both active and passive rifting modes (Morgan and Baker, 1983; Turcotte and Emermen, 1983; Keen, 1985; Lesne et al., 1998; Corti et al., 2003). In regions dominated by active rifting, passive rifting also occurs. Large-scale upwelling lateral shunting of mantle-sourced thermal material causes stresses to be transmitted distally to form rift valleys. This kind of rift formation is mainly controlled by the change in regional tensile stress caused by the lateral flow of plastic material in the asthenosphere, which should be a passive rift. Therefore, against the background of large-scale active uplift of the mantle plume, active and passive rifts developed at the same time. In the passive rift mode, regional tensile stress is the main driving force for lithospheric thinning and rupture, the order of rift evolution is regional tensile–rift–volcano, and volcanic eruption generally occurs in the late stage of rift evolution. In the active rift mode, the upwelling convection of asthenosphere’s material is the main driving force of lithospheric tension, and the rift evolution sequence is dome structure-volcano–rift. The upwelling of asthenosphere’s materials causes regional uplift, so active rift are usually developed in highland areas, and the rifts are long, narrow and accompanied by large-scale volcanic eruptions, which usually occur at the early stage of rift formation. This is also confirmed by physical simulation experiments (Zhou et al., 2000).
By combining the results of previous kinetic simulations and our density structure, we make the following modifications to the previous evolution of the EARS (Saria et al., 2014; Zwaan and Schreurs, 2020; Zwaan and Schreurs, 2023). However, we must note that the exact ages of the various rift segments along the EARS are controversial, and because of the limited amount of initial extension, this early extension may not have left clear field evidence (Macgregor, 2015; Purcell, 2018). Therefore, which can be obtained as follows (Figure 8):
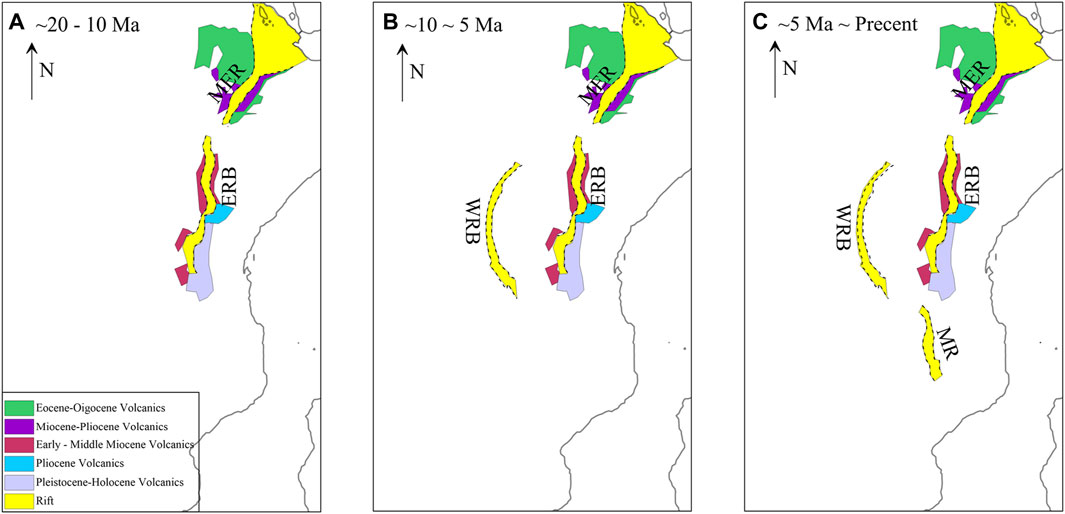
Figure 8. Tectonic evolution of the EARS, modified from Zwaan and Schreurs (2023). The different colored blocks in the figure represent different ages of volcanics exposed at the surface (quoted from https://www.brgm.fr/en/reference-completed-project/new-edition-110000000-geological-map-africa). Tectonic unit names: MER, Main Ethiopian Rift; KR, Kenya Rift; MR, Malawi Rift; East African Rift is divided into two branches: ERB, Eastern Rift Branch; WRB, Western Rift Branch.
During the early Eocene, the Afar mantle plume was uplifted, and large-scale upwelling of mantle-sourced thermal material from the asthenosphere occurred, resulting in the formation of a dome tectonics in the Ethiopian region, which was accompanied by a large amount of volcanic activity and the formation of a large amount of volcanics at the surface, which is characterized by a low-density anomaly of very high amplitude in the density inversion results, corresponding to intense melting. The density inversion results show very high-amplitude and low-density anomalies, which correspond to intense melting, indicating that the Main Ethiopian Rift was influenced mainly by active rifting.
Subsequently, at the end of the Eocene-Oligocene, under the influence of regional tensile stress formed by the uplift of the Afar mantle plume, the Kenya Rift began to form, and in the early-middle Miocene, the Kenya mantle plume began to uplift, the topography of the Kenya area was uplifted, the northern volcano erupted violently, forming a large amount of volcanics, and the results of the density inversion showed a low-density anomaly that was slightly weaker than that of the Main Ethiopian Rift. The density inversion results show a low-density anomaly that is slightly weaker than that of the Main Ethiopian Rift. Therefore, the Kenya Rift was affected mainly by active rifting, but also by passive rifting.
In the Miocene, the West Rift Branch was under the control of the regional tensile stress caused by the upwelling lateral flow of mantle-sourced thermal material from the East Rift Branch, and developed a large number of earthquakes, with only a small amount of volcanism and localized volcanics exposed on the surface. Meanwhile, the upwelling of mantle-sourced thermal material beneath the West Rift Branch can also be seen in the results of the density inversions, which suggests that the West Rift Branch was subjected to passive and active rifting at the same time. The Malawi Rift further south formed later than the West Rift Branch, and the weak low-density anomalies observed in the lower part of the rift suggest that it was mainly affected by passive rifting.
5 Conclusion
We calculated the gravity effect of the upper mantle beneath the EARS using several corrections and processing methods on satellite gravity data. The density structure of the upper mantle beneath the EARS and surroundings was obtained by the constrained gravity inversion. Our results, together with the findings of previous research, led to the following conclusions:
(1) The inversion density anomaly structure shows strong density heterogeneity in the upper mantle of the EARS, indicative of present-day tectonic features;
(2) The northeastern to central Congo and Zimbabwe Cratons exhibit pronounced high-density anomalies extending up to 250 km, indicative of a thicker and more intact lithosphere; the Uganda, Tanzania, eastern and southern Congo, and Kaapvaal Cratons exhibit shallow high-density anomalies underlain by low-density anomalies apparently originating from deeper mantle depths, indicative of a thinning of the lithosphere, with some degree of melting at the base. Some degree of melting may have occurred at the base;
(3) The various rift segments of the EARS exhibit different rift morphologies. The Main Ethiopian Rift and the Kenya Rift of the Eastern Rift Branch show strong low-density anomalies indicative of intense melting, much stronger than those of the Western Rift Branch, and the low-density anomalies of the Eastern and Western Rifts in the deep upper mantle indicate that they share the same origin. The lower part of the Malawi Rift shows weaker low-density anomalies, while distinct low-density anomalies can still be seen south of the Malawi Rift, which is inferred to be a possible continuation of the East African Rift in the south;
(4) The Main Ethiopian Rift and the Kenya Rift of the Eastern Rift Branch were mainly affected by active rifting, the Western Rift Branch was affected by both active and passive rifting, and the Malawi Rift was mainly affected by passive rifting.
Data availability statement
The original contributions presented in the study are included in the article/Supplementary Material, further inquiries can be directed to the corresponding author.
Author contributions
WT: Writing–review and editing, Data curation, Validation, Visualization, Writing–original draft. QL: Writing–review and editing, Investigation, Methodology, Software, Supervision. CC: Conceptualization, Funding acquisition, Writing–review and editing, Project administration, Supervision.
Funding
The author(s) declare that financial support was received for the research, authorship, and/or publication of this article. The research is supported by the National Natural Science Foundation of China (grant no. 41774091).
Acknowledgments
We are grateful to the editor and reviewers for their constructive comments, suggestions and recommendations.
Conflict of interest
The authors declare that the research was conducted in the absence of any commercial or financial relationships that could be construed as a potential conflict of interest.
Publisher’s note
All claims expressed in this article are solely those of the authors and do not necessarily represent those of their affiliated organizations, or those of the publisher, the editors and the reviewers. Any product that may be evaluated in this article, or claim that may be made by its manufacturer, is not guaranteed or endorsed by the publisher.
Supplementary material
The Supplementary Material for this article can be found online at: https://www.frontiersin.org/articles/10.3389/feart.2024.1425806/full#supplementary-material
References
Adams, A., Miller, J., and Accardo, N. (2018). Relationships between lithospheric structures and rifting in the East african Rift System: a Rayleigh wave tomography study. Geochem. Geophys. Geosystems 19, 3793–3810. doi:10.1029/2018GC007750
Adams, A., Nyblade, A., and Weeraratne, D. (2012). Upper mantle shear wave velocity structure beneath the East African plateau: evidence for a deep, plateauwide low velocity anomaly: shear wave velocity beneath Africa. Geophys. J. Int. 189, 123–142. doi:10.1111/j.1365-246X.2012.05373.x
Al-Hajri, Y., White, N., and Fishwick, S. (2009). Scales of transient convective support beneath Africa. Geology 37, 883–886. doi:10.1130/G25703A.1
Amante, C., and Eakins, B. W. (2009). ETOPO1 1 arc-minute global relief model: procedures, data sources and analysis. National Geophysical Data Center, NOAA.
Bagley, B., and Nyblade, A. A. (2013). Seismic anisotropy in eastern Africa, mantle flow, and the African superplume. Geophys. Res. Lett. 40, 1500–1505. doi:10.1002/grl.50315
Begg, G. C., Griffin, W. L., Natapov, L. M., O’Reilly, S. Y., Grand, S., O'Neill, C., et al. (2009). The lithospheric architecture of Africa: seismic tomography, mantle petrology, and tectonic evolution. Geosphere 5, 23–50. doi:10.1130/GES00179.1
Braun, J., Guillocheau, F., Robin, C., Baby, G., and Jelsma, H. (2014). Rapid erosion of the Southern African Plateau as it climbs over a mantle superswell. J. Geophys. Res. Solid Earth 119, 6093–6112. doi:10.1002/2014JB010998
Celli, N. L., Lebedev, S., Schaeffer, A. J., Ravenna, M., and Gaina, C. (2020). The upper mantle beneath the South Atlantic Ocean, South America and Africa from waveform tomography with massive data sets. Geophys. J. Int. 221, 178–204. doi:10.1093/gji/ggz574
Corti, G., Bonini, M., Conticelli, S., Innocenti, F., Manetti, P., and Sokoutis, D. (2003). Analogue modelling of continental extension: a review focused on the relations between the patterns of deformation and the presence of magma. Earth-Science Rev. 63, 169–247. doi:10.1016/S0012-8252(03)00035-7
Courtillot, V., Davaille, A., Besse, J., and Stock, J. (2003). Three distinct types of hotspots in the Earth’s mantle. Earth Planet. Sci. Lett. 205, 295–308. doi:10.1016/S0012-821X(02)01048-8
Craig, T. J., Jackson, J. A., Priestley, K., and McKenzie, D. (2011). Earthquake distribution patterns in Africa: their relationship to variations in lithospheric and geological structure, and their rheological implications: earthquake distribution patterns in Africa. Geophys. J. Int. 185, 403–434. doi:10.1111/j.1365-246X.2011.04950.x
Ebinger, C. J. (1989). Tectonic development of the western branch of the East african Rift System. Geol. Soc. Am. Bull. 101 (7), 885–903. doi:10.1130/0016-7606(1989)101<0885:tdotwb>2.3.co;2
Ebinger, C. J., Yemane, T., Kelley, S., Rex, D. C., and Rex, D. (2000). Rift deflection, migration, and propagation: linkage of the Ethiopian and Eastern rifts, Africa. Geol. Soc. Am. Bull. 112, 163–176. doi:10.1130/0016-7606(2000)112<0163:rdmapl>2.3.co;2
Fagereng, Å. (2013). Fault segmentation, deep rift earthquakes and crustal rheology: insights from the 2009 Karonga sequence and seismicity in the Rukwa-Malawi rift zone. Tectonophysics 601, 216–225. doi:10.1016/j.tecto.2013.05.012
Fairhead, J. D., and Girdler, R. W. (1969). How far does the rift system extend through Africa? Nature 221, 1018–1020. doi:10.1038/2211018a0
Fairhead, J. D., and Henderson, N. B. (1977). The seismicity of southern Africa and incipient rifting. Tectonophysics 41, T19–T26. doi:10.1016/0040-1951(77)90133-0
Finger, N.-P., Kaban, M. K., Tesauro, M., Mooney, W. D., and Thomas, M. (2022). A thermo-compositional model of the african cratonic lithosphere. Geochem. Geophys. Geosystems 23, e2021GC010296. doi:10.1029/2021GC010296
Fishwick, S. (2010). Surface wave tomography: imaging of the lithosphere-asthenosphere boundary beneath central and southern Africa? Lithosphere 120, 63–73. doi:10.1016/j.lithos.2010.05.011
Förste, C., Bruinsma, S., Abrikosov, O., Flechtner, F., Marty, J.-C., Lemoine, J.-M., et al. (2014). EIGEN-6C4-The latest combined global gravity field model including GOCE data up to degree and order 1949 of GFZ Potsdam and GRGS Toulouse. Geophys. Res. Abstr. 16.
Foster, A. N., and Jackson, J. A. (1998). Source parameters of large African earthquakes:implications for crustal rheology and regional kinematics: source parameters of large African earthquakes. Geophys. J. Int. 134, 422–448. doi:10.1046/j.1365-246x.1998.00568.x
George, R., Rogers, N., and Kelley, S. (1998). Earliest magmatism in Ethiopia: evidence for two mantle plumes in one flood basalt province. Geology 26, 923–926. doi:10.1130/0091-7613(1998)026<0923:emieef>2.3.co;2
Hansen, S. E., Nyblade, A. A., and Julia, J. (2009). Estimates of crusral and lithospheric thickness in sub-saharan Africa from S-wave receiver functions. South Afr. J. Geol. 112, 229–240. doi:10.2113/gssajg.112.3-4.229
Jackson, J., and Blenkinsop, T. (1993). The Malaŵi earthquake of March 10, 1989: deep faulting within the East african Rift System. Tectonics 12, 1131–1139. doi:10.1029/93TC01064
Keen, C. E. (1985). The dynamics of rifting: deformation of the lithosphere by active and passive driving forces. Geophys. J. R. Astronmical Soc. 80, 95–120. doi:10.1111/j.1365-246x.1985.tb05080.x
Kendall, J.-M., and Lithgow-Bertelloni, C. (2016) “Why is Africa rifting?,” 420. London: Geological Society, 11–30. doi:10.1144/SP420.17
Le Gall, B., Nonnotte, P., Rolet, J., Benoit, M., Guillou, H., Mousseau-Nonnotte, M., et al. (2008). Rift propagation at craton margin. Tectonophysics 448, 1–19. doi:10.1016/j.tecto.2007.11.005
Lesne, O., Calais, E., and Deverchere, J. (1998). Finite element modelling of crustal deformation in the Baikal rift zone: new insights into the active–passive rifting debate. Tectonophysics 289, 327–340. doi:10.1016/s0040-1951(98)00004-3
Levandowski, W., Boyd, O. S., Briggs, R. W., and Gold, R. D. (2015). A random-walk algorithm for modeling lithospheric density and the role of body forces in the evolution of the Midcontinent Rift. Geochem. Geophys. Geosystems 16, 4084–4107. doi:10.1002/2015GC005961
Li, Y., and Oldenburg, D. W. (1998). 3-D inversion of gravity data. Geophysics 63, 109–119. doi:10.1190/1.1444302
Liang, Q., Chen, C., Kaban, M. K., and Thomas, M. (2019). Upper-mantle density structure in the Philippine Sea and adjacent region and its relation to tectonics. Geophys. J. Int. 219, 945–957. doi:10.1093/gji/ggz335
Liang, Q., Chen, C., and Li, Y. (2014). 3-D inversion of gravity data in spherical coordinates with application to the GRAIL data. J. Geophys. Res. Planets 119, 1359–1373. doi:10.1002/2014JE004626
Macgregor, D. (2015). History of the development of the East African Rift System: a series of interpreted maps through time. J. Afr. Earth Sci. 101, 232–252. doi:10.1016/j.jafrearsci.2014.09.016
Mooney, W. D., Barrera-Lopez, C., Suárez, M. G., and Castelblanco, M. A. (2023). Earth crustal model 1 (ECM1): a 1° x 1° global seismic and density model. Earth-Science Rev. 243, 104493. doi:10.1016/j.earscirev.2023.104493
Morgan, P., and Baker, B. H. (1983). Introduction-processes of continental rifting. Tectonophysics 94, 1–10. doi:10.1016/0040-1951(83)90005-7
Mulibo, G. D., and Nyblade, A. A. (2013). The P and S wave velocity structure of the mantle beneath eastern Africa and the African superplume anomaly. Geochem. Geophys. Geosystems 14, 2696–2715. doi:10.1002/ggge.20150
Mulibo, G. D., and Nyblade, A. A. (2016). The seismotectonics of southeastern Tanzania: implications for the propagation of the eastern branch of the East African Rift. Tectonophysics 674, 20–30. doi:10.1016/j.tecto.2016.02.009
Nyblade, A. A., and Robinson, S. W. (1994). The african superswell. Geophys. Res. Lett. 21, 765–768. doi:10.1029/94GL00631
O'Donnell, J. P., Adams, A., Nyblade, A. A., Mulibo, G. D., and Tugume, F. (2013). The uppermost mantle shear wave velocity structure of eastern Africa from Rayleigh wave tomography: constraints on rift evolution. Geophys. J. Int. 194, 961–978. doi:10.1093/gji/ggt135
Park, Y., and Nyblade, A. A. (2006). P-wave tomography reveals a westward dipping low velocity zone beneath the Kenya Rift. Geophys. Res. Lett. 33, 2005GL025605. doi:10.1029/2005GL025605
Purcell, P. G. (2018). Re-Imagining and re-imaging the development of the East African Rift. Pet. Geosci. 24, 21–40. doi:10.1144/petgeo2017-036
Qian, Z., and Yang, W. (2023). The 3-D density structure of the great East-Africa Rift from the asthenosphere to crust. Beijing, China: Tongfang Knowledge Network (Beijing) Technology Co., Ltd. doi:10.16509/j.georeview.2023.09.015
Rajaonarison, T. A., Stamps, D. S., Naliboff, J., Nyblade, A., and Njinju, E. A. (2023). A geodynamic investigation of plume-lithosphere interactions beneath the East African Rift. J. Geophys. Res. Solid Earth 128, e2022JB025800. doi:10.1029/2022JB025800
Rogers, N. W. (2006) Basaltic magmatism and the geodynamics of the East african Rift System, 259. London. Geological Society London Special Publications, 77–93.
Saria, E., Calais, E., Stamps, D. S., Delvaux, D., and Hartnady, C. J. H. (2014). Present-day kinematics of the East African Rift. J. Geophys. Res. Solid Earth 119, 3584–3600. doi:10.1002/2013JB010901
Schutt, D. L., and Lesher, C. E. (2010). Compositional trends among Kaapvaal Craton garnet peridotite xenoliths and their effects on seismic velocity and density. Earth Planet. Sci. Lett. 300 (3–4), 367–373. doi:10.1016/j.epsl.2010.10.018
Stamps, D. S., Saria, E., and Kreemer, C. (2018). A geodetic strain rate model for the East african Rift System. Sci. Rep. 8, 732. doi:10.1038/s41598-017-19097-w
Turcotte, D. L., and Emermen, S. H. (1983). Mechanisms of active and passive rifting. Tectonophysics 19, 39–50. doi:10.1016/B978-0-444-42198-2.50010-9
Weeraratne, D. S., Forsyth, D. W., Fischer, K. M., and Nyblade, A. A. (2003). Evidence for an upper mantle plume beneath the Tanzanian craton from Rayleigh wave tomography. J. Geophys. Res. Solid Earth 108, 2002JB002273. doi:10.1029/2002JB002273
Wölbern, I., Rümpker, G., Link, K., and Sodoudi, F. (2012). Melt infiltration of the lower lithosphere beneath the Tanzania craton and the Albertine rift inferred from S receiver functions. Geochem. Geophys. Geosystems 13, 2012GC004167. doi:10.1029/2012GC004167
Yang, Z., and Chen, W. (2010). Earthquakes along the East african Rift System: a multiscale, system-wide perspective. J. Geophys. Res. Solid Earth 115, 2009JB006779. doi:10.1029/2009JB006779
Zhou, Y., Li, J., and Wang, S. (2000). Physicalexperiments on mantle uprifting and continent extension. J. Geomechanics 6, 22–32. doi:10.3969/j.issn.1006-6616.2000.01.004
Zwaan, F., and Schreurs, G. (2020). Rift segment interaction in orthogonal and rotational extension experiments: implications for the large-scale development of rift systems. J. Struct. Geol. 140, 104119–119. doi:10.1016/j.jsg.2020.104119
Keywords: East African Rift System, gravity inversion, density structures, mantle plume, mantle melting
Citation: Tao W, Liang Q and Chen C (2024) Density structures of the upper mantle in the East African Rift System: implications for the evolution of intracontinental rifting. Front. Earth Sci. 12:1425806. doi: 10.3389/feart.2024.1425806
Received: 30 April 2024; Accepted: 29 July 2024;
Published: 12 August 2024.
Edited by:
Nibir Mandal, Jadavpur University, IndiaReviewed by:
Ameha Atnafu Muluneh, Addis Ababa University, EthiopiaChuang Xu, Guangdong University of Technology, China
Copyright © 2024 Tao, Liang and Chen. This is an open-access article distributed under the terms of the Creative Commons Attribution License (CC BY). The use, distribution or reproduction in other forums is permitted, provided the original author(s) and the copyright owner(s) are credited and that the original publication in this journal is cited, in accordance with accepted academic practice. No use, distribution or reproduction is permitted which does not comply with these terms.
*Correspondence: Qing Liang, cWxpYW5nQGN1Zy5lZHUuY24=