
95% of researchers rate our articles as excellent or good
Learn more about the work of our research integrity team to safeguard the quality of each article we publish.
Find out more
ORIGINAL RESEARCH article
Front. Earth Sci. , 22 July 2024
Sec. Geohazards and Georisks
Volume 12 - 2024 | https://doi.org/10.3389/feart.2024.1423731
This article is part of the Research Topic Physical Properties and Mechanical Theory of Rock Materials with Defects View all 13 articles
The use of support structures with good explosion resistance to support and reinforce underground projects has become a focus of concern for relevant units in order to ensure the safety of underground projects in explosive ground loads. The blast resistance of underground caverns and the influence of support parameters on blast resistance have been studied when lining and pre-stressing anchors are supported individually under dynamic and static coupling. Straight-walled arched caverns are chosen for this study because of their strong blast resistance. The influence of excavation unloading on the support structure was analyzed under the condition of a burial depth of 500 m. The study investigated the blast resistance of caves supported solely by singular concrete lining support and singular pre-stressed anchor bolt support. The research findings indicate that pre-stressed anchor bolts significantly limit the deformation capacity of surrounding rock while lining is more effective in restricting the vibration response of surrounding rock. The pre-stressed anchor bolts ensure operation within the strength range throughout the entire process with no alteration in load-bearing capacity. Increasing the thickness of the lining can reduce the vibration response of the cavern. Meanwhile, enhancing the pre-stressed anchor bolts within a certain range notably restricts the deformation response of the cavern. Therefore, the pre-stressed anchor bolts should be employed as the supporting structure to bear the excavation and unloading loads of the cavern.
There is a constant updating and upgrading of weaponry and equipment in modern warfare across nations as modern science and technology continue to advance. The direct shock waves caused by drilling and guided weapon explosions propagate through the rock and soil medium. The damage to underground engineering structures and surrounding rock masses is inflicted. New challenges are faced by defense and underground protection engineering which demand novel capabilities to resist explosions. In order to ensure the safety of underground engineering in modern warfare, support structures with excellent blast resistance are selected (Li et al., 2023a). The reinforcement and support of underground engineering have become a focal point of concern (Ren et al., 2023). The renewal and replacement of support structures are being driven forward (Li et al., 2023b). The damage caused by the explosion shockwaves on the underground chambers and chamber groups is multifaceted (Zhu et al., 2022). More advanced methods of support, enhanced blast resistance of chambers and a refined protective engineering system are areas of focus. Concrete lining, anchor rods, and anchor cables are the most widely used support methods currently. The blast-resistant support measures for underground chambers are divided into anchoring and composite structural resistance. Anchor rods or anchor cables serve as the primary load-bearing structures in anchoring-type blast-resistant support structures. New composite linings are employed to enhance the blast resistance of support structures in composite structural resistance.
Yang Xuelian et al. (2009) and Jingmao et al. (2012a) conducted model experiments based on Froude similarity theory. The influence of anchor rod length on the blast resistance of the chamber was studied. The stress of the chamber surrounding rock was increased, by increasing the length of the anchor rod. The rock mass properties are enhanced, and rock deformation is restricted. However, the reinforcement effect of the anchor rod decreases as it increases to a certain length. This exacerbates the movement of the chamber. The support effect is optimal when the length is one-third of the span of the chamber. Ganchen et al. (2014) proposed a method of rock mass external cross anchoring. Experimental models were created for blast testing. The peak displacement and residual deformation values of the chamber decrease after cross anchoring. Cross anchoring method effectively limits the deformation of the chamber. Jingmao et al. (2012b) conducted model experiments. The reinforcement effects of locally lengthened anchor rods and equally lengthened anchor rods at the arch foot were compared. The localized extension of the anchor rod at the arch foot increases the explosive load on the arch at smaller explosion distances. However, lengthening the anchor rods was able to bear or transfer the explosive load on the arch part when the distance to the explosion center was small. The blast resistance was enhanced by reinforcing the arch. Yang et al. (2015) conducted research on the blast model experiments of chamber roofs. The potential for using the deformation parameters of the cavern as indicators of dome stability was explored following an analysis of dome deformation and acceleration response patterns. The effectiveness of acceleration in determining stability was found to be inadequate. The reinforcement effect of longer closely spaced anchor rods is better when the spacing between the anchor rods is the same. However, the effectiveness of anchoring decreases with excessive length. Honglu and Zhang (2013) utilized the AUTODYN software to establish a three-dimensional coupled system model in the study of lining structure support. The dynamic response and damage mechanism of the lining structure were investigated under explosion conditions within the tunnel. The damage primarily occurred at the connections of the floor slab, side walls and arch ribs. The lining structure has high reinforcement rate, high strength of surrounding rock and good anti-explosion performance. Liu et al. (2024) utilized finite element software ANSYS/LS-DYNA. The damage characteristics of tunnel lining structures are analyzed under explosive loads based on the principle of energy. The dynamic response of each part is reflected by the explosive energy of the lining structure. The manner and extent of damage to the lining structure vary at different explosion source positions. Chen et al. (2019) employed the LS-DYNA finite element software. The dynamic responses of conventional lining structures and foam concrete composite structures were compared and analyzed under near-blast conditions. The results indicated that when the shock wave propagated from hard to soft media. The incident wave and reflected wave reversed direction. The load on the lining structure weakened. The foam concrete interlayer has an efficient wave-absorbing and energy-dissipating effect when incident waves and reflected waves propagate in the same direction in soft-hard media. Wang et al. (2015) utilized the ANSYS/LS-DYNA software. Models were created for both single-layer lining structures and foam concrete composite lining structures. The dynamic responses were compared under explosive loads. The characteristic deformations were revealed by the results. The single-layer lining structure exhibited vertical compression and lateral expansion. The best blast resistance is achieved when the thickness ratio of the outer to inner layers in the composite lining structure is between 1/2 and 1/3. Liu et al. (2018) established a three-dimensional finite element model. The blast resistance performance of ultra-high-performance steel fiber reinforced concrete tunnel lining was analyzed. Various parameters were taken into account for their influence, such as burial depth, explosion direction and steel fiber content. The excellent blast resistance of high-strength concrete lining has been demonstrated by the results. The location of the blast source and the burial depth have a noticeable impact on exacerbating the damage to the lining. The best performance in blast resistance for the lining is achieved when the optimal steel fiber content is 2.5%.
The effectiveness of anchoring systems in blast resistance support is crucial as evidenced by current research findings in blast-resistant support structures (Yongming et al., 2008; Zhang et al., 2014; Yuchen et al., 2021; Sun et al., 2022). Anchoring systems constitute a significant proportion of blast-resistant support designs whereas the proportion of single lining support is relatively small. The analysis has been solely focused on the support effects to elucidate the distinctive characteristics of the two support measures. Prestressed anchor reinforcement of tunnel rock masses belongs to the category of “active support” measures in comparison to lining support. Prestressed anchors offer a wide range of selectable lengths and high load-bearing capacity (Yang et al., 2009; Zhou and Zhu, 2010; Feng et al., 2011; Jiang et al., 2019; Tan et al., 2021). The deformation of the tunnel rock mass is constrained by the prestressed anchor rods which are directly embedded into the surrounding rock mass. Most studies are based on the joint support of anchoring and lining, focusing on the blast resistance of anchored chambers. The existing research analysis is limited when it comes to determining whether the mechanisms of action for anchoring and lining support may share similar characteristics or exhibit differences (Liu et al., 2024; Zhang et al., 2023).
The impact of underground chamber’s resistance to explosions and the influence of support parameters on its resistance have been studied under the dynamic-static coupling conditions of lining and prestressed anchor support (Yang and Fan, 2007; Sun et al., 2010). A well-performing chamber with a straight wall and arched roof shape was selected as the subject for support research. The influence of excavation unloading on the support structures has been examined. The resilience to explosions of underground chambers has been investigated under the support of singular concrete lining and solitary prestressed anchor reinforcement.
Pre-stressed anchors and linings are being separately studied under the impact of explosive ground loads to investigate the supporting effectiveness and characteristics of two types of support structures. The dynamic loads remain consistent without considering the static load effects of excavation unloading in the cavern. The feasibility of a single support when considering dynamic-static coupling effects is not being considered. A reasonable support concept is proposed based on the research findings. The surrounding rock conditions are classified as Class III, with a scaled distance of 9.28 m/t1/3 and a peak explosive ground load of 6.5 MPa. The lateral pressure coefficient is set at 1.2, with a depth of 500 m. The duration of the ground load uplift is 0.02 s, and the depression duration is 0.04 s.
The mechanical response of the lining can only be described during the elastic stage when the lining is treated as an elastic material, under the action of explosion-induced ground shock loads in caverns supported by lining. The initiation and propagation of cracks in concrete cannot be described by elastic constitutive models, resulting in nonlinear mechanical behavior and stiffness degradation. The Concrete Damaged Plasticity Model (CDP model) is a professional model used to simulate the mechanical behavior of concrete in terms of elastoplastic damage (Neuberger et al., 2023). This model is available in the Abaqus software. Tensile cracking and compressive crushing are assumed to be the two primary mechanisms of failure, in concrete materials in the CDP model (Mohammed et al., 2023). The stiffness degradation of concrete is accounted for during the plastic deformation stage. This model can be employed for numerical simulations of concrete subjected to single, cyclic and dynamic loads, under low confinement conditions. The actual mechanical behavior of the lining is analyzed, from a damage perspective in the CDP model. The destructive nature and extent of the lining are reflected, under the action of ground loads.
The stress follows a linear elastic relationship in uniaxial tension until it reaches the ultimate strength, as illustrated in Figure 1A. Microcracks are initiated within the concrete, when the stress reaches the ultimate strength (Ferrotto et al., 2018). The macroscopic stress-strain softening response of the concrete structure is induced when the stress exceeds the ultimate strength, leading to the expansion of microcracks. This results in unloading in the non-elastic stage and subsequent degradation of concrete stiffness. The uniaxial compression process of concrete follows a similar principle.
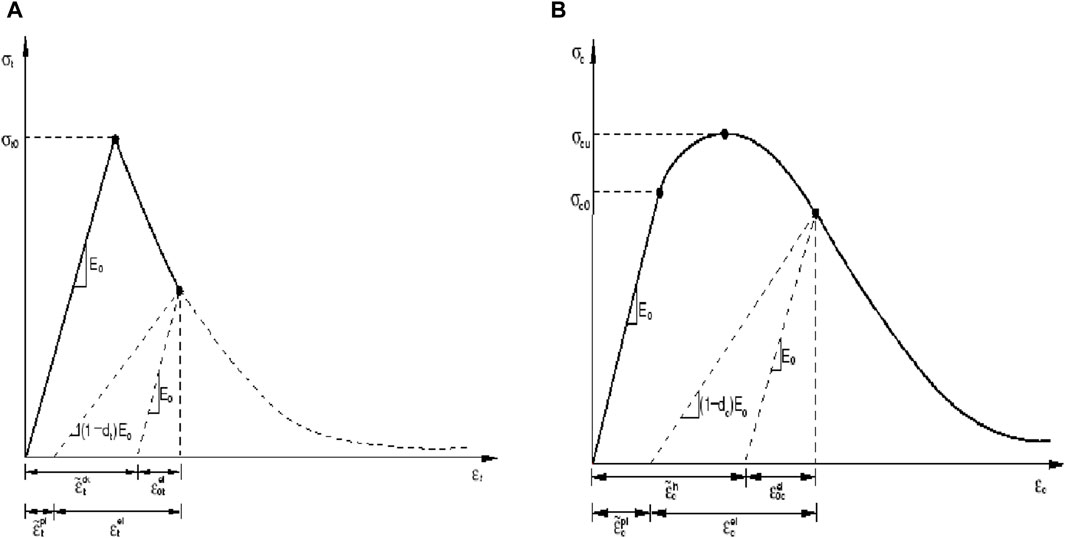
Figure 1. Uniaxial tension-compression relationship of CDP model. (A) Uniaxial tensile constitutive relationship. (B) Uniaxial compressive constitutive relationship.
Damage factors and initial stiffness are employed to describe the degradation of concrete stiffness in the non-elastic stage in the CDP model (Hafezolghorani et al., 2017). The stiffness of concrete is represented as:
Under uniaxial cyclic loading conditions, the damage factor is assumed to be:
Where dt and dc is the damage factors under uniaxial tension and uniaxial compression, respectively. A value of 0 indicates undamaged concrete, while a value of one signifies complete damage. Where st and sc is the stress state function.
The damage factor is determined based on Li et al. (2017) energy equivalence principle. The calculation method is as follows:
Where σ is the actual stress of the concrete, ε is the actual strain of the concrete.
According to the “Code for Design of Concrete Structures” (GB50010-2011), the equation for the stress-strain curve of concrete under uniaxial tension is formulated as:
Where dt0 is the evolution parameter of concrete uniaxial tensile damage. ft is the concrete uniaxial tensile strength, as provided by the code. εtu is the ultimate tensile strain of concrete. αt is the parameter value of the plastic stage of the stress-strain curve.
The equation for the stress-strain curve of concrete under uniaxial compression is calculated as follows:
Where dc0 is the evolution parameter of concrete uniaxial compressive damage. fc is the concrete uniaxial compressive strength. εcu is the ultimate compressive strain of concrete. The parameter αa and αd respectively represent the values of the ascending and descending segments of the concrete uniaxial stress-strain curve.
Once the stress-strain curve relationship is obtained, the data of stress-nonlinear strain and damage factor-nonlinear strain input into the ABAQUS software need to be determined. The nonlinear strain is calculated from Eq. 13:
Where εe is the elastic strain calculated according to the initial stiffness of the concrete. εin is the nonlinear strain input into the ABAQUS software.
The mechanical parameters of the concrete lining for numerical simulation are provided in Table 1. Based on Eqs. 1–13 and the parameters given in Table 1, the data required by ABAQUS software can be calculated. As shown in Table 2.
Truss elements are utilized to model the elements of steel cable structures, in the ABAQUS software simulating anchor cables are convenient. These elements are solely capable of bearing axial loads and do not possess the capacity to withstand shear forces or bending moments. The coupling between the anchor and the rock mass is established through the Embedded command, embedding the anchor within the rock mass. The prestressing of the anchor is implemented using the temperature reduction method with the temperature to be set determined by Eq. 14.
Where ΔT is the prescribed temperature change. N is the designed axial force of the anchor. A is the cross-sectional area of the anchor. α is the linear expansion coefficient of the anchor. E is the elastic modulus of the anchor.
The parameters associated with pre-stressed anchors are depicted in Table 3. The arrangement of the anchors is illustrated in Figure 2. The spacing between the anchor cables is 3.4 m. Five anchors are positioned at the crown, two at the sidewalls and three at the base of the wall. The anchors on the left half of the tunnel are numbered one to 7.
The displacement cloud map of the surrounding rock of the tunnel chamber is depicted in Figure 3 under the conditions of no support and 40 cm lining support at the final stage. The maximum horizontal displacement of the sidewall in the middle of the underground chamber is 0.0312 m under the unsupported condition. The maximum displacement decreases to 0.0310 m. This indicating a reduction of 0.6% under the support condition. The maximum vertical displacement of the tunnel chamber occurs at the mid-section is −0.0289 m under the unsupported condition. The maximum displacement decreases to −0.0270 m under supported conditions. The reduction reached 6.57%. The displacement peak decreases from −0.0330 m to −0.0308 m under the condition of lining support. The reduction reached 6.67%, as shown in Figure 4.
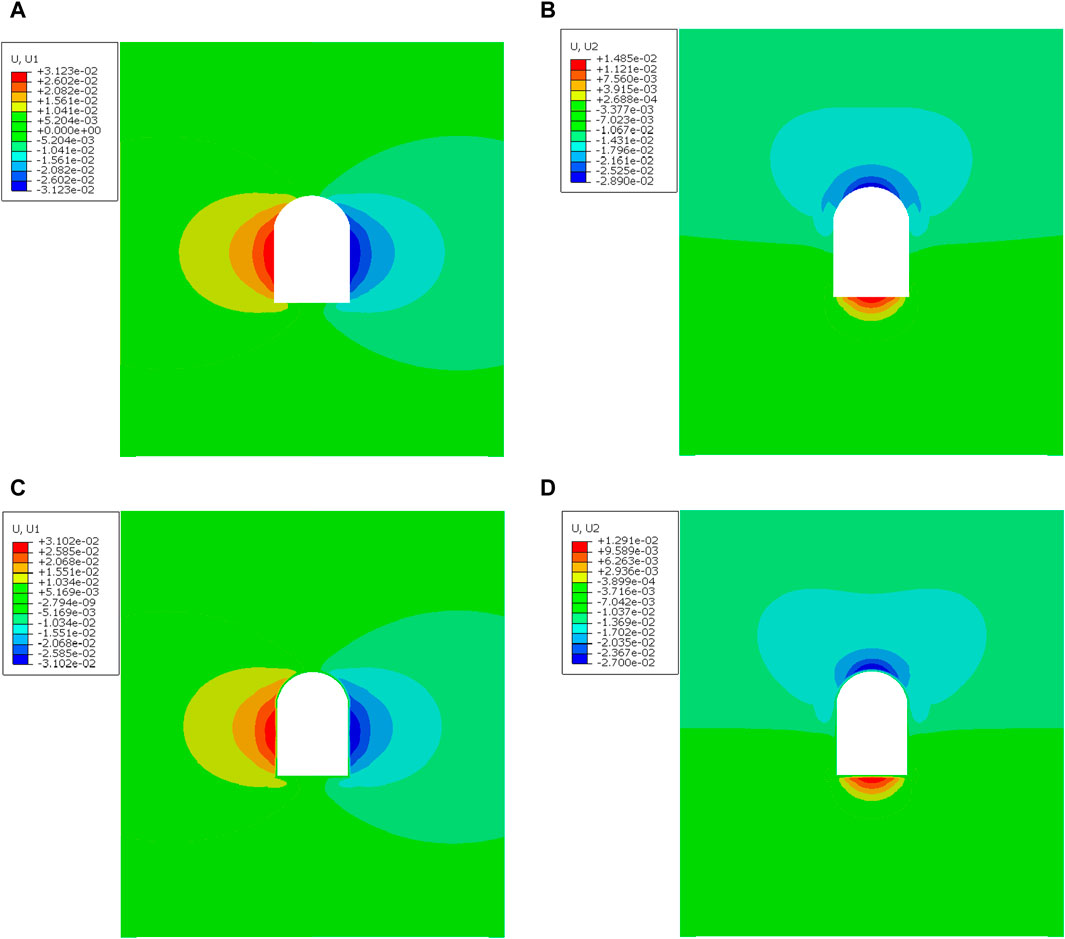
Figure 3. Equivalent plastic deformation of cavern with and without lining. (A) Horizontal displacement of unsupported cavern rock. (B) Vertical displacement of unsupported cavern rock. (C) Horizontal displacement of supported cavern rock. (D) Vertical displacement of supported cavern rock.
A portion of the energy is absorbed by the lining material, causing attenuation of the surrounding rock’s vibration response as the blast stress wave penetrates into the concrete lining (Honglu and Zhang, 2013; Xiao et al., 2014; Ji et al., 2021; Chen et al., 2022; Zhu et al., 2023). A reduction in peak vibration velocity at the crown joints is observed under the effect of lining support as depicted in Figure 5. The velocity decreases from −0.6479 m/s under unsupported conditions to −0.5416 m/s under supported conditions. The energy-absorbing effect of the lining support is evidenced by the reduction in peak vibration velocity at the crown joints.
The evolution of tensile and compressive damage in the lining over time is depicted in Figure 6. The process of compressive damage evolution in the lining is illustrated in Figure 6A. Compressive damage appears on the outer side of the middle section of the lining, increasing with time (at t = 0.072 s). The extent of compressive damage expanded inward from the outer side of the tunnel wall. (at t = 0.3 s). The maximum compressive damage in the middle section of the sidewall reaches 0.012. There is no significant change in the range of compressive damage at the corner of the wall. The extent of compressive damage at the wall corner increased slightly from 0.042 to 0.047. The evolution of tensile damage in the lining is depicted in Figure 6B. Tensile damage appears on the inner side of the lining arch at t = 0.094 s. The range of tensile damage in the lining expands at t = 0.3 s. It gradually spreads from the inner side of the arch towards the outer side and both ends. Its maximum is reached at the arch crown. (with a value of 0.741). The tensile damage reaches its peak (with a value of 0.741) as it spreads from the inner side of the arch towards the outer side and both ends. This signifies severe damage. The tensile damage gradually spreads from the base of the wall towards the middle of the wall. Its maximum is reached (0.781) at a distance of 0.833 m from the outer edge of the wall. It is evident that the tensile damage caused by the explosion’s stress waves on the lining is more severe than the compressive damage based on experimental data (Ren and Chunxia, 2016; Zhang et al., 2016; Chen et al., 2020).
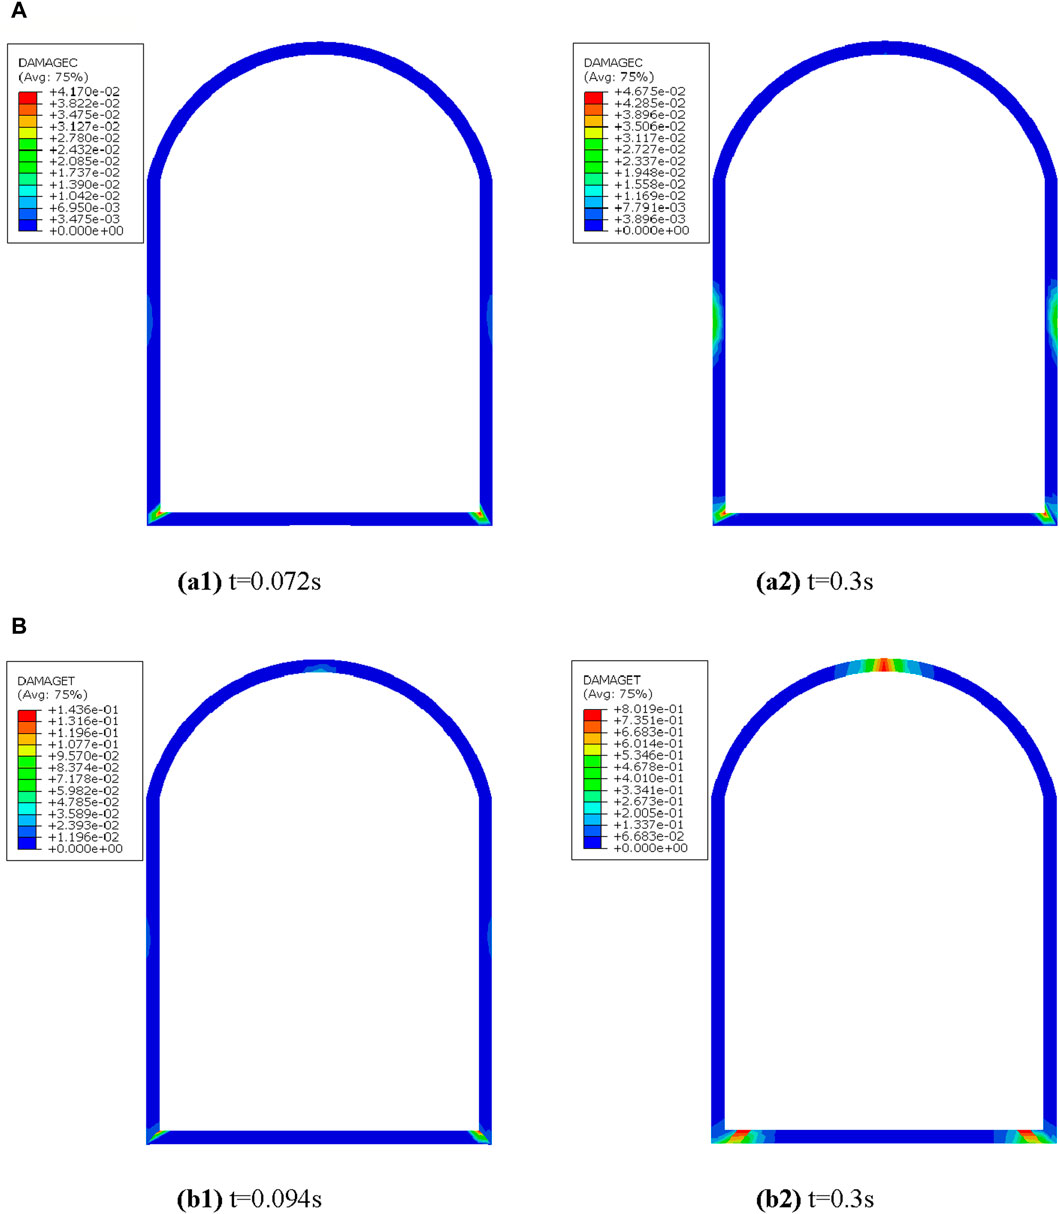
Figure 6. Damage distribution of lining under tension and compression. (a1) t=0.072s. (a2) t = 0.3 s. (A) Lining pressure damage contour map. (b1) t = 0.094 s. (b2) t = 0.3 s. (B) Lining tension damage contour map.
The objective of lining support is to restrain the deformation of the surrounding rock mass and reduce the vibration response of the rock mass (Wang et al., 2010; Zhida et al., 2010; Zhou et al., 2021). The impact of lining support on the effectiveness of support is discussed with four lining thicknesses of 40 cm, 60 cm, 80 cm, and 100 cm being selected. Different thicknesses of lining are compared and analyzed for their impact on the effectiveness of support. The peak displacement and the displacement during the stable deformation stage of the arch crown node in the vertical direction are gradually decreasing with the increase in lining thickness. This trend is illustrated in Figure 7. The peak vertical displacement of the crown node reaches its minimum value of −0.0299 m when the lining thickness reaches 100 cm. This represents a decrease of 9.40% compared to the displacement under unsupported conditions. Additionally, the vertical displacement of the crown node decreases by 10.03% during the stable stage.
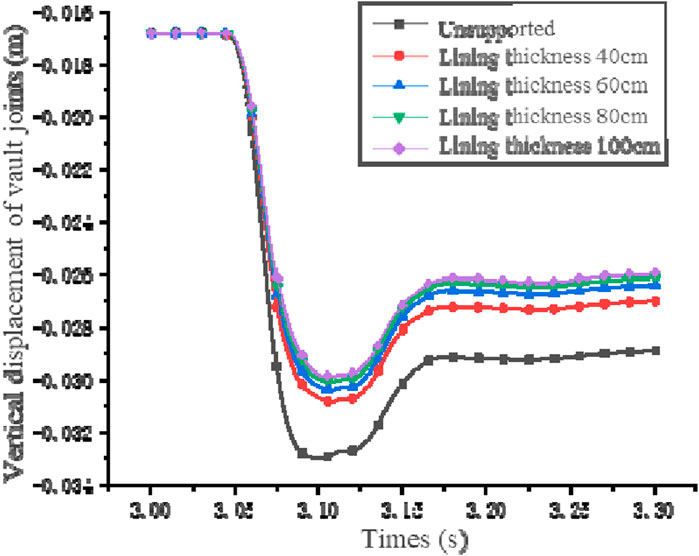
Figure 7. Time history curve of vertical displacement of vault joint under different thickness lining.
The peak vertical velocity of the crown joint in the chamber is reduced with the increase in lining thickness as depicted in Figure 8. The vertical peak velocity of the crown joint in the chamber decreases when the lining thickness reaches 100 cm. The peak vertical velocity of the crown joint in the chamber decreases from −0.6479 m/s under unsupported conditions to −0.4889 m/s. The chamber’s kinetic energy also decreases with the increase in the thickness of the lining as the vertical vibration velocity of the chamber’s vault joint decreases. The lining absorbs an increasing amount of stress wave energy. The kinetic energy of the tunnel decreases.
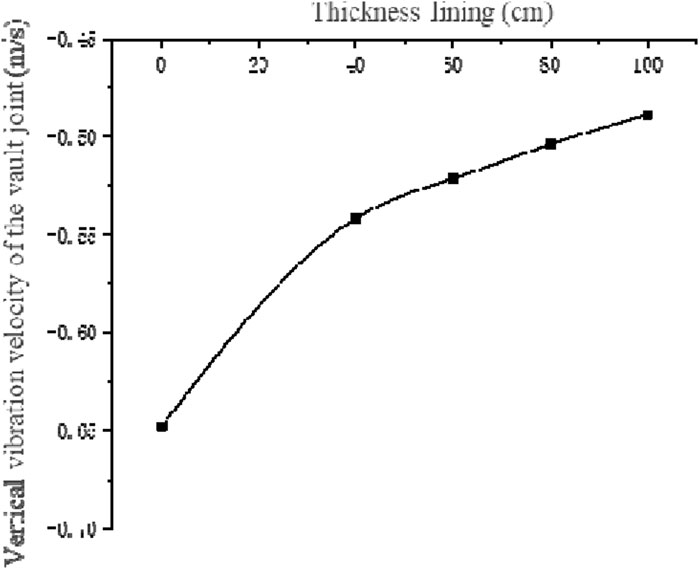
Figure 8. Time history curve of vertical vibration velocity of vault joint under different thickness lining.
The tensile and compressive damage of the lining decreases with increasing lining thickness as depicted in Figure 9. The maximum tensile and compressive damages are observed (with maximum values of 0.5651 and 0.0324, respectively) when the lining thickness reaches 100 cm. The distribution of tensile damage in the lining shifts from the inner side of the bottom of the sidewall towards the outer side. The range decreases with the increase in lining thickness. The tensile damage in the arch section is primarily concentrated at the crown with the maximum damage still observed on the inner side. The extent and severity of tensile and compressive damage in the lining both decrease as the thickness of the lining increases. This indicated by the pattern of damage distribution. The bearing capacity of the lining increases. But the tensile damage caused by stress wave reflection cannot be avoided by simply increasing the thickness of the lining.
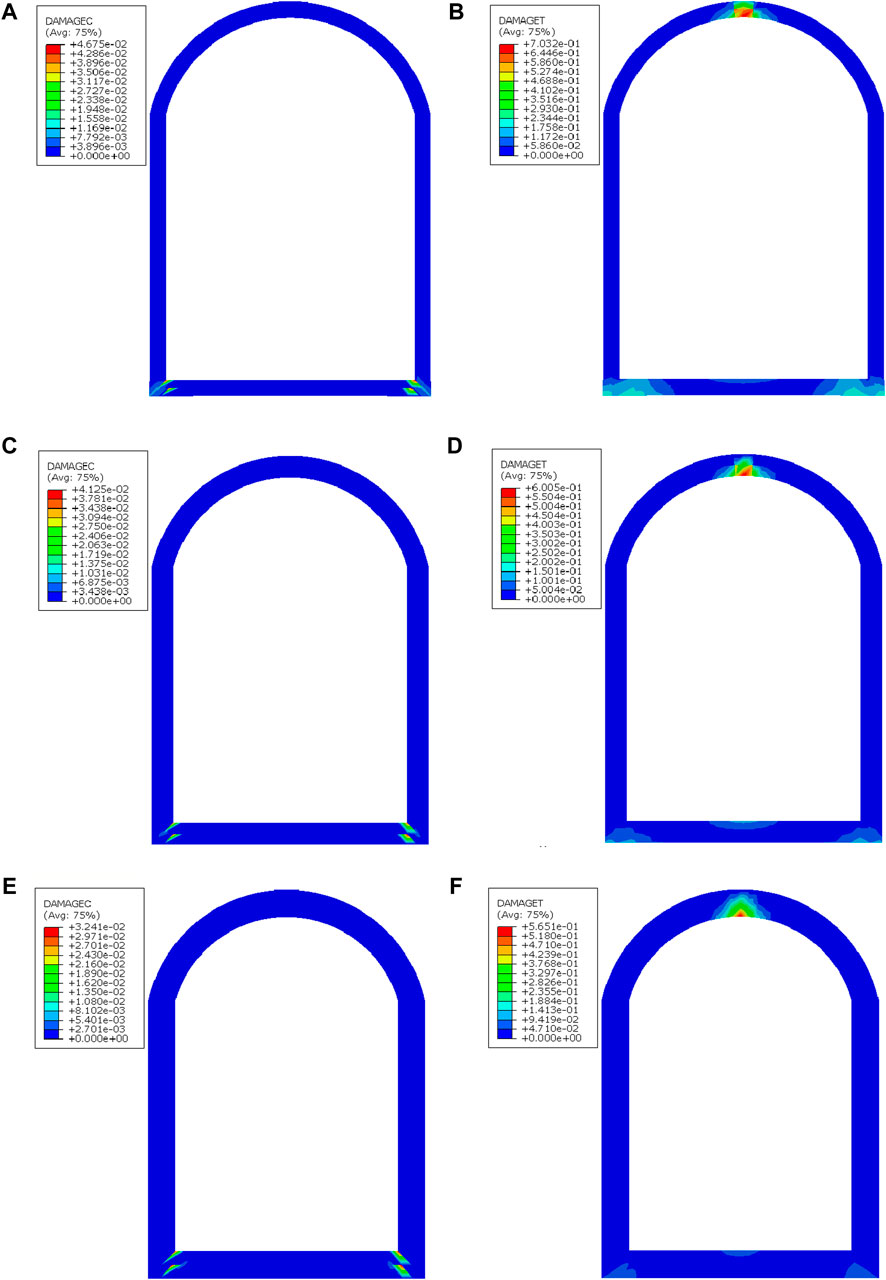
Figure 9. Tension-compression damage cloud picture of lining with different thickness. (A) Compression damage of lining with 60cm thickness. (B) Tension damage of lining with 60 thickness. (C) Compression damage of lining with 80cm thickness. (D) Tension damage of lining with 80 thickness. (E) Compression damage of lining with 100cm thickness. (F) Tension damage of lining with 100 thickness.
The pre-stress of the anchor is set to 1000 kN under the same loading conditions, including explosion-induced ground impact loads and initial stress fields. The deformation analysis of the cavern under the support of the anchor is studied. The displacement of the surrounding rock in the chamber is significantly reduced under the support of pre-stressed anchors, as observed when comparing Figures 3–Figures 10. The maximum horizontal displacement at the middle of the side wall decreased to 0.0274 m, representing a reduction of 12.18%. Similarly, the maximum vertical displacement decreased to −0.0262 m, indicating a reduction of 9.34%. The effectiveness of the supporting structure can be fully realized when considering the unloading effect of tunnel excavation.
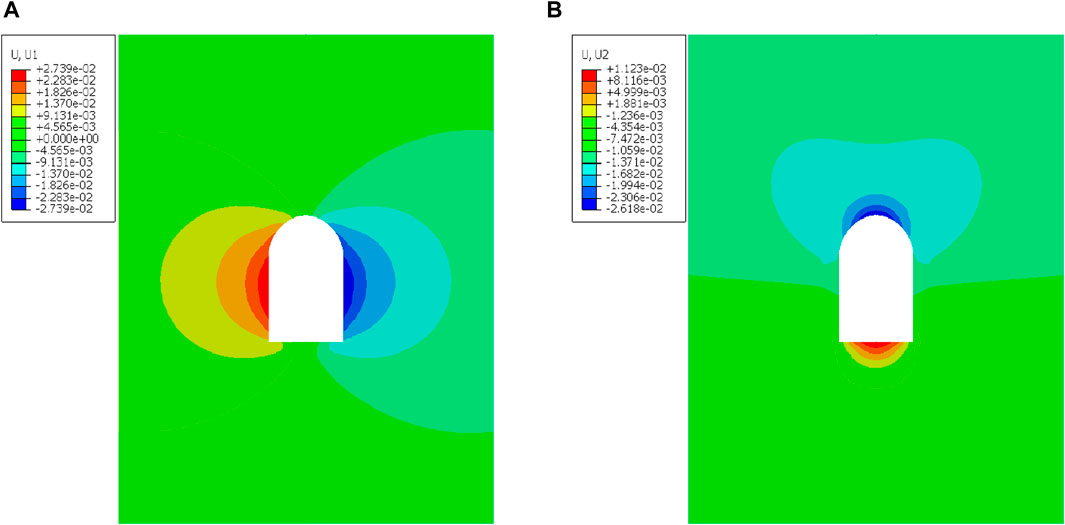
Figure 10. Displacement cloud map of cavern under the action of prestressed anchor cable support. (A) Horizontal displacement. (B) Vertical displacement.
The overall variation of displacements at the crown joint of the cavern is observed to decrease, under the anchoring effect of pre-stressed 1000 kN anchors in Figure 11. A slight decrease in displacement is observed at the dome nodes of the tunnel, due to the proactive tensioning effect of the pre-stressed anchors. A slight decrease (from −0.0168 m to −0.0165 m) is observed, occurring at the dome nodes of the tunnel approximately between three and 3.05 s. The reduction reached 1.81%. The peak vertical displacement at the dome node decreases to −0.0304, with a reduction of 7.88%.
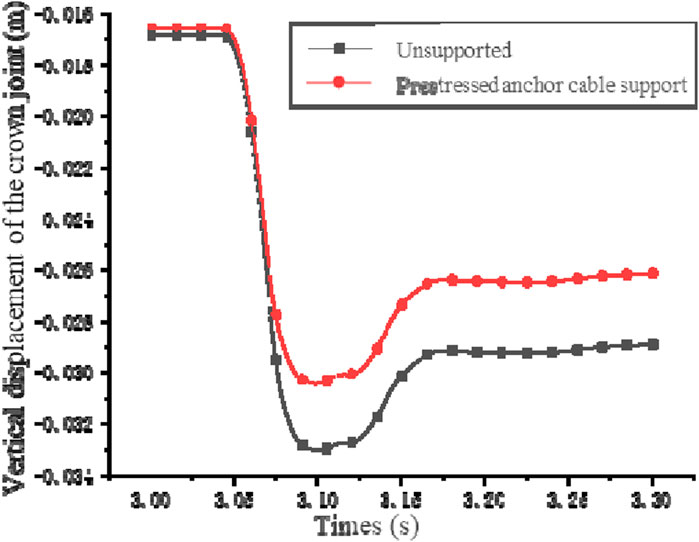
Figure 11. Vertical displacement time-history curve of cavern vault joint under the action of prestressed anchor cable support.
The energy of the stress wave is absorbed by the lining support, resulting in a reduction in the cavern‘s kinetic energy. The vibration response of the cavern is weakened, with the anchor support structure. The vertical vibration velocity of the cavern dome joint decreases to −0.5752 m/s, under the condition of 1000 kN pre-stressed anchor support. The reduction was achieved by 11.23%, as depicted in Figure 12. The capacity to slow down the velocity of chamber vibrations is weaker, compared to the 40 cm lining support.
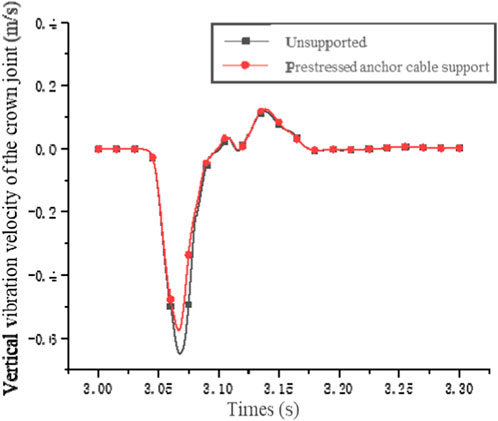
Figure 12. Vertical vibration time-history curve of cavern vault joint under the action of prestressed anchor cable support.
The blast resistance of the chamber under pre-stressed anchor cable support has been enhanced, under the action of stress waves. Attention is given to whether the anchor cables are operating within their strength range. The anchor cables are symmetrically distributed and subjected to symmetrical forces, as depicted in Figure 13. The time history curve of the axial force of the pre-stressed anchor cable on one side of the chamber is taken as an example. The peak axial force of the fourth anchor cable is the largest among all peak axial forces of the pre-stressed anchor cables (with a value of 1,132.03 kN), representing a relative increase of 14.04% compared to the initial pre-stress. It does not exceed the ultimate load-bearing capacity (with a value of 1867.02 kN), located near the middle of the chamber’s side wall. The peak axial force of the seventh anchor cable is the smallest (with a value of 999.00 kN), located at the middle of the bottom wall. The increase is 0.69%. The peak axial force of the third anchor cable is the largest (with a value of 1867.02 kN), positioned at the arch section. The increase is 4.48%. The initial pre-tension applied to the anchor cables is roughly the same across different locations. The dynamic response of the sidewall is greater than that of the arch position when there are different increases in peak axial force, under the effect of stress waves. These observations are made under the condition where the impact of excavation loads on the chamber is not taken into account.
The axial force of the pre-stressed anchors is designed to be 1000 kN, 2000 kN, 3000 kN, and 4000 kN, based on the anchor parameters. The deformation and dynamic response of the cavern are reflected, through the curves of vertical displacement and vertical vibration velocity at the crown joints. The increase in axial force of the pre-stressed anchor did not alter the pattern of displacement at the crown joints, as depicted in Figure 14. The peak displacement at the crown joints decreases as the axial force increases. When the axial force reached 4000 kN, the displacement peak was minimized (value is −0.0291 m). The decrease compared to the unsupported condition reached 11.85%.
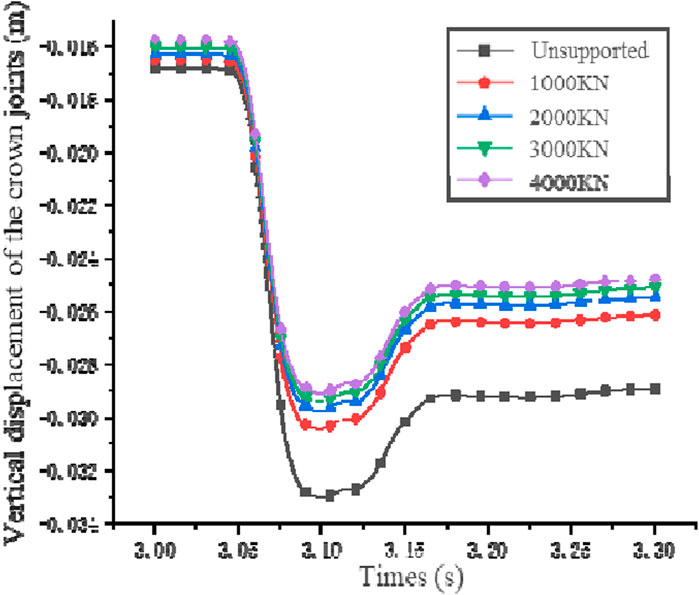
Figure 14. Vertical displacement of vault joints under the condition of prestressed anchor cable support with different axial forces.
The peak vibration velocity at the crown joints decreases with the increase in axial force of the pre-stressed anchor bolt, as depicted in Figure 15. The peak vibration velocity at the crown joints is minimized to −0.5639 m/s, when the axial force of the anchor bolt reaches 4000 kN. The decrease in peak vibration velocity compared to the unsupported condition reached 12.96%. The reduction magnitude of the peak vertical vibration velocity at the crown joints decreases as the axial force of the anchor bolt increases, as observed from the trend of the curve. The capacity of pre-stressed anchor bolts to alleviate the chamber’s vibrational response is limited. Increasing the pre-stressed force of the anchor bolts is more effective than reducing the vibrational response of the chamber.
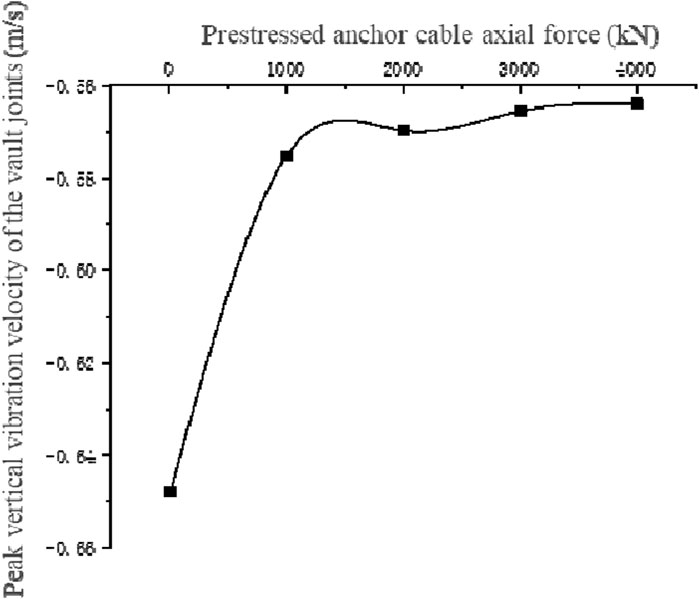
Figure 15. Vertical vibration velocity of vault joints under the condition of prestressed anchor cable support with different axial forces.
The dynamic response of the cavern has been investigated, under the support of both lining and prestressed anchor cables. The blast resistance of the cavern is enhanced by these two types of support structures. The similarities and differences between lining support and pre-stressed anchor support need to be studied, in terms of their supportive effects. The similarities and differences between the two types of support are analyzed. This is done from the perspective of residual deformation and changes in vertical vibration velocity of the vault joints. The difference in the effectiveness of increasing the pre-stress of the anchor cables and the thickness of the lining in restricting the deformation of the chamber walls is minimal, as illustrated in Figure 16. The residual deformation of the tunnel vault joints is smaller than that of the concrete lining support with different thicknesses, under various conditions of pre-tensioned anchor cable support. The minimum residual deformation of the cavern surrounding rock (value is 0.0090 m) is observed, under the 4000 kN pre-tensioned anchor cable support.
The differences in vibration response of the tunnel are evident, when comparing Figures 8,15. The vertical peak velocity at the crown joints decreases to −0.4889 m/s, when the thickness of the lining reaches its maximum of 100 cm. The vertical peak vibration velocity of the crown node decreases to −0.5639 m/s, when the pre-stressed anchor reaches its maximum value of 4000 kN. The difference between the two different support structures is significant, when reducing the vibration response of the cavern. The performance of lining support is better than that of prestressed anchor support. The effectiveness of masonry support is better than that of pre-stressed anchor support. Increasing the thickness of the lining is more effective than increasing the pre-stress of the anchor, in reducing the vibration response of the surrounding rock mass of the tunnel. Increasing the thickness of the lining is the most effective approach, in design for attenuating the vibration response of the surrounding rock mass of the tunnel.
The effect of tunnel excavation unloading on the effectiveness of the two support structures under single support conditions was not considered, and an analysis was conducted on this matter (Wenbo et al., 2008; Peng et al., 2009; Bai et al., 2014). The supportive characteristics of the two structures are reflected under dynamic conditions. The impact on the supportive structure needs to be considered, during the actual excavation of the cavern in engineering practice. The effectiveness of a single support structure within its strength range during tunnel excavation unloading needs to be investigated, under conditions of high ground stress. The method of softening modulus is adopted, in the numerical simulation method using ABAQUS software. The elastic modulus of the surrounding rock is reduced to 5 GPa. The softening of the elastic modulus is achieved through variable setting. The operation of the ABAQUS software is modified to activate the masonry or anchor elements, following the softening of the rock modulus and before the excavation step. The effect of excavation unloading on the support structure is taken into account, during the excavation of the cavern.
The ability of the two support structures to withstand the excavation unloading of the cavern is compared, during the analysis process. The anti-explosion effect of the support structure is studied to provide design guidelines, under dynamic-static coupling. The excavation unloading of the cavern is considered under the condition of single masonry support, as depicted in Figure 17. A large area of compressive damage (occupying 83.33% of the arch area) has already been observed on the cavern roof, with values ranging from 0.015 to 0.338, apart from the maximum compressive damage at the wall corners caused by stress concentration effects. The range of tensile damage values is relatively smaller compared to compressive damage (0.018–0.215). The distribution area is narrow, primarily concentrated within approximately 2.5 m on either side of the middle section of the wall base. The maximum tensile damage (0.215) is observed at both ends of this range. The excavation load of the 40 cm cavern cannot be borne by the C60 concrete lining. Further dynamic actions will only exacerbate the cracking of the lining, rendering single lining support impractical in deeply buried caverns.
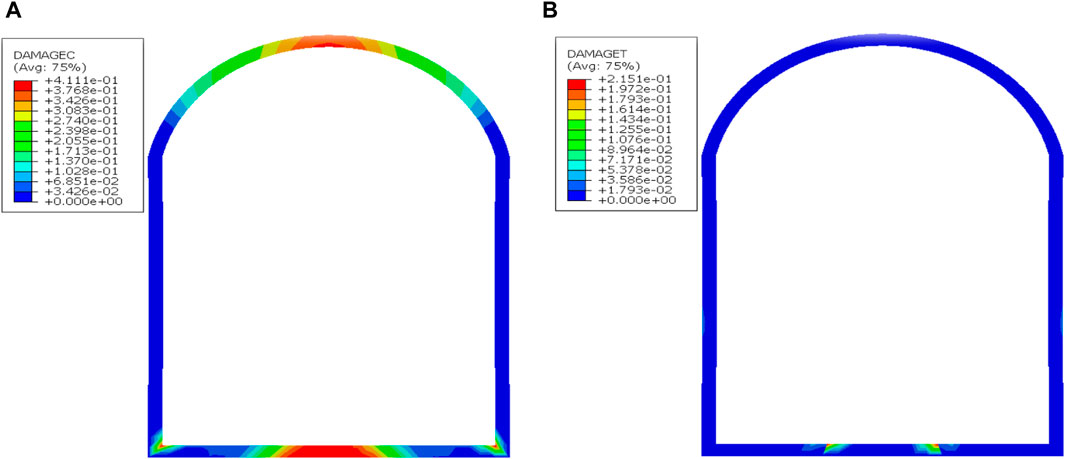
Figure 17. Tension and compression damage distribution of lining after cavern excavation. (A) Compression damage cloud map. (B) Tension damage cloud map.
The anchor support is employed with a pre-stress of 1000 kN. The excavation load of the cavern is borne during the trial calculation process. The time-history curve depicting the axial force variation over the entire length of the anchor is illustrated in Figure 18. The distribution of stress magnitude in the anchor has changed compared to Figure 13. The 7# anchor at the bottom of the wall is affected, by the excavation load of the surrounding rock of the cavern. The initial axial force is the largest, and the peak axial force is also the largest (with a magnitude of 1,668.18 kN). All anchors are operating within the strength range, as showed in Table 3. The increase in axial force is not at its maximum, under dynamic conditions. The largest increase is observed in the fourth anchor, with a relative rise of 192.30 kN compared to the initial axial force, representing an enhancement of 11.94%.
The impact of excavation unloading on the support structure is taken into account, under conditions of deep excavation within the cavern. Extensive compression fractures have emerged within the masonry, leading to a decrease in load-bearing capacity. The degree of damage to the masonry is exacerbated by subsequent dynamic loading. The dynamic-static coupling effect cannot be borne by a single masonry support. The increase in axial force of the anchor is substantial during the excavation unloading phase. The coupled effect of unloading and dynamic loads of the cave excavation can be taken up, when the strength is effective. The true stress state of the support structure is reflected, when considering the unloading effect during cavern excavation. It is advantageous for proposing a reasonable support design concept.
The effectiveness of pre-stressed anchor support has been enhanced, as depicted in Figure 19 Considering the excavation and unloading of the chamber. The maximum horizontal displacement of the surrounding rock of the cavern is reduced to 0.0259 m. The maximum horizontal displacement of the chamber’s surrounding rock is reduced by 5.43%, compared to the condition without considering excavation and unloading of the chamber. The maximum vertical displacement decreases to −0.0242 m, indicating a reduction of 7.56%.
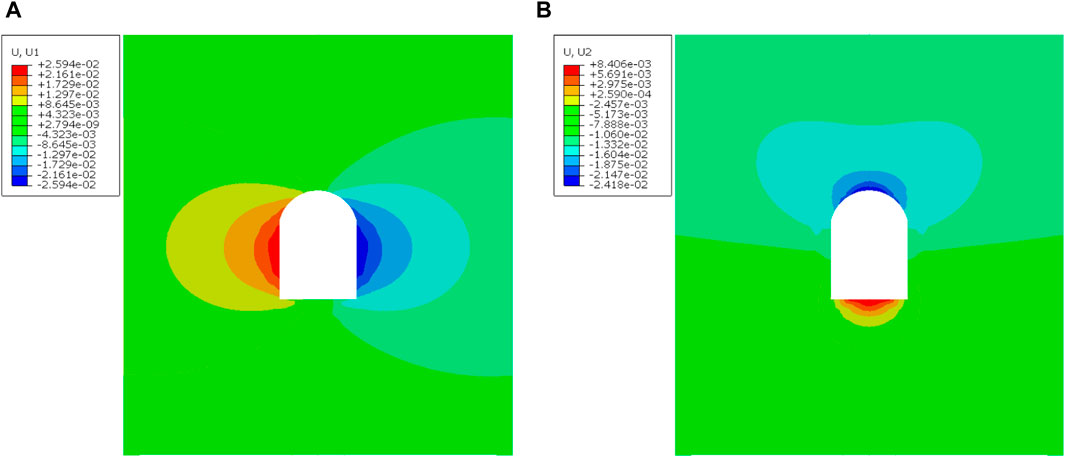
Figure 19. Cloud map of surrounding rock displacement of cavern considering unloading condition of cavern excavation. (A) Horizontal displacement of cavern. (B) Vertical displacement of cavern.
The displacement at the apex of the arch significantly decreases when the effect of excavation and unloading of the chamber is taken into account in Figure 20, as compared to Figure 12. The initial displacement of the crown node decreases from −0.0165 m to −0.0116 m, representing a reduction of 29.70%. The peak displacement decreases from −0.0304 m to −0.02679 m, without considering excavation and unloading. The reduction reached 11.88%.
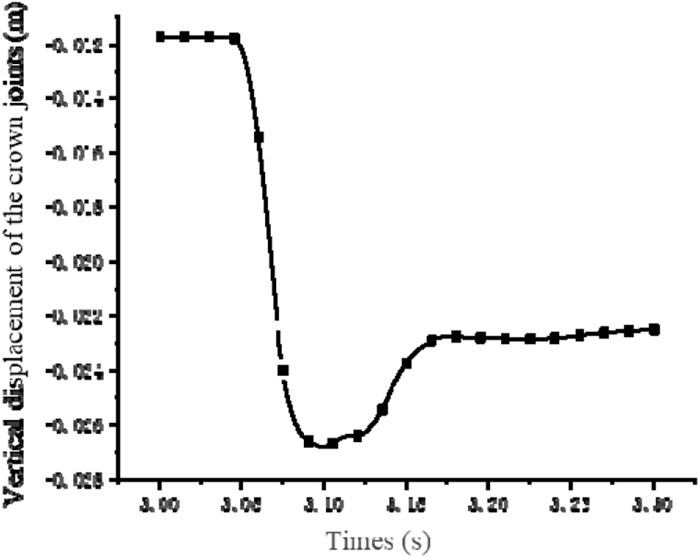
Figure 20. Vertical displacement time-history curve of vault joints under the condition of cavern excavation and unloading.
The maximum velocity at the crown joint reaches −0.6294 m/s, as showed in Figure 21. Compared to the peak velocity of −0.5752 m/s when excavation unloading is not considered, increased by 9.40%. The vertical vibration velocity of the crown joint increases. The vertical vibration speed of the crown joint increases, when excavation and unloading of the cavern are considered. This is because the deformation of the surrounding rock is more effectively restrained by the pre-stressed anchor bolts. The energy transformed into deformation in the cavern is less, under the same dynamic loading conditions. More energy is converted into vibration of the surrounding rock in the cavern. The peak vibration velocity is higher.
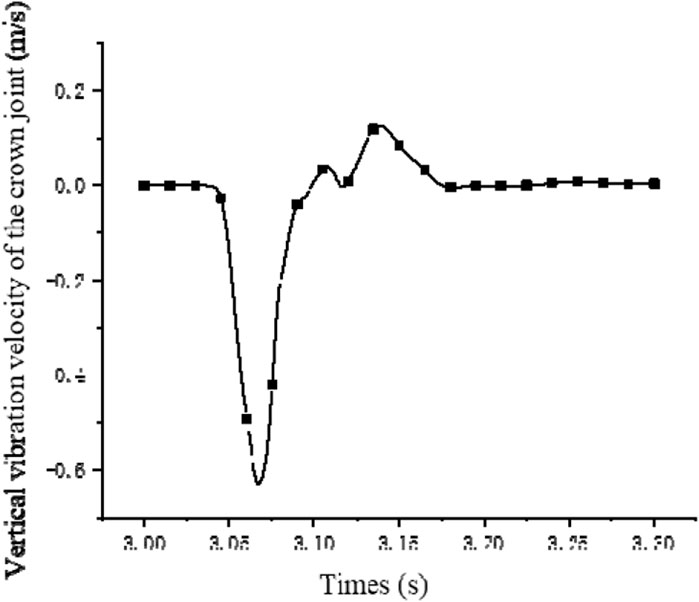
Figure 21. Vertical vibration time-history curve of cavern vault joint under the action of prestressed anchor cable support.
Most studies are based on the combined effects of anchoring and lining. However, existing research is insufficient when it comes to analyzing the mechanisms of anchoring and lining support. It is more beneficial to study these methods individually to understand their respective mechanisms under blast loading. In practical engineering, this approach can help improve project quality, reduce costs, and minimize the likelihood of accidents. The blast resistance of underground caverns and the influence of support parameters on blast resistance have been studied, when lining and pre-stressing anchors are supported individually under dynamic and static coupling. The study focused on straight-walled arched caverns, chosen for their strong blast resistance. The influence of excavation unloading on the support structure was analyzed, under the condition of a burial depth of 500 m. The blast resistance of the cavern was examined, encompassing both singular concrete lining support and singular pre-stressed anchor bolt support. The following conclusions were drawn.
(1) The deformation and vibration response of the surrounding rock in the cavern were studied. The effectiveness of singular concrete lining support without considering the excavation unloading was examined, along with the distribution of tensile and compressive damage in the lining. The research findings suggest that the damage is more severe, at both ends of the lining’s arch and at the bottom of the wall. The vibration velocity of the surrounding rock decreases with increasing liner thickness. The values and range of tensile and compressive damage in the lining are also reduced. The effect is more pronounced, when the energy of the explosion stress wave is absorbed by the concrete lining acting as “passive” support. The vibration response of the cavern is reduced and the restriction on surrounding rock deformation is stronger, when pre-stressed anchor bolts act as “active” support.
(2) The anti-explosion support characteristics of single support structures were compared and analyzed, by varying support parameters. The research findings indicate that pre-stressed anchor bolts significantly limit the deformation capacity of surrounding rock, while lining is more effective in restricting the vibration response of surrounding rock. Enhancing the axial tension of the pre-stressed anchor bolts from 1,000 to 4000 kN, elevating the masonry thickness from 40 to 100 cm. The reduction in rock deformation ranges from 7.88% to 11.85% and from 6.57% to 9.40%. The decrease in vibration velocity ranges from 11.23% to 12.96% and from 16.07% to 24.54%. The support system limits the dynamic response capacity of the cavern within a certain range.
(3) Extensive compression damage distribution is observed in the masonry during the excavation and unloading phase, under the coupling effect of static and dynamic loads. The blast-induced ground loading cannot be further sustained. However, the pre-stressed anchor bolts ensure operation within the strength range throughout the entire process, with no alteration in load-bearing capacity.
(4) A conceptual design for the blast-resistant support of underground caverns has been proposed, under the influence of dynamic-static coupling. Increasing the thickness of the lining can reduce the vibration response of the cavern. Meanwhile, enhancing the pre-stressed anchor bolts within a certain range notably restricts the deformation response of the cavern. Therefore, pre-stressed anchor bolts should be employed as the supporting structure to bear the excavation and unloading loads of the cavern.
The original contributions presented in the study are included in the article/Supplementary Material, further inquiries can be directed to the corresponding author.
XL: Conceptualization, Methodology, Resources, Validation, Visualization, Writing–original draft, Writing–review and editing.
The author declare that financial support was received for the research, authorship, and/or publication of this article. This research is financially supported by the Key R&D and Transformation Plan of Qinghai Province (2021-SF-167).
Author XL was employed by China Coal Science and Technology Ecological Environment Technology Co. Ltd.
All claims expressed in this article are solely those of the authors and do not necessarily represent those of their affiliated organizations, or those of the publisher, the editors and the reviewers. Any product that may be evaluated in this article, or claim that may be made by its manufacturer, is not guaranteed or endorsed by the publisher.
dt, Damage factors under uniaxial tension; dc, Damage factors under uniaxial compression; dt0, Evolution parameter of concrete uniaxial tensile damage; dc0, Evolution parameter of concrete uniaxial compressive damage; Ft, Concrete uniaxial tensile strength; fc, Concrete uniaxial compressive strength; st, Stress state function; sc, Stress state function; εtu, Ultimate tensile strain of concrete; εcu, Ultimate compressive strain of concrete; εe, Elastic strain; εin, Nonlinear strain; αt, Parameter value of the plastic stage of the stress-strain curve; αa, Values of the ascending segments of the concrete uniaxial stress-strain curve; αd, Values of the descending segments of the concrete uniaxial stress-strain curve; Σ, Actual stress of the concrete; Ε, Actual strain of the concrete; ΔT, Prescribed temperature change; N, Designed axial force of the anchor; Α, Linear expansion coefficient of the anchor; E, Elastic modulus of the anchor.
Bai, J., Wang, L., Tang, K., and Han, J. (2014). Influence of excavation unloading rate on the stress and strain of rock slope. J. Yangtze River Sci. Res. Inst. 31 (60-64), 68.
Chen, R., Dong, Q., Yu, B., Li, K., Zhang, W., Chen, X., et al. (2019). Numerical research on anti-explosion capacity of foam concrete composite structure in underground openings under close-in explosion. Chin. J. Comput. Mech. 38, 267–277.
Chen, R., Zeng, W., Wu, H., Wu, W., and Liu, Q. (2020). Case study of tunneling-induced settlement and damage of masonry buildings. Chin. J. Geotech. Eng. 42, 2301–2307.
Chen, S., Shaofeng, C., Jiachen, G., Liu, M., Xu, C., and Haibo, L. (2022). Blasting vibration response of sandstone tunnel surrounding rock under high ground stress. J. Vib. Shock 41, 73–80.
Feng, JING, Cheng, C., Meiwan, Y. U., Chen, H., and Liu, Y. (2011). Load distribution and the law of its variation in the inner segment of prestressed anchor cable. J. Yangtze River Sci. Res. Inst. 28, 50–54.
Ferrotto, M. F., Cavaleri, L., and Trapani, F. D. (2018). FE modeling of Partially Steel-Jacketed (PSJ) RC columns using CDP model. Comput. Concr. 22, 143–152. doi:10.12989/cac.2018.22.2.143
Ganchen, X., Gu, J., Yuan, W., Zhang, X., and Songlin, X. (2014). Model test study on explosive resistance of intercross bolted rock mass structure in underground space. Chin. J. Undergr. Space Eng. 10, 1078–1085.
Hafezolghorani, M., Hejazi, F., Vaghei, R., Jaafar, M. S. B., and Karimzade, K. (2017). Simplified damage plasticity model for concrete. Struct. Eng. Int. 27, 68–78. doi:10.2749/101686616X1081
Honglu, F., and Zhang, G. (2013). Displacement responses of Dahuanggou surrounding rock with small clearance under blast loads. Explos. Shock Waves 33, 91–97.
Ji, L., Zhou, C., Zhang, B., and Wang, F. (2021). Study on dynamic response and damage effect of surrounding rock in large tunnel under blasting excavation. J. China Railw. Soc. 43, 161–168.
Jiang, J., Zhenyu, Y., Qi, C., Qingyu, M., and Zhang, H. (2019). Experimental research on mechanical features model of prestressed mutual-anchored retaining wall. J. Shandong Univ. Eng. Sci. 49, 61–69.
Jingmao, X., Gu, J., Chen, A., Xiangyang, Z., Zhiqing, M., and Shiyou, X. (2012b). MODEL TEST STUDY OF ANTI-EXPLOSION CAPACITY OF ANCHORED TUNNEL WITH LOCAL LENGTHENING ANCHORS IN ARCH SPRINGING. Chin. J. Rock Mech. Eng. 31, 2182–2186.
Jingmao, X., Gu, J., Chen, A., Zhang, X., and Zhiqing, M. (2012a). Study of anti-explosion ability of reinforced tunnels with different anchor lengths and spacings. Rock Soil Mech. 33, 3489–3496.
Li, G., Zhu, C., He, M., Zuo, Y., Gong, F., Xue, Y., et al. (2023a). Intelligent method for parameters optimization of cable in soft rock tunnel base on longitudinal wave velocity. Tunn. Undergr. Space Technol. 133, 104905. doi:10.1016/j.tust.2022.104905
Li, G., Zhu, C., Hongliang, L., Tang, S., Du, K., and Wu, C. Z. (2023b). Energy balance support method in soft rock tunnel with energy absorbing anchor cable. Tunn. Undergr. Space Technol. 141, 105380. doi:10.1016/j.tust.2023.105380
Li, X., Huang, J., Luo, Y., Dong, Q., Li, Y., Wan, Y., et al. (2017). Numerical simulation of blast vibration and crack forming effect of rock-anchored beam excavation in deep underground caverns. Shock Vib. 2017 (1), 1–13. doi:10.1155/2017/1812080
Liu, J., Tan, K., and Yao, Y. (2018). A new perspective on nature of fire-induced spalling in concrete. Constr. Build. Mater. 184, 581–590. doi:10.1016/j.conbuildmat.2018.06.204
Liu, X., Liu, Y., Hou, X., Chen, C., and Gao, R. (2024). Numerical simulation of mechanical characteristics and safety performance for pre-cracked tunnel lining with the extended finite element method. Buildings 14, 123. doi:10.3390/buildings14010123
Mohammed, I., Zhengfeng, Z., and Changfa, A. (2023). Plastic damage analysis of concrete around misaligned dowel bar in jointed concrete pavement. Int. J. Pavement Eng. 24, 2268803. doi:10.1080/10298436.2023.2268803
Neuberger, Y. M., Andrade, M. V., de Sousa, A. M. D., Bandieira, M., da Silva Júnior, E. P., dos Santos, H. F., et al. (2023). Numerical analysis of reinforced concrete corbels using concrete damage plasticity: sensitivity to material parameters and comparison with analytical models. Buildings 13, 2781. doi:10.3390/buildings13112781
Peng, Y., Lu, W., Ming, C., and Zhou, C. (2009). Study of the damage characteristics of surrounding rocks for tunnels constructed using TBM and drill-and-blast. China Civ. Eng. J. 42, 121–128.
Ren, F., Zhu, C., Yuan, Z., Karakus, M., Tang, S., and He, M. (2023). Recognition of shear and tension signals based on acoustic emission parameters and waveform using machine learning methods. Int. J. Rock Mech. Min. Sci. 171, 105578. doi:10.1016/j.ijrmms.2023.105578
Ren, X., and Chunxia, Z. (2016). EXPERIMENTAL RESEARCH ON MASONRY STRUCTURE STRENGTH UNDER BIAXIAL TENSILE-COMPRESSIVE STRESS. Eng. Mech. 33, 183–188.
Sun, Y., Jingshan, B., Ping, L., Xiaoyun, G., and Xiaoguang, C. (2010). Influence of earthquake on rock dynam ic pressure of underground chambers. Earthq. Eng. Eng. Vib. 30, 171–177.
Sun, Z., Zhang, D., Liu, D., Hou, Y., and Ao, L. (2022). ANALYSIS OF THE WHOLE-PROCESS MECHANICAL RESPONSE OF TUNNEL SURROUNDING ROCK UNDER THE EFFECT OF ANCHORAGE SYSTEM. Eng. Mech. 39, 170–182.
Tan, G., Jiang, Y., Fang, W., Gao, M., Na, L., Shi, F., et al. (2021). Study on structural design of full-length compression post-tensioned prestressed anti-floating anchor. Build. Struct. 51 (7-10), 6.
Wang, Q., Shao, Z., Cheng, Y., and Li, P. (2015). Broadband low-cost reflectarray using modified double-square loop loaded by spiral stubs. IEEE Trans. Antennas Propag. 63 (9), 4224–4229. doi:10.1109/tap.2015.2448797
Wang, Y., Shang, Y., Sun, H., Huanqiang, L., and Xinghua, X. (2010). Study on mechanical rules of double - lining in creeping surrounding rock. Hydrogeol. Eng. Geol. 37, 49–54.
Wenbo, L. U., Chuangbing, ZHOU, Ming, CHEN, Jin, L., and Peng, Y. A. N. (2008). RESEARCH ON TRANSIENT CHARACTERISTICS OF EXCAVATION UNLOADING. Chin. J. Rock Mech. Eng. 27, 2184–2192.
Xiao, Z., Zhihua, G., Peng, L., and Zhang, Y. (2014). Characteristics of dynamic response of surrounding rock induced by blasting excavation in underground cavern of HD project. Blasting 31, 55–59.
Yang, X., Zhou, Y., and He, S. (2009a). A test on frame prestressed anchor in landslide reinforcement. J. Catastrophology 24, 37–40.
Yang, Y., Chen, J. T., and Xiao, M. (2015). Analysis of seismic supporting effects of bolt and lining of underground caverns. Mater. Res. Innov. 19, S6-S159–S6-164. doi:10.1179/1432891715Z.0000000001470
Yang, Z., Gu, J., Chen, A., and Jingmao, X. U. (2009b). Model experiment study on influence of anti-blast characteristics of rock bolt length on wall rock of underground cavern. J. Vib. Shock 28, 24–27.
Yang, W., and Fan, G. (2007). Control of blasting vibration of underground chamber at a hydropower station. Blasting 24, 87–90.
Yongming, T., Lu, Z., Jiwen, Z., and Yang, Q. (2008). THE EXPERIMENTAL STUDY ON THE FOUR TYPES OF FRP TENDON ANCHORAGE SYSTEMS. Ind. Constr. 38 (38-41), 111.
Yuchen, W., Yuan, M., Xinming, Q., Yaxin, G., and Yiming, L. (2021). Research on response characteristics of concave honeycomb gradient structure under explosive impact environment. J. Saf. Sci. Technol. 17, 5–11.
Zhang, T., Shi, S., Zhongsheng, X., Jiong, L., and Yuan, D. (2014). Model test study of the soil anti-force distribution rule under the beams of a frame anchorage system. Hydrogeol. Eng. Geol. 41, 70–75.
Zhang, W., Duan, L., Sha, L., and Liu, J. (2016). Dynamic elastic-plastic time-history analysis of masonry structure based on ABAQUS. Build. Struct. 46, 64–70.
Zhang, W., Liang, G., Liang, Y., and ZhangXiao, Z. C. (2023). Dynamic responses of a coupled tunnel with large span and small clear distance under blasting load of the construction of transverse passage. Appl. Sci. 13, 8599. doi:10.3390/app13158599
Zhida, L., Yanzhen, W., Gang, Z., Qiang, H., and Liu, J. (2010). Interaction between tunnel surrounding rock and support. Nat. Sci. J. Xiangtan Univ. 32, 40–45.
Zhou, J., Yang, X.-A., Ma, M.-J., and Li, L.-H. (2021). The support load analysis of deep-buried composite lining tunnel in rheological rock mass. Comput. Geotech. 130, 103934. doi:10.1016/j.compgeo.2020.103934
Zhou, Y., and Zhu, Y. (2010). Research on the anchor prestress loss of grillage flexible supporting structure with prestressed anchors. Geotech. Investig. Surv. 38, 1–6.
Zhu, B., Zhou, C., and Jiang, N. (2023). Dynamic response characteristics and safety control of mortar bolts under the action of tunnel blasting excavation. J. Vib. Eng. 36, 235–246.
Keywords: underground cavern, blast resistance, explosive ground loads, lining support, prestressed anchor
Citation: Liu X (2024) The study of the blast resistance performance of underground cavern support structures under the effect of explosive ground loads. Front. Earth Sci. 12:1423731. doi: 10.3389/feart.2024.1423731
Received: 26 April 2024; Accepted: 11 June 2024;
Published: 22 July 2024.
Edited by:
Chun Zhu, Hohai University, ChinaCopyright © 2024 Liu. This is an open-access article distributed under the terms of the Creative Commons Attribution License (CC BY). The use, distribution or reproduction in other forums is permitted, provided the original author(s) and the copyright owner(s) are credited and that the original publication in this journal is cited, in accordance with accepted academic practice. No use, distribution or reproduction is permitted which does not comply with these terms.
*Correspondence: Xinxing Liu, bGl1eGlueGluZ3h1ZUAxMjYuY29t
Disclaimer: All claims expressed in this article are solely those of the authors and do not necessarily represent those of their affiliated organizations, or those of the publisher, the editors and the reviewers. Any product that may be evaluated in this article or claim that may be made by its manufacturer is not guaranteed or endorsed by the publisher.
Research integrity at Frontiers

Learn more about the work of our research integrity team to safeguard the quality of each article we publish.