- 1Departamento de Geologia Aplicada - FGEL/UERJ, Rio de Janeiro, Brazil
- 2Programa de Pós-Graduação em Geociências – PPGG-UERJ, Rio de Janeiro, Brazil
1 Introduction
Open-source geophysical datasets and synthetic earth models are becoming increasingly common in geosciences as they are required to study various geologic problems. There are published examples from several projects covering all geophysical methods at different scales and for diverse goals such as stratigraphy (Huber, 2019; Menezes, 2021), petroleum exploration (Fehler, 2009; Lynn et al., 2021), and CO2 sequestration (Andersen et al., 2019; Gasperikova et al., 2022).
The MR3D is an open-source project aiming to provide a realistic geoelectric model and associated electromagnetic datasets of a Brazilian coast deep-water turbidites system (Marlim Reservoirs); these are considered analogs to other systems worldwide (Carvalho and Menezes, 2017b).
In Phase 1, (Carvalho and Menezes, 2017b), presented the workflow for building an anisotropic geoelectric model and made it available on the seismic scale (75 x 25 x 5 m). In Phase 2, (Correa and Menezes, 2019), upscaled the seismic model to a 100 x 100x 20 m necessary to run 3D forward modeling codes to generate the CSEM (controlled-source electromagnetic) dataset. In Phase 3, (Correa and Menezes, 2021), upscaled the CSEM model to accommodate the regional features of Campos Basin to generate the MMT (marine magnetotelluric) dataset. The central core of the mess was discretized at regular intervals of 200 x 200 x 20 m, and beyond that core area, cells increased with an incremental factor of 1.4 with distance.
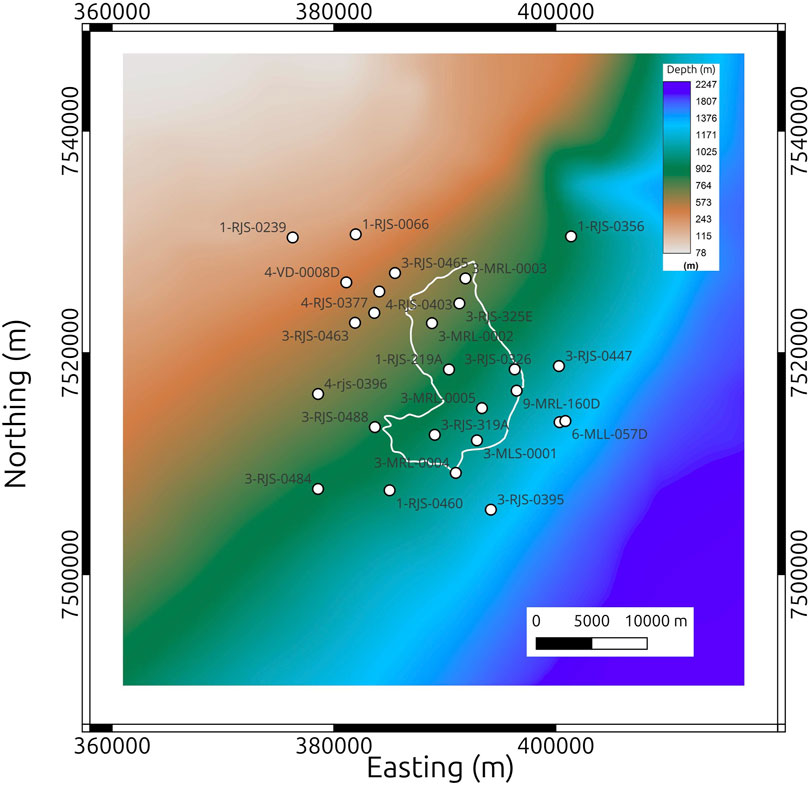
In Phase 4, we present a realistic synthetic resistivity log dataset built from the MR3D resistivity model. These resistivity logs were constructed by combining the low-frequency horizontal resistivity model (Carvalho and Menezes, 2017b) with the high-frequency variations of actual resistivity logs acquired (0.154 m sampling rate) at 27 wells available in the MR3D area (Figure 1). This dataset complements the previously published by (Carvalho and Menezes, 2017a), forming a multi-scale data cluster for educational purposes, training samples for machine learning (ML) interpretation workflows, and developing imaging and inversion algorithms. The synthetic resistivity well-log data are now available on the Zenodo platform for free research or commercial use under the Creative Commons License.

Figure 1. Bathymetric map of the Marlim Oilfield with the location of the synthetic 27 wells made available in this study. The white polygon line represents the outline of the Marlim reservoir.
2 Creation of the synthetic resistivity logs
ML algorithms and interpretation workflows are becoming more popular, and some require well logs as part of the training data (Vereshagin et al., 2019; Li et al., 2021). To that end, we present a set of realistic resistivity logs at the well scale with high-frequency content compatible with actual data (0.154 m sampling rate). Correa and Menezes (2019) provide six synthetic well logs, but as they were extracted from the lower frequency seismic scale model (5 m sampling rate), they are not appropriate to represent an actual well log.
The Brazilian Petroleum Agency (ANP) made available the public resistivity dataset of 27 wells in the study area. These wells are distributed inside and outside the Oligocene turbidite reservoir (Figure 1), so they sample reservoir and non-reservoir facies in the Oligocene interval, thus making our dataset suitable for interpretation.
We developed a five-step workflow based on the findings of (Alumbaugh et al., 2023) to produce a realistic dataset.
1. Well-log edition and preconditioning with a spike removal filter aiming to discard deviant values from the data.
2. The resistivity logs were low-pass filtered with a 101-data-point averaging window to approximate a depth interval of 15 m, three times the geological model’s sampling rate (5 m).
3. Subtract the low-pass filtered logs of step 2 from the actual logs aiming to produce fine-scale high-frequency ‘perturbation’ logs.
4. Extract pseudo-logs of the MR3D horizontal resistivity cube at each of the wells locations shown in Figure 1.
5. Sum the perturbation logs of step 3 to the pseudo-logs to produce realistic synthetic logs that have both the fine-scale variations of the actual logs and the low-frequency resistivity variations of MR3D.
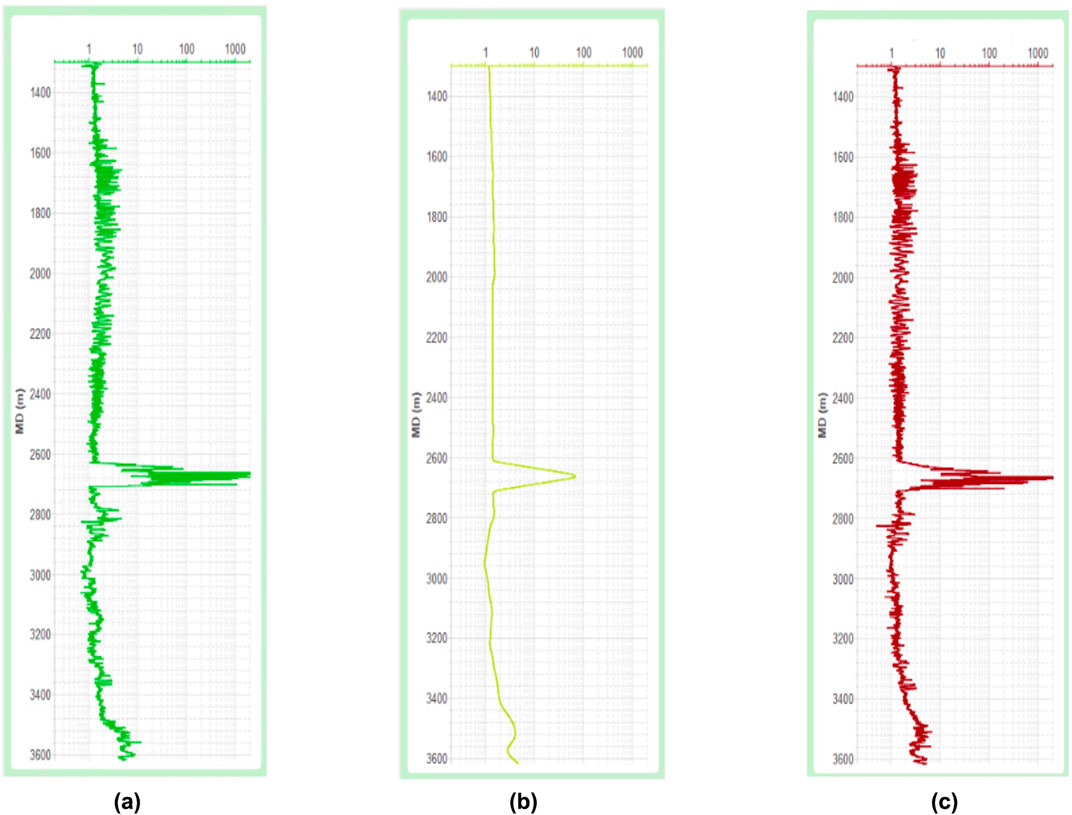
Figure 2 shows the actual log(a), the synthetic log extracted from the MR3D cube (b), and the final realistic synthetic log at the 1-RJS-219A (c), the discovery well of the Marlim oilfield.

Figure 2. 1-RJS-219A well. (A) Actual resistivity log. (B) Synthetic resistivity log extracted from the MR3D model (Carvalho and Menezes, 2017a). (C) Realistic synthetic resistivity log.
The final curve (Figure 2C) resembles an actual log curve, with the high-frequency content observed at any authentic well-log acquisition. The curves for all 27 wells are available in the Supplementary Material.
A critical aspect of our dataset is that the 27 wells survey distinct regions within the Marlim oilfield, inside and outside the main reservoir. Thus, it is more appealing for interpretation as it probes distinct geological situations by imaging fine-scale geological features of reservoir and non-reservoir facies.
3 Conclusion
Here, we introduce a large resistivity well-log dataset with 27 wells complementary to the MR3D model dataset. This new dataset can be employed for educational purposes, such as teaching well-log data processing and filtering schemes, testing forward-inversion-modeling interpretation methodologies, and developing applications such as new ML interpretation workflows. Usually, one of the main problems with such procedures is the lack of training data. The workflow herein presented can be applied to any other geological area when creating synthetic earth models.
Using the existing logs acquired at each well as a starting point, our synthetic resistivity logs obey the fine-scale geological features mapped at depth combined with the coarser-scale geological model. The resistivity logs of all 27 wells are presented in the additional material.
4 Nomenclature
4.1 Resource Identification Initiative
To take part in the Resource Identification Initiative, please use the corresponding catalog number and RRID in your current manuscript. For more information about the project and for steps on how to search for an RRID, please click here.
Data availability statement
The datasets presented in this study can be found in online repositories. The names of the repository/repositories and accession number(s) can be found in the article/Supplementary Material.
Author contributions
PM: Conceptualization, Methodology, Validation, Writing–original draft, Writing–review and editing. EM: Methodology, Validation, Writing–original draft, Writing–review and editing.
Funding
The author(s) declare that no financial support was received for the research, authorship, and/or publication of this article.
Acknowledgments
We thank LAGEX-UERJ and Petrobras for supporting computational studies and dGB Earth Sciences for making the seismic interpretation software OpendTect freely available. We are grateful to M. Bezzeghoud, O. C. Reyes, and G. Campilongo for their suggestions to improve our paper.
Conflict of interest
The authors declare that the research was conducted in the absence of any commercial or financial relationships that could be construed as a potential conflict of interest.
Publisher’s note
All claims expressed in this article are solely those of the authors and do not necessarily represent those of their affiliated organizations, or those of the publisher, the editors and the reviewers. Any product that may be evaluated in this article, or claim that may be made by its manufacturer, is not guaranteed or endorsed by the publisher.
Supplementary material
The Supplementary Material for this article can be found online at: https://www.frontiersin.org/articles/10.3389/feart.2024.1422255/full#supplementary-material
References
Alumbaugh, D., Gasperikova, E., Crandall, D., Commer, M., Feng, S., Harbert, W., et al. (2023). The Kimberlina synthetic multiphysics dataset for CO2 monitoring investigations. Geoscience Data J. 11, 216–234. doi:10.1002/gdj3.191
Andersen, O., Tangen, G., Ringrose, P., and Greenberg, S. E. (2019). CO2 data share: a platform for sharing CO2 storage reference datasets from demonstration projects. SSRN Electron. J. doi:10.2139/ssrn.3365804
Carvalho, B. R., and Menezes, P. T. L. (2017a). Marlim R3D - a realistic model for mcsem simulation. doi:10.5281/ZENODO.400233
Carvalho, B. R., and Menezes, P. T. L. (2017b). Marlim R3D: a realistic model for CSEM simulations - phase I: model building. Braz. J. Geol. 47, 633–644. doi:10.1590/2317-4889201720170088
Correa, J. L., and Menezes, P. T. L. (2019). Marlim R3D: a realistic model for controlled-source electromagnetic simulations — phase 2: the controlled-source electromagnetic data set. GEOPHYSICS 84, E293–E299. doi:10.1190/geo2018-0452.1
Correa, J. L., and Menezes, P. T. L. (2021). Marlim R3D phase 3: the marine magnetotelluric regional model and associated data set. Lead. Edge 40, 686–692. doi:10.1190/tle40090686.1
Fehler, M. (2009). Seam phase i progress report: “classic” data sets. Lead. Edge 28, 1178–1181. doi:10.1190/tle28101178.1
Gasperikova, E., Alumbaugh, D., Crandall, D., Commer, M., Feng, S., Harbert, W., et al. (2022). Kimberlina 1.2 ccus geophysical models and synthetic data sets. doi:10.18141/1887287
Huber, E. (2019). GPR data used to test the efficient deconvolution method of Schmelzbach and Huber. doi:10.5281/zenodo.2586189
Li, G., He, Z., Deng, J., Tang, J., Fu, Y., Liu, X., et al. (2021). Robust csem data processing by unsupervised machine learning. J. Appl. Geophys. 186, 104262. doi:10.1016/j.jappgeo.2021.104262
Lynn, H., Sayers, C. M., and Roure, B. (2021). The seam barrett model: strengths and weaknesses. GEOPHYSICS 86, M177–M183. doi:10.1190/geo2020-0937.1
Menezes, P. T. L. (2021). The itapemirim river delta GPR dataset. Front. Earth Sci. 9. doi:10.3389/feart.2021.653275
Keywords: synthetic earth model, turbidites, well-log, resistivity modeling, inverse modeling
Citation: Menezes PTL and Menor EN (2024) MR3D phase 4: the synthetic resistivity well log dataset. Front. Earth Sci. 12:1422255. doi: 10.3389/feart.2024.1422255
Received: 23 April 2024; Accepted: 04 November 2024;
Published: 14 November 2024.
Edited by:
Mourad Bezzeghoud, Universidade de Évora, PortugalReviewed by:
Octavio Castillo Reyes, Universitat Politecnica de Catalunya, SpainGloria Campilongo, University of Calabria, Italy
Copyright © 2024 Menezes and Menor. This is an open-access article distributed under the terms of the Creative Commons Attribution License (CC BY). The use, distribution or reproduction in other forums is permitted, provided the original author(s) and the copyright owner(s) are credited and that the original publication in this journal is cited, in accordance with accepted academic practice. No use, distribution or reproduction is permitted which does not comply with these terms.
*Correspondence: Paulo T. L. Menezes, cGF1bG8ubWVuZXplc0B1ZXJqLmJy
 Paulo T. L. Menezes
 Everton N. Menor