
94% of researchers rate our articles as excellent or good
Learn more about the work of our research integrity team to safeguard the quality of each article we publish.
Find out more
ORIGINAL RESEARCH article
Front. Earth Sci., 24 July 2024
Sec. Hydrosphere
Volume 12 - 2024 | https://doi.org/10.3389/feart.2024.1421265
 Zeli Tan1*
 L. Ruby Leung1
 Chang Liao1Luca Carniello2José F. Rodríguez3Patricia M. Saco4
 Steven G. Sandi5
Coastal wetlands play an important role in the global water and biogeochemical cycles. Climate change makes it more difficult for these ecosystems to adapt to the fluctuation in sea levels and other environmental changes. Given the importance of eco-geomorphological processes for coastal wetland resilience, many eco-geomorphology models differing in complexity and numerical schemes have been developed in recent decades. However, their divergent estimates of the response of coastal wetlands to climate change indicate that substantial structural uncertainties exist in these models. To investigate the structural uncertainty of coastal wetland eco-geomorphology models, we developed a multi-algorithm model framework of eco-geomorphological processes, such as mineral accretion and organic matter accretion, within a single hydrodynamics model. The framework is designed to explore possible ways to represent coastal wetland eco-geomorphology in Earth system models and reduce the related uncertainties in global applications. We tested this model framework at three representative coastal wetland sites: two saltmarsh wetlands (Venice Lagoon and Plum Island Estuary) and a mangrove wetland (Hunter Estuary). Through the model–data comparison, we showed the importance of using a multi-algorithm ensemble approach for more robust predictions of the evolution of coastal wetlands. We also found that more observations of mineral and organic matter accretion at different elevations of coastal wetlands and evaluation of the coastal wetland models at different sites in diverse environments can help reduce the model uncertainty.
Coastal wetlands, such as tidal marshes and mangroves, are valued for providing many important ecosystem services, including coastline protection, storm surge attenuation, wildlife habitat, and water quality improvement. In particular, they are observed to sequester atmospheric carbon dioxide at a rate much higher than other ecosystems, thus offering a potential nature-based solution for climate mitigation (Aburto-Oropeza et al., 2008; Temmerman et al., 2013; Teuchies et al., 2013; Macreadie et al., 2019). Despite the resilience of coastal wetlands to past fluctuations in sea level and climate over long periods of time (Cahoon et al., 2006; Saintilan et al., 2020; Törnqvist et al., 2020), recent observations of local wetland loss raise concerns over their acclimation to intensified natural and human-induced disturbances, such as sea level rise (SLR), storm surge, sediment supply reduction, eutrophication, and drought (Blum and Roberts, 2009; Deegan et al., 2012; Kirwan and Megonigal, 2013; Crosby et al., 2016; FitzGerald et al., 2021; Törnqvist et al., 2021).
Eco-geomorphological processes, such as mineral accretion and organic matter (OM) accretion, play crucial roles in the acclimation of coastal wetlands to natural and human-induced disturbances (Craft et al., 2009; Howes et al., 2010; Kirwan et al., 2016; Leonardi et al., 2016; Schuerch et al., 2018). Mineral accretion is a process of mineral sediment accumulation on the soil bed of coastal wetlands through either plant-mediated particle settling or direct capture of sediment by plant stems (Kirwan and Mudd, 2012) and can help coastal wetlands build elevation against rising sea levels (Cahoon et al., 2021). With the accumulation of plant litter in the soil column, OM accretion can also help raise the bed elevation of coastal wetlands (Kirwan and Mudd, 2012). Due to the importance of these eco-geomorphologic processes, many eco-geomorphology models with varying complexities and parameterization methods have been developed in recent decades (D'Alpaos et al., 2011; Fagherazzi et al., 2012; Kirwan et al., 2010; Marani et al., 2007; Mcleod et al., 2010; Rodríguez et al., 2017). The applications of these models at the regional, continental, and global scales have greatly advanced our understanding of the evolution of coastal wetlands under intensified environmental changes and provided valuable insights into the management and conservation of this ecosystem (Reyes et al., 2000; Mariotti and Fagherazzi, 2010; Kirwan and Mudd, 2012; Leonardi et al., 2016).
However, substantial structural uncertainty exists in these eco-geomorphology models, as indicated by their inconsistent predictions on the fate of coastal wetlands under accelerated SLR (Craft et al., 2009; Kirwan et al., 2010; Kirwan et al., 2016; Rodríguez et al., 2017; Schuerch et al., 2018). For example, using a model ignoring the adaptation of saltmarshes to SLR, Craft et al. (2009) estimated that saltmarshes will decrease in area by 45% by 2100 under the worst SLR scenario projected by the Intergovernmental Panel on Climate Change (IPCC). However, based on a saltmarsh with complex eco-geomorphological processes, a more recent study demonstrated that marshes could survive under a wide range of future SLR scenarios by building elevations (Kirwan et al., 2016). The structural uncertainty of the eco-geomorphology models has two sources. First, eco-geomorphology models can implement different parameterization schemes for the same process. For instance, there are at least seven different mineral accretion schemes implemented in various eco-geomorphology models (D’Alpaos et al., 2007; Fagherazzi et al., 2007; French, 2006; Kirwan and Mudd, 2012; Morris et al., 2012; Temmerman et al., 2003b; van de Koppel et al., 2005). Second, as explained above, eco-geomorphology models differ in the included processes.
Our understanding of the structural uncertainty of eco-geomorphology models is still limited. A few studies have strived to understand the uncertainty of coastal wetland eco-geomorphology models through model comparison (Kirwan et al., 2010) or model review (Mcleod et al., 2010; Fagherazzi et al., 2012). However, unlike the state-of-the-art methods used to compare some other Earth system processes (Huntzinger et al., 2013; Schellnhuber et al., 2014; Jin et al., 2016; Tan et al., 2018; Guseva et al., 2020), model comparison and review can only provide an incomplete evaluation of model uncertainty (Fisher and Koven, 2020). For model review, the related studies mostly focused on analyzing high-level features of eco-geomorphology models, such as capability and complexity, input requirements, spatial- and temporal-scale accountability, and practical applicability, but did not consider the real performance of the eco-geomorphology models in simulating coastal wetland dynamics under diverse environmental conditions (Mcleod et al., 2010; Fagherazzi et al., 2012). For model comparison, previous studies usually compared eco-geomorphology models at the ecosystem level with a focus on the overall response of coastal wetlands to SLR, and the participant models were commonly not configured under a consistent protocol. As a result, the model uncertainty associated with individual processes cannot be isolated, and not all estimated model uncertainties can be attributed to eco-geomorphologic processes (Kirwan et al., 2010). In addition, these model comparison studies were only conducted at specific or very few sites (Kirwan et al., 2010). It is, thus, unclear how well the knowledge gained at a specific site can be transferred to other environmental conditions.
Algorithm-level model comparison approaches have shown promising skills for assessing the uncertainty of a particular process in large-scale models (Donatelli et al., 2014; Jin et al., 2016; Tan et al., 2018). Motivated by these studies, we developed an algorithm-level model comparison framework to investigate the structural uncertainty of coastal wetland eco-geomorphology models. The efficacy of the framework is evaluated at coastal wetland sites under distinct environmental conditions. Through this work, we aim to evaluate the algorithm-level uncertainties of coastal wetland eco-geomorphology modeling related to mineral and OM accretion and explore possible ways to reduce the related uncertainties in global applications.
We developed a multi-algorithm coastal wetland eco-geomorphology simulator (MACES) model framework to assess the structural uncertainty of eco-geomorphology models. The MACES framework consists of two components (Supplementary Figure S1): a one-dimensional (1D) transect-based hydrodynamic module (MACES-hydro) and an algorithm-level model comparison module that implements different eco-geomorphologic process algorithms (MACES-geomor). MACES-hydro simulates water level, tide velocity, significant wave height, bottom shear stress, suspended sediment, and other hydrodynamic conditions along a 1D coastal transect that varies from low-elevation open water at the ocean side to high-elevation upland at the land side (Figure 1). All eco-geomorphology algorithms in MACES-geomor (Table 1) use the same hydrodynamic conditions simulated by MACES-hydro to model eco-geomorphologic processes at each grid cell of the coastal transect. At the end of each year, MACES updates the transect elevation profile and land cover. A design feature of MACES is that a new coastal wetland eco-geomorphology model can be easily created by configuring MACES-geomor with a different combination of eco-geomorphologic algorithms. Although we focus on mineral and OM accretion, the developed framework can be extended to other eco-geomorphologic processes, such as landward migration and wave-action erosion.
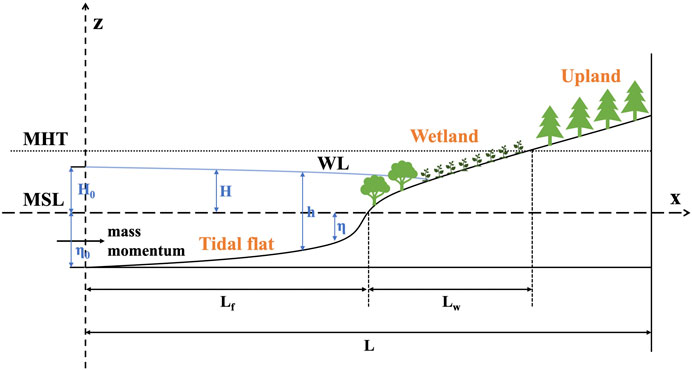
Figure 1. Sketch of the coastal system and notations. L denotes the 1D transect domain of coastal landscapes, with Lf as the domain of tidal flats and Lw as the domain of coastal wetland. MSL is the mean sea level, MHT is the mean high tide water level, and WL is the water level. H, h, and η represent the water level relative to MSL, water depth, and bottom elevation relative to MSL, respectively. H0 is the water level at the seaward boundary, and η0 is the bottom elevation at the seaward boundary.
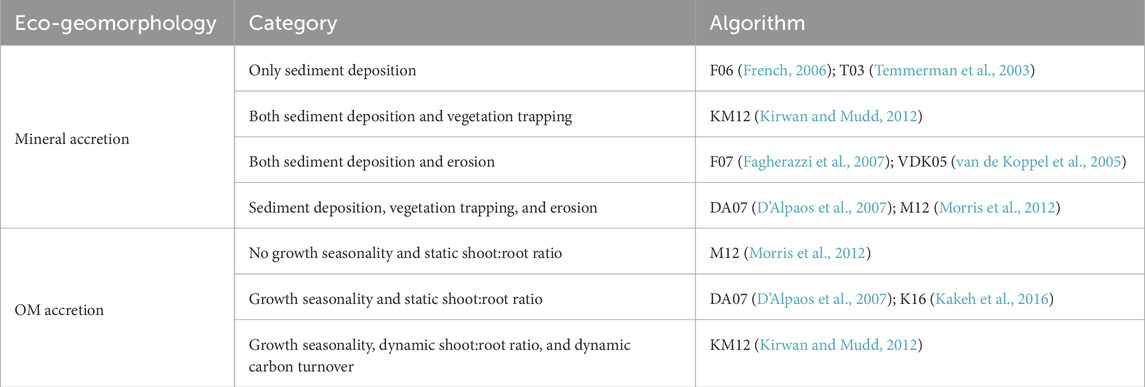
Table 1. Summary of the MACES-geomor eco-geomorphology algorithms.
The 1D transect-based coastal hydrodynamic model MACES-hydro was developed mainly based on the work by Tambroni and Seminara (2012) and Carniello et al. (2005) for cross-section averaged physical variables on the coastal landscape. It simulates tide and storm surge propagation (Eqs 1, 2), wave generation and propagation (Eq. 3), and particle transport (Eq. 7). Tide and storm surge-driven water flows are governed by the 1D Saint-Venant equations (Tambroni and Seminara, 2012):
where h is the water flow depth (m), U is the water flow velocity (m s-1), H is the water surface elevation (m) relative to the mean sea level (MSL), g is the acceleration due to gravity (m1/2 s-1), and Cz is Chézy’s friction coefficient (m1/2 s-1). The friction coefficient Cz is a function of bed roughness, vegetation stem size, and vegetation density. Wave generation and propagation in shallow waters are described by the conservation of the wave action N, which is defined as the ratio of wave energy E (J m-2) to the relative wave frequency σ. By using the linear wave theory, the wave action conservation equation can be simplified as follows (Carniello et al., 2005):
The wave group celerity
where k is the wave number (
Both tide and storm surge-induced water flow and wind-induced waves contribute to the production of bottom shear stress τb, which is important for the modeling of sediment deposition and resuspension over the coastal landscape. As suggested by Soulsby (1997), the nonlinear interaction between these two forces can be evaluated using the below empirical formulation (Eq. 6):
where
where css is the depth-averaged suspended sediment concentration (SSC) (kg m-3), K is the dispersion coefficient (m2 s-1), and Qm is the net sediment deposition rate (kg m-2 s-1). The net sediment deposition is defined as sediment deposition minus sediment resuspension, and the long-term average of Qm equals to mineral accretion. For salinity and nutrients, it is assumed that their concentrations do not change during transport over the coastal landscape, and thus, the dynamics are directly controlled by inundation.
MACES-geomor implements seven widely used algorithms for mineral accretion (D’Alpaos et al., 2007; Fagherazzi et al., 2007; French, 2006; Kirwan and Mudd, 2012; Morris et al., 2012; Temmerman et al., 2003b; van de Koppel et al., 2005) and four algorithms for OM accretion (D’Alpaos et al., 2007; Kakeh et al., 2016; Kirwan and Mudd, 2012; Morris et al., 2012) (Table 1). Correspondingly, the change in transect elevation η (m) is calculated using the Exner equation (Eq. 8):
where λ is the sediment porosity, ρs is the sediment wet bulk density (kg m-3), and Qom is the OM accretion rate (kg m-2 s-1). The detailed descriptions of these eco-geomorphologic algorithms are given in Supplementary Material. It should be noted that for OM accretion, we included one more algorithm corresponding to the null hypothesis that OM accretion is negligible for the transect elevation change. Here, the algorithms of mineral and OM accretion were selected based on three criteria through a literature review. First, the selected algorithms must have been successfully applied in multiple studies (ideally for coastal wetlands under different environmental conditions). Second, the selected algorithms are substantially different from each other in mathematical formulations and conceptual understanding. Third, the selected algorithms can be implemented using 1D hydrodynamics. Table 1 provides all the MACES-geomor algorithms and their characteristics. The free parameters of the mineral and OM accretion algorithms are given in Supplementary Tables S1, S2, respectively.
We used a 1D Godunov-type central-upwind scheme (Kurganov and Levy, 2002) to discretize the spatial domain of the Saint-Venant equations, which include source terms due to bottom topography, the wave equation, and the particle transport equation. This finite volume scheme introduces a linear piecewise approximation to each grid cell with the superbee slope limiter (Roe, 1986) to achieve the solutions of both second-order accuracy in space and diminishing total variation. Because this scheme is very effective in suppressing spurious oscillation of the simulated water level in periodically flooded areas, it has been widely used as a numerical solver for coastal hydrodynamics (Liang and Marche, 2009). After spatial discretization, we used a fourth-order adaptive Runge–Kutta–Fehlberg method to discretize the hydrodynamic equations in the time domain to achieve second-order accuracy in time (Burden et al., 1978). In addition, to avoid negative particle concentrations, we incorporated a scheme described by Tan et al. (2015) into the Runge–Kutta–Fehlberg method to recursively curtail the running time step when large negative concentrations occur until the negative values are small enough to be assigned safely as zero.
One prominent feature of MACES is the use of a hybrid FORTRAN and Python programming approach to balance computational efficiency and software usability. The computational-intensive hydrodynamic module was written in FORTRAN and then converted to a Python package using f2py (Python Software Foundation, Fredericksburg, VA, United States). All the other modules, including eco-geomorphology, I/O, and settings, were written in Python 3 directly. As such, new algorithms for eco-geomorphology can be easily integrated into MACES in the future. Model input and output files are written in the NetCDF and Excel formats, and model settings are written in the user-friendly Extensible Markup Language (XML) format.
Model calibration of different MACES-geomor algorithms is conducted using the Python-version Parameter ESTimation tool (PyPEST). The PyPEST tool was developed by Liao et al. (2019) based on the model-independent parameter estimation code PEST (Doherty et al., 1994). PyPEST carries out the calibration process iteratively with six steps (parameter generation, model configuration, input data generation, model run in parallel, output extraction, and output post-processing) until the user-defined cost function threshold criteria are met (Supplementary Figure S1). It should be mentioned that only the parameters of MACES-geomor (Supplementary Tables S1, S2) are calibrated. For the parameters related to flow and waves (e.g., the reference Chézy’s friction coefficient and the dispersion coefficient), default values are used at all the sites. Depending on data availability at different sites, different combinations of observed datasets are used to calibrate different geomorphology module algorithms with the consideration of module dependency. For example, the observed long-term mineral accretion rate and SSC are used to calibrate the mineral accretion algorithms. The observed long-term OM accretion rates and aboveground biomass are used to calibrate the OM accretion algorithms.
MACES-hydro is validated against the observed or benchmark water level, significant wave height, and/or bottom shear stress without calibration. In the experiments to validate MACES-hydro, we configured the model with null mineral and OM accretion algorithms and chose the method proposed by Morris et al. (2012) to calculate the aboveground biomass. In the experiments to validate the simulated suspended sediment, we only compared mineral accretion algorithms and used only one OM accretion algorithm at each site that simulated the most realistic aboveground biomass. Because the related observations and benchmark estimates usually cover only a few days, the related validation is only run for a few weeks. For MACES-geomor, our analysis focuses on analyzing the uncertainty of mineral and OM accretion algorithms across the 1D wetland transects, which is important for explaining their divergent predictions in coastal wetland evolution under SLR (Tambroni and Seminara, 2012).
We evaluate the model at three representative coastal wetland sites, with two located in midlatitude and one located in the subtropics: Venice Lagoon, Plum Island Estuary, and Hunter Estuary (Table 2). Venice Lagoon is a microtidal wetland with a large central waterbody and extensive intertidal saltmarshes. The dominant saltmarsh species include Limonium serotinum, Puccinellia palustris, Arthrocnemum fruticosum, and Spartina maritima. The long-term mineral and OM accretion rates of the saltmarsh are 3.5 mm yr-1 and 132 gC m-2 yr-1, respectively (Bellucci et al., 2007; Roner et al., 2016). Plum Island Estuary is a macrotidal wetland with extensive areas of productive tidal marshes. The dominant saltmarsh species include Spartina alterniflora at lower elevations and Spartina patens at higher elevations. The long-term mineral accretion rate can be as high as 6.9 ± 0.9 mm yr-1 (Wilson et al., 2014), and the long-term OM accretion rate is 69.9 ± 9.4 gC m-2 yr-1 (Wang et al., 2019). Hunter Estuary is a microtidal wetland with gray mangrove (Avicennia marina) at lower elevations and a Sporobolus virginicus–Sarcocornia quinqueflora-mixed saltmarsh at higher elevations. The mineral accretion rates of mangroves and saltmarsh are 3.66 mm yr-1 and 3.37 mm yr-1, respectively (Howe et al., 2009). The OM accretion rates of mangroves and saltmarsh are 105 gC m-2 yr-1 and 137 gC m-2 yr-1, respectively (Howe et al., 2009).
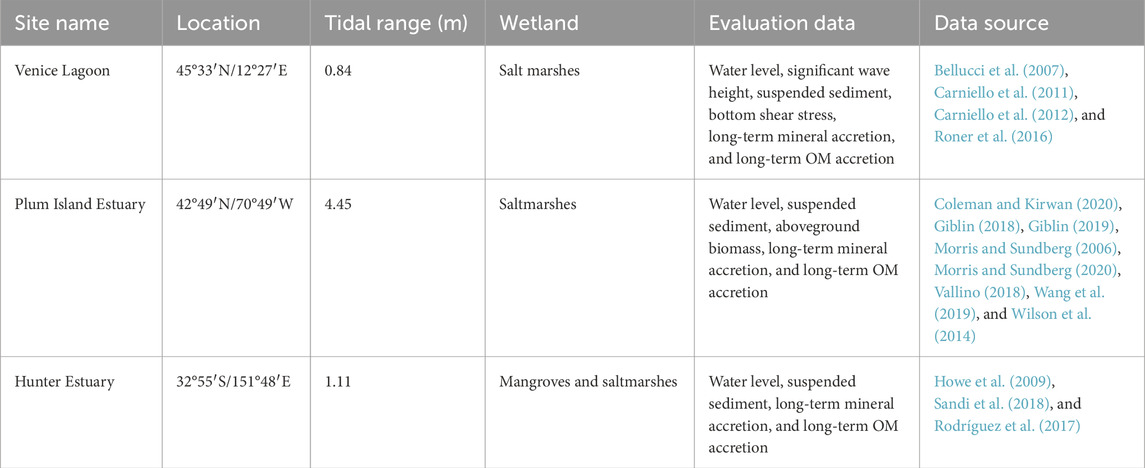
Table 2. Characteristics and observational data of the three coastal wetland sites.
For Venice Lagoon, we use the observed water level, SSC, and significant wave height and benchmark bottom shear stress estimates from a 2D hydrodynamic model called the wind wave tidal model (WWTM) (Carniello et al., 2011) at two tidal flat stations (1BF, 1.1 masl; 2BF, 2.1 masl) for model evaluation. For Plum Island Estuary, we use the observed water level at the channel (−0.73 masl) and marsh edge (1.25 masl) of Nelson Island, observed SSC at the channel (−1.45 masl) and marsh interior (1.69 masl) of Law’s Point, observed mineral accretion at three saltmarsh stations (LAC: a S. alterniflora-dominated high saltmarsh with an elevation of 1.1 masl; LPC: a S. patens-dominated high saltmarsh with an elevation of 1.4 masl; and MRS: a S. alterniflora-dominated high saltmarsh with an elevation of 0.89 masl), and observed aboveground biomass at LAC and MRS for model evaluation. For Hunter Estuary, we use the benchmark estimates of water level and SSC at four stations (channel: 0.22 mAHD; mangrove edge: 0.05 mAHD; mangrove interior: 0.38 mAHD; and saltmarsh edge: 0.65 mAHD) of the wetland for model evaluation. For a specific site, when validating our model over a station, we always choose the grid cell with the closest elevation to the station for comparison.
To simulate the hydrodynamics and eco-geomorphology of coastal wetlands, MACES is driven by the seaward-side water level, SSC, and averaged wind speed and air temperature over the coastal transect (Tan, 2023). We extracted the water level and wind conditions from high-frequency (10-min or 15-min) measurements for the three sites. The seaward boundary SSC was set based on the high-frequency (15-min) analytical estimates for Hunter Estuary and fixed values extracted from the global coastal Database for Impact and Vulnerability Analysis (DIVA) to sea level rise (Vafeidis et al., 2008; Schuerch et al., 2018) for the other two sites. The daily air temperature was extracted from measurements for Venice Lagoon and Plum Island Estuary and the European Center for Medium-Range Weather Forecasts (ECMWF) Interim Reanalysis (ERA-Interim) (Dee and Uppala, 2009) for Hunter Estuary.
For each site, we constructed its 1D transect from a high-resolution digital elevation model (DEM) and land cover maps (Hawker et al, 2022; Hopkinson and Valentine, 2005; Tambroni and Seminara, 2012; Ye and Pontius, 2016; Rodríguez et al., 2017) by 1) dividing all grid cells into 17 elevation groups spanning from −12.5 m to 16.5 m (some elevation groups can be empty); 2) calculating the average slope and land cover fractions of each elevation group; and 3) calculating the transect length of each elevation group based on its slope and elevation range. For the first step, the elevation range of the 17 groups is the largest (i.e., 4 m) near the land and sea edges and the smallest (i.e., 0.5 m) near the sea level. For the third step, the slope of a grid cell is calculated by dividing its elevation by its distance to the nearest channel network. The constructed 1D transects of the three sites are shown in Figure 2.
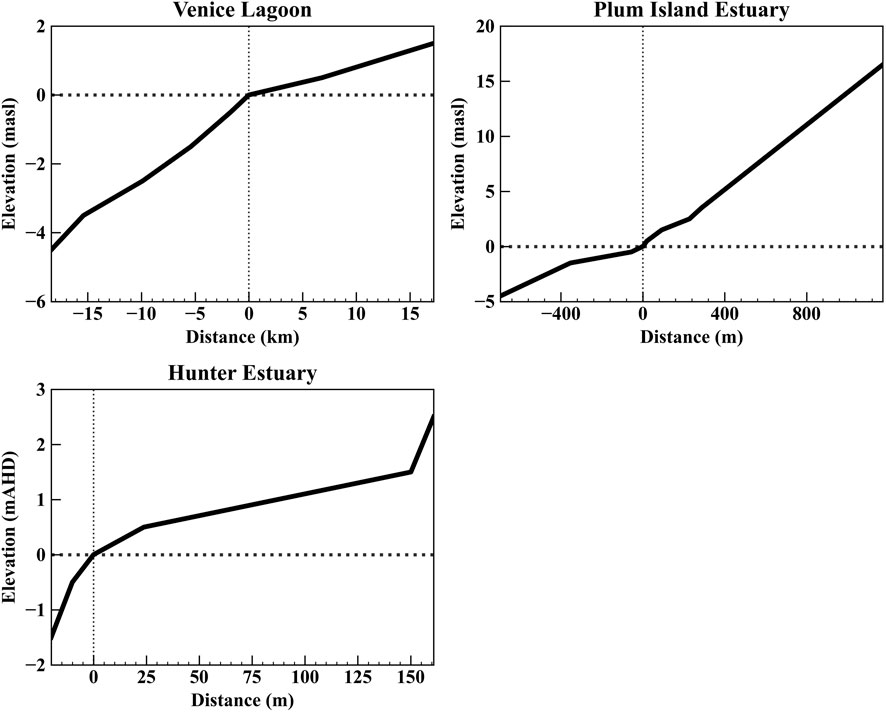
Figure 2. Elevation of 1D MACES transects (solid lines) for Venice Lagoon, Plum Island Estuary, and Hunter Estuary. Horizontal dashed lines represent sea levels, and vertical dashed lines represent the ocean edge of the coastal wetland.
The MACES model can reproduce the observed hydrodynamics at the three coastal wetland sites. The simulated hydrodynamics at Venice Lagoon were validated into two periods of very different tide and wind conditions: 12/10/2002–12/11/2002 and 4/2/2003–4/4/2003 (Figure 3). Specifically, the spring period in 2003 had a high tide of 64 cm asl and a maximum wind speed of 17.3 m s-1 (Supplementary Figure S3). In contrast, the winter period in 2002 had a much smaller high tide and maximum wind speed of only 38 cm asl and 11.6 m s-1, respectively (Supplementary Figure S3). The 1D MACES-hydro performs reasonably well in capturing the observed tide and wave dynamics in both periods (Figure 3), with low root mean square errors (RMSEs) of simulated water depth and significant wave height at the 1BF and 2BF stations. During the low-wind and tide period when observations are available (Figures 3A–D), the RMSEs of the simulated water depth at 1BF and 2BF are 5.8 cm and 4.2 cm, respectively, which correspond to only 5% and 2% of the observed mean water depth, and the RMSEs of the simulated significant wave height at 1BF and 2BF are 4.7 cm and 4.6 cm, respectively, which correspond to 35% and 19% of the observed mean significant wave height. The error in simulating the significant wave height at 1BF is higher than that at 2BF. Particularly, the MACES-hydro substantially overestimates the significant wave height at 1BF on 10 December 2002. This is probably because 1BF is a shallower and more inland station with denser vegetation covers, and our model has large uncertainties in representing the effect of vegetation on wave damping. Despite the larger error, given the reduced wave energy at 1BF, the error of simulating the bottom shear stress did not increase significantly. As shown in Figures 3K,L, the model captures the temporal variability of the bottom shear stress benchmark at 1BF and 2BF during the high-tide and wind periods, with RMSE values of 0.13 Pa and 0.15 Pa, respectively. However, it should be mentioned that as the simulated bottom shear stress is compared to the WWTM benchmark instead of observations, the evaluation could be marked by substantial uncertainty.
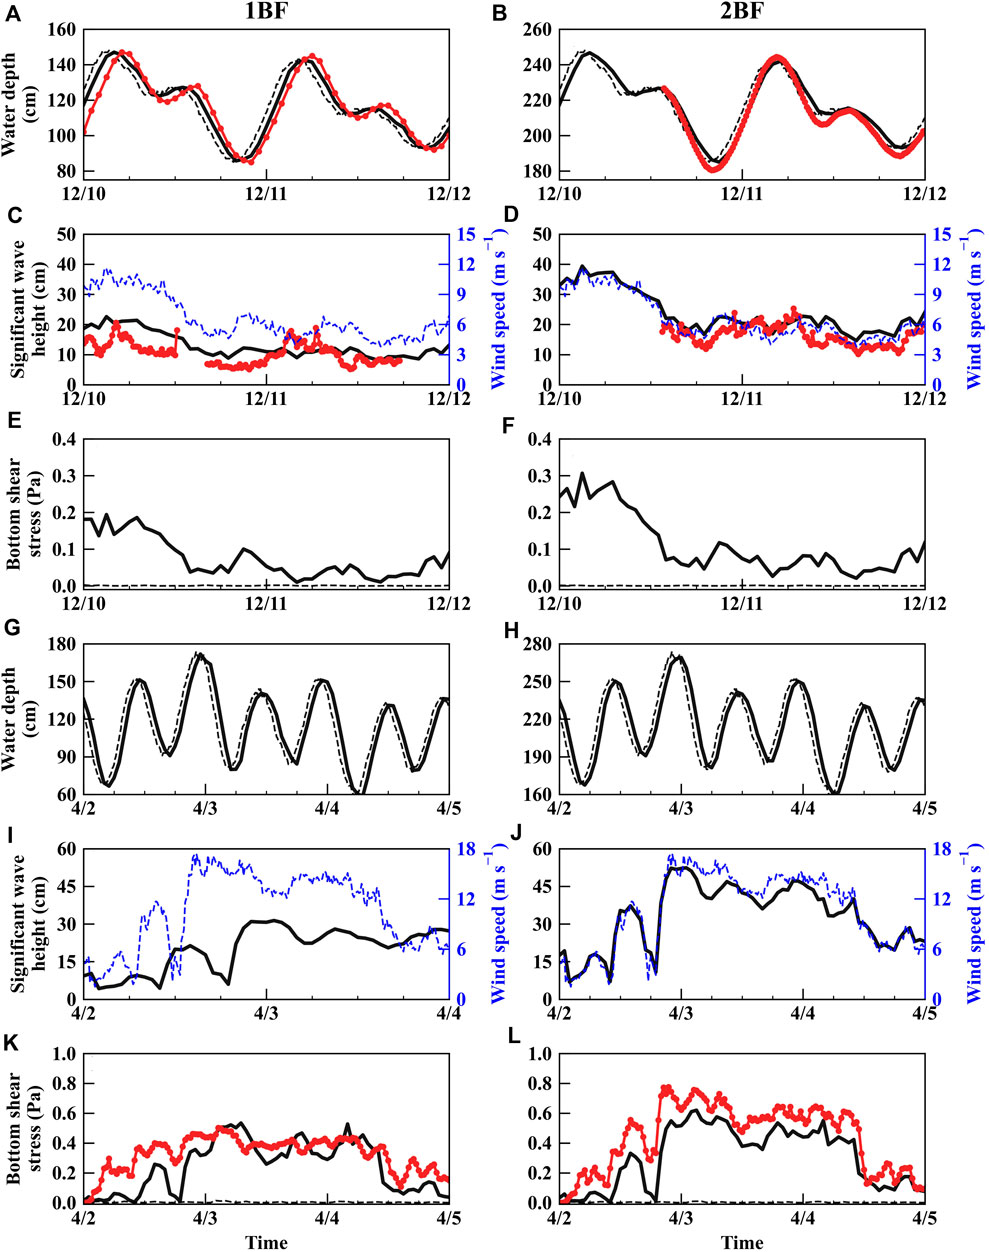
Figure 3. Dynamics of the simulated (black solid line) and observed or benchmark (red solid line with dots) water level, significant wave height, and bottom shear stress at the two stations (1BF and 2BF) of Venice Lagoon during two time periods: 12/10/2002–12/11/2002 and 4/2/2003–4/4/2003. Black dashed lines in (A), (B), (G), and (H) represent the estimated water depth at the two stations by assuming that the water level is spatially uniform across the transect. Blue dashed lines in (C), (D), (I), and (J) represent the measured wind speed. Black dashed lines in (E), (F), (K), and (L) represent the simulated current-induced bottom shear stress.
For both periods, the simulated significant wave height mainly followed the wind dynamics (Figure 3). The wind-induced bottom shear stress is also the dominant component of the total bottom shear stress (Figure 4). On the morning of 12/10/2002, when wind speed exceeded 11 m s-1, the simulated significant wave height reached its peak value at the two stations: 22.6 cm and 39.4 cm, respectively. Correspondingly, the simulated bottom shear stress also reached its peak value at the two stations, i.e., 0.19 and 0.31 Pa, respectively. On 3 April 2003, when wind speed frequently exceeded 15 m s-1, the simulated significant wave height reached its peak value at the two stations, i.e., 31.4 and 52.4 cm, respectively. The contribution of the current-induced bottom shear stress to the total bottom shear stress never exceeded 10% in both periods (Figures 3E,F, I–K), showing that wind action dominates the generation of bottom shear stress. Both the observations and simulations show that 2BF has larger, more significant wave height values than 1BF. This difference could be explained by the attenuation of wave energy by friction when the wave moves toward land as 2BF is deeper and closer to the seaward boundary than 1BF.
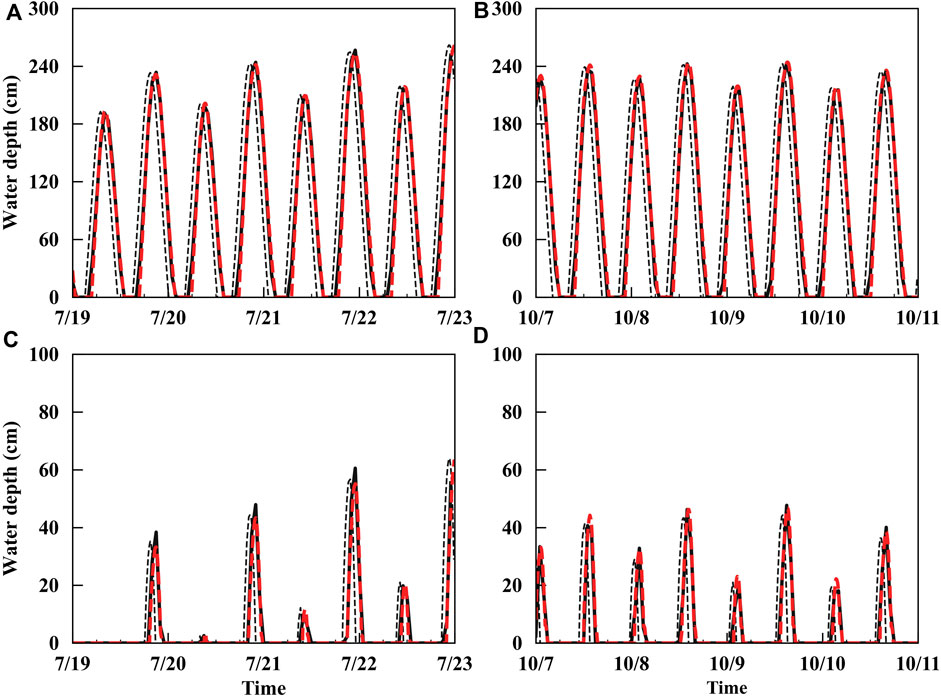
Figure 4. Comparison of the simulated (black solid line) and observed (red dashed line) water depth at the channel station at an elevation of −1.45 masl (A,B) and the Spartina-dominated saltmarsh station at an elevation of 1.69 masl (C,D) in Plum Island Estuary during two time periods: 7/19/2017–7/22/2017 and 10/7/2017–10/10/2017. Black dashed lines represent the estimated water depth at the two stations by assuming that the water level is spatially uniform across the transect.
The simulated hydrodynamics at Plum Island Estuary were validated in the summer and fall periods of 2017 (7/19–7/22 and 10/7–10/10, respectively) when tide and wind conditions were different (Figure 4). In the summer period, the tide level varied substantially, while the wind speed never exceeded 6 m s-1 (Supplementary Figure S4). In contrast, in the fall period, the wind speed sometimes exceeded 8 m s-1, while the tide level varied moderately (Supplementary Figure S4). For both periods, MACES-hydro captures the observed dynamics of the water depth at a river channel station (−0.73 masl) and a saltmarsh station (1.25 masl) reasonably well (Figure 4). The RMSE values of the simulated water depth at the river channel station were 9.1 cm and 7.5 cm for the summer and fall periods, respectively. The RMSE values of the simulated water depth at the saltmarsh station were 2.2 and 1.5 cm for the summer and fall periods, respectively.
The simulated hydrodynamics at Hunter Estuary were validated in the period of 9/28/2004–9/30/2004 for both low-elevation locations where mangrove species reside and high-elevation locations where saltmarsh species reside (Figure 5). MACES-hydro well reproduced the water depth benchmark at four representative locations: the river channel station (Figure 5A), the mangrove-dominated station (Figure 5B), the mangrove-dominated interior station (Figure 5C), and the saltmarsh-dominated station (Figure 5D). The RMSE values of the simulated water depth at the four stations were 4.6 cm, 5.4 cm, 2.7 cm, and 0.4 cm, respectively.
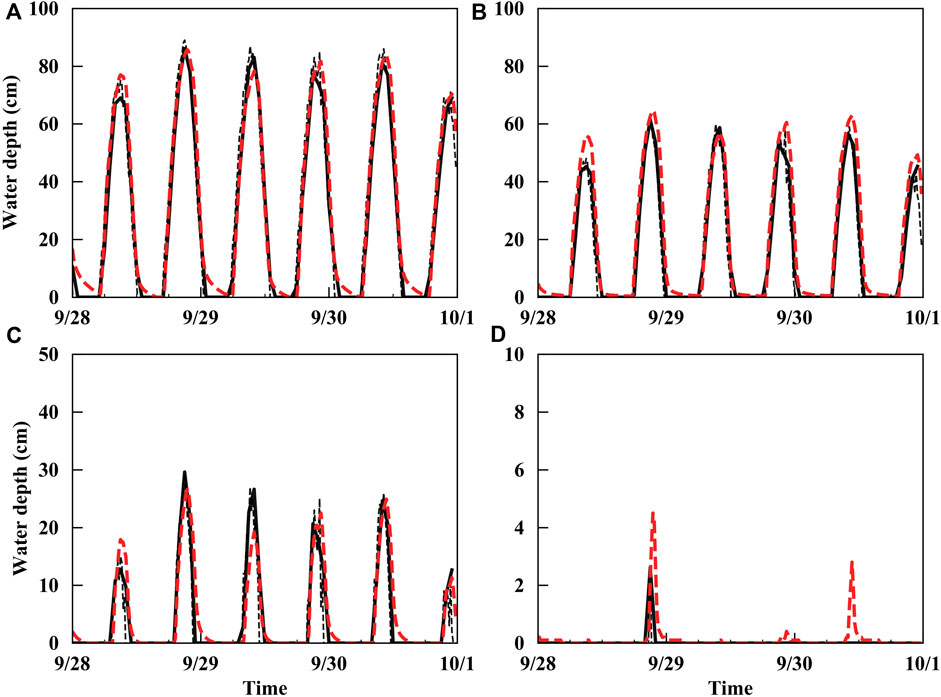
Figure 5. Comparison of the simulated (black solid line) and benchmark (red dashed line) water depth at the channel station at an elevation of −0.22 mAHD (A), the mangrove edge station at an elevation of 0.05 mAHD (B), the mangrove interior station at an elevation of 0.38 mAHD (C), and the saltmarsh edge station at an elevation of 0.65 mAHD (D) of Hunter Estuary during 9/28/2004–9/30/2004. Black dashed lines represent the estimated water depth at these stations by assuming that the water level is spatially uniform across the transect.
Importantly, as shown by our simulations, the water level across a coastal wetland transect is far from being spatially uniform if the seaward boundary is not extremely close to the shoreline. For instance, at Venice Lagoon and Plum Island Estuary, where the distance from the seaward boundary to the shoreline is more than 18 km and 0.7 km, respectively, the water level peaks in the wetland interiors clearly lagged those at the boundary (Figures 3, 4), showing the effect of bed roughness on water flow. In contrast, at Hunter Estuary, where the seaward boundary is very close to the shoreline (only 20 m in distance), the difference between the simulated water level and the boundary condition is negligible (Figure 5).
The MACES model can capture the dynamics of the suspended sediment at the three coastal wetland sites when appropriate mineral accretion algorithms are selected. For Venice Lagoon, the observed SSC at 1BF during the low-wind and tide period ranged from 7.3 to 92.0 mg L-1 (Figure 6), with one larger peak value occurring on the windy morning of 12/10/2002 and one smaller peak value occurring on the morning of 12/11/2002 (Figure 3). Three out of the seven mineral accretion algorithms, including M12, F07, and DA07, can reproduce the observed two SSC peaks (Figure 6). Among the algorithms, the F07 algorithm has the lowest RMSE of 12.0 mg l-1 and the lowest normalized RMSE (NRMSE) of 0.45. However, even the three best-performing algorithms overestimated the SSC at mid-day on 12/10/2002. A possible reason is that the model does not reproduce the rapid decrease in wave energy after the windy morning on 12/10/2002. The simulated SSC by F06, T03, and KM12 is almost constant because these algorithms do not represent sediment resuspension (Supplementary Material S1), and there is limited sediment deposition at 1BF. As a result, the SSC is almost entirely determined by the seaward boundary (9.4 mg L-1), which was extracted from DIVA. It should be noted that the dynamics of the suspended sediment in the coast are notoriously difficult to model (Temmerman et al., 2003; Le Hir et al., 2007). Thus, the performance achieved by our 1D model is satisfactory.
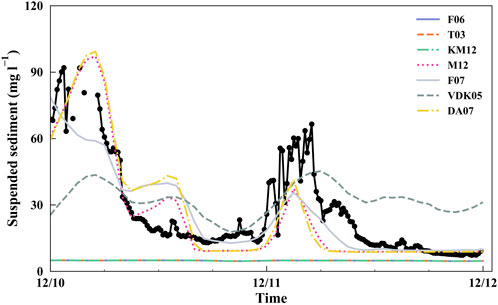
Figure 6. Comparison of the observed column-integrated suspended sediment concentration (black) with the suspended sediment concentration simulated by seven mineral accretion algorithms at the 1BF station of Venice Lagoon during 12/10/2002–12/11/2002.
For Plum Island Estuary, the MACES model reproduces the temporal variability in the SSC at the river channel station and the decrease in SSC from the river channel to the saltmarsh station in the summer period of 2017 reasonably well (Figure 7). Because the river channel station is close to the model boundary (Figure 2), its suspended sediment dynamics are strongly regulated by the SSC boundary condition (Supplementary Figure S4), and the difference between different algorithms is mainly caused by the simulated sediment deposition rather than the simulated sediment resuspension. Among the algorithms, the M12 algorithm has the lowest RMSE of 7.4 mg l-1 and the lowest NRMSE of 0.57 at the river channel station. There are several SSC peaks at the river channel that our model fails to capture (Figure 7), which could be attributed to the uncertainty in the boundary condition. For the saltmarsh station, the performance of different algorithms is similar, implying that all the algorithms predicted reasonable sediment deposition over the saltmarsh platform.
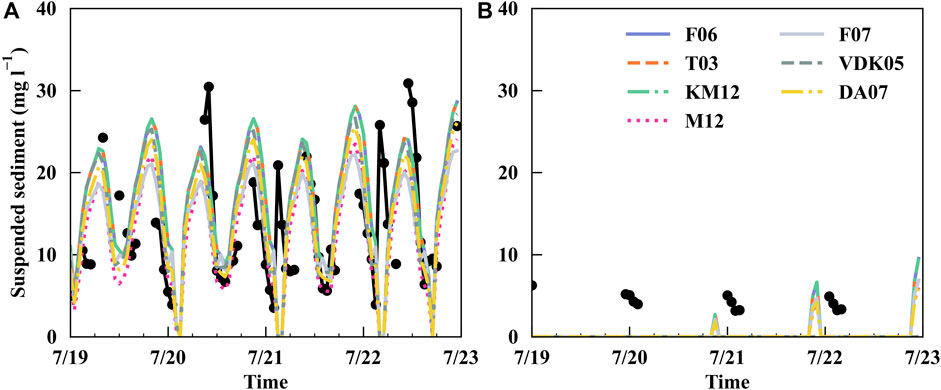
Figure 7. Comparison of the observed column-integrated suspended sediment concentration (black) with the suspended sediment concentration simulated by seven mineral accretion algorithms at the channel station at an elevation of −1.45 masl (A) and the Spartina-dominated saltmarsh station at an elevation of 1.69 masl (B) in Plum Island Estuary during the period of 7/19/2017–7/22/2017.
The MACES model also captures the temporal variability in the SSC along the elevation gradient of Hunter Estuary, spanning from the river channel, through the mangrove edge and interior, to the saltmarsh edge (Figure 8). Because the river channel station, in this case, is even closer to the model boundary than in Plum Island Estuary (Figure 2), the dynamics of the suspended sediment are strongly regulated by the boundary condition (Supplementary Figure S5) before being fully deposited at the saltmarsh edge. The four more complex algorithms, namely, M12, F07, VDK05, and DA07, outperform the three simpler algorithms (i.e., F06, T03, and KM12). Overall, the M12 algorithm has the best performance at the four stations: an RMSE of 1.6 mg L-1 at the river channel, 0.9 mg L-1 at the mangrove edge, 2.8 mg L-1 at the mangrove interior, and 0.4 mg L-1 at the saltmarsh edge (we removed data points in the comparison when the simulated water depth was zero). These algorithms seem to underestimate the sediment deposition in the mangrove wetland area. Possibly, the mineral accretion algorithms we incorporated in the model were mostly developed for saltmarshes; thus, they are less applicable to mangrove wetlands.
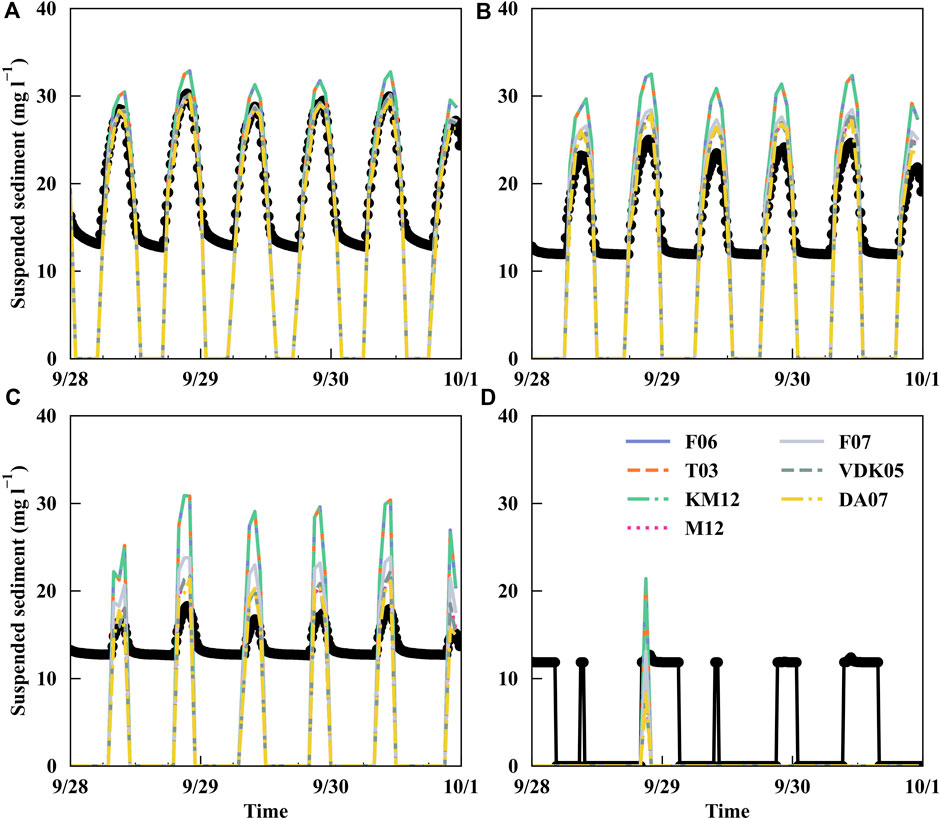
Figure 8. Comparison of the benchmark column-integrated suspended sediment concentration (black) with the suspended sediment concentration simulated by seven mineral accretion algorithms at the channel station at an elevation of −0.22 mAHD (A), the mangrove edge station at an elevation of 0.05 mAHD (B), the mangrove interior station at an elevation of 0.38 mAHD (C), and the saltmarsh edge station at an elevation of 0.65 mAHD (D) in Hunter Estuary during 9/28/2004–9/30/2004.
By calibration, most of the MACES mineral and OM accretion algorithms can reproduce the observed long-term mineral and OM accretion rates at the three coastal wetland sites, especially when the accretion rates are only measured at single locations. However, different algorithms demonstrate remarkable variations in the simulated mineral and OM accretion along the elevation gradient. Moreover, our ensemble simulations show that the variations in the simulated mineral and OM accretion along the elevation gradient differ substantially among the coastal wetland sites.
For Venice Lagoon, all seven mineral accretion and four OM accretion algorithms can predict the observed long-term mineral accretion rate of 3.54 mm yr-1 and the observed long-term OM accretion rate of 132 gC m-2 yr-1 at the observation station that is approximately 0.2 km from the marsh shore edge (Figure 9). Good model performance does not depend on which OM or mineral accretion algorithm is combined. For example, the F06 mineral accretion algorithm, when combined with the M12 OM accretion algorithm, performs comparably to that combined with the DA07 OM accretion algorithm. Despite the convergence of different algorithms at the observation station, the simulated summer aboveground biomass, OM accretion, and mineral accretion along the elevation gradient differ substantially among the algorithms (Figure 9). For the summer aboveground biomass at the saltmarsh, the M12 algorithm predicts an increasing trend with elevation, while the other three algorithms predict slight decreases (Figure 9A). Furthermore, the marsh aboveground biomass simulated by M12 is much higher than that simulated by the other algorithms (Figure 9A), even though the estimates are all within the reported range of 1–3 kg m-2 (Tambroni and Seminara, 2012). Driven by the change in aboveground biomass, the M12 algorithm predicts an increase in OM accretion with elevation, while the DA07 and K16 algorithms predict a decrease (Figure 9B). However, KM12 predicts an increase in OM accretion with elevation despite the decrease in simulated aboveground biomass. It is because KM12 simulates a much larger increase in the root:shoot quotient along the elevation gradient. For mineral accretion, the F06 and KM12 algorithms predict a moderate increase with elevation, the F07 and VDK05 algorithms predict a moderate decrease, and the other algorithms predict a rapid decrease (Figure 9C). As a result, the simulated mineral accretion differs remarkably at both the marsh shore edge and the marsh–upland interface. For example, at the saltmarsh edge, the estimate by T03 is over 6 mm yr-1, but that by F06 is less than 4 mm yr-1. In contrast, at 1.5 km to the edge, the estimate by T03 falls close to zero, but that by F06 is over 4 mm yr-1. Importantly, our model can provide a multi-algorithm ensemble estimate of mineral and OM accretion over the saltmarsh, which shows that the total accretion gradually decreases along the elevation gradient with the importance of OM accretion moderately increasing (Figure 9D). However, mineral accretion is almost always the dominant source over the saltmarsh platform, which is a more robust signal detected by our multi-algorithm approach.
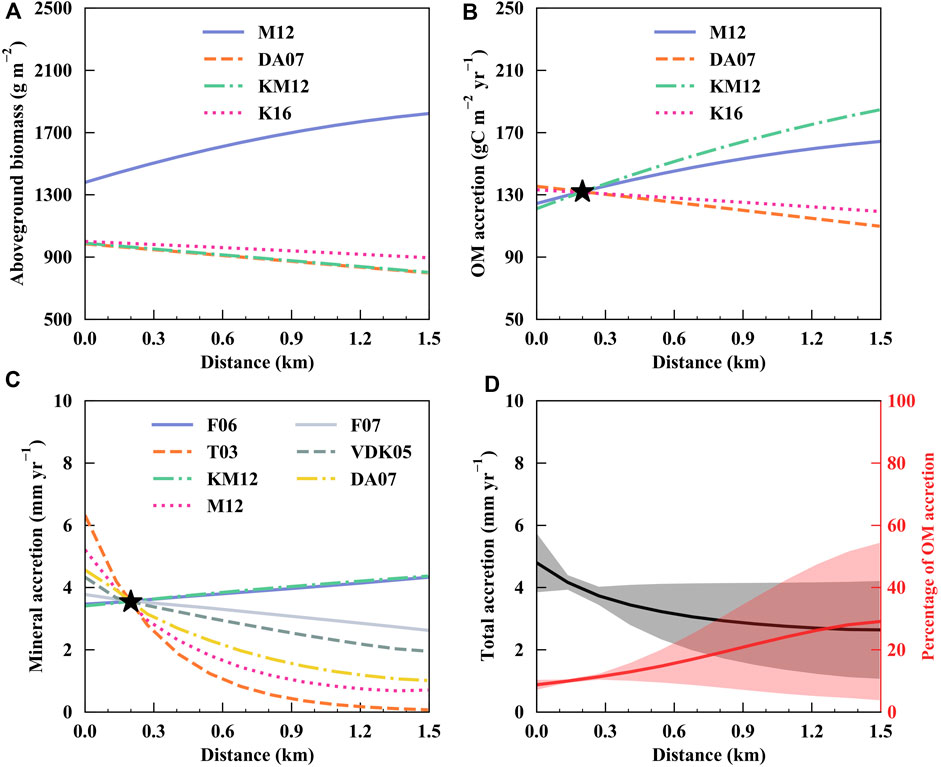
Figure 9. Comparison of the simulated mean aboveground biomass in July 2002 by four MACES algorithms (A), comparison of the simulated long-term OM accretion by four MACES algorithms (B), comparison of the simulated long-term mineral accretion by seven MACES algorithms (C), and the mean (solid line) and standard deviation (shared area) of the simulated long-term total accretion and the contribution of OM accretion to total accretion (D) over the saltmarsh of Venice Lagoon. Black stars in (B) and (C) represent the observed long-term OM and mineral accretion, respectively.
For Plum Island Estuary, compared with more spatiotemporally resolved validation data, some mineral and OM accretion algorithms show better performance than others. For instance, while all the OM accretion algorithms provide satisfactory simulations of the summer aboveground biomass distribution along the elevation gradient, M12 seems to capture the higher saltmarsh biomass at the edge more reasonably (Figure 10A). In addition, the DA07 and KM12 algorithms can simulate the seasonality of the saltmarsh biomass at the high-marsh station LAC (1.1 masl), while the M12 and K16 algorithms cannot simulate any seasonality (Figure 10C). All the OM accretion algorithms successfully predict the observed long-term OM accretion rate (69.9 ± 9.4 gC m-2 yr-1) within the elevation range of 0–1.5 masl (Supplementary Figure S4). Furthermore, we find that all the mineral accretion algorithms except F06 and KM12 can reproduce the observed long-term mineral accretion rates at the S. alterniflora-dominated low marsh station MRS (6.9 ± 0.9 mm yr-1), the S. alterniflora-dominated high-saltmarsh station LAC (5.3 ± 0.1 mm yr-1), and the S. patens-dominated high-saltmarsh station LPC (2.3 ± 0.1 mm yr-1) (Figure 11D), which shows the decrease in mineral accretion along the elevation gradient. It implies that the use of F06 and KM12 at Plum Island Estuary may lead to biased predictions of the resilience of the saltmarsh to SLR. As in Venice Lagoon, the multi-algorithm ensemble estimate indicates that the total accretion gradually decreases along the elevation gradient with the importance of OM accretion increasing (Figure 10E). However, different from Venice Lagoon, OM accretion can dominate the total accretion in some high-marsh areas of Plum Island Estuary. This is possibly because the platform of Plum Island Estuary has a much larger elevation gradient than that of Venice Lagoon (Figure 2), which impairs the landward transport of suspended sediment.
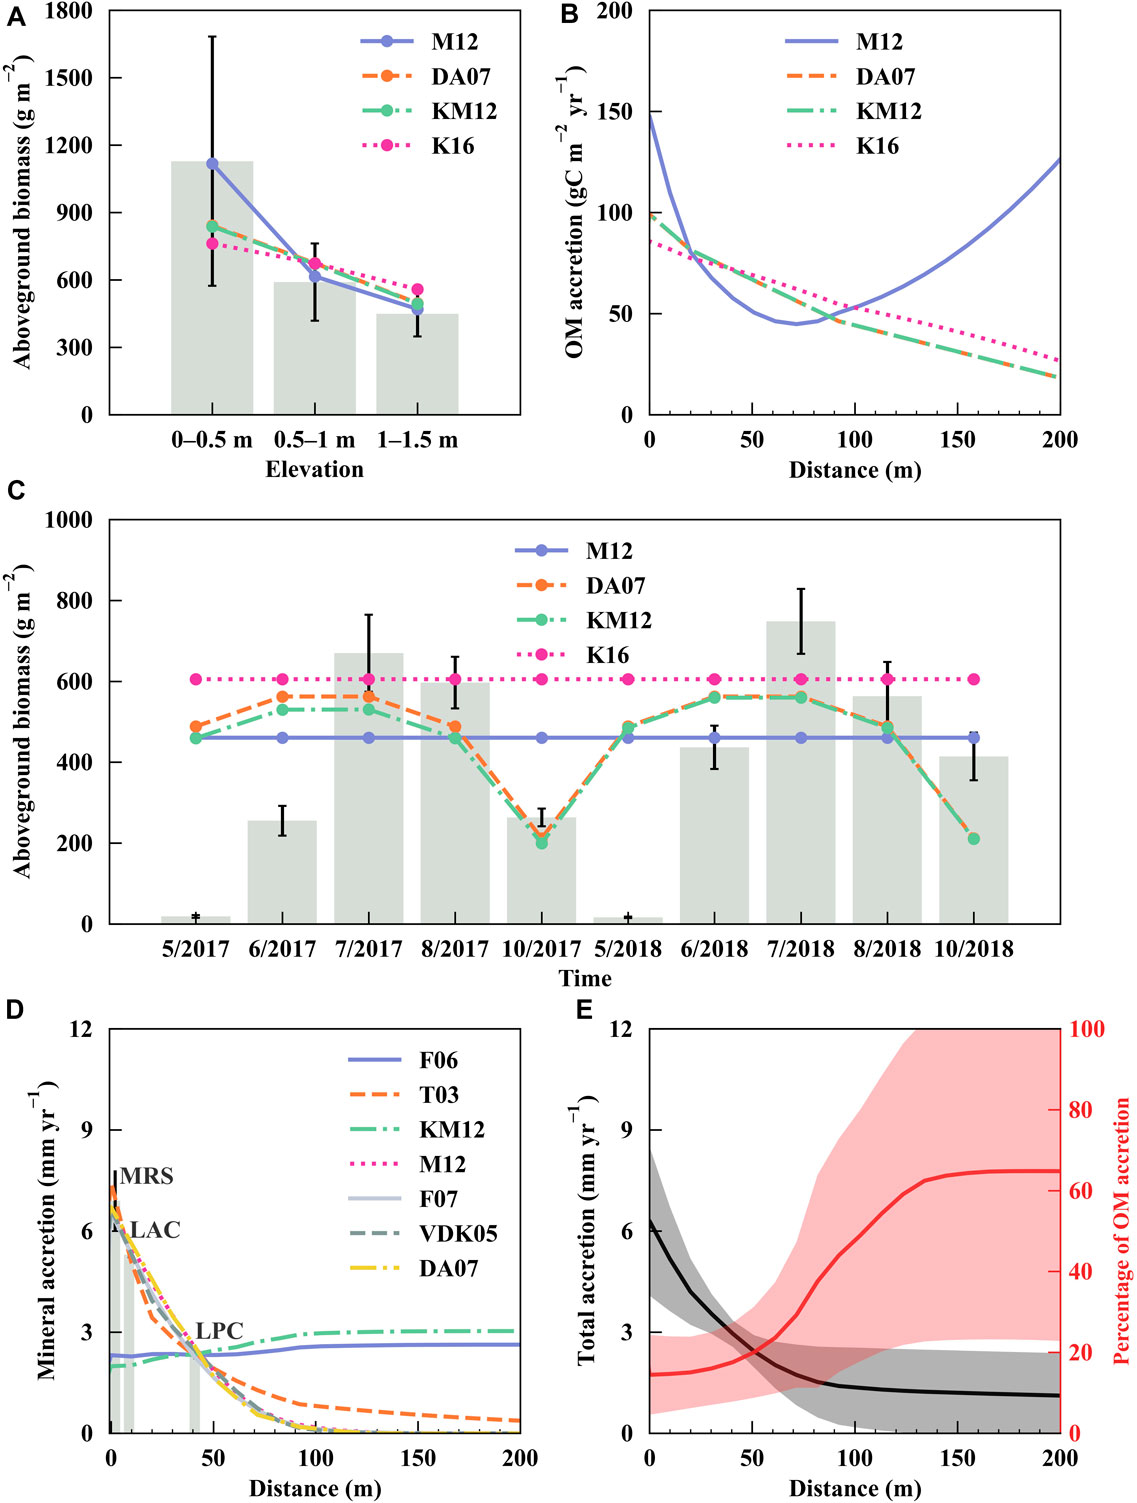
Figure 10. Comparison of the simulated aboveground biomass in July 2018 at three elevation zones by four MACES algorithms (A), comparison of the simulated long-term OM accretion by four MACES algorithms (B), comparison of the simulated monthly mean aboveground biomass during 2017–2018 at the LAC station by four MACES algorithms (C), comparison of the simulated long-term mineral accretion by seven MACES algorithms (D), and the mean (solid line) and standard deviation (shared area) of the simulated long-term total accretion and the contribution of OM accretion to total accretion (E) over the Plum Island wetland. Gray bars in (A), (C), and (D) represent the mean and standard deviation of the observed summer aboveground biomass, monthly mean aboveground biomass, and long-term mineral accretion, respectively.
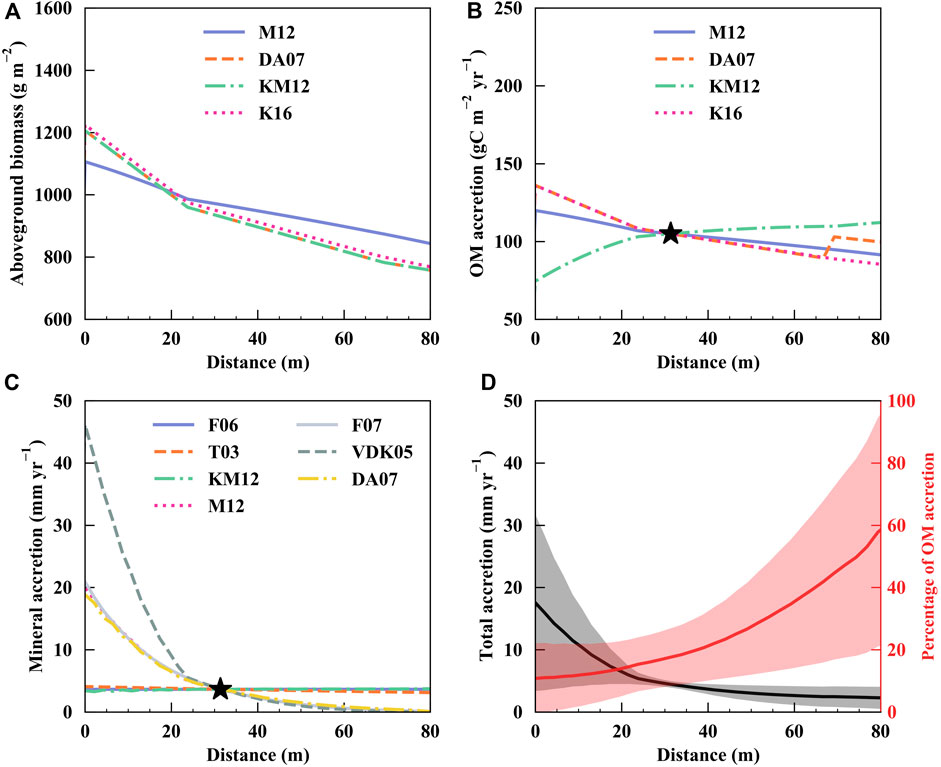
Figure 11. Comparison of the simulated mean aboveground biomass in July 2004 by four MACES algorithms (A), comparison of the simulated long-term OM accretion by four MACES algorithms (B), comparison of the simulated long-term mineral accretion by seven MACES algorithms (C), and the mean (solid line) and standard deviation (shared area) of the simulated long-term total accretion and the contribution of OM accretion to the total accretion (D) over the Hunter Estuary wetland. Black stars in (B) and (C) represent the observed long-term OM and mineral accretion at the mangrove-dominated station with an elevation of 0.56 mAHD, respectively.
For Hunter Estuary, different mineral and OM accretion algorithms can also reproduce the observed long-term mineral accretion rate (3.66 mm yr-1) and OM accretion rate (105 gC m-2 yr-1) at the mangrove-dominated station (0.56 mAHD) after calibration (Figure 11). All four OM accretion algorithms predict the decrease in aboveground biomass along the elevation gradient and from the mangrove-dominated area at low elevations to the saltmarsh-dominated area at high elevations (Figure 11A). The simulated aboveground biomass is consistent with the reported values of 1,000 and 900 g m-2 for mangrove and saltmarsh, respectively (Rodríguez et al., 2017). Driven by aboveground biomass, the simulated OM accretion by M12, DA07, and K16 decreases along the elevation gradient (Figure 11B). The simulated OM accretion by KM12 increases with elevation despite the negative relationship between aboveground biomass and elevation. As discussed for Venice Lagoon, it is caused by a much larger increase in the root:shoot quotient along the elevation gradient parameterized in KM12. The discontinuity of the simulated OM accretion at the mangrove–saltmarsh boundary by DA07 is because the root:shoot quotient of saltmarsh species in the DA07 is set to be higher than that of mangrove species (Kakeh et al., 2016), but these quotient ratios may also vary depending on the hydrodynamic conditions and salinity gradient (Sandi et al., 2021). In Hunter Estuary, the simulated mineral accretion on the platform shows two spatial patterns: the nearly constant rate by the F06, T03, and KM12 algorithms and the decreasing rate by other algorithms (Figure 11C). Notably, in the latter group, the simulated mineral accretion rate at the wetland shore edge is well above 10 mm yr-1, which is much higher than that at Venice Lagoon and Plum Island Estuary, but the variation in accretion across the section follows a similar general pattern as observed in other recent eco-geomorphic simulations in Hunter Estuary, which used a simplified 2D domain (Breda et al., 2021). The multi-algorithm ensemble estimates show that mineral accretion dominates the total accretion in all areas of the platform except the area close to the wetland–upland boundary (Figure 11D). As explained for Plum Island Estuary, it is mainly because the large platform slope at Hunter Estuary impairs the landward transport of the suspended sediment (Figure 2).
It is not surprising that significant algorithm-level uncertainties exist in the modeled eco-geomorphology at the three coastal wetland sites. However, our study shows that a multi-algorithm ensemble simulation approach may provide more robust signals about the evolution of coastal wetlands in different environments and, thus, help reduce the prediction uncertainty. For example, the multi-algorithm ensembles reveal that it is critical to represent OM accretion in the coastal wetland eco-geomorphology models to realistically predict coastal wetland resilience under future SLR. This is because while OM accretion may only account for 10% of the total accretion at low-elevation saltmarshes or mangroves, its contribution to the higher-elevation areas is much larger and even surpasses the contribution of mineral accretion. As a result, ignoring OM accretion would cause a significant underestimation of coastal wetland survival (Lorenzo-Trueba et al., 2012; Morris et al., 2016; Mariotti et al., 2020; Keogh et al., 2021).
To reduce the algorithm-level uncertainty in the simulation of coastal wetland evolution, it is also important to constrain mineral and OM accretion algorithms using observations from at least two locations at different elevations of a coastal wetland site. For example, if mineral accretion was only observed at the S. patens-dominated high-saltmarsh station LPC and the F06 or KM12 algorithm was chosen for modeling, the prediction of the resilience of coastal wetlands to SLR would be severely biased. Thus, new observations should be prioritized to capture the elevation and vegetation gradients of mineral and OM accretion. Although we focus on the model structural uncertainty and, thus, carefully calibrate the model parameters for each algorithm in this study, the use of multi-location observations at different elevations can also help reduce the parameter uncertainty of eco-geomorphology modeling. For instance, for Plum Island Estuary, if only the LPC station is benchmarked, even those good algorithms (i.e., T03, M12, F07, VDK05, and DA07), albeit reproducing the decrease in mineral accretion with elevation, would produce widespread estimates of mineral accretion at the low-marsh station MRS.
Although the existence of substantial algorithm-level uncertainties in coastal wetland eco-geomorphology models is expected, due to the variations in coastal wetland characteristics, such as tidal range, SSC, topography, and vegetation species, they cannot be fully learned by analyzing the mathematical formulations alone. Instead, these uncertainties must be carefully evaluated using a multi-algorithm approach like MACES. For example, as the mineral accretion algorithms F06 and KM12 use spatially constant SSC to derive sediment deposition, it would be expected that the estimated mineral accretion by these two algorithms is uniform over coastal wetland platforms. However, as simulated bottom shear stress decreases with water depth along the elevation gradient, the simulated force to resuspend the sediment decreases in higher-elevation wetlands, and correspondingly, sediment deposition is simulated to increase along the elevation gradient. Furthermore, this effect varies among the coastal wetland sites due to the differences in tidal range, topography, and vegetation species (Figures 9–11). Similarly, while it is expected that the simulated mineral accretion by M12, F07, VDK05, and DA07 would decrease with elevation because the modeled SSC in the interior areas decreases due to deposition, and sediment resuspension is weak over the vegetated platform, it is still difficult to discern which algorithm simulates the strongest decreasing effect without testing the algorithms in a united hydrodynamics model.
Coastal wetlands are an important type of ecosystem spanning broad geographic regions, from tropical and subtropical mangroves and mid-latitude saltmarshes to arctic coastal tundra (Keddy, 2000). Through the application of a multi-algorithm model framework developed in this study, we show that the uncertainties in coastal wetland eco-geomorphology models should be evaluated for coastal wetlands in diverse environments. Previous studies that rely on the knowledge of a single type of coastal wetlands for the prediction of large-scale coastal wetland responses to SLR may lead to unreliable conclusions. For example, while Venice Lagoon and Plum Island Estuary are both saltmarshes, due to the difference in environments, substantial distinctions exist between the simulated mineral and OM accretion at the two sites, including the much more important role of OM accretion in the rise of the saltmarsh bed against SLR at Plum Island Estuary. Correspondingly, a multi-algorithm approach that includes diverse eco-geomorphology algorithms can be more capable of predicting large-scale coastal wetland evolution. As demonstrated in the study, MACES includes the mineral and OM accretion algorithms that can be applied to the most common plant species of coastal wetlands (Day Jr et al., 1999; Morris et al., 2002; Temmerman et al., 2003b; Mudd et al., 2004; Kirwan and Mudd, 2012; Crase et al., 2013; Liu et al., 2020): S. alterniflora, S. patens, P. palustris, S. maritima, and A. marina. Particularly, very few eco-geomorphology modeling studies have included both saltmarsh and mangrove. These algorithms can also be applied to different tidal ranges (microtidal and macrotidal) and climates (Mediterranean climate, humid continental climate, and humid subtropical climate).
As the algorithm-level uncertainties in eco-geomorphology models are site-dependent, this multi-algorithm model framework can also be used to select appropriate eco-geomorphology algorithms for specific coastal wetland environment. For example, our simulation indicates that it is better to avoid the use of F06 and KM12 to predict the evolution of coastal wetlands in an environment like Plum Island Estuary, but these two mineral accretion algorithms can still be useful for coastal wetlands like Venice Lagoon. To extend this algorithm selection strategy to the global scale, it would need related observations across diverse environments. Currently, many published datasets of mineral and OM accretion from coastal wetlands across broad regions exist (Chmura et al., 2003; Breithaupt et al., 2012; Lovelock et al., 2015; Crosby et al., 2016; Parkinson et al., 2017). The next step would be to identify and survey geographic and ecological factors that are crucial for the classification of coastal wetlands. Nevertheless, the development of this multi-algorithm coastal wetland eco-geomorphology model will facilitate the reduction of algorithm-level uncertainties in global applications.
We chose to model coastal wetland eco-geomorphology on a simplified 1D coastal transect for several reasons: 1) higher computational efficiency; 2) consistency with large-scale land surface models; and 3) the easy representation of suspended sediment dynamics (Ward et al., 2020; Feng et al., 2022; Tan et al., 2022). However, this simplification implies that the MACES model cannot resolve the detailed spatial heterogeneity of coastal wetland dynamics that are needed for decision-making and damage mitigation. For instance, while the model can assess the overall wetland vulnerability under SLR, it cannot be used to locate specific areas for remedy as other more sophisticated models did (Deltares, 2022). Additionally, because the simulated variables are not linked to specific locations, the impact of SLR and other climate extremes on the ecosystem services of coastal wetlands cannot be reasonably evaluated using the current MACES framework. A possible solution is to use the emerging machine learning techniques to downscale low-fidelity, high-efficiency hydrodynamics models to emulate the high-fidelity, low-efficiency hydrodynamics models (Feng et al., 2023; Fraehr et al., 2023). For example, Fraehr et al. (2023) developed a hybrid low-fidelity, spatial analysis, and Gaussian process learning model to preserve the physics of 2D hydrodynamic equations, and the convolutional long short-term memory model (Tran et al., 2021) has been widely used to reduce the downscaling bias for data that vary both spatially and temporally. It is thus possible to map the 1D hydrodynamics simulated by MACES to the 2D high-fidelity hydrodynamics simulated by an advanced hydrodynamics model, such as Delft3D (Deltares, 2022), by combining the two techniques.
Although we intend to drive all the mineral and OM accretion algorithms under the same hydrodynamic conditions, particularly water level and SSC, due to the impact of vegetation on the transect surface roughness, the simulated hydrodynamics would be changed by the choice of mineral and OM accretion algorithms. As a result, the simulated differences between mineral and OM accretion may not be fully caused by the algorithm-level uncertainties. Furthermore, it should be noted that coastal wetland vegetation does not always serve as a sediment trap and, in some cases, can modify hydrodynamics to the extent that a dense plant cover repels overbank flow and sediment delivery (Olliver et al., 2020; Xu et al., 2022; Beltrán-Burgos et al., 2023). These nonlinear processes have not been represented in our model.
Another limitation of the model is the simplified representation of the biological and biogeochemical processes in MACES, which could limit the prediction accuracy of OM accretion. Despite the importance of macroclimatic drivers (particularly air temperature) to the evolution of coastal wetlands under climate change (Osland et al., 2016), the related effects are either neglected or only simply parameterized in the MACES algorithms (D’Alpaos et al., 2007; Kakeh et al., 2016; Kirwan and Mudd, 2012; Morris et al., 2012), which would cause biased estimates of sediment deposition, OM deposition, and coastal wetlands resilience (Schoutens et al., 2019). It is thus necessary to adopt some advanced developments in vegetation dynamics and biogeochemistry from more complex land surface models (Oleson et al., 2013).
Additionally, many other factors that can drive the eco-geomorphology of coastal wetlands have not been represented in the MACES model. These include land subsidence (Hasan et al., 2023), wave-driven coastal erosion (Leonardi et al., 2016), and wetland landward migration (Schuerch et al., 2018). For instance, the modeling of land subsidence needs to resolve the effects of both natural (e.g., site history) and anthropogenic disturbances (e.g., groundwater extraction). The modeling of wave-driven coastal erosion needs to account for the change in wind regimes. For wetland landward migration, both natural (e.g., steep slopes) and human barriers (e.g., cities) must be considered. These nonlinear factors will be included in future model development and tested under different scenarios to evaluate their impact on coastal wetlands.
We developed a multi-algorithm model framework, MACES, to evaluate the algorithm-level uncertainties in mineral and OM accretion modeling based on consistent hydrodynamic conditions. The MACES model can reproduce the observed dynamics of water depth, wave, and bottom shear stress, as well as the observed long-term mineral and OM accretion at three representative sites of coastal wetlands in diverse environments. As expected, our approach reveals significant algorithm-level uncertainties in coastal wetland eco-geomorphology modeling, which can lead to divergent estimates of the vulnerability of coastal wetlands to SLR. Importantly, we demonstrate that multi-algorithm ensemble estimates can provide more robust signals on the evolution of coastal wetlands. Thus, the approach should be more broadly explored in the future. Our study also indicates that the model uncertainty can be reduced by 1) including multiple observations of mineral and OM accretion along the elevation gradient of coastal wetlands and 2) evaluating the eco-geomorphology models at different sites in diverse environments. The MACES framework is a useful tool to test and compare different algorithms for modeling coastal wetlands and predict the fate of coastal wetlands under climate change at large scales.
The datasets presented in this study can be found in online repositories. The names of the repository/repositories and accession number(s) can be found below. The MACES source code can be freely downloaded from Tan (2023) and will be routinely updated at https://github.com/tanzeli1982/MACES. The data used in this study are publicly available at Tan et al. (2023).
ZT: conceptualization, formal analysis, funding acquisition, investigation, methodology, project administration, resources, software, validation, visualization, and writing–original draft. LL: conceptualization, funding acquisition, supervision, and writing–review and editing. CL: software and writing–review and editing. LC: data curation, resources, and writing–review and editing. JR: data curation, resources, and writing–review and editing. PS: data curation, resources, and writing–review and editing. SS: data curation, resources, and writing–review and editing.
The author(s) declare that financial support was received for the research, authorship, and/or publication of this article. The research was supported by the US Department of Energy, Office of Science, Office of Biological and Environmental Research as part of the multi-program, collaborative Integrated Coastal Modeling (ICoM) project (grant no. KP1703110/75415). It was also partly supported by the PREMIS Initiative at the Pacific Northwest National Laboratory (PNNL) under the Laboratory-Directed Research and Development Program. PNNL was operated for DOE by Battelle Memorial Institute, United States, under contract DE-AC05-76RL01830. Datasets of the Plum Island Estuary were provided by the Plum Island Ecosystems LTER, with support from the National Science Foundation under grants #OCE-9726921, OCE-0423565, OCE-1058747, OCE-1238212, and OCE-1637630.
The authors are grateful for the constructive comments from all the reviewers. The authors thank the Ministero delle Infrastrutture e dei Trasporti, Magistrato alle Acque di Venezia, through its concessionary Consorzio Venezia Nuova for the field data collected in the Venice lagoon.
The authors declare that the research was conducted in the absence of any commercial or financial relationships that could be construed as a potential conflict of interest.
The author(s) declared that they were an editorial board member of Frontiers, at the time of submission. This had no impact on the peer review process and the final decision.
All claims expressed in this article are solely those of the authors and do not necessarily represent those of their affiliated organizations, or those of the publisher, the editors, and the reviewers. Any product that may be evaluated in this article, or claim that may be made by its manufacturer, is not guaranteed or endorsed by the publisher.
The Supplementary Material for this article can be found online at: https://www.frontiersin.org/articles/10.3389/feart.2024.1421265/full#supplementary-material
Aburto-Oropeza, O., Ezcurra, E., Danemann, G., Valdez, V., Murray, J., and Sala, E. (2008). Mangroves in the Gulf of California Increase Fishery Yields, Proc. Natl. Acad. Sci. U. S. A. 105, 10456–10459. doi:10.1073/pnas.0804601105
Bellucci, L. G., Frignani, M., Cochran, J. K., Albertazzi, S., Zaggia, L., Cecconi, G., et al. (2007). 210Pb and 137Cs as Chronometers for Salt Marsh Accretion in the Venice Lagoon–Links to Flooding Frequency and Climate Change. J. Environ. Radioact. 97, 85–102. doi:10.1016/j.jenvrad.2007.03.005
Beltrán-Burgos, M., Esposito, C. R., Nepf, H. M., Baustian, M. M., and Di Leonardo, D. R. (2023). Vegetation-Driven Seasonal Sediment Dynamics in a Freshwater Marsh of the Mississippi River Delta. J. Geophys. Res. Biogeosciences 128, e2022JG007143. doi:10.1029/2022jg007143
Blum, M. D., and Roberts, H. H. (2009). Drowning of the Mississippi Delta due to Insufficient Sediment Supply and Global Sea-Level Rise. Nat. Geosci. 2, 488–491. doi:10.1038/ngeo553
Breda, A., Saco, P. M., Sandi, S. G., Saintilan, N., Riccardi, G., and Rodríguez, J. F. (2021). Accretion, Retreat and Transgression of Coastal Wetlands Experiencing Sea-Level Rise. Hydrology Earth Syst. Sci. 25, 769–786. doi:10.5194/hess-25-769-2021
Breithaupt, J. L., Smoak, J. M., Smith, T. J., Sanders, C. J., and Hoare, A. (2012). Organic Carbon Burial Rates in Mangrove Sediments: Strengthening the Global Budget. Glob. Biogeochem. Cycles 26, GB3011. doi:10.1029/2012gb004375
Burden, R. L., Faires, J. D., and Reynolds, A. C. (1978). Numerical Analysis. Boston: Prindle, Weber and Schmidt Inc, 254.
Cahoon, D. R., Hensel, P. F., Spencer, T., Reed, D. J., McKee, K. L., and Saintilan, N. (2006). “Coastal Wetland Vulnerability to Relative Sea-Level Rise: Wetland Elevation Trends and Process Controls,” in Wetlands and Natural Resource Management: Ecological Studies. Editor J. T. A. Verhoeven (Berlin: Springer), 190, 271–292. doi:10.1007/978-3-540-33187-2_12
Cahoon, D. R., McKee, K. L., and Morris, J. T. (2021). How Plants Influence Resilience of Salt Marsh and Mangrove Wetlands to Sea-Level Rise. Estuaries Coasts 44, 883–898. doi:10.1007/s12237-020-00834-w
Carniello, L., D’Alpaos, A., and Defina, A. (2011). Modeling Wind Waves and Tidal Flows in Shallow Micro-Tidal Basins. Estuar. Coast. Shelf Sci. 92, 263–276. doi:10.1016/j.ecss.2011.01.001
Carniello, L., Defina, A., and D’Alpaos, L. (2012). Modeling Sand-Mud Transport Induced by Tidal Currents and Wind Waves in Shallow Microtidal Basins: Application to the Venice Lagoon (Italy). Estuar. Coast. Shelf Sci. 102, 105–115. doi:10.1016/j.ecss.2012.03.016
Carniello, L., Defina, A., Fagherazzi, S., and D’Alpaos, L. (2005). A Combined Wind Wave–Tidal Model for the Venice lagoon, Italy. J. Geophys. Res. Earth Surf. 110, F04007. doi:10.1029/2004jf000232
Chmura, G. L., Anisfeld, S. C., Cahoon, D. R., and Lynch, J. C. (2003). Global Carbon Sequestration in Tidal, Saline Wetland Soils. Glob. Biogeochem. Cycles 17, 1111. doi:10.1029/2002gb001917
Coleman, D., and Kirwan, M. (2020). PIE LTER Suspended Sediments at Law’s Point, West Creek, a Tidal Marsh and Creek off the Rowley River, Rowley, MA, During 2016-2017. Environmental Data Initiative.
Craft, C., Clough, J., Ehman, J., Joye, S., Park, R., Pennings, S., et al. (2009). Forecasting the Effects of Accelerated Sea-Level Rise on Tidal Marsh Ecosystem Services. Front. Ecol. Environ. 7, 73–78. doi:10.1890/070219
Crase, B., Liedloff, A., Vesk, P. A., Burgman, M. A., and Wintle, B. A. (2013). Hydroperiod is the Main Driver of the Spatial Pattern of Dominance in Mangrove Communities. Glob. Ecol. Biogeogr. 22, 806–817. doi:10.1111/geb.12063
Crosby, S. C., Sax, D. F., Palmer, M. E., Booth, H. S., Deegan, L. A., Bertness, M. D., et al. (2016). Salt Marsh Persistence is Threatened by Predicted Sea-Level Rise. Estuar. Coast. Shelf Sci. 181, 93–99. doi:10.1016/j.ecss.2016.08.018
D’Alpaos, A., Carniello, L., and Mudd, S. M. (2011). Dynamic Response of Marshes to perturbations in Suspended Sediment Concentrations and Rates of Relative Sea Level Rise. J. Geophys. Res. Earth Surf. 116, F04020. doi:10.1029/2011jf002093
D’Alpaos, A., Lanzoni, S., Marani, M., and Rinaldo, A. (2007). Landscape Evolution in Tidal Embayments: Modeling the Interplay of Erosion, Sedimentation, and Vegetation Dynamics. J. Geophys. Res. Earth Surf. 112, F01008. doi:10.1029/2006jf000537
Day Jr, J. W., Rybczyk, J., Scarton, F., Rismondo, A., Are, D., and Cecconi, G. (1999). Soil Accretionary Dynamics, Sea-Level Rise and the Survival of Wetlands in Venice Lagoon: A Field and Modelling Approach. Estuar. Coast. Shelf Sci. 49, 607–628. doi:10.1006/ecss.1999.0522
Dee, D. P., and Uppala, S. (2009). Variational Bias Correction of Satellite Radiance Data in the ERA-Interim Reanalysis. Q. J. R. Meteorological Soc. 135, 1830–1841. doi:10.1002/qj.493
Deegan, L. A., Johnson, D. S., Warren, R. S., Peterson, B. J., Fleeger, J. W., Fagherazzi, S., et al. (2012). Coastal Eutrophication as a Driver of Salt Marsh Loss. Nature 490, 388–392. doi:10.1038/nature11533
Doherty, J., Brebber, L., and Whyte, P. (1994) PEST: Model-independent parameter estimation. Corinda, Australia: Watermark Computing, 122.
Donatelli, M., Bregaglio, S., Confalonieri, R., De Mascellis, R., and Acutis, M. (2014). A Generic Framework for Evaluating Hybrid Models by Reuse and Composition–A Case Study on Soil Temperature Simulation. Environ. Model. Softw. 62, 478–486. doi:10.1016/j.envsoft.2014.04.011
Fagherazzi, S., Kirwan, M. L., Mudd, S. M., Guntenspergen, G. R., Temmerman, S., D’Alpaos, A., et al. (2012). Numerical Models of Salt Marsh Evolution: Ecological, Geomorphic, and Climatic Factors. Rev. Geophys. 50, RG1002. doi:10.1029/2011rg000359
Fagherazzi, S., Palermo, C., Rulli, M. C., Carniello, L., and Defina, A. (2007). Wind Waves in Shallow Microtidal Basins and the Dynamic Equilibrium of Tidal Flats. J. Geophys. Res. Earth Surf. 112, F02024. doi:10.1029/2006jf000572
Feng, D., Tan, Z., Engwirda, D., Liao, C., Xu, D., Bisht, G., et al. (2022). Investigating Coastal Backwater Effects and Flooding in the Coastal Zone Using a Global River Transport Model on an Unstructured Mesh. Hydrology Earth Syst. Sci. 26, 5473–5491. doi:10.5194/hess-26-5473-2022
Feng, D., Tan, Z., and He, Q. (2023). Physics-Informed Neural Networks of the Saint-Venant Equations for Downscaling a Large-Scale River Model. Water Resour. Res. 59, e2022WR033168. doi:10.1029/2022wr033168
Fisher, R. A., and Koven, C. D. (2020). Perspectives on the Future of Land Surface Models and the Challenges of Representing Complex Terrestrial Systems. J. Adv. Model. Earth Syst. 12, e2018MS001453. doi:10.1029/2018ms001453
FitzGerald, D. M., Hein, C. J., Connell, J. E., Hughes, Z. J., Georgiou, I. Y., and Novak, A. B. (2021). Largest Marsh in New England Near a Precipice. Geomorphology 379, 107625. doi:10.1016/j.geomorph.2021.107625
Fraehr, N., Wang, Q. J., Wu, W., and Nathan, R. (2023). Development of a Fast and Accurate Hybrid Model for Floodplain Inundation Simulations. Water Resour. Res. 59, e2022WR033836. doi:10.1029/2022wr033836
French, J. (2006). Tidal Marsh Sedimentation and Resilience to Environmental Change: Exploratory Modelling of Tidal, Sea-Level and Sediment Supply Forcing in Predominantly Allochthonous Systems. Mar. Geol. 235, 119–136. doi:10.1016/j.margeo.2006.10.009
Giblin, A. (2018). Year 2017, PIE LTER Wind Sensor Data, 15 Minute Intervals, From the Ipswich Bay Yacht Club Pier Located in Ipswich. MA Environmental Data Initiative.
Giblin, A. (2019). PIE LTER Marsh Water Table Height, Logging Data From the Nelson Island Spartina Marsh Site, Rowley, MA for May-October 2017. Environmental Data Initiative.
Guseva, S., Bleninger, T., Jöhnk, K., Polli, B. A., Tan, Z., Thiery, W., et al. (2020). Multimodel Simulation of Vertical Gas Transfer in a Temperate Lake. Hydrology Earth Syst. Sci. 24, 697–715. doi:10.5194/hess-24-697-2020
Hasan, M. F., Smith, R., Vajedian, S., Pommerenke, R., and Majumdar, S. (2023). Global land subsidence mapping reveals widespread loss of aquifer storage capacity. Nature Communications. 14 (1), 6180.
Hawker, L., Uhe, P., Paulo, L., Sosa, J., Savage, J., Sampson, C., et al. (2022). A 30 m Global Map of Elevation With Forests and Buildings Removed. Environ. Res. Lett. 17, 024016. doi:10.1088/1748-9326/ac4d4f
Hopkinson, C., and Valentine, V. (2005). PIE LTER 2005 Digital Elevation Model for the Plum Island Sound estuary, Massachusetts, Filtered_Grd, Last Filtered Grid - Raster Environmental Data Initiative.
Howe, A. J., Rodríguez, J. F., and Saco, P. M. (2009). Surface Evolution and Carbon Sequestration in Disturbed and Undisturbed Wetland Soils of the Hunter Estuary, Southeast Australia. Estuar. Coast. Shelf Sci. 84, 75–83. doi:10.1016/j.ecss.2009.06.006
Howes, N. C., FitzGerald, D. M., Hughes, Z. J., Georgiou, I. Y., Kulp, M. A., Miner, M. D., et al. (2010). Hurricane-Induced Failure of Low Salinity Wetlands. Proc. Natl. Acad. Sci. U. S. A. 107, 14014–14019. doi:10.1073/pnas.0914582107
Huntzinger, D. N., Schwalm, C., Michalak, A. M., Schaefer, K., King, A. W., Wei, Y., et al. (2013). The North American Carbon Program Multi-Scale Synthesis and Terrestrial Model Intercomparison Project – Part 1: Overview and Experimental Design. Geosci. Model Dev. 6, 2121–2133. doi:10.5194/gmd-6-2121-2013
Jin, Z., Zhuang, Q., Tan, Z., Dukes, J. S., Zheng, B., and Melillo, J. M. (2016). Do Maize Models Capture the Impacts of Heat and Drought Stresses on Yield? Using Algorithm Ensembles to Identify Successful Approaches. Glob. Change Biol. 22, 3112–3126. doi:10.1111/gcb.13376
Kakeh, N., Coco, G., and Marani, M. (2016). On the Morphodynamic Stability of Intertidal Environments and the Role of Vegetation. Adv. Water Resour. 93, 303–314. doi:10.1016/j.advwatres.2015.11.003
Keddy, P. A. (2000). Wetland ecology: principles and conservation. Cambridge, UK: Cambridge University Press.
Keogh, M. E., Törnqvist, T. E., Kolker, A. S., Erkens, G., and Bridgeman, J. G. (2021). Organic Matter Accretion, Shallow Subsidence, and River Delta Sustainability. J. Geophys. Res. Earth Surf. 126, e2021JF006231. doi:10.1029/2021jf006231
Kirwan, M. L., Guntenspergen, G. R., d’Alpaos, A., Morris, J. T., Mudd, S. M., and Temmerman, S. (2010). Limits on the Adaptability of Coastal Marshes to Rising Sea Level. Geophys. Res. Lett. 37, L23401. doi:10.1029/2010gl045489
Kirwan, M. L., and Megonigal, J. P. (2013). Tidal Wetland Stability in the Face of Human Impacts and Sea-Level Rise. Nature 504, 53–60. doi:10.1038/nature12856
Kirwan, M. L., and Mudd, S. M. (2012). Response of Salt-Marsh Carbon Accumulation to Climate Change. Nature 489, 550–553. doi:10.1038/nature11440
Kirwan, M. L., Temmerman, S., Skeehan, E. E., Guntenspergen, G. R., and Fagherazzi, S. (2016). Overestimation of Marsh Vulnerability to Sea Level Rise. Nat. Clim. Change 6, 253–260. doi:10.1038/nclimate2909
Kurganov, A., and Levy, D. (2002). Central-Upwind Schemes for the Saint-Venant System. ESAIM Math. Model. Numer. Analysis 36, 397–425. doi:10.1051/m2an:2002019
Le Hir, P., Monbet, Y., and Orvain, F. (2007). Sediment Erodability in Sediment Transport Modelling: Can we Account for Biota Effects? Cont. Shelf Res. 27, 1116–1142. doi:10.1016/j.csr.2005.11.016
Leonardi, N., Ganju, N. K., and Fagherazzi, S. (2016). A Linear Relationship Between Wave Power and Erosion Determines Salt-Marsh Resilience to Violent Storms and Hurricanes. Proc. Natl. Acad. Sci. 113, 64–68. doi:10.1073/pnas.1510095112
Liang, Q., and Marche, F. (2009). Numerical Resolution of Well-Balanced Shallow Water Equations With Complex Source Terms. Adv. water Resour. 32, 873–884. doi:10.1016/j.advwatres.2009.02.010
Liao, C., Zhuang, Q., Leung, L. R., and Guo, L. (2019). Quantifying Dissolved Organic Carbon Dynamics Using a Three-Dimensional Terrestrial Ecosystem Model at High Spatial-Temporal Resolutions. J. Adv. Model. Earth Syst. 11, 4489–4512. doi:10.1029/2019ms001792
Liu, W., Chen, X., Strong, D. R., Pennings, S. C., Kirwan, M. L., Chen, X., et al. (2020). Climate and Geographic Adaptation Drive Latitudinal Clines in Biomass of a Widespread Saltmarsh Plant in its Native and Introduced Ranges. Limnol. Oceanogr. 65, 1399–1409. doi:10.1002/lno.11395
Lorenzo-Trueba, J., Voller, V. R., Paola, C., Twilley, R. R., and Bevington, A. E. (2012). Exploring the Role of Organic Matter Accumulation on Delta Evolution. J. Geophys. Res. Earth Surf. 117, 2012JF002339. doi:10.1029/2012jf002339
Lovelock, C. E., Cahoon, D. R., Friess, D. A., Guntenspergen, G. R., Krauss, K. W., Reef, R., et al. (2015). The Vulnerability of Indo-Pacific Mangrove Forests to Sea-Level Rise. Nature 526, 559–563. doi:10.1038/nature15538
Maan, D. C., Van Prooijen, B. C., Wang, Z. B., and De Vriend, H. J. (2015). Do Intertidal Flats Ever Reach Equilibrium? J. Geophys. Res. Earth Surf. 120, 2406–2436. doi:10.1002/2014jf003311
Macreadie, P. I., Anton, A., Raven, J. A., Beaumont, N., Connolly, R. M., Friess, D. A., et al. (2019). The Future of Blue Carbon Science. Nat. Commun. 10, 3998. doi:10.1038/s41467-019-11693-w
Marani, M., D’Alpaos, A., Lanzoni, S., Carniello, L., and Rinaldo, A. (2007). Biologically-Controlled Multiple Equilibria of Tidal Landforms and the Fate of the Venice Lagoon. Geophys. Res. Lett. 34, L11402. doi:10.1029/2007gl030178
Mariotti, G., Elsey-Quirk, T., Bruno, G., and Valentine, K. (2020). Mud-Associated Organic Matter and its Direct and Indirect Role in Marsh Organic Matter Accumulation and Vertical Accretion. Limnol. Oceanogr. 65, 2627–2641. doi:10.1002/lno.11475
Mariotti, G., and Fagherazzi, S. (2010). A Numerical Model for the coupled Long-Term Evolution of Salt Marshes and Tidal Flats. J. Geophys. Res. Earth Surf. 115, F01004. doi:10.1029/2009jf001326
Mcleod, E., Poulter, B., Hinkel, J., Reyes, E., and Salm, R. (2010). Sea-Level Rise Impact Models and Environmental Conservation: A Review of Models and Their Applications. Ocean Coast. Manag. 53, 507–517. doi:10.1016/j.ocecoaman.2010.06.009
Morris, J., and Sundberg, K. (2006) “Change in Marsh Surface Elevation Measured With a Surface Elevation Table (SET) at Control Plots in a Spartina alterniflora-Dominated Salt Marsh at Law’s Point,” in Rowley River, Plum Island Ecosystem LTER, MA. Madison, WI: Environmental Data Initiative.
Morris, J., and Sundberg, K. (2020) “Aboveground Biomass Data From Control Sites in a Spartina alterniflora-Dominated Salt Marsh at Law’s Point,” in Rowley River, Plum Island Ecosystem LTER, MA. Madison, WI: Environmental Data Initiative.
Morris, J. T., Barber, D. C., Callaway, J. C., Chambers, R., Hagen, S. C., Hopkinson, C. S., et al. (2016). Contributions of Organic and Inorganic Matter to Sediment Volume and Accretion in Tidal Wetlands at Steady State. Earth's Future 4, 110–121. doi:10.1002/2015ef000334
Morris, J. T., Edwards, J., Crooks, S., and Reyes, E. (2012). “Assessment of Carbon Sequestration Potential in Coastal Wetlands,” in Recarbonization of the Biosphere: Ecosystems and the Global Carbon Cycle. Editors R. Lal, K. Lorenz, R. Huttl, B. U. Schneider, and J. von Braun (New York: Springer), 517–531.
Morris, J. T., Sundareshwar, P. V., Nietch, C. T., Kjerfve, B., and Cahoon, D. R. (2002). Responses of Coastal Wetlands to Rising Sea Level. Ecology 83, 2869–2877. doi:10.2307/3072022
Mudd, S. M., Fagherazzi, S., Morris, J. T., and Furbish, D. J. (2004). “Flow, Sedimentation, and Biomass Production on a Vegetated Salt Marsh in South Carolina: Toward a Predictive Model of Marsh Morphologic and Ecologic Evolution,” in The Ecogeomorphology of Tidal Marshes. Editors S. Fagherazzi, M. Marani, and L. K. Blum (Washington, DC: American Geophysical Union AGU), 165–188.
Oleson, K. W., Lawrence, D. M., Bonan, G. B., Drewniak, B., Huang, M., Koven, C. D., et al. (2013). Technical description of version 4.5 of the Community Land Model (CLM); NCAR Tech. Note NCAR/TN-503+STR. Boulder, CO: NCAR. doi:10.5065/D6RR1W7M
Olliver, E. A., Edmonds, D. A., and Shaw, J. B. (2020). Influence of Floods, Tides, and Vegetation on Sediment Retention in Wax Lake Delta, Louisiana, USA. J. Geophys. Res. Earth Surf. 125, e2019JF005316. doi:10.1029/2019jf005316
Osland, M. J., Enwright, N. M., Day, R. H., Gabler, C. A., Stagg, C. L., and Grace, J. B. (2016). Beyond Just Sea-Level Rise: Considering Macroclimatic Drivers Within Coastal Wetland Vulnerability Assessments to Climate Change. Glob. Change Biol. 22, 1–11. doi:10.1111/gcb.13084
Parkinson, R. W., Craft, C., DeLaune, R. D., Donoghue, J. F., Kearney, M., Meeder, J. F., et al. (2017). Marsh Vulnerability to Sea-Level Rise. Nat. Clim. Change 7, 756. doi:10.1038/nclimate3424
Reyes, E., White, M. L., Martin, J. F., Kemp, G. P., Day, J. W., and Aravamuthan, V. (2000). Landscape Modeling of Coastal Habitat Change in the Mississippi Delta. Ecology 81, 2331–2349. doi:10.2307/177118
Rodríguez, J. F., Saco, P. M., Sandi, S., Saintilan, N., and Riccardi, G. (2017). Potential Increase in Coastal Wetland Vulnerability to Sea-Level Rise Suggested by Considering Hydrodynamic Attenuation Effects. Nat. Commun. 8, 16094. doi:10.1038/ncomms16094
Roe, P. L. (1986). Characteristic-Based Schemes for the Euler Equations. Annu. Rev. Fluid Mech. 18, 337–365. doi:10.1146/annurev.fl.18.010186.002005
Roner, M., D’Alpaos, A., Ghinassi, M., Marani, M., Silvestri, S., Franceschinis, E., et al. (2016). Spatial Variation of Salt-Marsh Organic and Inorganic Deposition and Organic Carbon Accumulation: Inferences From the Venice lagoon, Italy. Adv. Water Resour. 93, 276–287. doi:10.1016/j.advwatres.2015.11.011
Saintilan, N., Khan, N. S., Ashe, E., Kelleway, J. J., Rogers, K., Woodroffe, C. D., et al. (2020). Thresholds of Mangrove Survival Under Rapid Sea Level Rise. Science 368, 1118–1121. doi:10.1126/science.aba2656
Sandi, S. G., Rodriguez, J. F., Saco, P. M., Saintilan, N., and Riccardi, G. (2021). Accelerated Sea-Level Rise Limits Vegetation Capacity to Sequester Soil Carbon in Coastal Wetlands: A Study Case in Southeastern Australia. Earth's Future 9, e2020EF001901. doi:10.1029/2020ef001901
Sandi, S. G., Rodríguez, J. F., Saintilan, N., Riccardi, G., and Saco, P. M. (2018). Rising Tides, Rising Gates: The Complex Ecogeomorphic Response of Coastal Wetlands to Sea-Level Rise and Human Interventions. Adv. Water Resour. 114, 135–148. doi:10.1016/j.advwatres.2018.02.006
Schellnhuber, H. J., Frieler, K., and Kabat, P. (2014). The Elephant, the Blind, and the Intersectoral Intercomparison of Climate Impacts. Proc. Natl. Acad. Sci. 111, 3225–3227. doi:10.1073/pnas.1321791111
Schoutens, K., Heuner, M., Minden, V., Schulte Ostermann, T., Silinski, A., Belliard, J. P., et al. (2019). How Effective are Tidal Marshes as Nature-Based Shoreline Protection Throughout Seasons? Limnol. Oceanogr. 64, 1750–1762. doi:10.1002/lno.11149
Schuerch, M., Spencer, T., Temmerman, S., Kirwan, M. L., Wolff, C., Lincke, D., et al. (2018). Future Response of Global Coastal Wetlands to Sea-Level Rise. Nature 561, 231–234. doi:10.1038/s41586-018-0476-5
Soulsby, R. L. (1997). Dynamics of marine sands: A manual for practical applications. London: Thomas Telford, 248.
Tambroni, N., and Seminara, G. (2012). A One-Dimensional Eco-Geomorphic Model of Marsh Response to Sea Level Rise: Wind Effects, Dynamics of the Marsh Border and Equilibrium. J. Geophys. Res. Earth Surf. 117, F03026. doi:10.1029/2012jf002363
Tan, Z., Leung, L. R., Li, H. Y., and Cohen, S. (2022). Representing Global Soil Erosion and Sediment Flux in Earth System Models. J. Adv. Model. Earth Syst. 14, e2021MS002756. doi:10.1029/2021ms002756
Tan, Z., Leung, L. R., Li, H.-Y., and Tesfa, T. (2018). Modeling Sediment Yield in Land Surface and Earth System Models: Model Comparison, Development, and Evaluation. J. Adv. Model. Earth Syst. 10, 2192–2213. doi:10.1029/2017ms001270
Tan, Z., Leung, L. R., Liao, C., Carniello, L., Rodríguez, J. F., Saco, P. M., et al. (2023). A Multi-Algorithm Approach for Modeling Coastal Wetland Eco-Geomorphology. Zenodo. doi:10.5281/zenodo.8326927
Tan, Z., Zhuang, Q., and Walter Anthony, K. (2015). Modeling Methane Emissions From Arctic Lakes: Model Development and Site-Level Study. J. Adv. Model. Earth Syst. 7, 459–483. doi:10.1002/2014ms000344
Temmerman, S., Govers, G., Meire, P., and Wartel, S. (2003a). Modelling Long-Term Tidal Marsh Growth Under Changing Tidal Conditions and Suspended Sediment Concentrations, Scheldt estuary, Belgium. Mar. Geol. 193, 151–169. doi:10.1016/s0025-3227(02)00642-4
Temmerman, S., Govers, G., Wartel, S., and Meire, P. (2003b). Spatial and Temporal Factors Controlling Short-Term Sedimentation in a Salt and Freshwater Tidal Marsh, Scheldt estuary, Belgium, SW Netherlands. Earth Surf. Process. Landforms 28, 739–755. doi:10.1002/esp.495
Temmerman, S., Meire, P., Bouma, T. J., Herman, P. M., Ysebaert, T., and De Vriend, H. J. (2013). Ecosystem-Based Coastal Defence in the Face of Global Change. Nature 504, 79–83. doi:10.1038/nature12859
Teuchies, J., Vandenbruwaene, W., Carpentier, R., Bervoets, L., Temmerman, S., Wang, C., et al. (2013). Estuaries as Filters: The Role of Tidal Marshes in Trace Metal Removal. PLOS ONE 8, e70381. doi:10.1371/journal.pone.0070381
Törnqvist, T. E., Cahoon, D. R., Morris, J. T., and Day, J. W. (2021). Coastal Wetland Resilience, Accelerated Sea-Level Rise, and the Importance of Timescale. AGU Adv. 2, e2020AV000334. doi:10.1029/2020av000334
Törnqvist, T. E., Jankowski, K. L., Li, Y. X., and González, J. L. (2020). Tipping points of Mississippi Delta Marshes due to Accelerated Sea-Level Rise. Sci. Adv. 6, eaaz5512. doi:10.1126/sciadv.aaz5512
Tran, H., Leonarduzzi, E., De La Fuente, L., Hull, R. B., Bansal, V., Chennault, C., et al. (2021). Development of a Deep Learning Emulator for a Distributed Groundwater–Surface Water Model: ParFlow-ML. Water 13, 3393. doi:10.3390/w13233393
Vafeidis, A. T., Nicholls, R. J., McFadden, L., Tol, R. S., Hinkel, J., Spencer, T., et al. (2008). A New Global Coastal Database for Impact and Vulnerability Analysis to Sea-Level Rise. J. Coast. Res. 24, 917–924. doi:10.2112/06-0725.1
Vallino, J. (2018) “PIE LTER, Hach, OTT RLS Measurements of Water Column Depth at 15 Minute Intervals in the Lower Plum Island Sound off the Ipswich Bay Yacht Club pier,” in Ipswich, MA, year 2017. Madison,WI: Environmental Data Initiative.
Van de Koppel, J., Van der Wal, D., Bakker, J. P., and Herman, P. M. J. (2005). Self-organization and vegetation collapse in salt marsh ecosystems. Am. Nat. 165, E1–E12. doi:10.1086/426602
Wang, F., Lu, X., Sanders, C. J., and Tang, J. (2019). Tidal Wetland Resilience to Sea Level Rise Increases Their Carbon Sequestration Capacity in United States. Nat. Commun. 10, 5434. doi:10.1038/s41467-019-13294-z
Ward, N. D., Megonigal, J. P., Bond-Lamberty, B., Bailey, V. L., Butman, D., Canuel, E. A., et al. (2020). Representing the Function and Sensitivity of Coastal Interfaces in Earth System Models. Nat. Commun. 11, 2458. doi:10.1038/s41467-020-16236-2
Wilson, C. A., Hughes, Z. J., FitzGerald, D. M., Hopkinson, C. S., Valentine, V., and Kolker, A. S. (2014). Saltmarsh Pool and Tidal Creek Morphodynamics: Dynamic Equilibrium of Northern Latitude Saltmarshes? Geomorphology 213, 99–115. doi:10.1016/j.geomorph.2014.01.002
Xu, Y., Esposito, C. R., Beltrán-Burgos, M., and Nepf, H. M. (2022). Competing Effects of Vegetation Density on Sedimentation in Deltaic Marshes. Nat. Commun. 13, 4641. doi:10.1038/s41467-022-32270-8
Keywords: coastal wetland, eco-geomorphology, model uncertainty, mineral accretion, organic matter accretion
Citation: Tan Z, Leung LR, Liao C, Carniello L, Rodríguez JF, Saco PM and Sandi SG (2024) A multi-algorithm approach for modeling coastal wetland eco-geomorphology. Front. Earth Sci. 12:1421265. doi: 10.3389/feart.2024.1421265
Received: 22 April 2024; Accepted: 02 July 2024;
Published: 24 July 2024.
Edited by:
Frédéric Frappart, INRAE Nouvelle-Aquitaine Bordeaux, FranceReviewed by:
Thomas Allen, Old Dominion University, United StatesCopyright © 2024 Tan, Leung, Liao, Carniello, Rodríguez, Saco and Sandi. This is an open-access article distributed under the terms of the Creative Commons Attribution License (CC BY). The use, distribution or reproduction in other forums is permitted, provided the original author(s) and the copyright owner(s) are credited and that the original publication in this journal is cited, in accordance with accepted academic practice. No use, distribution or reproduction is permitted which does not comply with these terms.
*Correspondence: Zeli Tan, emVsaS50YW5AcG5ubC5nb3Y=
Disclaimer: All claims expressed in this article are solely those of the authors and do not necessarily represent those of their affiliated organizations, or those of the publisher, the editors and the reviewers. Any product that may be evaluated in this article or claim that may be made by its manufacturer is not guaranteed or endorsed by the publisher.
Research integrity at Frontiers
Learn more about the work of our research integrity team to safeguard the quality of each article we publish.