 Wei Feng
 Yaming Tang3*
- 1Xi’an Center of Geological Survey, Xi’an, China
- 2Key Laboratory for Geo-Hazards in Loess Area, Ministry of Natural Resources, Xi’an, China
- 3Institute of Earth Environment, Chinese Academy of Sciences, Xi’an, China
- 4Shaanxi Geomatics Center, Ministry of Natural Resources, Xi’an, China
The earthquake landslide hazard assessment method is mainly based on the traditional Newmark model. However, when the landslide hazard assessment is carried out along the fault zone, the calculated results are often different from the actual situation because the influence of fault effect is not fully considered. Therefore, how to construct a landslide hazard assessment model suitable for the fault zone is a technical problem to be solved by researchers. Taking the Lixian–Luojiabu fault zone in Gansu Province in China as the study area, this paper put forward the concept of fault effect correction coefficient exploringly, systematically studied the relative distance relationship between the landslide and fault zone, and the relative position relationship between landslide and upper and lower sides of the fault zone. The value table of the fault effect correction coefficient along the Lixian–Luojiabu fault zone was established, and the corresponding distribution map of the fault effect correction coefficient was drawn. Based on this, an improved Newmark model for the landslide hazard assessment along the fault zone was constructed. On the basis of systematic analysis of the slope and engineering geological rock group in the study area, the traditional Newmark model and improved Newmark model considering fault effects were used, respectively, to carry out the earthquake landslide hazard assessment under the condition of 10% exceeding probability in 50 years, and the ROC curve and Kappa coefficient methods were used to compare and analyze the evaluation results. The results showed that the AUC value and Kappa coefficient of the danger area obtained by the improved model with the Newmark model were 0.841 and 0.822, respectively, which were significantly higher than the calculated values of the traditional Newmark model, indicating that the model had a good improvement effect. The Newmark improved model, considering the fault effect, fully considered the influence of distance from the fault zone and fault upper and lower side effects, and the research results can provide a new reference for the landslide hazard assessment along the fault zone.
1 Introduction
China is a country with frequent earthquakes. Active fault zones and tectonic zones are widely distributed in the mainland of China. Both inter-plate and intra-plate tectonic activities are very strong. In particular, in the weak areas of active fault zones or tectonic zones, destructive earthquakes are more likely to occur, which has a great impact on the daily life of local residents (Wang, 2018). According to data statistics, strong ground vibration along the active fault zone not only causes serious dislocation deformation of buildings but also easily induces secondary geological disasters such as landslide, collapse, debris flow, and sand liquefaction (Huang and Li, 2009; Peng et al., 2009; Guo et al., 2020; Chen et al., 2022; Li C. H. et al., 2023a; Bai and Xu, 2023; Li Y. W. et al., 2023b). Among these secondary geological disasters, landslide is one of the most developed disasters along the active fault zone. In the last century, landslides triggered by earthquakes have claimed hundreds of thousands of lives and caused huge economic losses (Schuster and Alford, 2004; Dunning et al., 2007; Yin, 2008; Huang, 2009; Lan et al., 2013; Xu et al., 2014; Xu et al., 2018; Sidorin, 2020; Wang et al., 2020; Qiu et al., 2024).
In the late 1960s, researchers in developed countries such as the United States, Britain, and France began to explore how to scientifically and rationally use the mechanical analysis model to carry out the regional landslide hazard assessment. The most commonly used regional earthquake landslide hazard assessment method in the world is based on the Newmark cumulative displacement theory (Newmark, 1965), which further calculates the permanent displacement of slopes under earthquake conditions and takes it as the basis for earthquake landslide hazard zoning (Wu and Wang, 2008). Wilson and Keefer (1983) and Wilson and Keefer (1985) carried out a regional earthquake landslide hazard assessment of the slope zone along the fault zone in the Los Angeles area of the United States using the Newmark model. Ambraseys and Menu (1988) constructed an analysis model based on the critical acceleration ratio for the first time on the basis of fully collecting the monitoring records of the earthquake network from 1940 to 1981. Milesa and Ho (1999) integrated GIS software into Newmark calculation and analysis, used the displacement value calculated by the Newmark model to classify the earthquake and landslide hazard in the San Francisco East Bay mountains into four levels, and compiled the corresponding earthquake and landslide risk distribution map. Based on the Newmark cumulative displacement method, Jibson et al. (2000) conducted an inversion analysis of the earthquake landslide hazard induced by the 1994 Northridge earthquake in California, United States. Rathje and Saygili (2008) took into account the different transcendental probability factors under earthquake conditions, and based on the improvement of the existing Newmark model, they completed the earthquake landslide hazard assessment under different transcendental probability conditions in Southern California. Daniel et al. (2013) compared the landslide induced by the 1994 Northridge earthquake in California with the landslide based on the displacement prediction of the slider and discussed the accuracy of the evaluation model. Shinoda and Miyata (2017) based on the Newmark model, considered the slope failure direction on the basis of determining the slope azimuth angle, and improved the regional earthquake landslide hazard assessment method.
In China, research on the regional landslide hazard assessment using the Newmark model started relatively late, but the research results in this area are gradually increasing in the past 10 years. Based on the analysis of Wenchuan earthquake data, Xu (2010) modified the Newmark model coefficient and established a slope permanent displacement prediction model suitable for the Sichuan area. Wang et al. (2013); Wang et al. (2015) took 11 counties and cities in the Wenchuan Ms8.0 earthquake disaster area as an example, proposed a rapid emergency assessment method for the earthquake landslide hazard based on the simplified Newmark displacement model, and carried out an in-depth discussion on the concept of the earthquake landslide hazard and mechanical assessment methods. Chen et al. (2013), Chen et al. (2018), and Chen et al. (2019) studied the landslide hazard assessment of the Lushan earthquake affected area in Sichuan, Ludian earthquake affected area in Yunnan, and Jiuzhaigou earthquake affected area based on the Newmark model. Yang et al. (2017) used the Newmark model to quickly evaluate the spatial distribution of the landslide hazard induced by the Nepal Ms8.1 earthquake in 2015, and the evaluation results basically reflected the basic characteristics of the earthquake-induced landslide hazard distribution in the area. Taking the 2008 Wenchuan Mw 7.9 earthquake area as an example, Ma and Xu (2019) presented the landslide hazard assessment and slope failure function using two Newmark displacement models regressed by regional and global station records. Then, Ma et al. (2023) used the machine learning method to compare and analyze the new generation of the seismic landslide hazard model proposed by Xu Chong and the traditional Newmark model in the MW 5.8 Lushan earthquake area, and discussed the accuracy and applicability of the two models. Zeng et al. (2023) proposed to combine the PMBM based on the Newmark method with EFBM to form the Newmark-information value model (N-IV), Newmark-logic regression model (N-LR), and Newmark-support vector machine model (N-SVM) for the earthquake landslide hazard assessment on the Ludian MW 6.2 earthquake in Yunnan, and had achieved a better prediction effect.
In summary, scholars mainly use the Newmark mechanical analysis model to carry out the earthquake landslide hazard assessment. Based on this, the model coefficients are modified according to the characteristics of the research area, and the corresponding improved models are proposed. These research results extend the application scope of the Newmark model to a certain extent. However, active fault zones in China are widely distributed, especially the landslide along the fault zone is highly developed. How to scientifically and reasonably use the Newmark model to carry out the landslide hazard assessment along the fault zone and whether to establish an improved Newmark model suitable for the fault zone are technical problems to be solved by scientific researchers. Taking the Lixian–Luojiabu fault zone in Gansu Province in China as an example, this paper explores the concept of the fault effect correction coefficient and constructs an improved Newmark model suitable for the landslide hazard assessment along the fault zone, in order to provide scientific basis for local government disaster prevention and mitigation.
2 Study area
The Lixian–Luojiabu fault zone in the Gansu Province of China starts from Tanchang in the west; passes through Taoping, Lixian, and Luojiabu; and extends to Jiezikou in the east, with a total length of approximately 150 km. It is characterized by both inclinative and left-handed development. The fault zone is mainly composed of three oblique secondary fault segments on the plane. The western segment starts from the east of Tanchang and ends to the east of Lixian, which is approximately 90 km long. The middle section starts from the south of Lixian and ends to the northeast of Luojiabu, which is approximately 40 km long. The eastern section starts from the west of Tianshui Town and ends to the east of Pingnan Town, which is approximately 20 km long. This paper takes the key area (the middle section) of the fault zone as the study area, which is located at the junction of the northern Lixian of Longnan City and the southwestern Qindu District of Tianshui City. It is the seismogenic fault of the 1654 Luojiabu 8.0 earthquake. The epicenter is located near the Luojiabu Town in the eastern section of the fault zone, and the maximum intensity can reach XI (Han, et al., 2001; Yang et al., 2015). The lithology of the strata exposed in the area includes Yanshanian biotite porphyritic granite, Devonian sandstone and slate, Carboniferous siltstone and limestone, Paleogene conglomerate and sandstone, Neogene red clay, Middle-late Pleistocene loess, and Holocene alluvial gravel. There are a large number of landslides along the fault zone. According to data collection, remote sensing interpretation and field investigation, it was found that 588 landslides have occurred on both sides of the Lixian–Luojiabu fault zone and the density of landslides is very high (Figure 1).
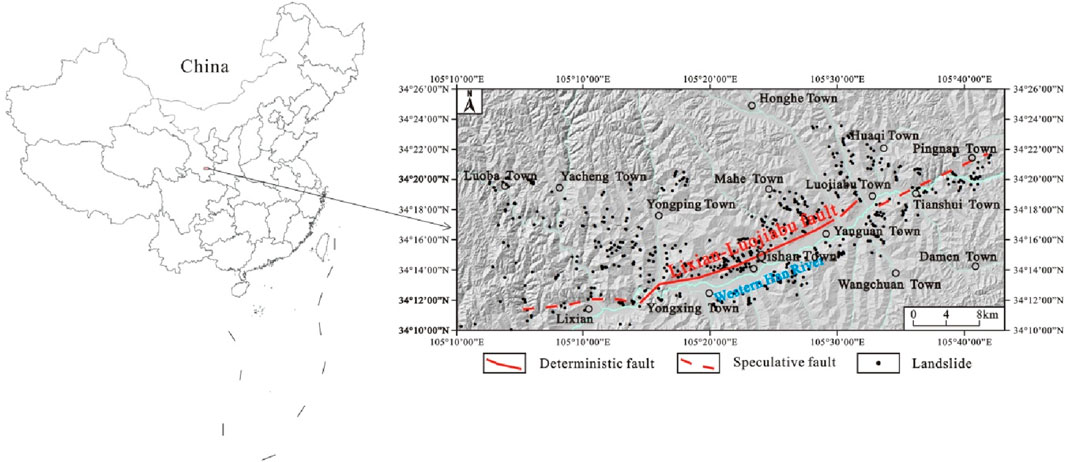
Figure 1. Landslide distribution map in the study area.
3 Assessment methodology
3.1 Calculation of the fault effect correction coefficient
For the Lixian–Luojiabu fault zone, the author carried out research on the fault effect of seismic geological disasters based on GIS technology and achieved research results on the correlation between landslide development and the fault zone (Feng et al., 2021). Through further analysis, it is found that the development of landslide is most affected by the distance from the fault zone and the relative position of the upper and lower sides. These two factors are static factors, while the direction of landslide movement and seismic intensity are dynamic factors that are difficult to predict. Therefore, the influence of the first two factors on the development of landslide should be considered. In order to carry out the landslide hazard assessment along the fault zone more accurately, the author puts forward the concept of the fault effect correction coefficient, which is a comprehensive correction coefficient value obtained by considering the two factors of the distance from the fault zone and the relative position of the upper and lower sides, and the parameter is expressed by β. The specific calculation method of the fault effect correction coefficient is represented as follows:
First, according to the relative distance between the landslide and the Lixian–Luojiabu fault zone, the density of landslide distribution points under different fault distance classification conditions is calculated (Figure 2). Because the landslide in the area 10 km away from the fault zone is the weakest controlled by the fault, the landslide point density value in the area >10 km away from the fault zone is used as the reference value, and the ratio of the landslide point density value in each fault distance classification to the landslide point density value in the area >10 km away from the fault is used as the correction value of the fault distance. The maximum amplification effect of the fault distance on the landslide development is 1.1. The correction value of the fault distance under all fault distance classification is normalized (normalized interval 1–1.1), and the fault distance correction coefficient graph of the landslide along the Lixian–Luojiabu fault zone is obtained (Figure 3).
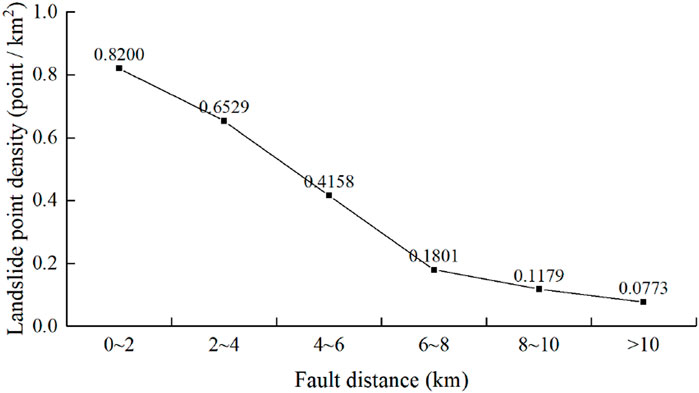
Figure 2. Graph of the relationship between the landslide point density and fault distance.
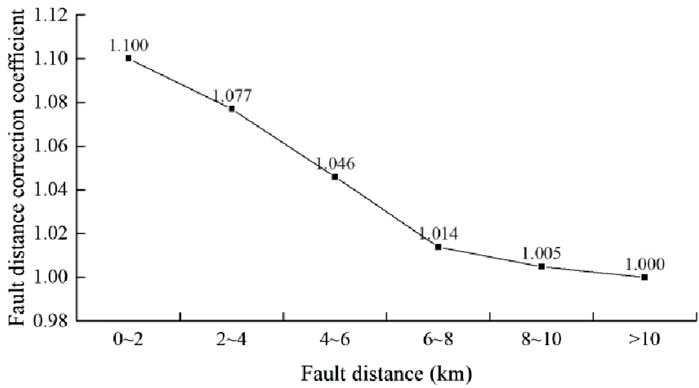
Figure 3. Fault distance correction coefficient graph of landslide.
Second, according to the relative position relationship between the landslide and the upper and lower sides of the Lixian–Luojiabu fault zone, the density of landslide points in the upper and lower sides of the fault zone is calculated (Figure 4). It is worth noting that when point density analysis is carried out because the landslide in the area outside 10 km from the fault zone is weakly controlled by the fault and when the density value of the landslide point is carried out, the study area is divided into three grades: the upper wall area within 10 km from the fault zone, the lower wall area within 10 km from the fault zone, and the area beyond 10 km from the fault zone. Because the landslide in the area 10 km away from the fault zone is weakly controlled by the fault, the landslide point density value corresponding to the area 10 km away from the fault zone is taken as the reference value, and the ratio of the landslide point density value corresponding to the upper and lower sides classification area to the landslide point density value corresponding to the area 10 km away from the fault zone is taken as the upper and lower side correction value. The maximum amplification effect of the upper and lower side positions on the landslide development is limited to 1.1. The upper and lower side correction values in all classification areas are normalized (normalized interval 1–1.1), and the upper and lower side position correction coefficient graph of the landslide along the Lixian–Luojiabu fault zone is obtained (Figure 5).
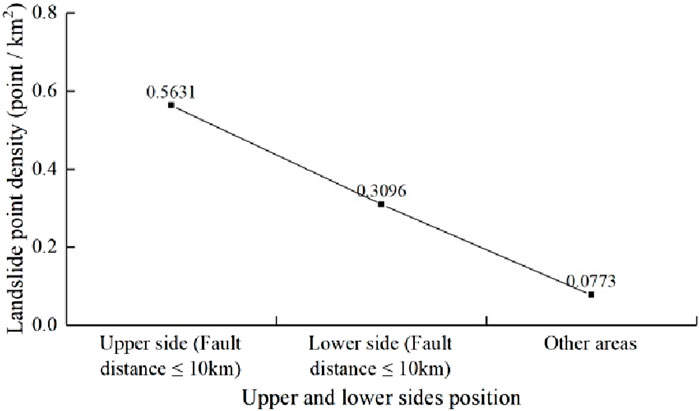
Figure 4. Graph of the relationship between the landslide point density and the upper and lower side positions.
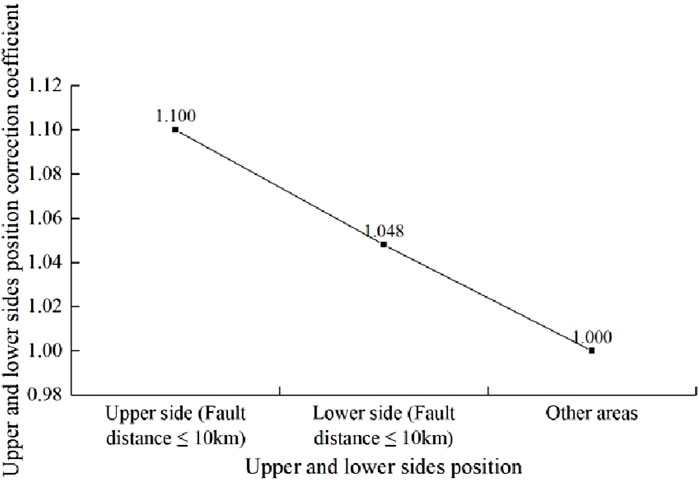
Figure 5. Upper and lower side position correction coefficient graph of landslide.
Finally, the correction coefficient of the fault distance in Figure 3 and the correction coefficient of the upper and lower side position in Figure 5 are multiplied to obtain the value table of the correction coefficient of the fault effect (Table 1) and the value distribution map of the fault effect correction coefficient (Figure 6) along the Lixian–Luojiabu fault zone.
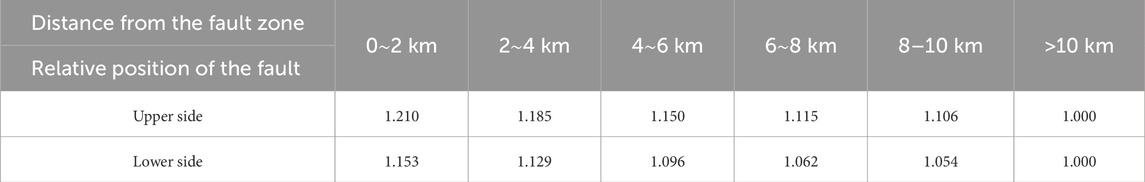
Table 1. Value table of the correction coefficient of the fault effect (Lixian–Luojiabu fault zone of Gansu Province).
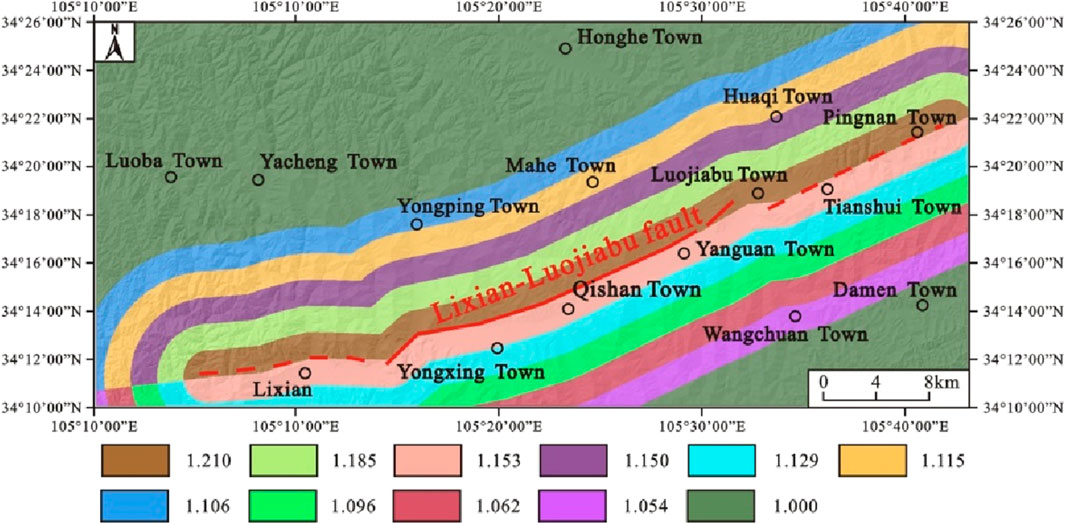
Figure 6. Value distribution map of the fault effect correction coefficient (Lixian–Luojiabu fault zone of Gansu Province).
3.2 Construction of the Newmark improved model considering the fault effect
3.2.1 Newmark traditional model
In 1965, Newmark proposed the method of simulating landslide by the movement of rigid bodies on the slope surface, which later evolved into the famous Newmark model (Newmark, 1965). The model is based on the limit equilibrium theory. It is assumed that the sliding body is a rigid body and there is no deformation inside the sliding body. When the external force is less than the critical acceleration, the slope does not produce displacement. When the external force is greater than the critical acceleration, a finite displacement will occur. The model evaluates the stability of the slope by calculating the permanent displacement accumulated by the sliding body during the acceleration of the ground motion. At present, it has been widely recognized by scholars in the prediction of earthquake-induced landslides.
The corresponding calculation process can be summarized as five steps: (1) calculate the static safety factor of regional slope; (2) calculate the critical acceleration of the slope; (3) calculate the permanent displacement value of the slope; (4) calculate the probability of earthquake landslide occurrence; (5) complete the earthquake landslide hazard assessment.
When calculating the static safety factor of the regional slope, the safety factor formula proposed by Jibson et al. (2000) considering the influence of rainfall infiltration is generally used, and its stress analysis diagram is shown in Figure 7.
where
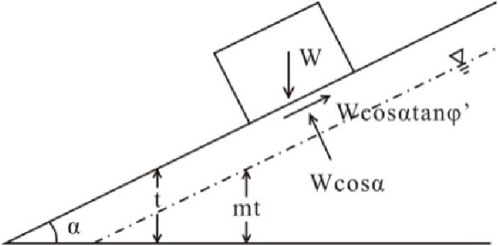
Figure 7. Static force analysis diagram of the Newmark model.
The critical acceleration is expressed as
where g is the acceleration of gravity (m/s2).
The Newmark displacement calculation adopts the empirical formula obtained by Jibson and Harp et al.:
where Dn is the Newmark cumulative displacement (m) and Ia is the earthquake intensity (m/s).
The general formula of Ia is
where a(t) is the time program column of single-component ground motion acceleration in a strong earthquake (m/s2), Td is the total duration recorded for ground motion acceleration (s), and t is time (s).
From Formula (4), the Newmark cumulative displacement calculation needs to input the complete ground motion acceleration time series curve, but this is difficult to achieve in the real process. Therefore, in the absence of the ground motion acceleration time series curve, people generally use the empirical formula to calculate the Ia value. In this paper, the Arias strength is calculated by using Roberto to analyze the empirical formula of 190 acceleration time history records of 17 strong earthquakes in Italy (Roberto, 2000):
where PGA is the peak ground acceleration (m/s2).
In fact, the cumulative displacement Dn calculated by the above Newmark model is not completely corresponding to the slope instability, and the area where the cumulative displacement occurs does not necessarily have a landslide. Only when the slope displacement accumulates to a certain extent, the slope will be unstable and lead to landslide. For this reason, Jibson et al. (2000) proposed a formula for calculating the probability of earthquake landslides. This formula can reasonably reflect the internal relationship between slope displacement and landslide occurrence, which is convenient for people to further carry out the hazard assessment on the basis of calculating the probability of earthquake landslides. The specific calculation formula of the earthquake landslide probability is as follows:
where
3.2.2 Newmark improved model considering the fault effect
In this paper, combined with the characteristics of landslide development along the fault zone, the static safety factor formula of the Newmark model is improved, and the fault effect correction coefficient is introduced. Because the larger the safety factor is, the better the stability of the slope is, and the correction coefficient is essentially the amplification coefficient of the fault effect; the safety factor should be reduced to a certain extent. Here, the reciprocal of the correction coefficient of the fault effect is taken for reduction. The specific expression is
where β is the correction coefficient of the fault effect and its value can be referred to the calculation method in Section 2.
The calculation steps of the landslide hazard assessment using this method are similar to the Newmark traditional model, and the specific calculation method is no longer repeated.
4 Landslide hazard assessment of the fault zone
4.1 Parameter selection
4.1.1 Terrain slope
Slope is a key factor affecting the development of landslide, which directly affects the stability of the slope (Hürlimann, et al., 2022; Yang, et al., 2023). ArcGIS software was used to reclassify the slope of the study area according to 1:50,000 DEM data, and it was divided into six sections: 0°–10°, 10°–20°, 20°–30°, 30°–40°, 40°–50°, and above 50° (Figure 8). Among them, the size of the grid value is set to 25 m × 25 m, and the study area is divided into 3,080,572 grid units.
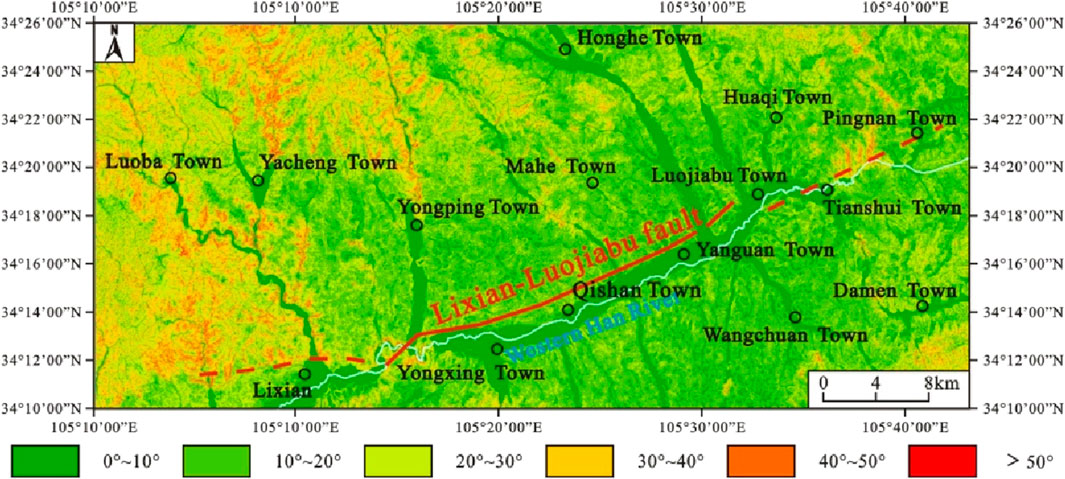
Figure 8. Map of slope in the study area.
4.1.2 Engineering geological rock group
The engineering geological rock group is the material foundation of landslide, which directly affects the stress state and weathering degree of rock and soil on the slope (Liu, et al., 2024; Ye, et al., 2024). When selecting the parameters of the engineering geological rock group, the stratum lithology in the study area is simplified and classified into five rock groups, which are the hardest rock group, the harder rock group, the softer rock group, the weak rock group, and the loose rock group (Figure 9). At the same time, 64 sets of undisturbed rock and soil samples were taken in different rock group units along Luojiabu Town, Yanguan Town, Tianshui Town, Yongping Town, Luoba Town, Yacheng Town, and Lixian County, and the corresponding rock and soil mass shear test was carried out. The gravity, cohesion, and internal friction angle of the five types of rock group units were tested, and the mechanical parameters of the engineering geological rock group were finally obtained (Table 2).
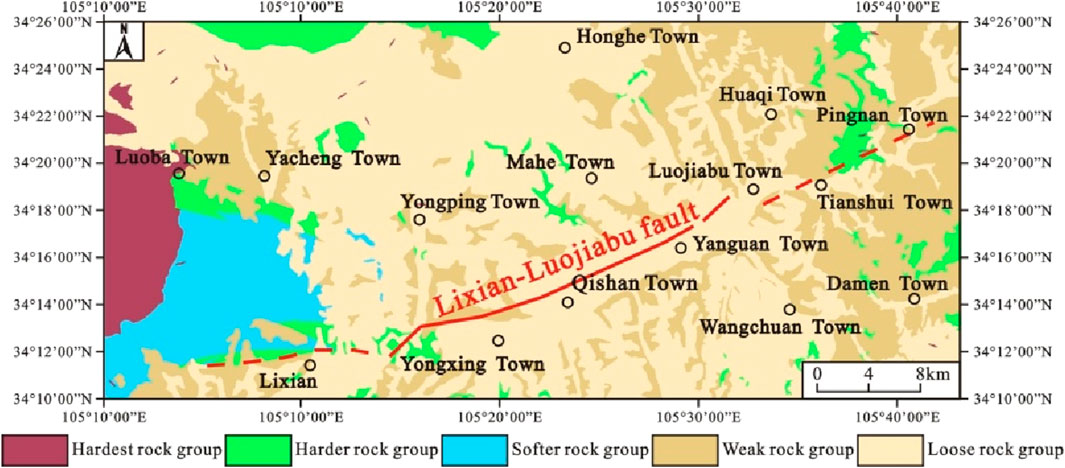
Figure 9. Map of engineering geological rock group in the study area.

Table 2. Empirical value of mechanical parameters about the engineering geological rock group.
4.2 Calculation of regional critical acceleration
When analyzing the stability of the landslide, the sliding body state is considered according to the dry state. The ratio of the thickness of the saturated part of the potential sliding body to the total thickness of the sliding body (m) is 0, and the thickness of the sliding body (t) is approximately 10 m. Based on the Newmark model and the grid calculator of ArcGIS, the static safety factor Fs of the regional slope body of the traditional model and the improved model is calculated by Formula (1) and Formula (7), and then, the corresponding regional critical acceleration distribution value is obtained by Formula (2). The natural breakpoint classification method is used to divide the regional critical acceleration value into four intervals: (0, 0.05 g), (0.05 g, 0.15 g), (0.15 g, 0.25 g), and greater than 0.25 g, forming a distribution map of regional critical acceleration (Figure 10).
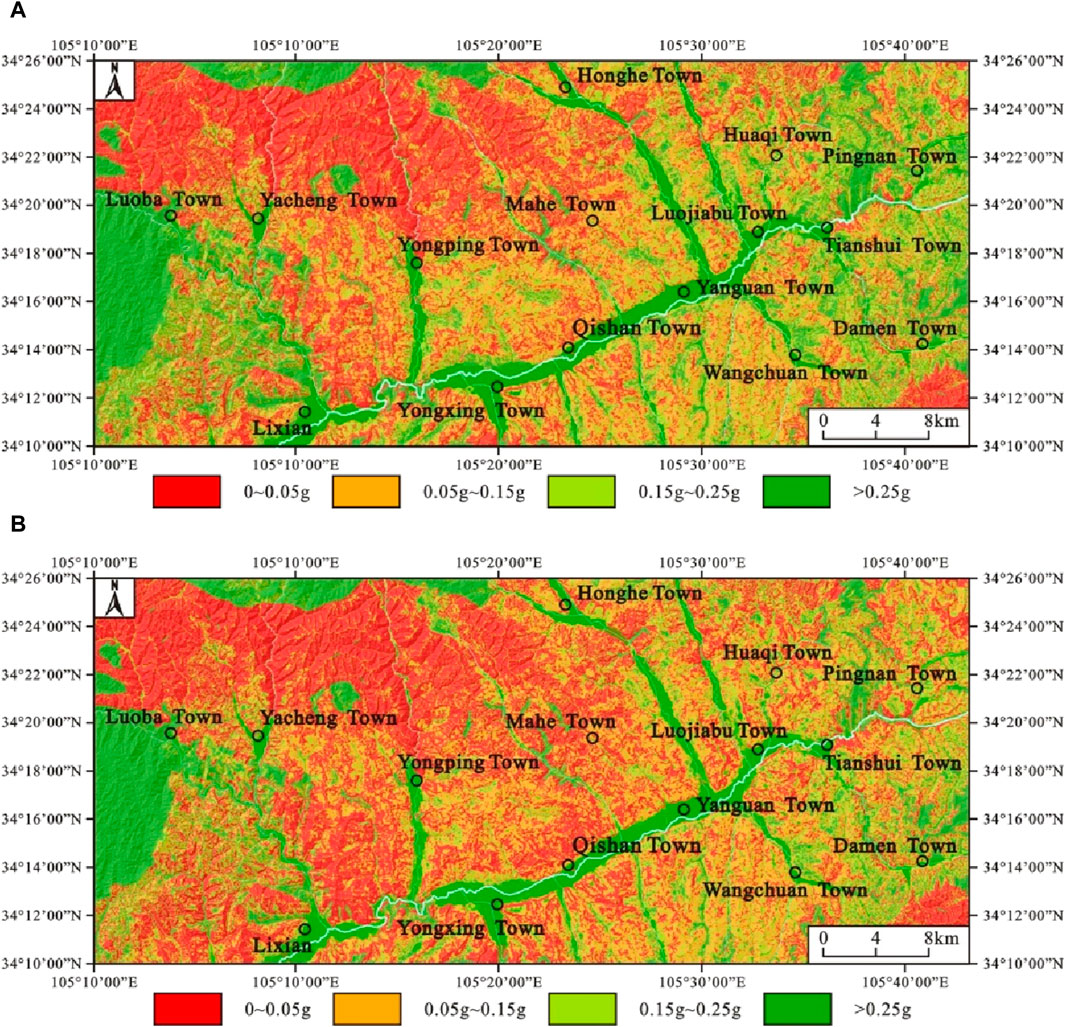
Figure 10. Distribution map of regional critical acceleration. (A) Newmark traditional model. (B) Newmark improved model.
4.3 Hazard assessment
According to the ground motion parameter zoning map under the condition of 10% exceeding probability in 50 years in the study area compiled by the Lanzhou Earthquake Research Institute of China Earthquake Administration, the Ia value in the study area is calculated by Formula (5). Substituting the Ia value and ac value into Formula (3), the Newmark cumulative displacement value of the study area under the condition of 10% exceeding probability in 50 years is obtained. According to specifications for the risk assessment of geological hazard (GB/T 40112-2021) and the research results of earthquake landslide hazard zoning (Jibson et al., 2000; Yang et al., 2021), the probability of the earthquake landslide occurrence is calculated according to formula (6). The earthquake landslide hazard level is divided into high-hazard areas (earthquake landslide occurrence probability is greater than 25%), medium-hazard areas (earthquake landslide occurrence probability is 15–25%), low-hazard areas (earthquake landslide occurrence probability is 5–15%), and extremely low-hazard areas (earthquake landslide occurrence probability less than 5%) (Figure 11).
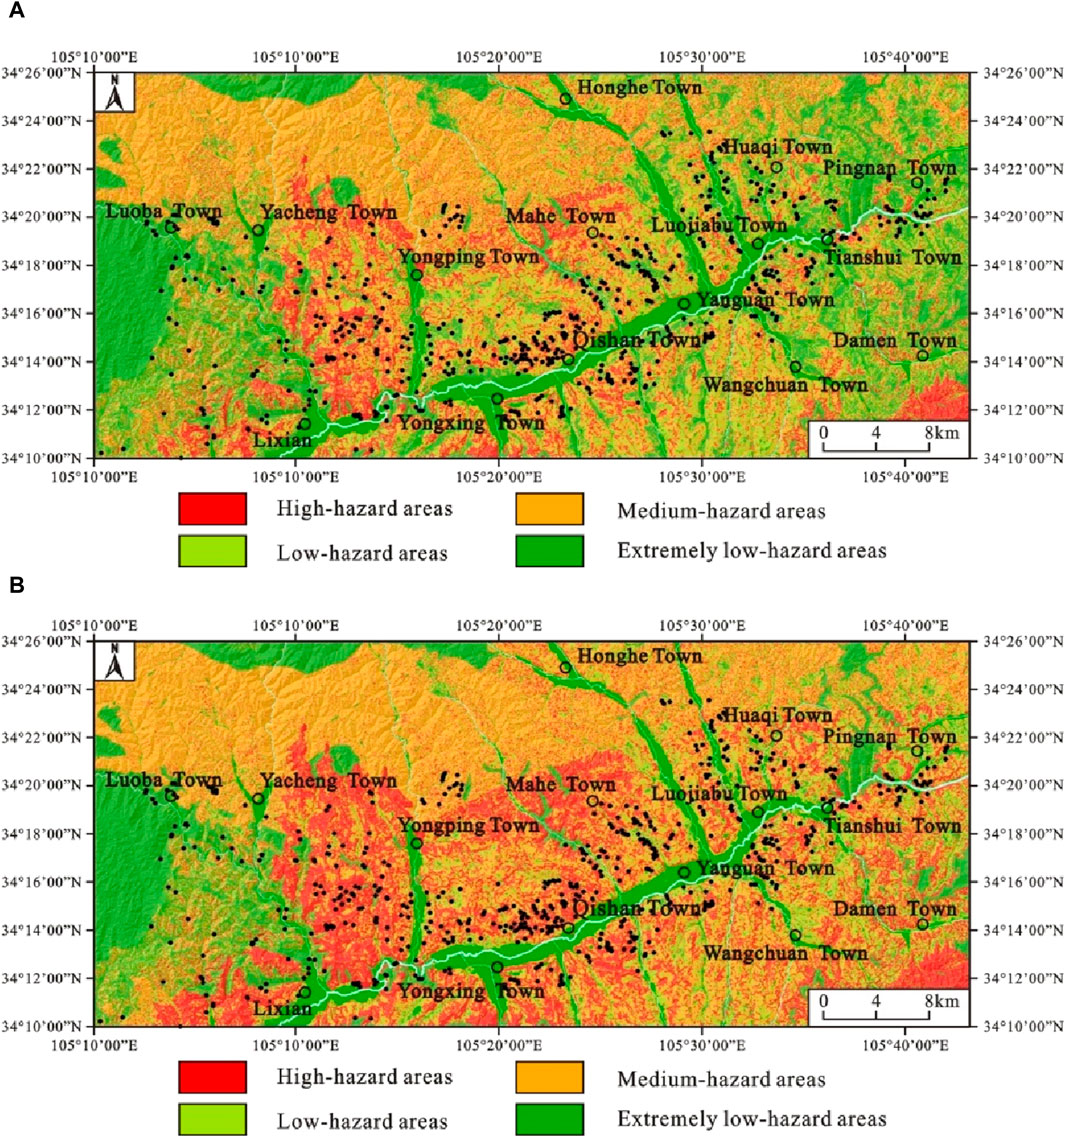
Figure 11. Hazard assessment map of earthquake landslide under the condition of 10% exceeding probability in 50 years. (A) Newmark traditional model. (B) Newmark improved model.
4.4 Comparative analysis
Through analysis and calculation, the statistical tables of landslide hazard assessment zoning with different evaluation methods are summarized (Table 3). It is found that the evaluation results of the two models are mainly medium-hazard areas and extremely low-hazard areas, followed by high-hazard areas, and finally low-hazard areas. Among them, the high-hazard areas calculated by the Newmark improved model considering the fault effect accounts for about 22.85% of the total areas of the study area, and the high-hazard areas calculated by the Newmark traditional model account for about 16.90% of the total areas of the study area. In the evaluation results of the two models, the existing landslides are concentrated in high-hazard areas and medium-hazard areas, and the landslide point density shows a gradual increase from extremely low-hazard areas to high-hazard areas. Among them, the landslide point density in the high-hazard areas calculated by the Newmark improved model considering the fault effect is relatively larger, up to 0.9417 point/km2. From Figures 10, 11, it can be seen that the critical acceleration value calculated in the upper side area of the fault in the study area, especially near the fault zone, is significantly lower than that before the improvement, which leads to a significant increase in the probability of landslide occurrence calculated in this area.
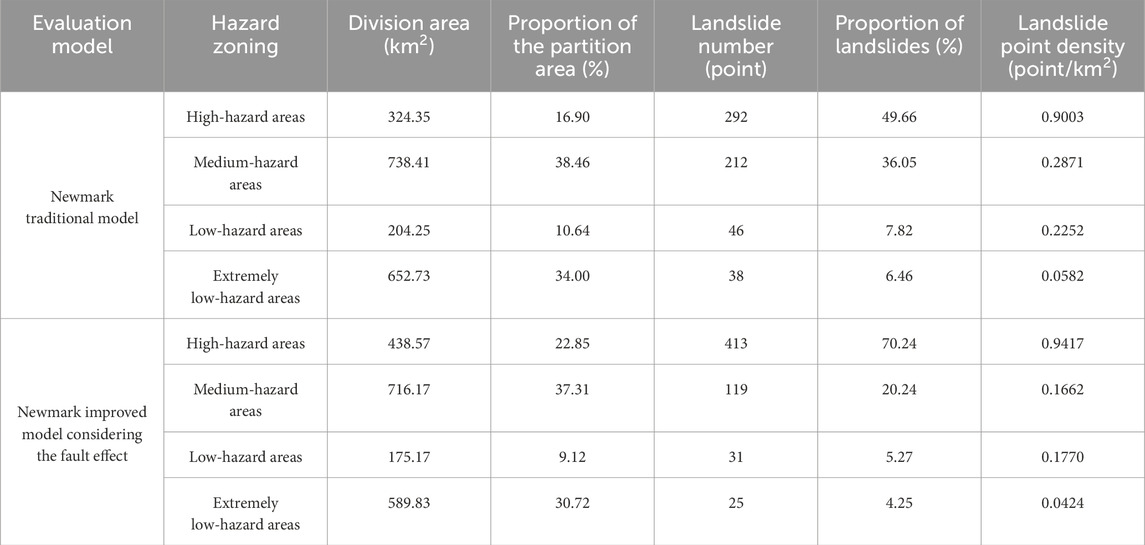
Table 3. Landslide hazard zoning summary table of different model evaluation methods.
In order to verify the scientificity and reliability of the model, the landslide hazard assessment results obtained by the above two models are tested by the ROC curve method and Kappa coefficient method, respectively. When using the ROC curve method to test, scholars generally use the area under ROC curve (AUC) as an important indicator to measure and compare the prediction accuracy of the model (Swets, 1988; Guo et al., 2023; Guo et al., 2024). When the AUC value is 0.5, the prediction results of the model have no practical value. When the AUC value is between 0.5 and 0.7, the accuracy of the model prediction results is relatively low. When the AUC value is between 0.7 and 0.9, the accuracy of the model prediction results is relatively high. When the AUC value is above 0.9, the accuracy of the model prediction results is very high. The Kappa coefficient method is a classification accuracy evaluation index based on the confusion matrix algorithm, which reflects the consistency between the observed values and the simulation results, also known as the consistency test (Lee and Pradhan, 2007). When the Kappa coefficient value is between 0.2 and 0.4, the consistency of the model prediction results is relatively low. When the Kappa coefficient value is between 0.4 and 0.6, the consistency of the model prediction results is moderate. When the Kappa coefficient value is between 0.6 and 0.8, the consistency of the model prediction results is relatively high. When the Kappa coefficient value is between 0.8 and 1, the consistency of the model prediction results is very high.
From Table 4 and Figure 12, it can be seen that the AUC value and Kappa coefficient value of the hazard area obtained by the Newmark improved model considering the correction coefficient of fault effect are 0.841 and 0.822, respectively, which are significantly higher than the calculated values of the Newmark traditional model, indicating that the improvement effect of the model is better. It is objectively proved that the advantage of using the Newmark improved model considering the correction coefficient of fault effect to evaluate the landslide hazard along the Lixian–Luojiabu fault zone in Gansu Province is more obvious.
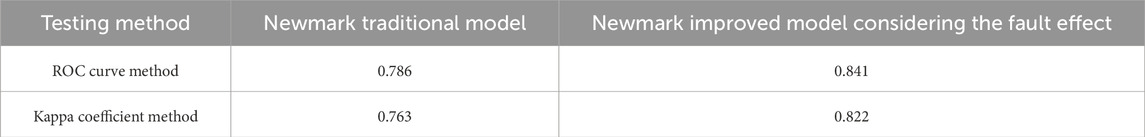
Table 4. Statistical table of AUC values and Kappa coefficient values of different models.
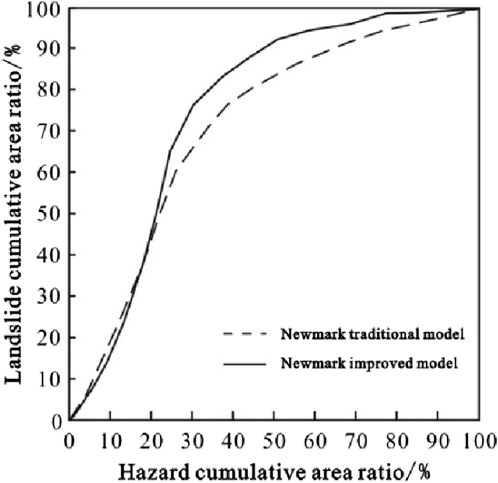
Figure 12. Comparison of ROC curves about different model evaluation methods.
5 Conclusion and future remarks
Taking the Lixian–Luojiabu fault zone in Gansu Province in China as the study area, based on the analysis of the research results of the correlation between landslide development and the fault zone, the concept of the fault effect correction coefficient was innovatively proposed, the value table of the fault effect correction coefficient along the Lixian–Luojiabu fault zone in Gansu Province was created, and the corresponding distribution map of the fault effect correction coefficient was drawn. On this basis, an improved Newmark model for the landslide hazard assessment along the fault zone was constructed. The earthquake landslide hazard assessment under the condition of 10% exceeding probability in 50 years was carried out by using the Newmark traditional model and Newmark improved model considering the fault effect, respectively. The evaluation results were compared and analyzed by the ROC curve method and Kappa coefficient method.
The results showed that the high-hazard areas calculated by the Newmark improved model considering the fault effect accounted for about 22.85% of the total areas of the study area, and the high-hazard areas calculated by the Newmark traditional model accounted for about 16.90% of the total areas of the study area. In the evaluation results of the two models, the existing landslides were concentrated in high-hazard areas and medium-hazard areas, and the landslide point density showed a gradual increase from extremely low-hazard areas to high-hazard areas. However, the landslide point density in the high-hazard areas calculated by the Newmark improved model considering the fault effect was relatively larger, up to 0.9417 point/km2. This is mainly because in the upper side area of the Lixian–Luojiabu fault, especially in the area near the fault zone, the fault effect correction coefficient is relatively larger, and the calculated critical acceleration value is significantly lower than that before the improvement, which leads to a significant increase in the probability of landslide occurrence calculated in this area. The AUC value and Kappa coefficient of the hazard zone obtained by the Newmark improved model were 0.841 and 0.822, respectively, which were significantly higher than the calculated values of the Newmark traditional model, indicating that the improvement effect of the model was better.
The Newmark improved model considering the fault effect fully considered the influence of distance from the fault zone and fault upper and lower sides' effect, and the research results can provide a new reference for the landslide hazard assessment along the fault zone. However, it is worth noting that the fault effect correction coefficient proposed in this paper only considered the two key factors, the distance from the fault zone and the relative position of the upper and lower sides, and whether other factors should be considered remains to be further studied. In addition, the improved model belongs to the mechanical analysis model, which takes limited geological background factors into consideration in the calculation process, which only considers the influence of the slope and engineering geological rock group, and does not analyze the existing landslide sample data. These shortcomings should be further remedied in future research work.
Data availability statement
The original contributions presented in the study are included in the article/Supplementary Material; further inquiries can be directed to the corresponding author.
Author contributions
WF: investigation, methodology, resources, writing–original draft, and writing–review and editing. YT: funding acquisition, investigation, resources, and writing–review and editing. HM: data curation, supervision, and writing–review and editing. BH: funding acquisition, validation, and writing–review and editing.
Funding
The author(s) declare that financial support was received for the research, authorship, and/or publication of this article. This research was supported by the Geological Survey Project of China Geological Survey (Nos 12120114035701, DD20190642, and DD20221739), the National Key R&D Program of China (No. 2023YFC3008401), and the Natural Science Basic Research Program of Shaanxi (No. 2023-JC-QN-0288).
Conflict of interest
The authors declare that the research was conducted in the absence of any commercial or financial relationships that could be construed as a potential conflict of interest.
Publisher’s note
All claims expressed in this article are solely those of the authors and do not necessarily represent those of their affiliated organizations, or those of the publisher, the editors, and the reviewers. Any product that may be evaluated in this article, or claim that may be made by its manufacturer, is not guaranteed or endorsed by the publisher.
References
Ambraseys, N. N., and Menu, J. M. (1988). Earthquake-induced ground displacements. Earthq. Eng. Struct. Dyn. 16, 985–1006. doi:10.1002/eqe.4290160704
Bai, Y. Z., and Xu, C. (2023). Qualitative analyses of correlations between strong ground motions of the three large earthquakes and landslide distributions. J. Earth Sci. 34 (2), 369–380. doi:10.1007/s12583-021-1496-x
Chen, G. F., Bartholomew, M., Liu, D. M., Cao, K., Feng, M. X., and Wang, D. (2022). Paleo-earthquakes along the Zheduotang fault, Xianshuihe fault system, eastern Tibet: implications for seismic hazard evaluation. J. Earth Sci. 33 (5), 1233–1245. doi:10.1007/s12583-022-1687-0
Chen, X. L., Shan, X. J., Zhang, L., Liu, C. G., Han, N. N., and Lan, J. (2019). Quick assessment of earthquake-triggered landslide hazards: a case study of the 2017 Ms 7.0 Jiuzhaigou earthquake. Earth Sci. Front. 26 (02), 312–320. doi:10.13745/j.esf.sf.2018.9.11
Chen, X. L., Yuan, R. M., and Yu, L. (2013). Applying the Newmark’s model to the assessment of earthquake-triggered landslides during the Lushan earthquake. Seismol. Geol. 235 (3), 661–670. doi:10.3969/j.issn.0253-4967.2013.03.019
Chen, X. L., Zhang, L., and Wang, M. M. (2018). Study on the distribution pattern of earthquake-triggered landslides based on seismic landslide susceptibility analysis: a case study of landslides triggered by the Ms 6.5 Ludian earthquake in 2014. Seismol. Geol. 40 (05), 1129–1139. doi:10.3969/j.issn.0253-4967.2018.05.012
Daniel, D., Rathje, E. M., and Jibson, R. W. (2013). The influence of different simplified sliding-block models and input parameters on regional predictions of seismic landslides triggered by the Northridge earthquake. Eng. Geol. 163, 41–54. doi:10.1016/j.enggeo.2013.05.015
Dunning, S. A., Mitchell, W. A., Rosser, N. J., and Petley, D. N. (2007). The Hattian Bala rock avalanche and associated landslides triggered by the Kashmir Earthquake of 8 October 2005. Eng. Geol. 93 (3-4), 130–144. doi:10.1016/j.enggeo.2007.07.003
Feng, W., Bi, Y. Q., Tang, Y. M., Zhang, L. Z., and Li, Z. G. (2021). Research on the distribution law of geological disasters and fault effect along the Lixian-Luojiabu fault zone in Gansu. J. Nat. Disasters 30 (02), 183–190. doi:10.13577/j.jnd.2021.0219
Guo, Z. Z., Chen, L. X., Yin, K. L., Shrestha, D. P., and Zhang, L. (2020). Quantitative risk assessment of slow-moving landslides from the viewpoint of decision-making: a case study of the Three Gorges Reservoir in China. Eng. Geol. 273, 105667. doi:10.1016/j.enggeo.2020.105667
Guo, Z. Z., Tian, B. X., He, J., Xu, C., Zeng, T. R., and Zhu, Y. H. (2023). Hazard assessment for regional typhoon-triggered landslides by using physically-based model – a case study from southeastern China. Georisk Assess. Manag. Risk Eng. Syst. Geohazards 17 (4), 740–754. doi:10.1080/17499518.2023.2188465
Guo, Z. Z., Tian, B. X., Zhu, Y. H., He, J., and Zhang, T. L. (2024). How do the landslide and non-landslide sampling strategies impact landslide susceptibility assessment? – a catchment-scale case study from China. J. Rock Mech. Geotechnical Eng. 16 (3), 877–894. doi:10.1016/j.jrmge.2023.07.026
Han, Z. J., Xiang, H. F., and Ran, Y. K. (2001). Activity analysis of Lixian-Luojiabu fault zone in the east boundary of Tibetan Plateau since the Late-Pleistocene. Seismol. Geol. 23 (1), 43–48. doi:10.3969/j.issn.0253-4967.2001.01.005
Huang, R. Q. (2009). Mechanism and geomechanical modes of landslide hazards triggered by Wenchuan 8.0 earthquake. Chin. J. Rock Mech. Eng. 28 (6), 1239–1249. doi:10.3321/j.issn:1000-6915.2009.06.021
Huang, R. Q., and Li, W. L. (2009). Fault effect analysis of geo-hazard triggered by Wenchuan earthquake. J. Eng. Geol. 17 (01), 19–28. doi:10.1016/S1874-8651(10)60080-4
Hürlimann, M., Guo, Z. Z., Puig-Polo, C., and Medina, V. (2022). Impacts of future climate and land cover changes on landslide susceptibility: regional scale modelling in the Val d’Aran region (Pyrenees, Spain). Landslides 19, 99–118. doi:10.1007/s10346-021-01775-6
Jibson, R. W., Harp, E. L., and Michael, J. A. (2000). A method for producing digital probabilistic seismic landslide hazard maps. Eng. Geol. 58 (3-4), 271–289. doi:10.1016/S0013-7952(00)00039-9
Lan, H. X., Li, L. P., Zhang, Y. S., Gao, X., and Liu, H. J. (2013). Risk assessment of debris flow in Yushu seismic area in China: a perspective for the reconstruction. Nat. Hazards Earth Syst. Sci. 13, 2957–2968. doi:10.5194/nhess-13-2957-2013
Lee, S., and Pradhan, B. (2007). Landslide hazard mapping at Selangor, Malaysia using frequency ratio and logistic regression models. Landslides 4 (1), 33–41. doi:10.1007/s10346-006-0047-y
Li, C. H., Guo, C. B., Zhang, X. J., Yan, Y. Q., Ni, J. W., and Zhao, W. B. (2023a). Rapid evaluation of earthquake-induced landslides by PGA and Arias intensity model: insights from the Luding Ms6.8 earthquake, Tibetan Plateau. Front. Earth Sci. 11, 1324773. doi:10.3389/feart.2023.1324773
Li, Y. W., Xu, L. R., Zhang, L. L., Lu, Z. Q., and Su, N. (2023b). Study on development patterns and susceptibility evaluation of coseismic landslides within mountainous regions influenced by strong earthquakes. Earth Sci. 48 (5), 1960–1976. doi:10.3799/dqkx.2022.224
Liu, Y., Qiu, H. J., Kamp, U., Wang, N. L., Wang, J. D., Huang, C., et al. (2024). Higher temperature sensitivity of retrogressive thaw slump activity in the Arctic compared to the Third Pole. Sci. Total Environ. 914, 170007. doi:10.1016/j.scitotenv.2024.170007
Ma, S. Y., and Xu, C. (2019). Applicability of two Newmark models in the assessment of coseismic landslide hazard and estimation of slope-failure probability: an example of the 2008 Wenchuan Mw 7.9 earthquake affected area. J. Earth Sci. 30 (05), 1020–1030. doi:10.1007/s12583-019-0874-0
Ma, S. Y., Xu, C., and Chen, X. L. (2023). Comparison of the effects of earthquake-triggered landslide emergency hazard assessment models: a case study of the Lushan earthquake with Mw 5.8 on June 1, 2022. Seismol. Geol. 45 (4), 896–913. doi:10.3969/j.issn.0253-4967.2023.04.006
Milesa, S. B., and Ho, C. L. (1999). Rigorous landslide hazard zonation using Newmark’s method and stochastic ground motion simulation. Soil Dyn. Earthq. Eng. 18 (4), 305–323. doi:10.1016/s0267-7261(98)00048-7
Newmark, N. M. (1965). Effects of earthquakes on dams and embankments. Geotechnique 15 (2), 139–160. doi:10.1680/geot.1965.15.2.139
Peng, J. B., Ma, R. Y., Fan, W., Men, Y. M., Lin, H. Z., and Deng, Y. H. (2009). Science contemplation for wenchuan earthquake of 12 may, 2008. J. Earth Sci. Environ. 31 (01), 1–29. doi:10.3969/j.issn.1672-6561.2009.01.001
Qiu, H. J., Su, L. L., Tang, B. Z., Yang, D. D., Ullah, M., Zhu, Y. R., et al. (2024). The effect of location and geometric properties of landslides caused by rainstorms and earthquakes. Earth Surf. Process. Landforms, 1–13. doi:10.1002/esp.5816
Rathje, E. M., and Saygili, G. (2008). Probabilistic seismic hazard analysis for the sliding displacement of slopes: scalar and vector approaches. J. Geotechnical Eng. 134 (6), 804–814. doi:10.1061/(asce)1090-0241(2008)134:6(804)
Roberto, R. (2000). Seismically induced landslide displacements: a predictive model. Eng. Geol. 58, 337–351. doi:10.1016/S0013-7952(00)00042-9
Schuster, R. L., and Alford, D. (2004). Usoi landslide dam and lake sarez, pamir mountains, Tajikistan. Environ. Eng. Geoscience 10 (2), 151–168. doi:10.2113/10.2.151
Shinoda, M., and Miyata, Y. (2017). Regional landslide susceptibility following the mid niigata prefecture earthquake in 2004 with newmark’s sliding block analysis. Landslides 14 (6), 1887–1899. doi:10.1007/s10346-017-0833-8
Sidorin, A. Y. (2020). On the 70th anniversary of the 1949 Khait earthquake in Tajikistan. Seism. Instrum. 56 (4), 491–500. doi:10.3103/S0747923920040088
Swets, J. A. (1988). Measuring the accuracy of diagnostic systems. Science 240 (4857), 1285–1293. doi:10.1126/science.3287615
Wang, L. M., Guo, A. N., Wang, P., and Ma, X. Y. (2020). Characteristics and revelation of great haiyuan earthquake disaster. City Disaster Reduct. 06, 43–53. doi:10.3969/j.issn.1671-0495.2020.06.007
Wang, T., Wu, S. R., Shi, J. S., and Xin, P. (2013). Case Study on rapid assessment of regional seismic landslide hazard based on simplified newmark displacement model: Wenchuan Ms 8.0 earthquake. J. Eng. Geol. 21 (1), 16–24. doi:10.3969/j.issn.1004-9665.2013.01.003
Wang, T., Wu, S. R., Shi, J. S., and Xin, P. (2015). Concepts and mechanical assessment method for seismic landslide hazard: a review. J. Eng. Geol. 23 (1), 93–104. doi:10.13544/j.cnki.jeg.2015.01.014
Wang, Y. (2018). “Analysis of correlation between natural earthquakes and fault zones,”. [dissertation/ doctoral thesis] (Beijing: China University of Geosciences).
Wilson, R. C., and Keefer, D. K. (1983). Dynamic analysis of a slope failure from the 6 August 1979 Coyote Lake, California, earthquake. Bull. Seismol. Soc. Am. 73 (3), 863–877. doi:10.1785/BSSA0730030863
Wilson, R. C., and Keefer, D. K. (1985). “Predicting area limits of earthquake induced landsliding,” in Geological Survey Professional Paper. 1360, 317–345.
Wu, S. R., and Wang, H. B. (2008). Key theory and method of landslide hazard risk assessments. Geol. Bull. China 27 (11), 1764–1770. doi:10.3969/j.issn.1671-2552.2008.11.002
Xu, C., Tian, Y. Y., Ma, S. Y., Xu, X. W., Zhou, B. G., Wu, X. Y., et al. (2018). Inventory and spatial distribution of landslides in Ⅸ-Ⅺ high intensity areas of 1920 Haiyuan (China) M8.5 earthquake. J. Eng. Geol. 26 (05), 1188–1195. doi:10.13544/j.cnki.jeg.2018110
Xu, C., Xu, X. W., Yao, X., and Dai, F. C. (2014). Three (nearly) complete inventories of landslides triggered by the May 12, 2008 Wenchuan Mw 7.9 earthquake of China and their spatial distribution statistical analysis. Landslides 11 (3), 441–461. doi:10.1007/s10346-013-0404-6
Xu, G. X. (2010). “Research on the dynamic responses and permanent displacement of slope under earthquake,”. [dissertation/ doctoral thesis] (Chengdu: Southwest Jiaotong University).
Yang, D. D., Qiu, H. J., Ye, B. F., Liu, Y., Zhang, J. J., and Zhu, Y. R. (2023). Distribution and recurrence of warming-induced retrogressive thaw slumps on the central Qinghai-Tibet plateau. J. Geophys. Res. Earth Surf. 128, e2022JF007047. doi:10.1029/2022JF007047
Yang, X. P., Feng, X. J., Huang, X. N., Song, F. M., Li, G. Y., Chen, X. C., et al. (2015). The late quaternary activity characteristics of the Lixian-Luojiabu fault: a discussion on the seismogenic mechanism of the Lixian M8 earthquake in 1654. Chin. J. Geophys. 58 (2), 504–519. doi:10.6038/cjg20150214
Yang, Z. H., Guo, C. B., Wu, R. A., Zhong, N., and Ren, S. S. (2021). Predicting seismic landslide hazard in the Batang fault zone of the Qinghai-Tibet Plateau. Hydrogeology Eng. Geol. 48 (05), 91–101. doi:10.16030/j.cnki.issn.1000-3665.202009024
Yang, Z. H., Zhang, Y. S., Guo, C. B., and Du, G. L. (2017). Landslide hazard rapid assessment in the Ms 8.1 Nepal earthquake-impacted area, based on Newmark model. J. Geomechanics 23 (1), 115–124. doi:10.3969/j.issn.1006-6616.2017.01.007
Ye, B. F., Qiu, H. J., Tang, B. Z., Liu, Y., Liu, Z. J., Jiang, X. Y., et al. (2024). Creep deformation monitoring of landslides in a reservoir area. J. Hydrology 632, 130905. doi:10.1016/j.jhydrol.2024.130905
Yin, Y. P. (2008). Researches on the geohazards triggered by Wenchuan earthquake, Sichuan. J. Eng. Geol. 16 (04), 433–444. doi:10.3969/j.issn.1004-9665.2008.04.001
Keywords: hazard assessment, Newmark model, fault effect, fault zone landslide, earthquake, Lixian–Luojiabu fault
Citation: Feng W, Tang Y, Ma H and Hong B (2024) Landslide hazard assessment of the fault zone considering the fault effect: a case study of the Lixian–Luojiabu fault zone in Gansu Province (China). Front. Earth Sci. 12:1420653. doi: 10.3389/feart.2024.1420653
Received: 20 April 2024; Accepted: 07 May 2024;
Published: 28 May 2024.
Edited by:
Haijun Qiu, Northwest University, ChinaReviewed by:
Yongjian Bai, Chengdu Center of China Geological Survey, ChinaZizheng Guo, Hebei University of Technology, China
Copyright © 2024 Feng, Tang, Ma and Hong. This is an open-access article distributed under the terms of the Creative Commons Attribution License (CC BY). The use, distribution or reproduction in other forums is permitted, provided the original author(s) and the copyright owner(s) are credited and that the original publication in this journal is cited, in accordance with accepted academic practice. No use, distribution or reproduction is permitted which does not comply with these terms.
*Correspondence: Yaming Tang, tangyaming@mail.cgs.gov.cn