 Xu Liang
- Shaanxi Xiaobaodang Mining Co., Ltd., Yulin, China
Microseismic (MS) source location is an integral component of MS technology and essential to understanding the rock failure mechanism and avoiding potential geological hazards in underground rock excavation. However, accurate location remains challenging owing to the complex geological conditions and unknown rock failure mechanisms. In this study, a novel location framework was developed to locate the MS source positions and their uncertainties based on probabilistic programming. Probabilistic programming was utilized to determine the coordinates of the MS source and its variation using the Markov Chain Monte Carlo (MCMC) method based on the waveform equation. A classical benchmark problem was utilized to verify and illustrate the developed framework. The developed framework can not only locate the position of the MS source but also determine its variation due to the uncertainty during the monitoring and excavation. The located MS source is in agreement with the actual positions. The results show that the developed framework is a scientific, accurate, reasonable, and promising tool for the location of MS sources. Then, the developed framework was applied to locate the position of the blasting in a practical mine. This further proved that the developed framework could locate the MS source, providing an excellent uncertainty analysis tool for underground rock excavation.
1 Introduction
Microseismic (MS) technology is an essential tool that has been widely applied to rock engineering fields, such as mines, tunnels, reservoir characterization, CO2 geological sequestrations, and radioactive waste repositories (Luo and Hatherly, 1998; Shapiro et al., 2002; Hirata et al., 2007; Jiang et al., 2010; Maxwell et al., 2010; Lagos and Velis, 2018; Wang et al., 2021). The spatiotemporal data of MS events can provide a significant amount of information concerning the surrounding rock mass, including geomechanical deformation, fracture initiation, and failure (Xia et al., 2020; Li and Xu, 2021). The interpretation of the MS event depends on the MS source location during monitoring in underground rock excavation. The location of the MS event is the first step and most valuable feature of the MS technique owing to its ability to delineate unstable regions. Knowledge of the MS location allows scientists to investigate the spatiotemporal information concerning the stress redistribution and energy release of rock fracture (Si et al., 2020). Accurately determining the position of the MS event helps further our understanding of the rock failure mechanism, which is of great interest not only for adjusting design and construction schema but also for avoiding potential engineering hazards such as rockburst (Xia et al., 2019; Zhang et al., 2023). Therefore, developing an efficient and accurate location technology is an integral part of MS technology for rock engineering. Various location approaches have been developed to determine the MS source location in the past decades (Pavlis and Booker, 1983; Thurber, 1985; Pavlis, 1986; Husen et al., 1999; Waldhauser and Ellsworth, 2000; Reyes-Montes et al., 2005; Feng et al., 2017; Lagos and Velis, 2018; Ma et al., 2019; Zhou et al., 2021; Zhao et al., 2023).
MS source location is a classic inverse problem in underground excavation. The Geiger method and several linear methods are the most popular and widely used in practical applications (Geiger, 1912). However, the convergence of these methods depends on selecting an iterative initial value. Therefore, optimal technology was adopted to locate the MS source by minimizing the difference between the observed and computed arrival times. The traditional gradient-based optimization technology is not suitable owing to the complexity of MS events in underground rock excavation. In addition, the computational complexity increases because of the application of the second-order partial derivatives. Fortunately, the optimal intelligent technology, such as genetic algorithm, particle swarm optimization (PSO), and simulated annealing, provide an excellent tool for locating the MS source through global optimization performance (Sambridge and Gallagher, 1993; Pei et al., 2009; Bisrat et al., 2012; Alavi et al., 2016; Ray et al., 2021; Wang et al., 2021). A competitive PSO was developed to avoid the local extrema and improve the location accuracy (Luu et al., 2018). The neighborhood algorithm was applied in the three-dimensional MS source location based on P and S wave travel times in hydrocarbon reservoirs (Oye and Roth, 2003). The differential evolution was used to improve the accuracy and stability of the location based on Bayesian theory (Song et al., 2013). PSO was used to improve the computational efficiency of the location algorithm. The stochastic optimization algorithm was utilized to accelerate the identification of the MS location based on the waveform-based location method (Li et al., 2019). The performance and feasibility of the location methods were studied and analyzed using PSO (Feng et al., 2017).
In the past decades, various location methods have been developed to improve the efficiency and accuracy of MS technology in rock engineering. Unfortunately, the current location methods are limited and cannot handle uncertainty, which is an intrinsic property of the engineering system (Wang and Ge, 2008; Hassani et al., 2018; Duan et al., 2022). Uncertainty is common in MS events because of the complexity of MS events and geological conditions in rock engineering, and it is an inevitable factor in locating the MS source. In this study, a novel location framework was developed to determine the position of the MS source and deal with the uncertainty during MS monitoring and excavation. Probabilistic programming was adopted to characterize and handle the uncertainty based on the Bayesian theory and MS data.
Probabilistic programming, which exists at the intersection of the Bayesian inference, machine learning, and process-based modeling, is a novel technology that handles uncertainty based on probabilistic inference and computer programming (Zhao et al., 2021). Probabilistic models and inference algorithms are the main parts of probabilistic programming. PyMC3 is an innovative probabilistic programming framework, open-source in nature, featuring an intuitive, readable, and potent syntax reminiscent of the natural language statisticians employ to define models (Salvatier et al., 2016). The remainder of this study is organized as follows. First, the theory and idea of probabilistic programming are introduced in Section 2. Probabilistic programming was used to handle the uncertainty during the MS source location. The idea and procedure of the developed framework are presented in brief. Then, the developed framework is verified and illustrated using a numerical example in Section 3. In Section 4, the developed framework is applied to a practical mine. Concluding remarks are given in Section 5.
2 Probabilistic programming
2.1 Probabilistic programming
Probabilistic programming is a versatile interdisciplinary methodology grounded in Bayesian statistics, machine learning, and process-based modeling. This approach encompasses a probabilistic model alongside an inference algorithm, constructing a novel framework for probabilistic reasoning, enabling predictions and inferences about unknown entities from observed data. It utilizes computer programs to represent probabilistic models. The data simulator, designed to generate various data sets based on a probabilistic model utilizing a random number generator, was developed using probabilistic programming (Ghahramani, 2015). Constructing recursion and control flow statements is straightforward with probabilistic programming, whereas achieving these functionalities in a finite graph can be challenging or even impossible. Probabilistic programming can handle any computable probability distribution.
In an engineering system, probabilistic programming can infer unknown variables in the model based on the observed information. The uncertainty inherent in the system model is encapsulated by the probability distributions employed in the simulator. The inference algorithm can then condition the output of this program on the observation data and automatically infer the property of the unknown mechanical behavior of the engineering system and other uncertain model parameters. There are a growing number of probabilistic programming models such as BUGS (Lunn et al., 2000) and AutoBayes (Fischer and Schumann, 2003). In this study, PyMC3 was adopted to locate the MS source and characterize its uncertainty.
2.2 Probabilistic programming
Well-known Bayesian theory enables one to locate the position of the MS source based on MS data. According to Bayesian theory (Ghahramani, 2015), the probabilistic model can be expressed as follows:
where x is the initial information of MS event and y is the observed data. p(x) denotes the prior probability distribution of the MS events, which gives the initial information of MS event x before including the new MS information.
When conducting Bayesian inferences, we must determine the full posterior joint distribution over a set of random variables. For example, given the information of the input variables, we were able to locate the MS source in this study. Assuming that observations (MS data) are conditionally independent of a given x, the updated posterior distribution is obtained by solving:
where
The Markov chain is a mathematical model used to describe a sequence of events where the probability of each event depends only on the state of the previous event. Markov chain can be used to assess system reliability and predict failure probabilities. Monte Carlo integration is known as numerical integration for approximating the definite integral of a function using random numbers. The MCMC method is a powerful tool for determining the integration (Eq. 2) by combining the Markov chain and Monte Carlo integration. Markov chains sample from the distribution whose integral is targeted for approximation, while the Monte Carlo integration performs the approximation. The construction of a Markov chain ultimately converges to the posterior distribution
2.3 PyMC3
Various probabilistic programming methods have been proposed in the past decades. The No-U-Turn Sampler (NUTS) (Hoffman and Gelman, 2014) and Hamiltonian Monte Carlo (HMC) (Duane et al., 1987) represent advancements in Markov chain Monte Carlo (MCMC) sampling technology, adept at handling high-dimensional and intricate posterior distributions. These methods enable the fitting of numerous complex models without necessitating specialized knowledge of fitting techniques. By leveraging gradient information, HMC and NUTS achieve faster convergence compared to traditional sampling methods, especially advantageous for larger models like the MS waveform model. PyMC3 stands out as an innovative, open-source probabilistic programming toolkit featuring an intuitive, readable, yet potent syntax akin to the natural language statisticians employ to articulate models (Song et al., 2013). PyMC3 was utilized to address general Bayesian statistical inference and prediction tasks.
3 MS source location and uncertainty quantification
Accurate location of the MS source is essential for understanding the rock failure mechanism and avoiding potential geological hazards in rock engineering (Li et al., 2023). The location of the MS source depends on the monitoring system, properties of rock mass media, geological conditions, and the travel time and velocity of the P wave. For the monitoring system, the number, layout and sensitivity of sensors have influence on the MS location. The more sensors with high sensitivity and the more reasonably they are arranged, the positioning accuracy can be improved much better. The location identification relies on the mechanical model, which consists of rock properties. Accurate rock parameters can establish a more accurate velocity model. Faults and other geological conditions will also affect the propagation of waves. The travel time and velocity are essential for the calculation model, which directly affect the location accuracy. However, significant uncertainty remains in the above factors. It is impossible to reduce the uncertainty entirely (Sitharam et al., 2015). Therefore, there is an ideal and reasonable method for rationally quantifying and evaluating uncertainty during the location of the MS source. In this research, a novel location framework was created to manage uncertainty through the use of probabilistic programming.
3.1 The location method of MS source
In underground rock excavation, n MS sensors were utilized to constitute a spatial monitoring structure. xi, yi, and zi are the coordinates of the ith MS sensor, respectively. x0, y0, and z0 denote the coordinates of the MS source. The traveling equation can be determined based on the coordinates of the MS sensor and corresponding arrival time. The MS positions can be obtained based on the following equation groups.
where ti denotes the arrival time of the P wave, t is the seismogenic time of the MS source, and v denotes the velocity of the P wave from the MS source to the sensor in the rock mass. The wave velocity can be measured on-site using a wave tester, or it can be calculated by obtaining the mechanical parameters of the specimen through indoor testing and then calculating the wave velocity. Considering the uncertainty of the wave velocity due to uneven rock properties distribution, the wave velocity in this study was viewed as the parameter to be inverted. In general, the MS source positions were determined based on the difference between the observed and theoretical travel time of the P wave. The target function can be gained based on Eq. 3 as follows:
where f denotes the residual of time, and m denotes the norm. In this study, m equals 2 and corresponds to an L2 norm approach. Ri is the distance between the MS source and ith sensor.
In general, optimization technology has been used to locate the MS source by minimizing the target function (Eq. 4). However, uncertainty is inevitable owing to the complexity of the geological and MS monitoring conditions. In this study, probabilistic programming was utilized to determine the MS source location with uncertainty.
3.2 The uncertainty-based MS source location
To accurately locate the positions of the MS source, computing the travel time and location method, which includes the uncertainty due to the complexity of geological conditions, are essential. This study employed probabilistic programming to articulate and delineate the positional uncertainty of the MS source, thereby enriching the comprehension of the MS event. Leveraging prior knowledge, MS data, and a methodology for MS source localization, probabilistic programming was utilized to quantify the positional uncertainty of the MS source. Bayesian inference served as the mechanism for quantifying the uncertainty of the MS location based on the monitored data. The prior information was derived from empirical knowledge and investigations conducted at the project site. The MS data (observation data) were obtained from the MS monitoring system. The MS location method was utilized to determine the location coordinates. The positional uncertainty of the MS source can be evaluated based on the monitored MS data.
The MS sensor obtained the waveform information that traveled from the MS source. To assess the uncertainty, Eq. 4 was treated as the traveling equation for locating MS source position x0, y0, and z0 and determining MS wave velocity v. In this study, the predicted residual of time f was regarded as the normal distributed observations with mean value fµ to determine the traveling equation of MS source coordinates x0, y0, and z0 and MS wave velocity v based on the travel time of each sensor. The predicted residual of time is expressed by Eq. 6:
where µf is determined by Eqs. 4, 5, and σf is determined based on the MS technology. A normal distribution was applied to fitting MS source coordinates x0, y0, and z0 and MS wave velocity v, corresponding to weak information for the actual values. MS source coordinates according to a normal distribution are expressed by Eqs 7–10.
Once the aforementioned model was defined within the PyMC3 software, the subsequent step involved estimating the posterior distribution for the unknown MS source coordinates x0, y0, and z0 within the residual of the time model (Eq. 4). MCMC sampling techniques were employed to quantify the uncertainty related to the MS events. The mean and standard variance of MS source coordinates x0, y0, and z0 were located based on the MS information obtained by the sensor. Thus, the developed framework located the MS source and quantified its uncertainty.
3.3 The procedure
The developed location method was utilized to locate the positions of the MS source and determine its uncertainty. Below outlines the primary procedure of the developed location framework.
Step 1: Collect the information of MS monitoring system, project data, geological conditions, etc.
Step 2: Pick the travel time at each sensor using the MS technology.
Step 3: Construct the traveling equation of the MS wave based on the corresponding MS system.
Step 4: Build the equation for the time residual based on the traveling equation of the MS wave.
Step 5: Determine the statistical feature and its parameters for the MS source coordinates and wave velocity using the MS monitoring system and engineering information.
Step 6: Implement Bayesian inference and MCMC using PyMC3.
Step 7: Locate the coordinates of the MS source and its uncertainty.
Step 8: Further update the coordinates of the MS source and its uncertainty by repeating Steps 5–7 if new MS data are obtained.
4 Verification
In this section, an MS location system consisting of 12 sensors was adopted to verify and illustrate the developed uncertainty location framework (Figure 1). Table 1 lists the coordinates of the 12 sensors in the monitoring space, which cover the range 1,000 m × 500 m × 300 m (Lü et al., 2013). The velocity of the MS P wave (v) was 4.5 km/s in this rock medium, and the seismogenic time of the MS source (t) was 5 ms. We assumed that there were 6 MS sources in this example (Figure 1). The positions of six MS sources and their corresponding arrival times are listed in Tables 2, 3. MS sources 1–4 were located in the monitoring space, which consisted of 12 sensors. MS sources 5 and 6 were located out of the monitoring space (Figure 1).
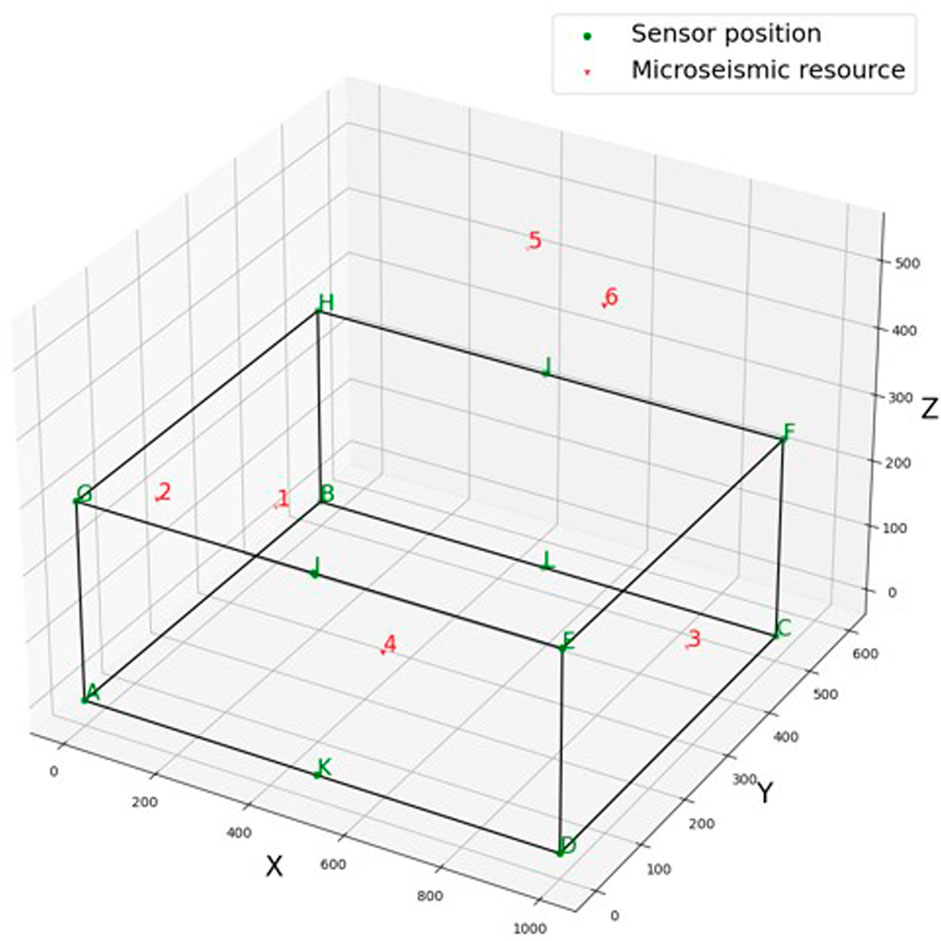
Figure 1. The position of the sensor and MS sources.
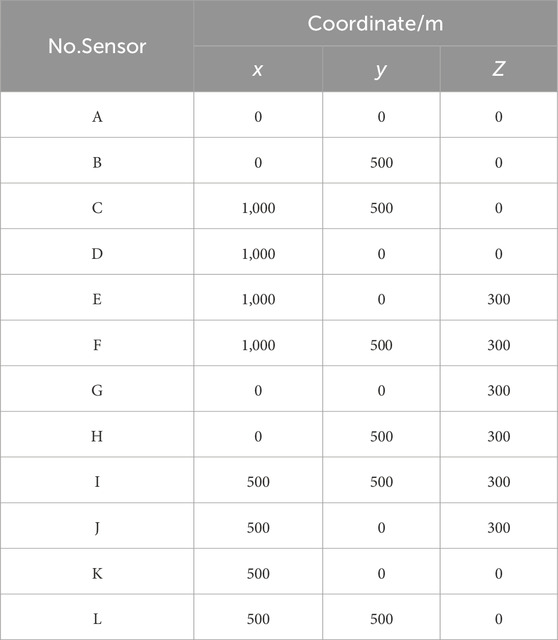
Table 1. Coordinates of the monitoring system sensors.
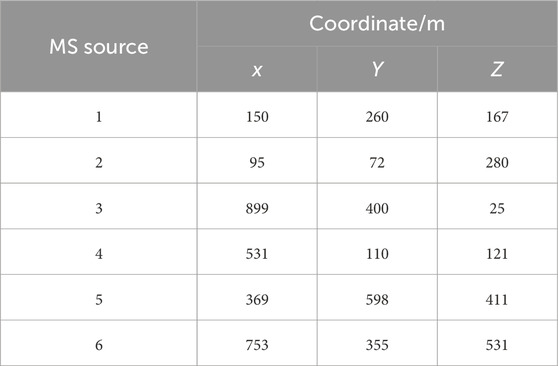
Table 2. Coordinates of the MS sources.
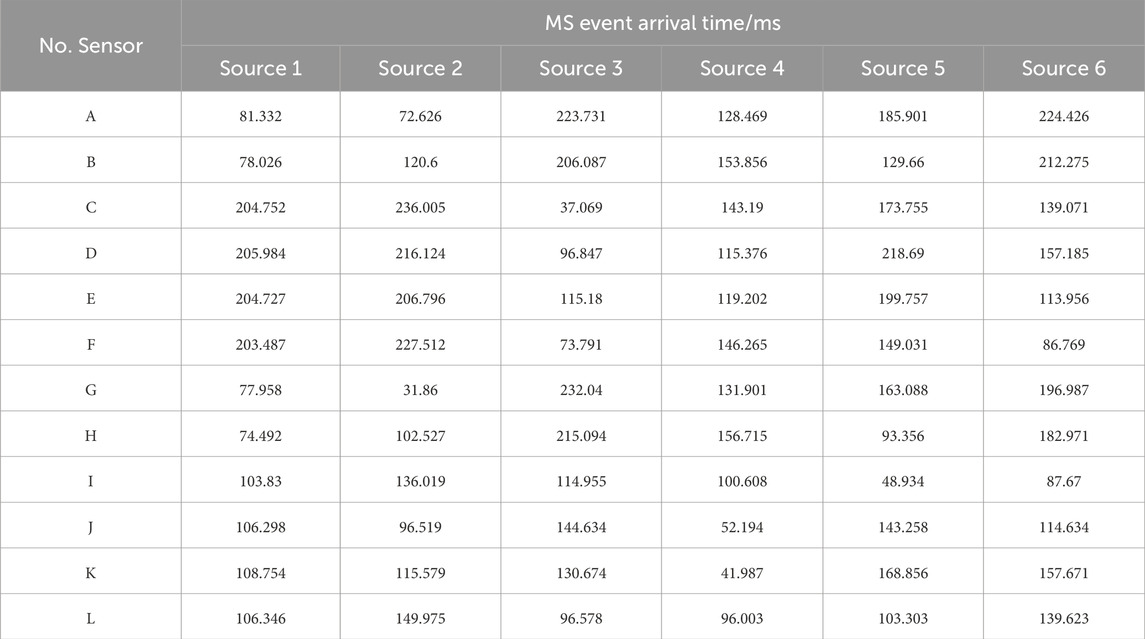
Table 3. Arrival time at each sensor.
4.1 Determination of MS source and its uncertainty
The developed location framework determined the positions of the six MS sources. Table 4 lists the coordinates determined by the uncertainty location method. It is obvious that the mean of the determined coordinates agrees well with the actual positions. The maximum relative error falls below 3%. The actual space position is extremely close to the positions determined by the developed framework (Figure 2). The developed framework determines the positions of the MS source (MS sources 1–4) in the enclosure monitoring space and recognizes MS sources 5 and 6 located outside the enclosure monitoring space. This further proved that the developed location framework could feasibly locate the MS source in rock engineering.
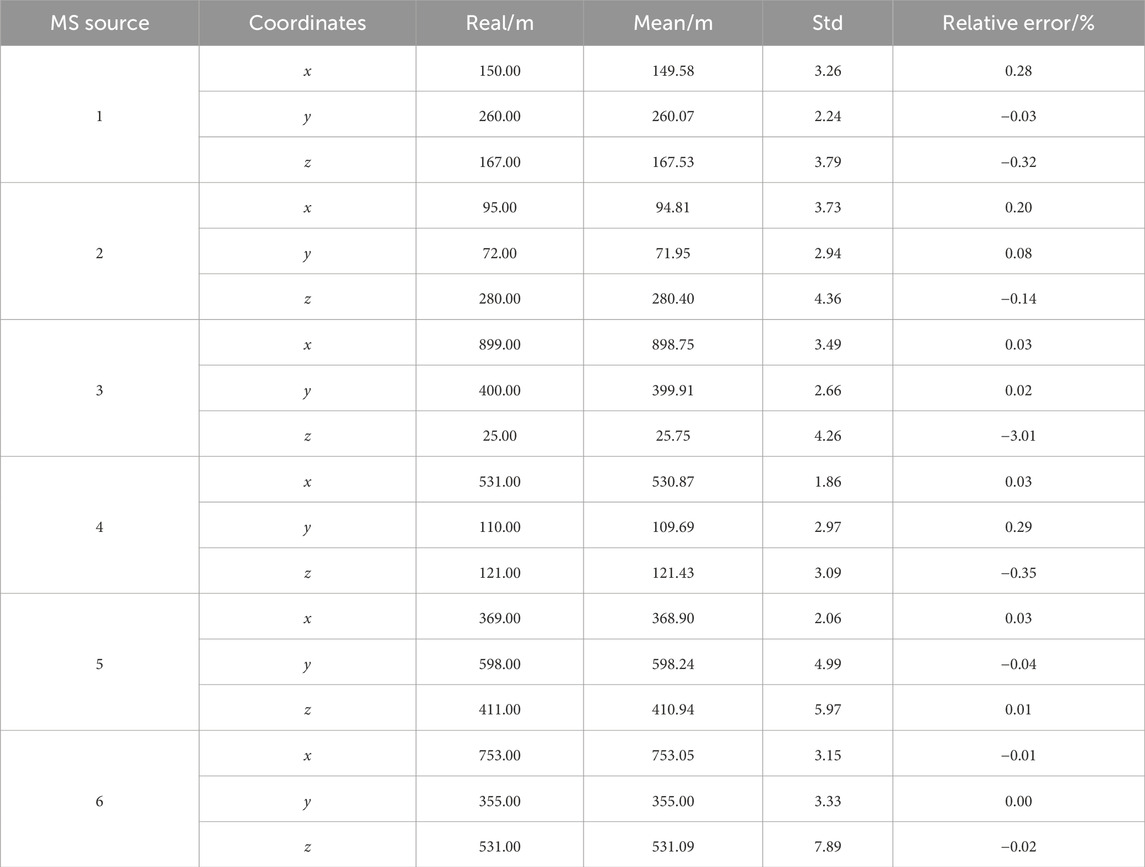
Table 4. Determined positions of MS sources.
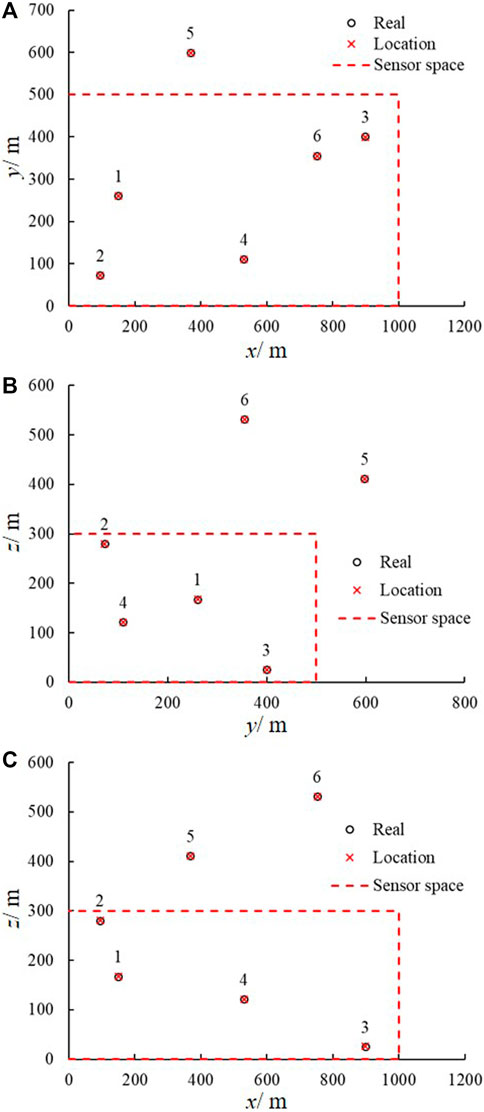
Figure 2. Determined positions and their comparison with the real position. (A) y-x coordinate. (B) z-y coordinate. (C) z-x coordinate.
Uncertainty and random error are unavoidable in the location of MS sources owing to the complexity in rock engineering. The traditional location method neglects the uncertainty and error to obtain a determinative position, which is inconsistent with practical engineering. The developed framework obtains the mean positions of the MS source and determines its uncertainty (Table 4). Figures 3, 4 show the wave velocity and coordinate distributions of the MS source. For MS source 1, Figure 5 shows the located position and uncertainty in space using the developed framework. The developed framework can determine the MS wave velocity, which agrees with the actual wave velocity of 4.5 km/s. The relative error is less than 1%. The located mean position is nearly identical to the real MS source. Moreover, the established framework also has the capability to assess the uncertainty of positions resulting from the intricate nature of geological media, monitored errors, and computational models. Figure 6 shows the sample traces using the MCMC. There is approximately a 10 m and 0.2 km/s plausible span for a significant change in positions and wave velocity, but a narrower span contains most of the probability mass.
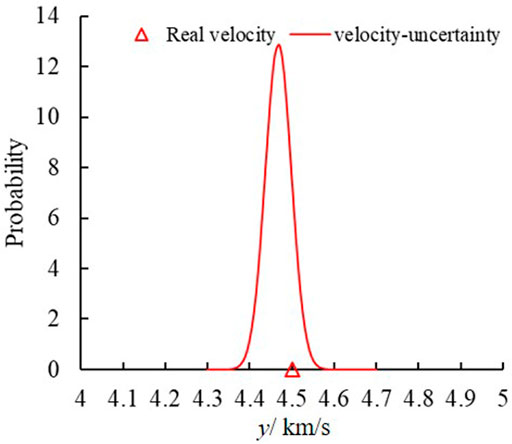
Figure 3. Comparison between real and determined velocity.
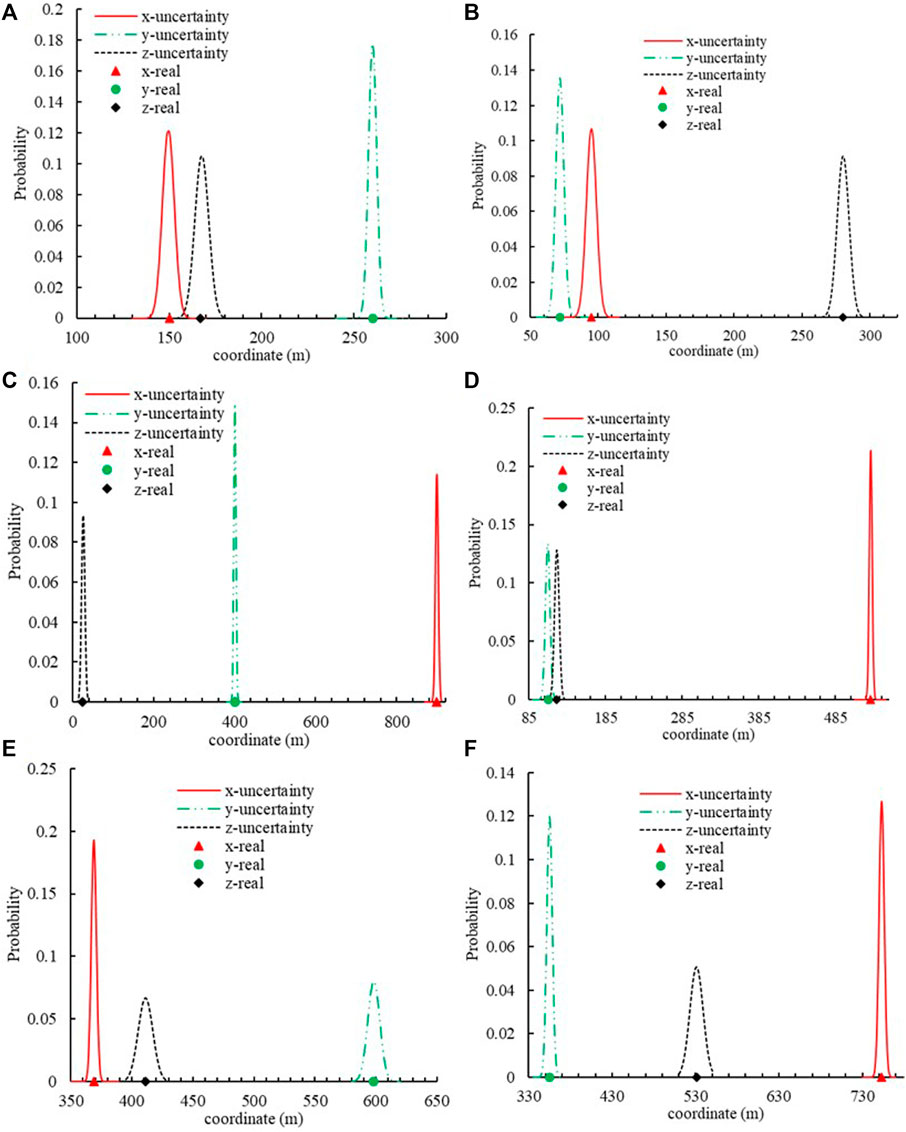
Figure 4. Position x, y, z coordinate uncertainty and their comparison with the real position. (A) MS source 1. (B) MS source 2. (C) MS source 3. (D) MS source 4. (E) MS source 5. (F) MS source 6.
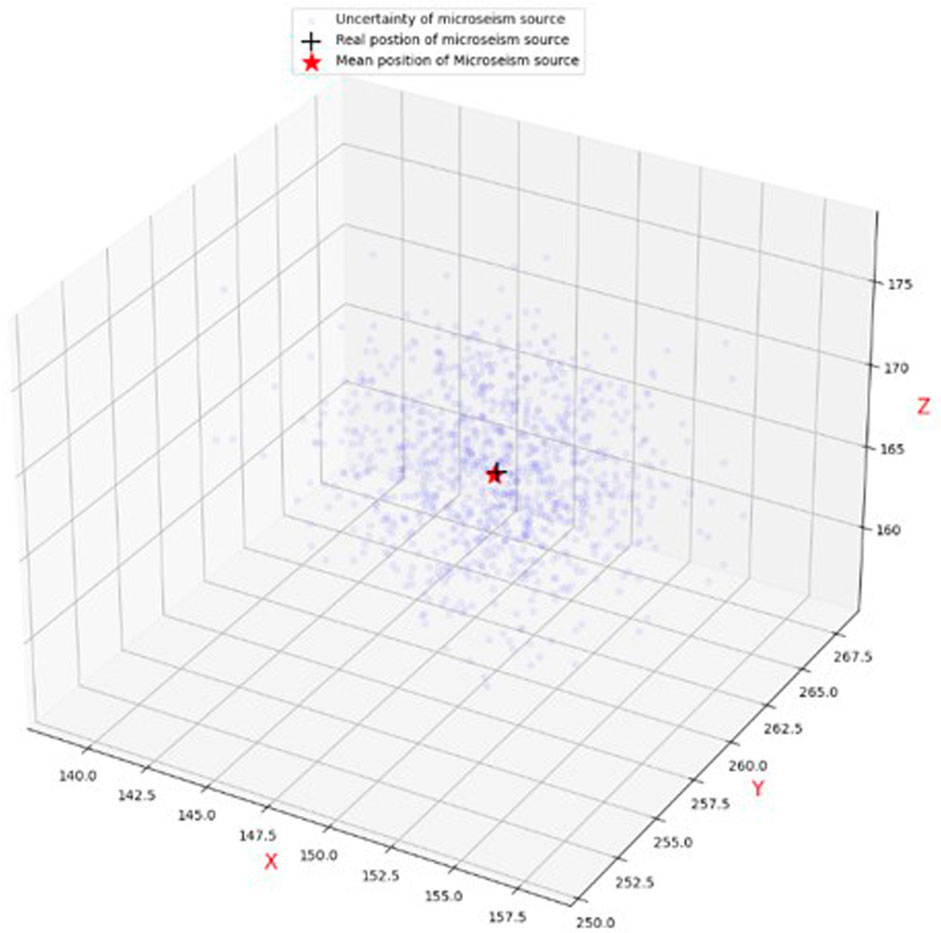
Figure 5. Uncertainty location and their comparison with the real position.
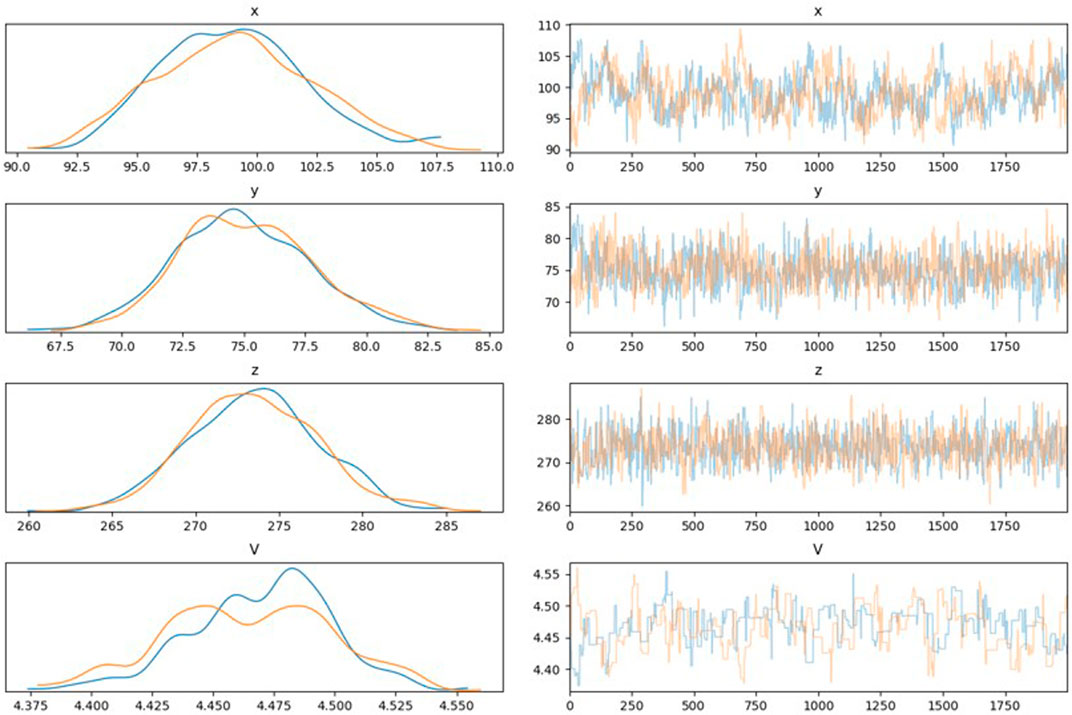
Figure 6. Trace distribution of samples based on MCMC.
4.2 Affection of distribution
In this study, probabilistic programming was utilized to determine the MS source locations and their uncertainty based on MCMC. The prior information is essential to the MCMC algorithm. The normal and uniform distribution of prior information was adopted. Figure 7 compares the actual and determined positions by the developed framework using the different prior information distribution. The determined mean position of MS source based on the normal and uniform distribution agrees well with the actual positions of the six MS sources. In other words, the developed framework is robust to the prior information and does not depend on the prior distribution. Figure 8 shows the uncertainty of the MS source positions using the different prior distributions (normal and uniform). The results show that the prior distribution does not affect the uncertainty of the MS source positions. It further proved that the developed framework is robust. This is important to practical rock engineering because of the complexity, uncertainty, and fuzzy.
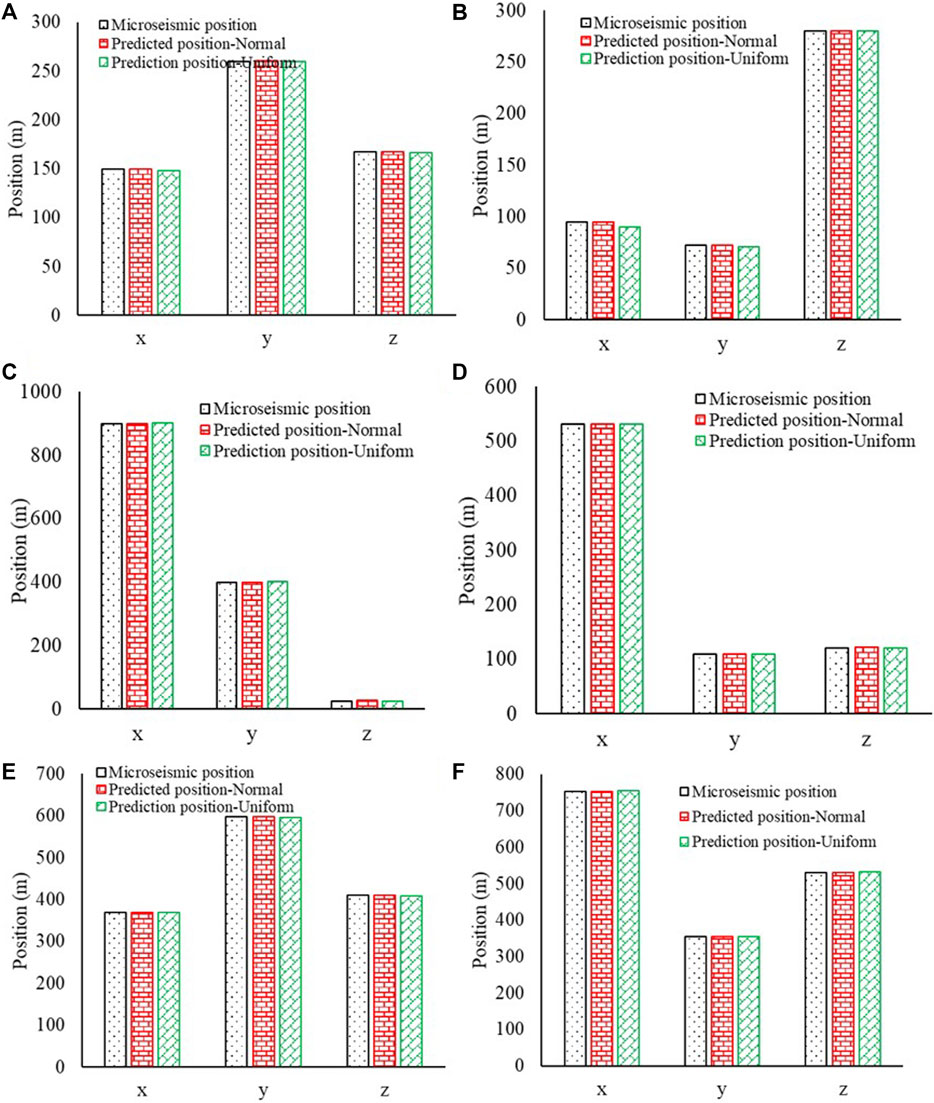
Figure 7. Determined positions based the different prior distributions for 6 MS source. (A) MS source 1. (B) MS source 2. (C) MS source 3. (D) MS source 4. (E) MS source 5. (F) MS source 6.
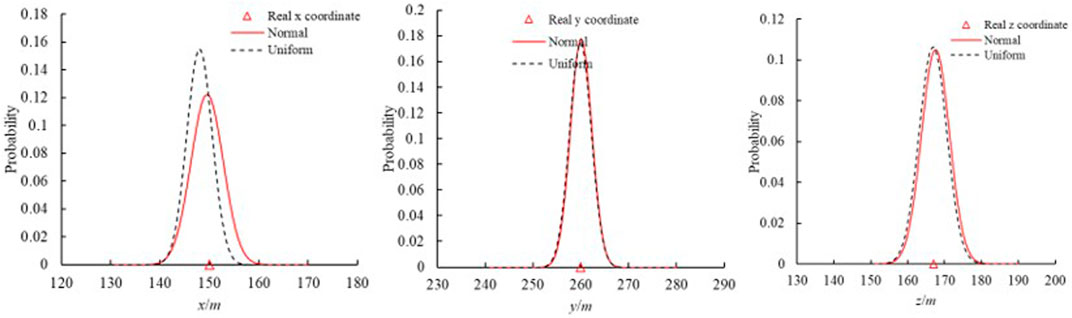
Figure 8. Uncertainty location based the different prior distributions.
4.3 Affection of initial value
Various optimal technologies have been adopted to locate the MS source. However, the location result depends on the initial value of the optimal algorithm, and the selection of the initial value is difficult in practical application. The initial position selection affects the location accuracy and hinders the optimal algorithm application in locating MS source. In this study, the six different initial positions illustrate the developed framework for the six MS sources. Table 5 lists the six different initial positions and their range. Figure 9 shows the MS sources and their uncertainties at different initial positions using the developed framework for MS source 1. It is clear that the developed framework does not depend on the initial location selection. The initial location selection does not affect the results. Furthermore, the developed framework can locate the position of the MS source in the more extensive range (Range 1). In practical engineering, the MS source is unknown and only has a rough range. Therefore, the developed framework has good performance in practical engineering.
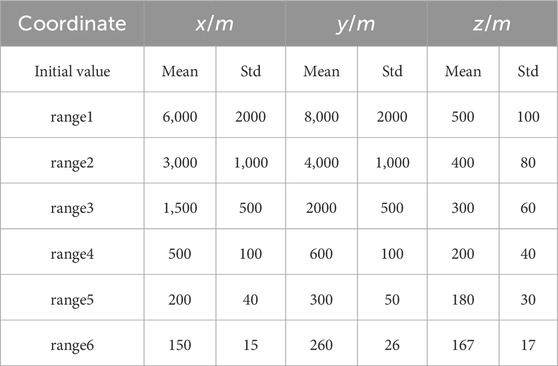
Table 5. Different initial positions and ranges.
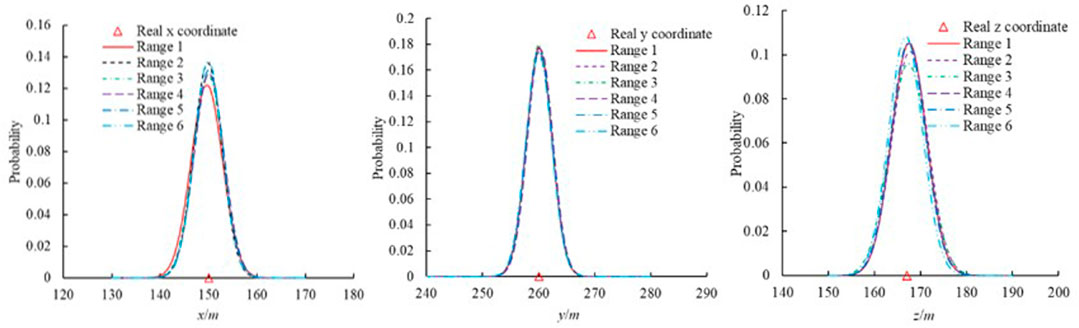
Figure 9. MS sources and their uncertainties at different initial positions.
4.4 Affection of the sensor number
The number of sensors is integral to the MS monitoring system and directly influences the location accuracy and precision. The number and position of the sensors are essential for locating the MS source. In this study, the position comparison was implemented based on the different numbers and positions of the sensors. Figure 10 shows the MS source and its uncertainty using different numbers of sensor and combinations. The results show that the location obtained by the 12 sensors is generally more accurate than that obtained by eight sensors. With the increase in the number of sensors, the location accuracy is normally enhanced. The sensor positions have also affected the MS source location. The number of sensors should be maximized in practical application, and the positions should be determined based on the engineering conditions.
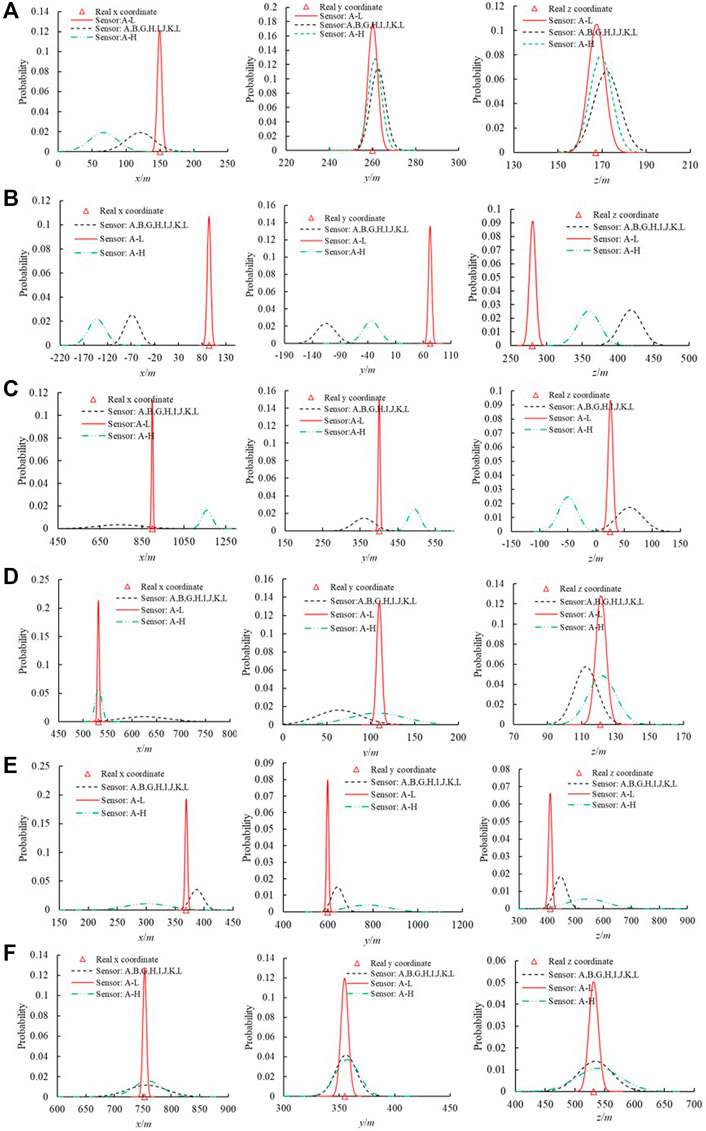
Figure 10. MS sources and their uncertainties using different numbers of sensors. (A) MS source 1. (B) MS source 2. (C) MS source 3. (D) MS source 4. (E) MS source 5. (F) MS source 6.
5 Application
The developed location framework was applied to the Shizhuyuan Polymetallic Mine (Lin et al., 2010). Since Shizhuyuan Polymetallic Mine adopted the sublevel drilling and stage room mining method, the underground mined-out area (room) has not been backfilled owing to various reasons, leaving a pillar ore volume of approximately 60% and a huge mined-out area of approximately 300 × 104 m2. During pillar mining from the northwest to southeast corner, stress concentration and mining ground pressure activities led to higher stress fields caused by the stress redistribution, and more rockburst and MS phenomena occurred. To monitor MS events during mining, an MS monitoring system was installed on 10 November 2008. The MS system monitors the ore body in the volume range of roughly 600 m × 600 m × 200 m and adopts the 30-channel uniaxial acceleration sensor with the largest number of channels in China, which can realize fast data transmission, analysis and preservation, automatic event positioning, and source parameter analysis.
An artificial blasting positioning test was carried out, and the artificial focal point was selected on 11 November 2008. The sensors measured and recorded the blasting coordinates on site. The blasting was conducted, and the ground monitoring personnel obtained the blasting location in the system on time. A total of eight sensors obtained the blasting waveform and arrival time (Table 6). Figure 11 shows the positions of the sensors and artificial blasting source.
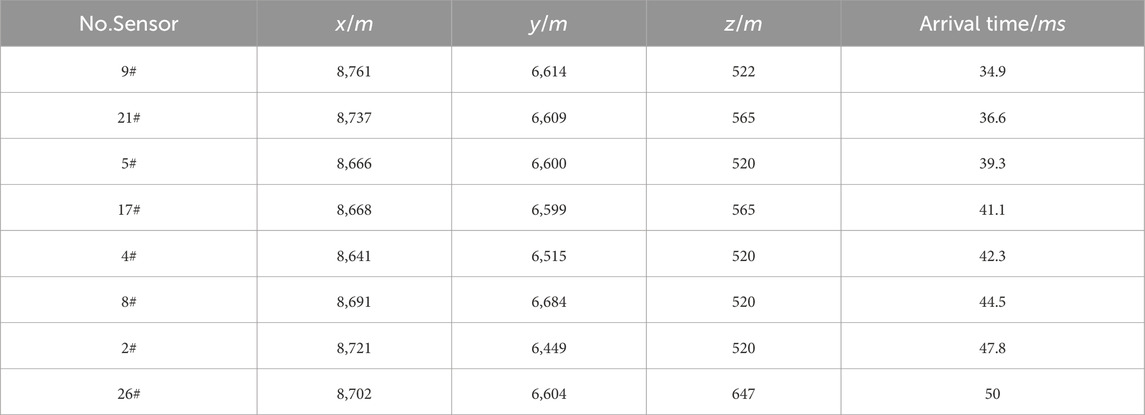
Table 6. Positions and arrival times of the sensors.
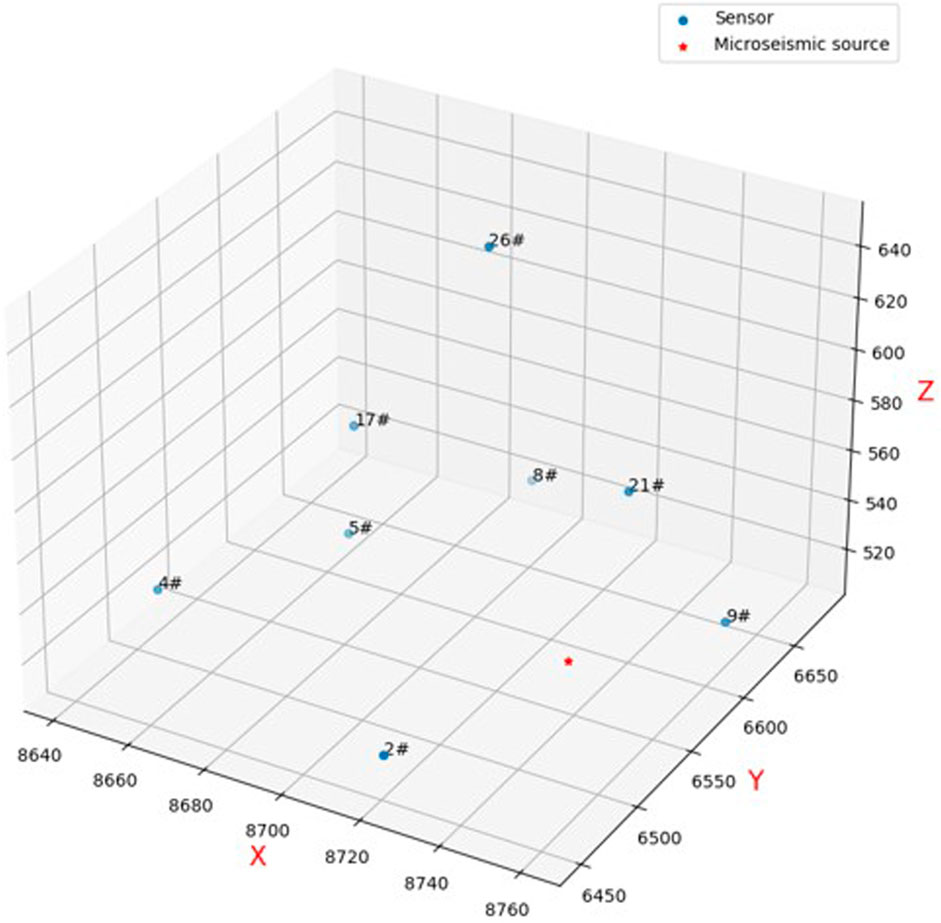
Figure 11. Positions of sensors and the artificial blasting source.
Once the arrival time of each sensor was obtained, the developed framework was used to locate the MS source. For the practical underground, the MS wave velocity is uncertain and unknown in the rock mass owing to the complexity of geological conditions. Lin et al. (2010) located the MS source based on the Geiger method for a 5 km/s wave velocity, and the error was 4.49 m. In this study, the developed framework was used to locate the MS source and determine the uncertainty. The error was 3.75 m, lower than that of the Geiger method based on the determined mean positions (Figure 12). However, this is not in line with engineering practice because the MS wave velocity is not certain. Thus, the developed framework was adopted to locate the MS source based on the uncertainty of the MS wave velocity. Figure 12 shows the comparison of artificial blasting sources located based on the constant and uncertain velocity. The error based on uncertain velocity was 4.917 m, slightly larger than the error based on the constant velocity. However, the developed framework located the MS source and its uncertainty, and the located coordinates were close to the actual artificial blasting sources. Thus, the developed framework can locate the MS source while the MS wave velocity is unknown.
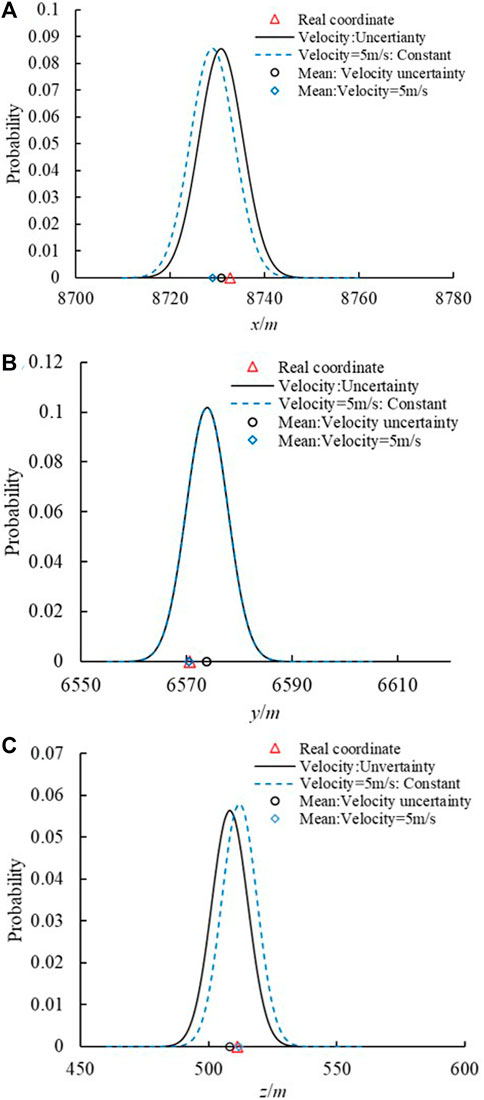
Figure 12. Uncertainty distribution of the predicted coordinates. (A) x coordinate. (B) y coordinate. (C) z coordinate.
Figure 13 shows the distribution of the MS wave velocity using the developed framework. Figure 14 shows the comparison of the MS source located by the developed framework, linear group method, and Geiger method. The developed framework is better than the linear group method and is close to the actual and predicted MS source locations determined by the Geiger method. The location error (4.917 m) is larger than that of the Geiger method (4.49 m) using MCMC. The findings demonstrate that the constructed framework is capable of pinpointing the MS source. Moreover, the developed framework can determine the variation of MS source positions. As we know, underground engineering is very complex, and many uncertainty factors influence the location identification. Uncertainty is an intrinsic property of the MS event in underground engineering. Therefore, the developed framework can characterize the MS event well and capture the uncertainty of the MS information. It is consistent with the uncertainty and actual situation of the underground engineering. Figure 15 shows the sample traces using the MCMC. There is a span of approximately 1.5 km/s and 20 m that is larger than the above numerical example. Thus, it is difficult to locate the MS source owing to the complexity and uncertainty of the practical underground excavation. However, a narrower span contains most of the probability mass using the developed framework. This further proves that the developed framework can locate the MS source and capture the uncertainty in practical underground rock excavation.
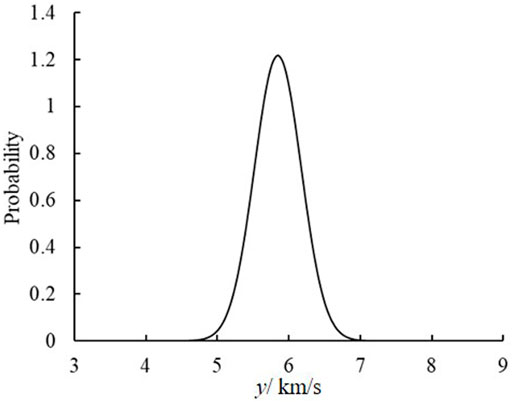
Figure 13. Uncertainty of the MS wave velocity.
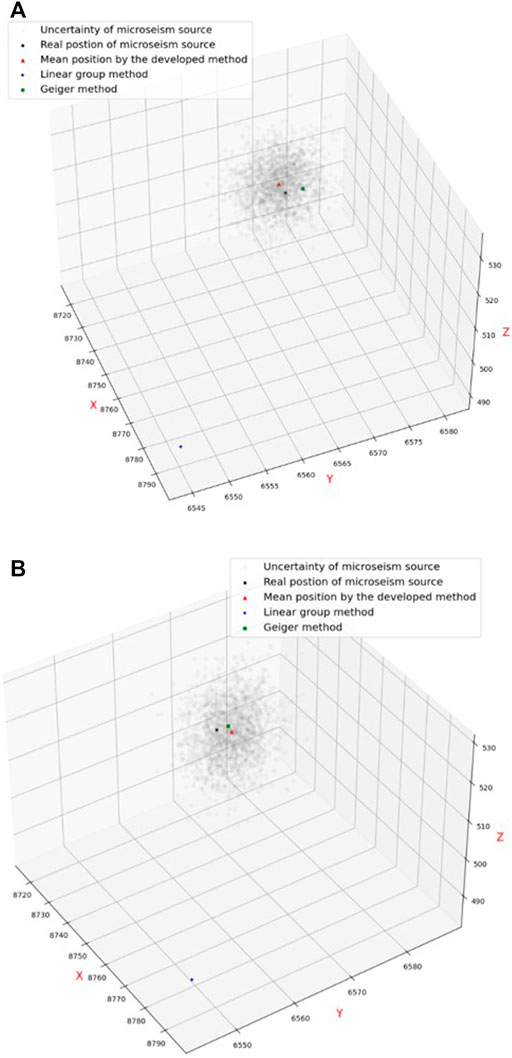
Figure 14. Coordinate comparison between the real and predicted source locations using different methods. (A) Constant velocity. (B) Uncertainty velocity.
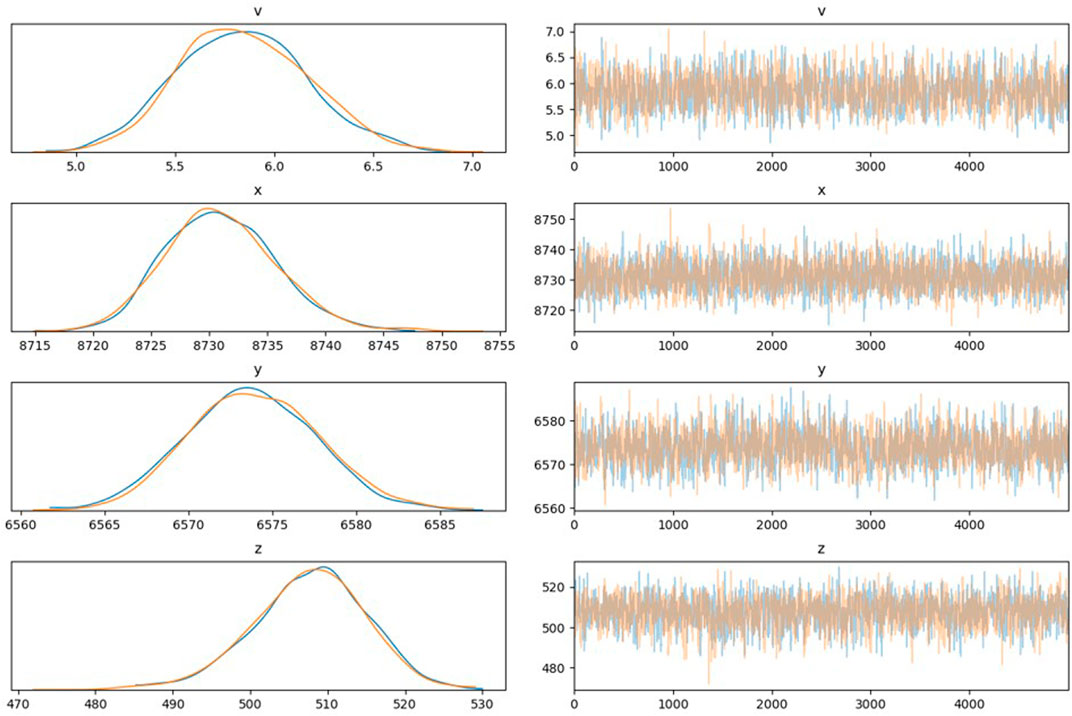
Figure 15. Sample traces based on the uncertain MS wave velocity.
There are two main types of fracture monitoring: indirect monitoring and direct monitoring. The MS monitoring, AE (acoustic emissions) monitoring, displacement and stress monitoring all belong to the indirect monitoring. Indirect monitoring is a non-destructive method of fracture monitoring. Direct monitoring is a method of monitoring fractures by directly observing the fracture surface, such as visual inspection. For example, Zhang et al. (2023) explored the borehole observation and borehole stress test to investigate the fracture distribution and damage during the first mining process. The actual observations can also be conducted and combined on-site to verify and increase the accuracy of the fracture location.
6 Conclusion
In this study, an innovative location framework was devised for identifying the MS source through probabilistic programming. A classical benchmark problem and underground application were used to verify and illustrate the accuracy and feasibility of the method. The locations of the MS sources and their associated uncertainties were established using data gathered from the MS monitoring system. The results show that the developed framework accurately determined the MS source and scientifically captured the uncertainty of the MS events. The following conclusions were drawn.
(1) Location of the MS source is an integral part of the MS monitoring system. The appropriate and accurate location of the MS source is essential for understanding the rock failure mechanism and avoiding potential geological hazards. The developed location framework provides an excellent tool for locating the positions of MS sources accurately.
(2) Uncertainty is an intrinsic feature of underground MS events. Appropriate characterization of uncertainty is essential for locating the MS event and understanding the engineering phenomenon. The developed location framework is a robust method for quantifying the uncertainty of MS events.
(3) The accuracy of the location relies on the configuration of the sensor array, the velocity equation utilized, and the method of location determination. Employing a greater number of sensors significantly enhances the accuracy of the location. Nevertheless, due to the constrained underground space in rock engineering, the number and spatial arrangement of sensors may not entirely encompass the MS area. The developed framework is not sensitive to the positions of the sensor, and it is essential for the complex and practical underground.
(4) In the traditional optimal location method, the location of the MS source depends on the selection of its initial position. However, it is difficult to determine the initial positions due to the complexity of the MS event. The developed framework can avoid selecting the initial MS source and accurately locate the position of MS events.
(5) The prior information of MS events is essential for determining the proper location. However, this knowledge is insufficient due to geological complexity. The developed framework provides an excellent, robust, global location method for the MS event.
Data availability statement
The original contributions presented in the study are included in the article/supplementary material, further inquiries can be directed to the corresponding author.
Author contributions
XL: Investigation, Methodology, Writing–original draft, Writing–review and editing.
Funding
The author(s) declare that financial support was received for the research, authorship, and/or publication of this article. This study is sponsored in part by the Natural Science Foundation of Shandong Province, China under grant ZR2022ME198, to which the authors are very grateful.
Conflict of interest
Author XL was employed by Shaanxi Xiaobaodang Mining Co., Ltd.
Publisher’s note
All claims expressed in this article are solely those of the authors and do not necessarily represent those of their affiliated organizations, or those of the publisher, the editors and the reviewers. Any product that may be evaluated in this article, or claim that may be made by its manufacturer, is not guaranteed or endorsed by the publisher.
References
Alavi, H., Gandomi, H., and Lary, J. (2016). Progress of machine learning in geosciences: preface. Geosci. Front. 7 (1), 1–2. doi:10.1016/j.gsf.2015.10.006
Bisrat, S., DeShon, H. R., and Rowe, C. (2012). Microseismic swarm activity in the New Madrid seismic zone. Bull. Seismol. Soc. Am. 102 (3), 1167–1178. doi:10.1785/0120100315
Duan, Y., Luo, X., Si, G., and Canbulat, I. (2022). Seismic source location using the shortest path method based on boundary discretisation scheme for microseismic monitoring in underground mines. Int. J. Rock Mech. Min. Sci. 149, 104982. doi:10.1016/j.ijrmms.2021.104982
Duane, S., Kennedy, A. D., Pendleton, B. J., and Roweth, D. (1987). Hybrid Monte Carlo. Phys. Lett. B 195 (2), 216–222. doi:10.1016/0370-2693(87)91197-x
Feng, G.-L., Feng, X.-T., Chen, B.-R., and Xiao, Y.-X. (2017). Performance and feasibility analysis of two microseismic location methods used in tunnel engineering. Tunn. Undergr. Space Technol. 63, 183–193. doi:10.1016/j.tust.2017.01.006
Fischer, B., and Schumann, J. (2003). AutoBayes: a system for generating data analysis programs from statistical models. J. Funct. Program. 13 (3), 483–508. doi:10.1017/s0956796802004562
Geiger, L. (1912). Probability method for the determination of earthquake epicentres from the arrival time only. Bull. St. Louis Univ. 8, 60.
Ghahramani, Z. (2015). Probabilistic machine learning and artificial intelligence. Nature 521 (7553), 452–459. doi:10.1038/nature14541
Hassani, H., Hloušek, F., Alexandrakis, C., and Buske, S. (2018). Migration-based microseismic event location in the Schlema-Alberoda mining area. Int. J. Rock Mech. Min. Sci. 110, 161–167. doi:10.1016/j.ijrmms.2018.08.002
Hirata, A., Kameoka, Y., and Hirano, T. (2007). Safety management based on detection of possible rock bursts by AE monitoring during tunnel excavation. Rock Mech. Rock Eng. 40, 563–576. doi:10.1007/s00603-006-0122-7
Hoffman, M. D., and Gelman, A. (2014). The No-U-Turn sampler: adaptively setting path lengths in Hamiltonian Monte Carlo. J. Mach. Learn. Res. 15 (1), 1593–1623.
Husen, S., Kissling, E., Flueh, E., and Asch, G. (1999). Accurate hypocentre determination in the seismogenic zone of the subducting Nazca Plate in northern Chile using a combined on-/offshore network. Geophys. J. Int. 138 (3), 687–701. doi:10.1046/j.1365-246x.1999.00893.x
Jiang, Q., Feng, X.-T., Xiang, T.-B., and Su, G.-S. (2010). Rockburst characteristics and numerical simulation based on a new energy index: a case study of a tunnel at 2,500 m depth. Bull. Eng. Geol. Environ. 69, 381–388. doi:10.1007/s10064-010-0275-1
Lagos, S. R., and Velis, D. R. (2018). Microseismic event location using global optimization algorithms: an integrated and automated workflow. J. Appl. Geophys. 149, 18–24. doi:10.1016/j.jappgeo.2017.12.004
Li, L., Tan, J., Xie, Y., Tan, Y., Walda, J., Zhao, Z., et al. (2019). Waveform-based microseismic location using stochastic optimization algorithms: a parameter tuning workflow. Comput. geosciences 124, 115–127. doi:10.1016/j.cageo.2019.01.002
Li, Z., Liu, J., Liu, H., Zhao, H., Xu, R., and Gurkalo, F. (2023). Stress distribution in direct shear loading and its implication for engineering failure analysis. Int. J. Appl. Mech. 15 (05), 2350036. doi:10.1142/s1758825123500369
Li, Z., and Xu, R. (2021). An early-warning method for rock failure based on Hurst exponent in acoustic emission/microseismic activity monitoring. Bull. Eng. Geol. Environ. 80 (10), 7791–7805. doi:10.1007/s10064-021-02446-5
Lin, F., Li, S., Xue, Y., and Xu, H. (2010). Microseismic sources location methods based on different initial values. Chin. J. Rock Mech. Eng. 29 (5), 996–1002. doi:10.3969/j.issn.1001-1986.2019.01.026
Lü, J., Jiang, Y., Zhao, Y., Zhu, J., Wang, X., and Tao, L. (2013). Study of microseismic positioning based on steady simulated annealing-simplex hybrid algorithm. Rock Soil Mech. 34 (8), 2195–2203. doi:10.16285/j.rsm.2013.08.024
Lunn, D. J., Thomas, A., Best, N., and Spiegelhalter, D. (2000). WinBUGS-a Bayesian modelling framework: concepts, structure, and extensibility. Statistics Comput. 10, 325–337. doi:10.1023/a:1008929526011
Luo, X., and Hatherly, P. (1998). Application of microseismic monitoring to characterise geomechanical conditions in longwall mining. Explor. Geophys. 29 (4), 489–493. doi:10.1071/eg998489
Luu, K., Noble, M., Gesret, A., Belayouni, N., and Roux, P.-F. (2018). A parallel competitive Particle Swarm Optimization for non-linear first arrival traveltime tomography and uncertainty quantification. Comput. Geosciences 113, 81–93. doi:10.1016/j.cageo.2018.01.016
Ma, C., Jiang, Y., and Li, T. (2019). Gravitational search algorithm for microseismic source location in tunneling: performance analysis and engineering case study. Rock Mech. Rock Eng. 52, 3999–4016. doi:10.1007/s00603-019-01809-5
Maxwell, S. C., Rutledge, J., Jones, R., and Fehler, M. (2010). Petroleum reservoir characterization using downhole microseismic monitoring. Geophysics 75 (5), 75A129–75A137. doi:10.1190/1.3477966
Oye, V., and Roth, M. (2003). Automated seismic event location for hydrocarbon reservoirs. Comput. Geosciences 29 (7), 851–863. doi:10.1016/s0098-3004(03)00088-8
Pavlis, G. L. (1986). Appraising earthquake hypocenter location errors: a complete, practical approach for single-event locations. Bull. Seismol. Soc. Am. 76 (6), 1699–1717. doi:10.1785/BSSA0760061699
Pavlis, G. L., and Booker, J. R. (1983). Progressive multiple event location (PMEL). Bull. Seismol. Soc. Am. 73 (6A), 1753–1777. doi:10.1785/bssa07306a1753
Pei, D., Quirein, J. A., Cornish, B. E., Quinn, D., and Warpinski, N. R. (2009). Velocity calibration for microseismic monitoring: a very fast simulated annealing (VFSA) approach for joint-objective optimization. Geophysics 74 (6), WCB47–WCB55. doi:10.1190/1.3238365
Ray, R., Kumar, D., Samui, P., Roy, L. B., Goh, A. T. C., and Zhang, W. (2021). Application of soft computing techniques for shallow foundation reliability in geotechnical engineering. Geosci. Front. 12 (1), 375–383. doi:10.1016/j.gsf.2020.05.003
Reyes-Montes, J., Rietbrock, A., Collins, D., and Young, R. (2005). Relative location of excavation induced microseismicity at the Underground Research Laboratory (AECL, Canada) using surveyed reference events. Geophys. Res. Lett. 32 (5), L05308. doi:10.1029/2004gl021733
Salvatier, J., Wiecki, T. V., and Fonnesbeck, C. (2016). Probabilistic programming in python using pymc3. PeerJ Comput. Sci. 2 (2), e55. doi:10.7717/peerj-cs.55
Sambridge, M., and Gallagher, K. (1993). Earthquake hypocenter location using genetic algorithms. Bull. Seismol. Soc. Am. 83 (5), 1467–1491. doi:10.1785/bssa0830051467
Shapiro, S. A., Rothert, E., Rath, V., and Rindschwentner, J. (2002). Characterization of fluid transport properties of reservoirs using induced microseismicity. Geophysics 67 (1), 212–220. doi:10.1190/1.1451597
Si, G., Cai, W., Wang, S., and Li, X. (2020). Prediction of relatively high-energy seismic events using spatial–temporal parametrisation of mining-induced seismicity. Rock Mech. Rock Eng. 53, 5111–5132. doi:10.1007/s00603-020-02210-3
Sitharam, T., Kolathayar, S., and James, N. (2015). Probabilistic assessment of surface level seismic hazard in India using topographic gradient as a proxy for site condition. Geosci. Front. 6 (6), 847–859. doi:10.1016/j.gsf.2014.06.002
Song, W.-Q., Gao, Y.-K., and Hai-Wei, Z. (2013). The differential evolution inversion method based on Bayesian theory for micro-seismic data. Chin. J. Geophys. 56 (4), 1331–1339. doi:10.6038/cjg20130427
Thurber, C. H. (1985). Nonlinear earthquake location: theory and examples. Bull. Seismol. Soc. Am. 75 (3), 779–790. doi:10.1785/bssa0750030779
Waldhauser, F., and Ellsworth, W. L. (2000). A double-difference earthquake location algorithm: method and application to the northern Hayward fault, California. Bull. Seismol. Soc. Am. 90 (6), 1353–1368. doi:10.1785/0120000006
Wang, H., and Ge, M. (2008). Acoustic emission/microseismic source location analysis for a limestone mine exhibiting high horizontal stresses. Int. J. Rock Mech. Min. Sci. 45, 720–728. doi:10.1016/j.ijrmms.2007.08.009
Wang, J., Tang, S., Heap, M., Tang, C., and Tang, L. (2021). An auto-detection network to provide an automated real-time early warning of rock engineering hazards using microseismic monitoring. Int. J. Rock Mech. Min. Sci. 140, 104685. doi:10.1016/j.ijrmms.2021.104685
Xia, Y., Zhang, C., Zhou, H., Chen, J., Chen, P., Liu, N., et al. (2019). Structural characteristics of columnar jointed basalt in drainage tunnel of Baihetan hydropower station and its influence on the behavior of P-wave anisotropy. Eng. Geol. 264, 105304. doi:10.1016/j.enggeo.2019.105304
Xia, Y., Zhang, C., Zhou, H., Hou, J., Singh, H. K., Gao, Y., et al. (2020). Mechanical behavior of structurally reconstructed irregular columnar jointed rock mass using 3D printing. Eng. Geol. 268, 105509. doi:10.1016/j.enggeo.2020.105509
Zhang, Z., Li, Z., Xu, G., Gao, X., Liu, Q., Li, Z., et al. (2023). Lateral abutment pressure distribution and evolution in wide pillars under the first mining effect. Int. J. Min. Sci. Technol. 33 (3), 309–322. doi:10.1016/j.ijmst.2022.11.006
Zhao, H., Li, S., Zang, X., Liu, X., Zhang, L., and Ren, J. (2023). Uncertainty quantification of inverse analysis for geomaterials using probabilistic programming. J. Rock Mech. Geotechnical Eng. 16 (3), 895–908. doi:10.1016/j.jrmge.2023.07.014
Zhao, H., Li, S., and Zhu, C. (2021). Uncertainty analysis of rock tunnel based on fractional moment and dimensional reduction method. Int. J. Rock Mech. Min. Sci. 139, 104656. doi:10.1016/j.ijrmms.2021.104656
Keywords: microseismic, location, underground, Markov chain Monte Carlo, probabilistic programming
Citation: Liang X (2024) Uncertainty of microseismic sources identification and probabilistic location in underground excavation. Front. Earth Sci. 12:1419330. doi: 10.3389/feart.2024.1419330
Received: 18 April 2024; Accepted: 24 May 2024;
Published: 12 June 2024.
Edited by:
Bin Gong, Brunel University London, United KingdomReviewed by:
Filip Gurkalo, Henan Polytechnic University, ChinaYingjie Xia, Dalian University of Technology, China
Copyright © 2024 Liang. This is an open-access article distributed under the terms of the Creative Commons Attribution License (CC BY). The use, distribution or reproduction in other forums is permitted, provided the original author(s) and the copyright owner(s) are credited and that the original publication in this journal is cited, in accordance with accepted academic practice. No use, distribution or reproduction is permitted which does not comply with these terms.
*Correspondence: Xu Liang, bGlhbmd4dXJvY2tAb3V0bG9vay5jb20=