 Li Liang1
 Da-Lang Tian
- 1School of Transportation and Municipal Engineering, Chongqing Jianzhu College, Chongqing, China
- 2School of Civil Engineering, Chongqing Unversity, Chongqing, China
- 3Chongqing Survey, Design and Research Institute Co., Ltd., Of CREEC, Chongqing, China
Compared with engineering materials for earth structures subjected to prolonged, sustained hydraulic loading, the internal erosion process of widely graded loose soils (WGLS) under short-term, fluctuating hydraulic loading conditions remains insufficiently elucidated. Therefore, a novel fixed-wall permeameter is developed, capable of applying hydraulic loading at a constant flow rate and collecting effluent flowing out of specimens. A testing protocol is proposed to separate eroded silty clay particles, sandy gravel particles, and seepage water from the collected effluent. Several seepage tests are conducted on remolded specimens with various initial porosity at different inflow rates. The test results show that under a constant inflow rate, the WGLS specimens may undergo suffusion, suffosion, and stabilization stages while seeking the ultimate equilibrium state. The proposed particle migration pattern adeptly reveals the microscale mechanisms of the internal erosion phenomena observed at different stages. The inflow rate is independent of the suffusion critical hydraulic gradient but impacts the suffosion critical hydraulic gradient and internal erosion behavior following suffusion. Because hydraulic shear stress is a comprehensive indicator that considers both hydraulic gradient and initial porosity, it is more appropriate to use it to evaluate the internal stability potential of WGLS.
1 Introduction
Loosely deposited soils, such as landslide, debris-flow, and artificial deposits, are widely distributed in the western mountainous areas of China due to frequent earthquakes, debris-flow disasters, and engineering construction (Ni et al., 2012; Zhang et al., 2021; Fang et al., 2023a; 2023b; 2024; Li et al., 2023). Field observation shows these loosely deposited soils typically contain wide-graded particles, from clay (particle size <0.002 mm) to boulder (particle size >100 mm), and are characterized by unconsolidated and non-uniform pore structures. Therefore, they are also known as widely graded loose soils (WGLS) (Guo and Cui, 2020). Furthermore, with the increase in the occurrence of global extreme weather, especially due to the influence of the El Niño phenomenon, the torrential rainfall in the western mountainous areas of China is becoming more frequent, making China one of the regions most threatened by landslides in Asia (Han et al., 2024; Lu et al., 2024). Frequent landslides of loose deposits occur under the influence of torrential rainfall, with strong concealment and severe hazards (Dou et al., 2020; 2023; Xiang et al., 2023). However, the failure mechanism has not yet been clearly understood.
Coarse particles usually form a soil matrix, while fine particles fill the matrix void and can bond to coarse particles (Cui et al., 2019). During torrential rainfall events, the groundwater seepage process leads to the migration of fine particles between the matrix formed by coarse particles, thereby accumulating fine particles at the bottom of the slope (Tian et al., 2020a), as depicted in Figure 1A. The migration process is commonly referred to as internal erosion induced by water infiltration. The migration of fine particles undoubtedly alters the fabric characteristics of WGLS and influences their physical and mechanical characteristics, which is non-negligible for geotechnical and geological engineering (Liang L. et al., 2020; Tian et al., 2020b; Jiang et al., 2023). Furthermore, fines accumulation generally generates a relatively impermeable layer, impeding further downward water infiltration, forming a weak plane in the slope, and influencing the stability of the slope (Crosta and Prisco, 1999; Zhang et al., 2023).
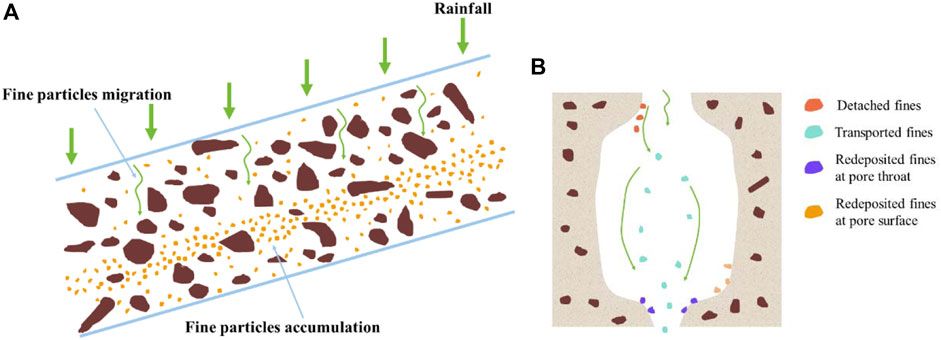
Figure 1. Schematic illustration of the fines migration process in WGLS due to rainfall infiltration: (A) Fines migration and accumulation in an infinite slope; (B) Coupled process of internal erosion in WGLS.
Due to the significant impacts mentioned above, internal erosion in WGLS due to rainfall infiltration is increasingly recognized as the leading cause of geologic and geotechnical disasters in fragile mountain areas and valley terrains, such as local collapse, shallow slope failure, and debris flows (Cui et al., 2014; Guo et al., 2016). For example, the slope failure of the Lei-Yi Highway in Southwest China (Yuan and Che, 2022), the landslide of the Tangier-Port Tangier Med and Fez-Taza highway sections in northern and northeastern Morocco through mountainous areas (Chehlafi et al., 2019), and the large debris flow in Wenjia Ravine in the Wenchuan earthquake-affected area (Cui et al., 2017), are recorded as prominent representatives of geological hazards due to rainfall-induced internal erosion in WGLS. However, internal erosion of soils is a hidden process that may remain undetected at the surface until a collapse occurs, and even in extreme erosion events, the erosion evidence is often washed away after the collapse (Lindow et al., 2009; Gu et al., 2019). Consequently, the current detection methods are insufficient for identifying internal erosion, such that by the time external manifestations are observed, it is often too late to prevent catastrophic failures (Yousefpour and Fazel Mojtahedi, 2023). Therefore, an in-depth understanding of the rainfall-induced internal erosion process in WGLS is important for geotechnical engineering, engineering geology, and geo-hazard phenomena.
Internal erosion is a coupled process that involves fines detachment from the pore surface between the soil matrix, fines transport as suspension, and possible fines redeposition at the pore surface or pore throats, as shown in Figure 1B (Kenney and Lau, 1985; Khilar and Fogler, 1998). The internal instability resulting from erosion takes on different forms depending on the contribution of the transported fine particles to stress transfer and the subsequent fate of the transported particles. Generally, two phenomena responsible for internal instability in granular materials are suffusion and suffosion (Richards and Reddy, 2007; Moffat et al., 2011; Fannin and Slangen, 2014). In suffusion, a non-destructive response, the stress-free finer fraction moves within the coarser fraction without disturbing the structure of the coarser fraction. It is quantified by a mass loss, no change in volume, and a change in hydraulic conductivity. In suffosion, a destructive response, the migration of fine particles partially constituting force-chain contacts is accompanied by the collapse of the soil structure. It manifests as a mass loss, a volumetric contraction, and a change in hydraulic conductivity. These qualitative distinctions between the two phenomena are used herein to describe the temporal progression of internal erosion in WGLS.
Extensive field inspections, laboratory testing, and numerical simulation studies have been conducted to mitigate internal erosion risk. Some studies have focused on the mechanism and process of internal erosion (Bendahmane et al., 2008; Wan and Fell, 2008), and they concluded that the following two conditions must be met for internal erosion to occur: 1) the size of some fines must fall within a certain proportional range of the size of constriction in the pore network; 2) the action of hydraulic flow must be sufficient to detach the fine particles. The first condition is associated with the intrinsic properties of soil. Therefore, some researchers have established correlations between soil parameters, including fine content (Li et al., 2020), fabric (Shire et al., 2014), relative density (To et al., 2020), grain morphology (Maroof et al., 2021), and internal erosion characteristics, to shed light on the intrinsic factors affecting the seepage failures in soil. The second condition is related to the hydro-mechanical condition applied to fine particles, which depends on external factors. Thus, external factors affecting the internal erosion of soil, such as stress states (Ma et al., 2021), flow direction (Liang Y. et al., 2020), and hydraulic loading history (Rochim et al., 2017), have also been extensively studied. After understanding the mechanisms of internal erosion and its influencing factors, various criteria have been proposed based on the geo-hydro-mechanical characteristics, such as particle size distribution (To et al., 2018; Chapuis and Saucier, 2020), stress reduction factor (Skempton and Brogan, 1994; Li and Fannin, 2012), critical hydraulic shear stress (Reddi et al., 2000), critical hydraulic gradient (Israr and Indraratna, 2019), and power dissipated flow (Marot et al., 2011) to assess the susceptibility of soil mass to internal erosion. Recognizing the significant impact of internal erosion on soil structure, many scholars have gradually started researching the influence of internal erosion on soil mechanical behavior (Taha et al., 2022; Liang et al., 2023).
Previous studies have mainly focused on the internal erosion of gravelly soils in artificial structures (such as dams and dikes) with a relatively constant hydraulic loading over a long period (e.g., constant head internal erosion tests and head-stepping internal erosion tests), while there has been less research on the internal erosion of WGLS under rainfall infiltration. In the latter, hydraulic loading undergoes rapid and significant fluctuations within a short period. For the internal erosion of WGLS, soil column infiltration, laboratory flume, and in situ artificial rainfall experiments are generally utilized (Yin et al., 2019). In terms of laboratory flume tests, Hu et al. (2022) carried out a centrifugal modeling test to study the erosion failure behaviors of soil-rock mixture slopes. Xiao et al. (2022) utilized flume tests to investigate the effects of microbially induced calcite precipitation (MICP) treatment on the erosion resistance of sandy slopes with different uniformity coefficients. As for in situ artificial rainfall experiments, Yuan and Che (2022) performed an in situ rainfall model test on a decomposed granite slope to clarify the evolution process and spatio-temporal characteristics of slope erosion with the help of electrical measurements and laser scanning.
However, these aforementioned experimental methods are impractical for observing and quantifying the internal erosion process of WGLS under rainfall. Soil column infiltration testing is an effective method to address this issue. Wang et al. (2011) conducted soil column experiments with soil from a debris flow source area in Jiangjiagou ravine to study the influence of particle transport and clogging effects on the permeability of soils. Zhu et al. (2021) conducted soil column permeability tests using a self-made permeameter to study the influence of fabric on the hydraulic conductivity of WGLS while considering the fines migration. Mao et al. (2022) utilized a self-made apparatus system to analyze the effects of muddy water seepage on the permeability of coarse-grained soil columns. Notably, the hydraulic-gradient controlled conditions are applied in all soil column infiltration tests mentioned above, which differ from the hydraulic conditions experienced by the soil under rainfall infiltration. Furthermore, the temporal progression of internal erosion is also eliminated, which is vital for an in-depth understanding of the internal erosion-induced slope failure.
In this work, we aim to gain a deeper understanding of the internal erosion process of WGLS under rainfall infiltration and reveal its controlling factors. To this end, a fixed-wall permeameter is developed, which can apply inflow-rate controlled conditions simulating rainfall infiltration. A soil-fluid separation testing protocol is proposed to distinguish silty clay and sandy gravel fraction erosion. A series of downward seepage tests on reconstitute specimens under inflow-rate controlled conditions are conducted using the newly developed device and testing protocol. Moreover, different inflow rates are applied, and samples with varying porosities are used. The results are discussed in terms of proxies for internal erosion, including outflow rate, hydraulic gradient, hydraulic conductivity, silty clay fraction erosion rate, and sandy gravel fraction erosion rate. Finally, a detailed description and interpretation of the internal erosion process of WGLS due to rainfall infiltration is provided, and the effects of inflow rate and initial porosity on internal erosion behaviors are studied. The research findings are expected to provide a basis for further investigation of the mechanisms of hydrodynamic-induced landslide and stability analysis of slope deposits.
2 Experimental program and procedure
2.1 Experimental apparatus
As a preliminary exploration, a unidirectional vertical downward seepage test scheme is selected due to its simplicity. The multi-directional seepage test, which is closer to the actual hydraulic environment of WGLS under rainfall infiltration, will be conducted in a separate contribution. Internal erosion of the WGLS is mainly associated with shallow landslides, where the influence of confinement stress can be negligible (Havaee et al., 2015; Zhuang et al., 2021). Additionally, inspection of in situ slope experiments has shown that during rainfall infiltration prior to slope failure, the pore water pressure in the soil increases with the duration of rainfall infiltration yet exhibits a distinct capping effect. (Guo et al., 2016; Zhang et al., 2022). Hence, the fixed-wall permeameter developed by the authors (Tian et al., 2020a) is used in this study. This permeameter can conduct unidirectional downward internal erosion tests on unconsolidated WGLS specimens at a constant inflow rate to characterize erosion evolution.
The self-designed testing apparatus is similar to a one-dimensional variable-head permeameter, as depicted in Figures 2A,B. The main components of the testing apparatus comprise an adjustable frame, a water supply system, an effluent collection system, and a rigid-wall permeameter cell, which are introduced as follows:
• Adjustable frame: This adjustable frame is constructed by linking three light-rounded acrylic plates, i.e., base plate, top plate, and adjustable middle plate, with screws. The positions of the top and base plates are fixed, while the position of the middle plate can be adjusted according to the requirements of the experiment.
• Water supply system: The water supply system, designed to mimic rainfall infiltration conditions, consists of upper and lower reservoirs, a peristaltic pump with the flux control function, and a transparent upstream tube with an inner diameter of 40 mm. The infiltration fluid, provided at a constant flow rate by a peristaltic pump, simulates the infiltration of rainwater through the overlying soil layer during the rainfall infiltration process. The mass of the upper and lower reservoirs is continuously measured during the test to determine the time-dependent hydraulic gradient driving seepage in the specimen. An overflow pipe is installed 30 cm above the bottom surface of the upstream tube (equivalent to the top surface of the specimen) to control the maximum water pressure
• Effluent collection system: The effluent collection system comprises an inverted cone funnel and a series of numbered collection cups. It is specially designed for the continuous collection of effluent seeping out from downstream of the specimen within every scheduled time interval. The detection of erosion in the effluent is achieved through a soil-fluid separation test protocol, which will be discussed in detail in Section 2.2.
• Rigid-wall permeameter cell: The rigid-wall permeameter cell shown in Figure 3 is a critical component of the developed experimental apparatus. It is made of transparent acrylic pipe and can accommodate a soil specimen of 39.1 mm in diameter and 80.0 mm in height. A rubber membrane is attached to the inside wall of the permeameter to mitigate unexpected parasitic flow between the compacted specimen and the rigid wall of the permeameter, which perplexing the conventional fixed-wall permeameter (Kenney and Lau, 1985; Bendahmane et al., 2008). Glass beads are placed on the top of the specimen to diffuse the seepage flow uniformly. An upper perforated plate with an opening size of 1 mm is employed to support the glass balls and to eliminate the effect of gravity from glass beads on the internal erosion behavior of the sample. In addition, the nonwoven textile is placed between the upper perforated plate and the top surface of the specimen to prevent upward fine particle loss. The specimen is supported by a lower perforated plate with an opening size of 4 mm in the permeameter cell. A 4 mm diameter opening is sufficient to observe the erosion of most of the particles within the sample, since the largest particle size of tested specimens is equal to 5 mm, according to the forthcoming display in Figure 5.
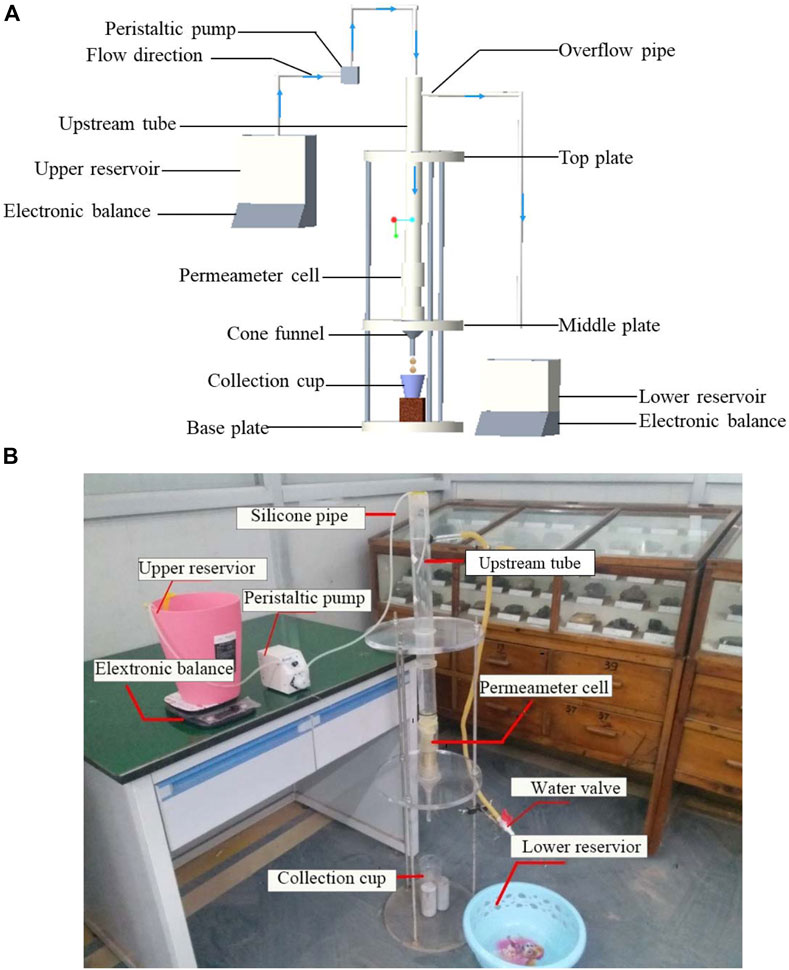
Figure 2. Schematic diagram and photograph of experimental apparatus: (A) Layout of main components of experimental apparatus; (B) Photograph of the experimental apparatus.
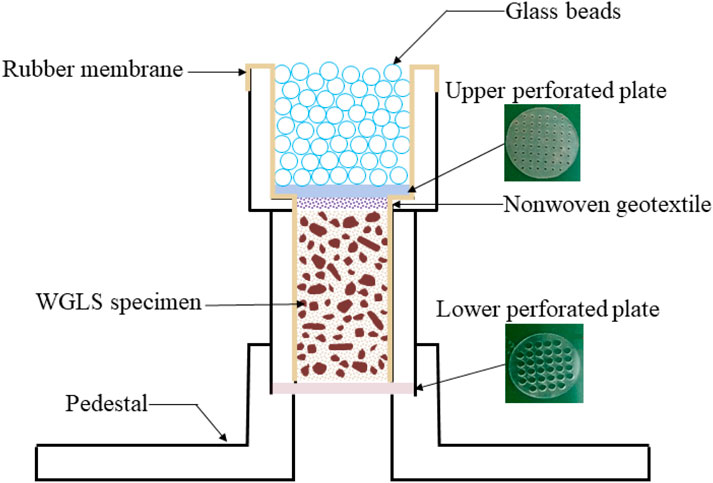
Figure 3. Schematic diagram of the profile of the permeameter cell.
Since the outlet of the specimen is open to the atmosphere, it can be considered a zero-head surface. In this way, Equation 1 is used to calculate the hydraulic gradient across the specimen can be calculated as
where
where
Due to the cap effect of the overflow pipe, the hydraulic gradient can be written as a piecewise function, as shown in Equation 4:
It is worth emphasizing that, despite the development of numerous advanced and automated apparatus for studying internal erosion in soils (Bendahmane et al., 2008; Slangen and Fannin, 2017; Wang et al., 2022), to the best of the author’s knowledge, these devices are all limited to constant hydraulic loading. However, as previously stated, constant hydraulic loading significantly deviates from the hydraulic loading paths that soils experience during rainfall infiltration processes. The device developed in this paper employs inflow-rate controlled hydraulic conditions, making it suitable for investigating internal erosion behavior caused by rainfall infiltration. This demonstrates the advantages of the proposed device over the existing apparatus.
2.2 Soil-fluid separation testing protocol
The effluent from the bottom of the specimen is a mixture of eroded silty clay particles, eroded sandy gravel particles, and permeating fluids. In order to study the very beginning of internal erosion, detect the possible initiation point, and carry out real-time measurements of the mass loss of soil particles, a solid-fluid separation testing protocol is proposed. The erosion mass rate of silty clay and sandy gravel particles and the outflow rate can be determined through the proposed testing protocol.
The total mass of the effluent mti collected during the time interval i can be directly obtained by weighing and is given by Equation 5
where mci, msi, and mwoi are the silty clay particle mass, sandy gravel particle mass, and permeating fluid mass within the effluent collected during the time interval i, respectively.
A portable light transmission meter (PLTM) (Figure 4A) is used to measure the silty clay particle mass suspended in the effluent since they are too small to obtain its mass using a weighing method. This method works based on the correspondence between the transparency of the effluent and the concentration of silty clay particles within the effluent. Precedent light transmittance calibration for different silty clay concentrations (Figure 4B) allows quantifying the silty clay erosive concentration within the effluent by using PLTM. Equation 6 defines the erosive mass of silty clay particles within the effluent collected during the ith time interval is expressed in the form
where nci is the silty clay concentration determined by the PLTM coupled with the precedent calibration curve.
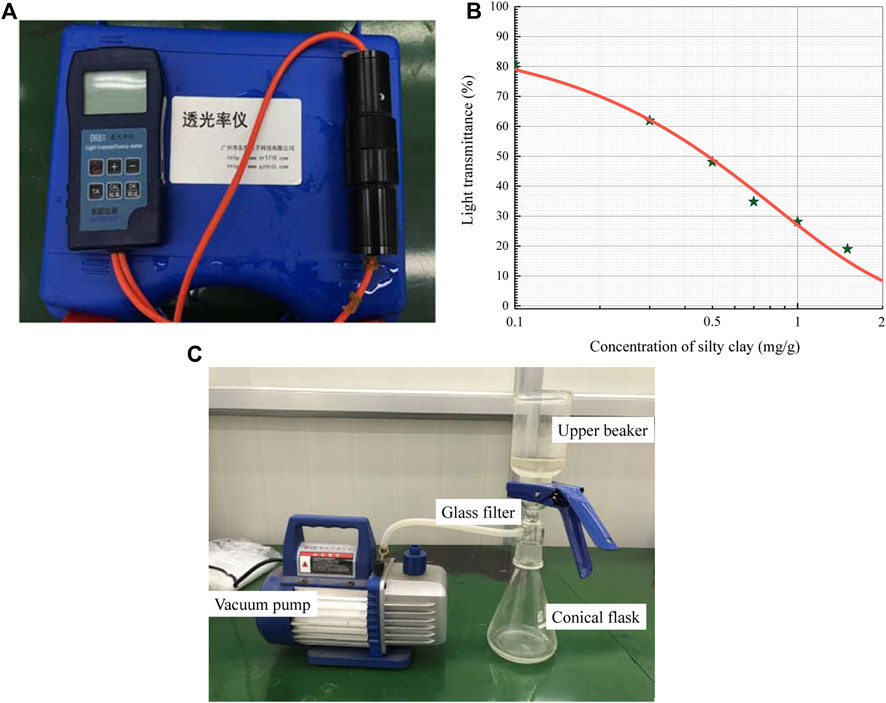
Figure 4. Main components of the soil-fluid separation testing protocol: (A) Photograph of portable light transmission meter; (B) Light transmittance calibration curve; (C) Photograph of the glass filter with a vacuum pump.
A glass filter with a vacuum pump (Figure 4C) serves to completely separate the permeating fluid and the eroded soil particles from the effluent, by which the mass of the seepage water mwoi and the total mass of the eroded soil particles can be measured. In this way, it is easy to obtain the eroded silty clay quantity, eroded sandy gravel quantity, and permeating fluid volume within the effluent collected during the ith interval according to Equations 5, 6.
Equations 7(a)–7(c) respectively give the erosive mass rates of silty clay particles, sandy gravel particles per unit surface, and the outflow rate are respectively defined as:
where Ss is the sample’s cross-sectional area, and ti is the duration of the interval i.
The sum of the mass of eroded soil grains and seepage water measured during each time interval gives the cumulated mass of the eroded solids and seepage water during time t based on Equation 8(a)–8(c), that is
with n representing the number of time intervals, mc and ms are the cumulated eroded silty clay and sandy gravel mass, respectively.
2.3 Tested materials
The tested WGLS material used in this study is extracted from the Kucaoping slope deposits in Fengjie County, Chongqing, China, caused by the heavy rainfall in 2015 (Tian, 2018; Tian et al., 2020a). Due to the limitations of the size of the permeameter cell, coarse particles larger than 5 mm are removed. In this way, the ratio of the largest particle size to the specimen diameter is 1/8, less than the upper limit of 1/6 specified by the standard test methods for measuring the hydraulic conductivity of saturated porous materials (ASTM, 2016). The grain size distribution (GSD) of the selected original soil measured by the wet sieving method (ASTM, 2018) is shown in Figure 5. According to the boundary diameter of 0.075 mm, the original soil is separated into pure silty clay and pure sandy gravel fractions, whose GSD curves are also plotted in Figure 5. The grain density, plasticity limit, liquidity limit, and standard optimum water content for the pure silty clay fraction are identified as 2.63 × 10³ kg/m3, 25%, 57.2%, and 27.2%, respectively. The pure sandy gravel particles are classified as angular to sub-angular material. Their grain density is measured as 2.65 × 10³ kg/m3. In the pure sandy gravel fraction, particles with the size of 0.075–0.25 mm are absent. The pure sandy gravel particles are classified into four portions according to their particle sizes: 0.25–0.5 mm, 0.5–1.0 mm, 1–2 mm, and 2–5 mm. These pure silty clay particles and classified sandy gravel particles are used to reconstitute specimens.
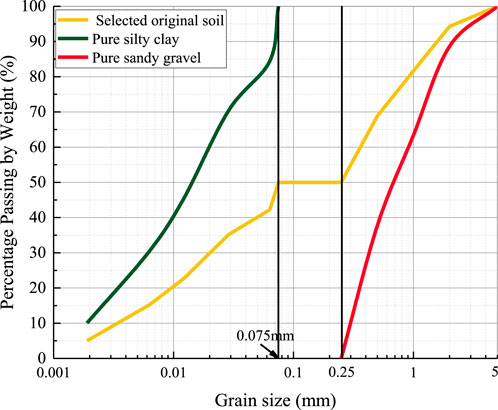
Figure 5. Grain size distribution of the selected original soil, pure silty clay fraction, and pure sandy gravel fraction.
Empirical geometric criteria have been proposed by researchers (US Army Corps of Engineers, 1953; Kezdi, 1979; Kenney and Lau, 1985; Burenkova, 1993) to evaluate the potential for internal instability of granular material based on the shape of the gradation curve. The results of the evaluation of the GSD studied herein are listed in Table 1. All criteria indicate that the tested soil mass is internally unstable. It should be noted that these geometric criteria are designed for cohesionless soils. The extent to which these empirical criteria for internal stability may be applied to WGLS composed of cohesive fines less than 0.075 mm is uncertain. Additionally, these methods only evaluate the potential for internal instability according to a geometric constraint, namely, the ability of the coarser particles to hinder the migration of fine particles. They do not provide any insight into the nature of internal erosion or the hydro-mechanical conditions triggering the onset of internal erosion. Hence, these empirical geometric criteria can only serve as a preliminary criterion for identifying the internal stability of WGLS, and it is urgent to conduct seepage tests to reveal the internal erosion process of WGLS subjected to rainfall infiltration.
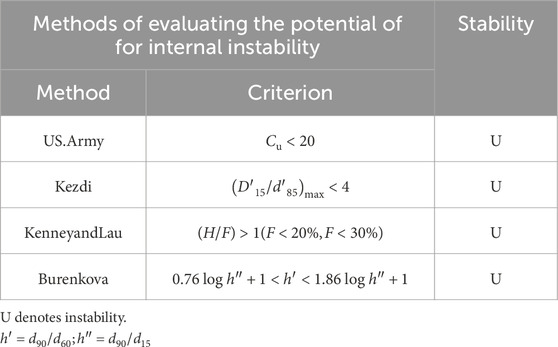
Table 1. Assessment of the vulnerability of the WGLS to internal erosion.
F denotes the mass fraction of grains whose diameter is smaller than a specific grain diameter D, H denotes the mass fraction of grains whose diameter is between D and 4D.
2.4 Experiment procedure
2.4.1 Specimen preparation
The specimen preparation includes two procedures: 1) material mixing and 2) compaction in layers. The repeatability of the reconstitution can be accomplished using these two procedures.
• Step 1: The oven-dried weight of sandy gravel particles of different sizes is determined according to the GSD and desired relative density. De-aired water is added to the oven-dried sandy gravel particles and mixed sufficiently to the optimum moisture content of 5.7%. As the mixing continues, silty clay particles with an optimum moisture content of 27.2% are progressively added, and mixing is continued until visual uniformity is observed. Before compaction, the well-mixed wet test material is divided into five parts and is kept inside a zipped plastic bag for moisture equalization for 24 h.
• Step 2: In this study, the moist tamping technique (Ladd, 1978; Frost and Park, 2003) is used to prevent soil segregation during compaction. The soil specimens are compacted into five layers, with a target thickness of 16 mm for each layer. A non-linear average under-compaction criterion (Figure 6) is used to prevent excessive densification of the underlying layers during the compaction of the succeeding layers (Jiang et al., 2003; Ke and Takahashi, 2014). The under-compaction degree denotes how great a percentage of a layer should be less densified than the desired value. Weigh the amount of material required for each layer and place it into the mold. After that, each layer is compacted manually to the height determined by the desired density and under-compaction degree (Figure 6). For example, even though the target thickness for the first layer is 16 mm, the first layer is initially compacted to 17.6 mm due to the consideration of the under-compaction degree.
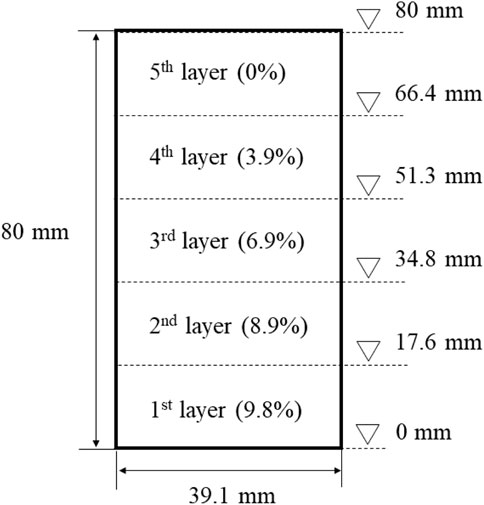
Figure 6. Actual height after initial tamping determined by the average under-compaction degree of each layer.
2.4.2 Internal erosion test
After installing the reconstituted specimen in the newly developed rigid-wall permeameter cell, the unidirectional downward seepage erosion test begins at a constant injection rate. The internal erosion test is completed in three steps: 1) specimen saturation, 2) erosion test, and 3) measurement of the axial height of the eroded specimen.
• Step 1: The seepage erosion test begins with a stage of saturation. In this stage, we open the peristaltic pump and inject de-aired water from the upper reservoir into the upstream tube at an extremely low infiltration rate. The purpose of adopting this low infiltration rate is to prevent the migration of fine particles in the saturation stage. The effluent collection system is used to measure the discharge rate. After the discharge rate stabilizes (i.e., the criterion that the variation in discharge rate does not exceed 5% over a continuous period of 10 min is satisfied), continue the low-rate infiltration process for 1 h to ensure the saturation of the specimen.
• Step 2: The inflow rate is increased to a predetermined value to initiate seepage erosion. During the erosion process, the weight of the upper and lower reservoirs is continuously recorded through the data collection system. Meanwhile, the designed effluent collection system is employed to collect the effluent at predetermined time intervals. The entire duration of the experiment is divided into different time intervals ranging from 1 min to 5 min, with the shortest intervals of 1 min when distinct discoloration of the effluent is observed and the longest intervals of 5 min when the effluent is visually clear. The erosion tests are continued until the following criteria are satisfied: 1) the effluent is observed to be visually clear over a period of at least 10 min, and the upstream hydraulic head remains stable; 2) the hydraulic head in the upstream tube declines drastically to zero or a minimal value; 3) the duration of test exceeded the specified time of 90 min.
• Step 3: After the erosion test is completed, the height of the eroded specimen is measured using a steel ruler. The change in specimen height is used to characterize the change in specimen volume due to the erosion process.
2.4.3 Soil-fluid separation test
It is now our position to conduct the soil-fluid separation test. The separation process can be divided into three steps.
• Step 1: These numbered containers collecting effluent at different time intervals (Figure 7A) are weighted to determine the mass of the effluent.
• Step 2: After thoroughly stirring the effluent with a glass rod, the eroded sandy gravel particles deposit at the bottom of the container due to their larger specific gravity, while the silty clay particles remain suspended in the effluent. Subsequently, the suspension liquid is carefully dumped into a specifically designed rectangular solid box made of transparent acrylic plates to measure the concentration of silty clay particles by utilizing the PLTM, as shown in Figure 7B. After that, the suspension liquid is returned to the containers. It is worth emphasizing that adding a measured quantity of de-aired water to the suspension liquid is necessary to decrease the concentration of silty clay particles when the concentration is too high to exceed the upper limit concentration of 2 mg/g for PLTM (see Figure 4B). In this way, the PLTM in this paper can measure large quantities of eroded silty clay particles compared with the photo sensor adopted by Bendahame et al. (2008).
• Step 3: The glass filter with a vacuum pump is employed to separate the seepage water and eroded soil grains from effluent. After filtering, the eroded soil particles remain on the filter paper while the seepage water permeates into the conical flask. The mass of seepage water and eroded soil grains can be obtained by weighing the conical flask and oven-dried filter papers (see Figure 7C), respectively.
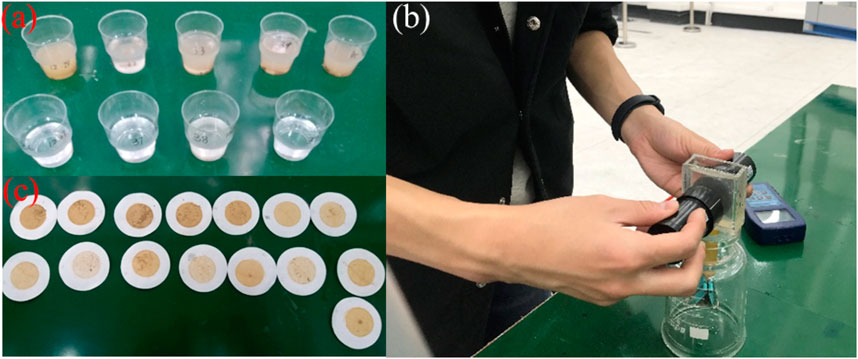
Figure 7. Key operation for soil-fluid separation: (A) the photo for numbered containers collecting effluent; (B) the photo for measuring the concentration of clay particles; (C) the photo of oven-dried filter papers used for measuring the total eroded soil mass.
2.5 Experiment scenarios
In this experiment, these tests are controlled by different injection flow rates, i.e., 25 mL/min, 39 mL/min, 56 mL/min, and 74 mL/min, and different initial porosities, that is 0.35, 0.4, 0.45, and 0.5. The details of the experimental program consisting of 7 tests are presented in Table 2. All the specimens used in these experiments are prepared with the same materials and specimen preparation methods. These injection flow rates are chosen from previous trial and error, at which significant erosion phenomena can be observed within 90 min. Notably, these injection flow rates used in this study are higher than the natural rainfall intensity. However, compared to laboratory soil columns subjected to unidirectional seepage, the soil under field conditions is more susceptible to internal erosion. It is because more erodible particles in the soils at the field site are exposed in the exit paths of the network of interconnected pore channels due to the tortuous seepage path in various directions (Xiao and Shwiyhat, 2012). Therefore, it is reasonable to use higher infiltration rates in indoor soil column experiments to initiate erosion to some extent.
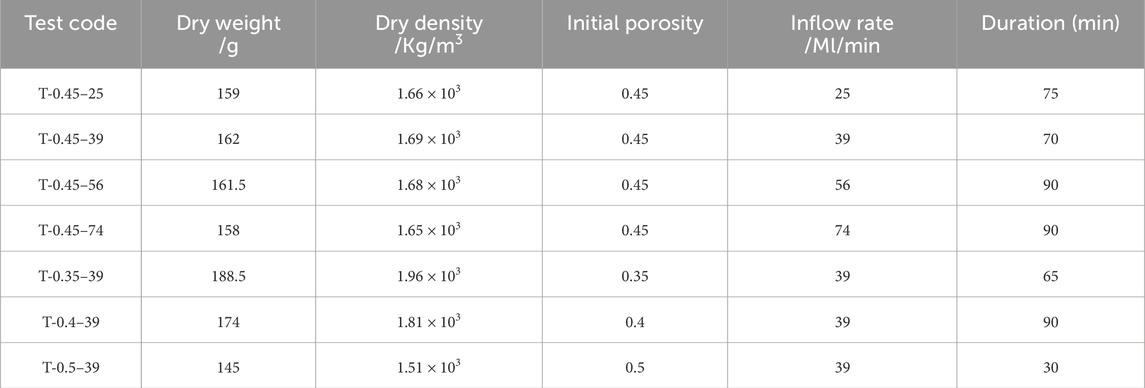
Table 2. Main characteristics of the tests.
3 Test results and discussion
3.1 Temporal progression of internal erosion
The temporal progression of internal erosion in these tests is identified by the following indicators: erosive mass rates of silty clay particles and sandy gravel particles, outflow rate, transient hydraulic gradient, transient hydraulic conductivity, and change in the height of the eroded specimen. According to Darcy’s law, the transient hydraulic conductivity at the time interval i can be determined from the transient hydraulic gradient and outflow rate based on Equation 9, that is
The erosion phenomenon observed in case T-0.45–39 is most prominently clear and typical among all the tests conducted. Therefore, its test results are interpreted to describe in detail the temporal evolution process of internal erosion of WGLS due to rainwater infiltration. From Table 2, the specimen T-0.45–39 under discussion has an initial porosity of 0.45 and is subjected to an infiltration rate of 39 mL/min. Based on the test termination criteria, the test conducted on specimen T-0.45–39 is stopped at t = 70 min due to the observation of the constant hydraulic gradient at 60–70 min, accompanied by a visually clear stage of effluent. During this experimental process, the water level in the upstream tube does not exceed the height of the overflow pipe, and the hydraulic gradient continuously changes over time. Figure 8 shows the temporal variation of the outflow rate, erosive mass rates of silty clay particles and sandy gravel particles, the transient hydraulic conductivity, and the transient hydraulic gradient.
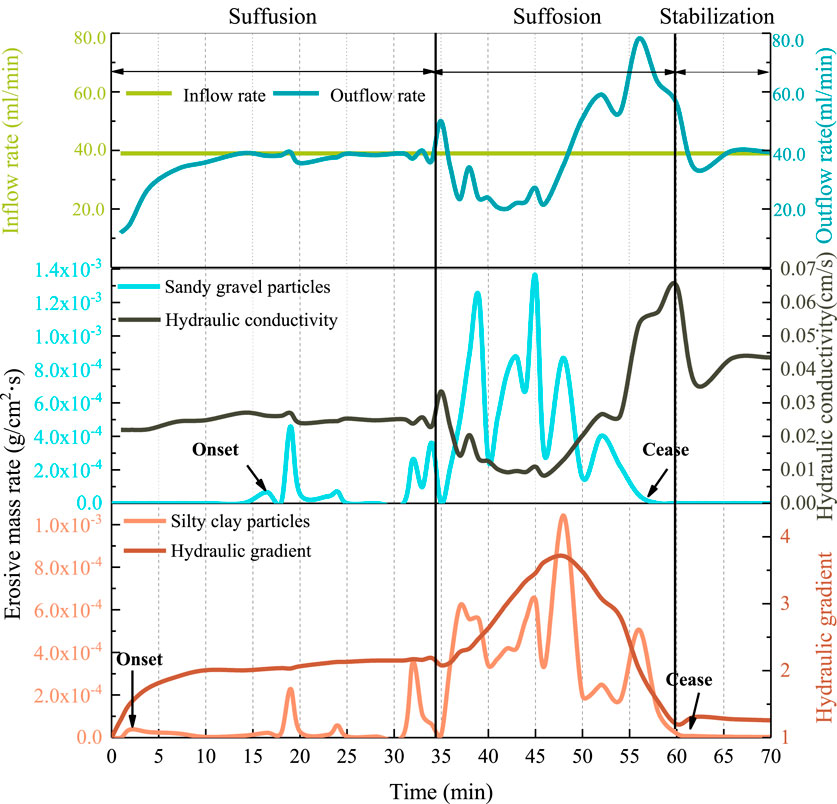
Figure 8. Changes in outflow rate, silty clay particles erosion rate, sandy gravel particles erosion rate, hydraulic gradient, and hydraulic conductivity with time.
3.1.1 General features of internal erosion
Figure 8 shows that internal erosion occurred, manifested by the loss of finer particles consisting of silty clay particles and sandy gravel particles, as well as outflow rate, transient hydraulic gradient, and transient hydraulic conductivity fluctuation. Throughout the experimental process, the outflow rate fluctuates concavely and convexly around the constant inflow rate before stabilizing, indicating a rearrangement of fine particles within the specimen and an achievement of the ultimate equilibrium state. The hydraulic conductivity of the specimen is enhanced under the action of internal erosion, reaching 205% of its initial value. The changes in these erosion indicators are closely related. A decrease in the outflow rate is accompanied by a reduction in hydraulic conductivity and an increase in hydraulic gradient and erosive mass rate of soil particles, and vice versa. The variation in the erosive mass rate of silty clay particles with time during the entire process indicates that internal erosion is intermittent due to episodic migration and redeposition of finer fractions within the interstices of the matrix formed by the coarser fraction. A similar trend can be observed for the erosive mass rate of sandy gravel particles. The onset of the erosion of silty clay particles is at t ≈ 2 min, which is earlier than that of sandy gravel particles. It indicates that the susceptibility of silty clay particles to internal erosion is higher than that of sandy gravel particles, which is consistent with the results by Bendahamne et al. (2008). After the initiation of erosion of the sandy gravel particles, the erosion rate of the silty clay particles changes almost synchronously with that of the sandy gravel particles.
3.1.2 Temporal progression of internal instability phenomena
The fine particle migration pattern illustrated by representative volume elements (REV) of the soil column contributes to a better understanding of the microscopic mechanisms of the internal erosion process. The REV of WGLS possesses a primary fabric of particles that supports loads and transfers stresses. Within the pores of this primary fabric, there exist loose particles that are not fixed in position, do not transfer effective stress, are movable within pores, and can be moved into neighboring pores if smaller than constrictions in the pore network, as shown in Figure 9. Constrictions (pore throat at the junction of adjacent pores) are variable in size in the pore network of the primary fabric. A combination of the variation of internal erosion indicators (Figure 8) and the evolution of particle migration patterns (Figure 10) provides a detailed description of the temporal evolution process of internal instability phenomena. The process of the specimen seeking its ultimate equilibrium state under constant inflow rate conditions can be divided into three stages: suffusion, suffosion, and stabilization.
• Suffusion stage: The internal erosion phenomena observed from the test initiation to an elapsed time of 34 min is classified as suffusion. In this stage, the transient hydraulic gradient gradually increases to 2.0 before 16 min, with an initially high growth rate that decreases over time. It is followed by a tiny increase with a rate of 0.01/min until t = 34 min. The hydraulic conductivity is almost constant in this stage, with a faint increase from 0.022 cm/s to 0.026 cm/s before 16 min and a drop back to 0.022 cm/s from 16 to 34 min. The behavior implies the onset of a slow and subtle migration of soil grains within the specimen, which is validated by the faint changes in the erosive mass rates of silty clay particles and sandy gravel particles in this stage.
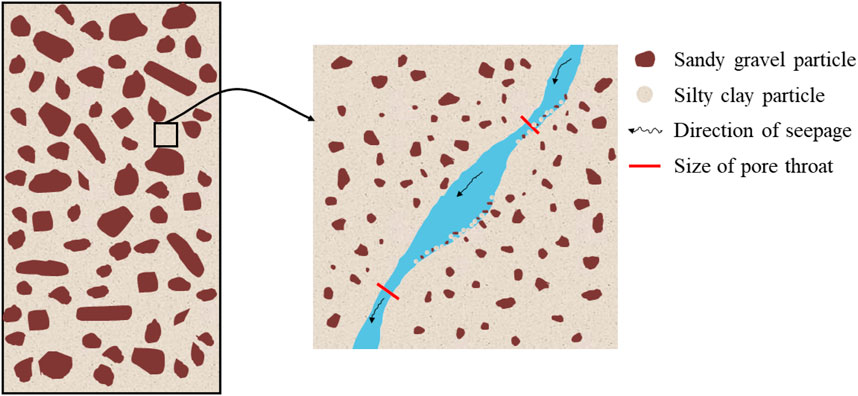
Figure 9. Schematic illustration of the soil column (left) and REV (right).
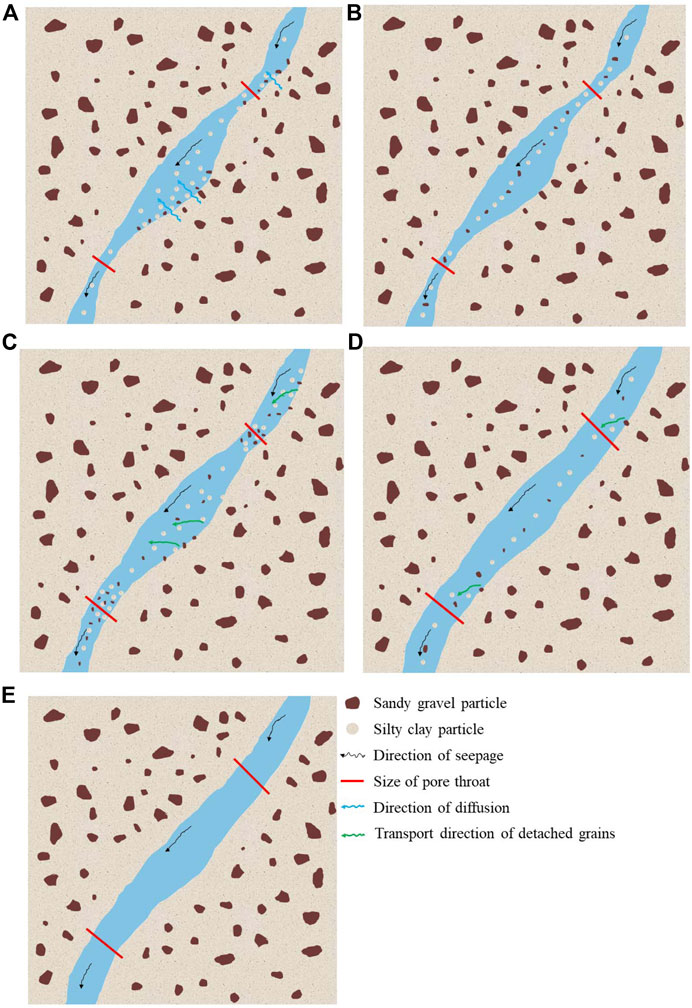
Figure 10. Distinct particle migration patterns at different internal erosion stages: (A) Loose silty clay particles diffusion in the suffusion stage; (B) Loose mixed particles transportation in the suffusion stage; (C) Dislodged particles blocking pore throat in the blocking stage; (D) Discharge of particles clogging pore throat in the discharging stage; (E) No particle transportation in the stabilization stage.
Upon water seeping into the interstices of the matrix formed by the coarser fraction, the silty clay particles initially loosely deposited in the interstice foremost undergo diffusion, as shown in Figure 10A. As a result, the loss of silty clay particles is observed almost from the beginning. As the hydraulic gradient rises, the seepage forces exerted on the sandy gravel particles initially loosely deposited in the interstice will be augmented sufficient to induce their migration (see Figure 10B). Consequently, mass loss of the mixture of silty clay and sandy gravel particles is observed while the second signal of silty clay erosion begins. The erosion of particles initially loosely deposited in the interstice does not significantly alter the network of interconnected pore channels, thereby resulting in a relatively slow and small variation in permeability. These responses of the specimen are consistent with the phenomenon of suffusion described by Kovacs (1981).
• Suffosion stage: The internal erosion phenomenon observed between 34 and 60 min is identified as suffosion. Internal erosion by suffosion is characterized by significant changes in all erosion indicators. Based on these changes, the suffosion stage can be further subdivided into the clogging stage (34 < t < 47 min), where the clogging effect of dislodged soil particles at the pore throat is dominant, and the discharging stage (47< t <60 min), where the discharging effect of dislodged soil particles at the pore throat is dominant. Specifically, in the clogging stage, the transient hydraulic gradient exhibits a continuously increasing trend, reaching its maximum value of 3.7 at t = 47 min. Conversely, a significant and rapid decrease in hydraulic conductivity occurs from 0.033 cm/s to the minimum value of 0.008 cm/s. The eroded soil grains consist of silty clay and sandy gravel particles. The erosive mass rates of both types of soil particles exhibit fluctuating growth, reaching their maximum values at the end of the clogging stage, namely, 1.04 × 10⁻³ g/(cm·s) and 1.36 × 10⁻³ g/(cm·s). In the discharging stage, the evolution of erosion indicators is opposite those in the clogging stage. The transient hydraulic gradient decreases from 3.7 to nearly 1.2 within 13 min. A companion increase occurs in the transient hydraulic conductivity, with the permeability coefficient rising from 0.008 cm/s to 0.065 cm/s. The erosive mass rate of soil grains decreases with time during this stage, causing the effluent to become clear gradually. Sandy gravel particles and silty clay particles stop eroding at 57 min and 60 min, respectively. After erosion completion, the specimen height decreases to 76 mm, resulting in a 5% axial strain.
Figure 10C depicts the particle migration pattern in the clogging stage. Once the erosion of soil particles loosely deposited in the interstice is completed, the sustained increase in seepage force caused by the disparity between inflow rate and hydraulic conductivity gradually dislodges the soil particles from the soil matrix. Some dislodged soil particles move downward through pore throats with the water flow, thus being washed out of the specimen. Nevertheless, others are entrapped at the pore throat, thus blocking it. The washout of soil particles resulted in a dramatic increase in the erosion mass rate of soil particles. Even though the dislodgement of soil particles at the pore throat enlarges its size, the entrapped soil particles at the pore throat cause a reduction in the effective pore throat size, leading to a sustained decrease in hydraulic conductivity. Given the condition of a constant inflow rate, the decreased hydraulic conductivity leads to an increase in the hydraulic gradient.
Figure 10D shows the particle migration pattern in the discharging stage. Once the increased hydraulic gradient due to blocked pore throats surpasses a critical threshold, the entrapped soil particles at the pore throats begin to undergo gradual discharge, resulting in a gradual increase in the effective size of the pore throats. Consequently, the increased hydraulic conductivity, decreased hydraulic gradient, and a higher erosion rate of soil particles are observed during the early stage. Subsequent seepage flow will further dislodge soil particles from the soil matrix and expand the pore throats and channels, causing the pores to be increasingly connected to each other and forming preferential seepage channels. As a result, the transient hydraulic gradient rapidly decreases to an extremely low value, accompanied by intermittent erosion of soil particles in the later stage. These phenomena in response to the dislodgment of the soil particles from the soil matrix are consistent with the suffosion recommended by Fannin and Slangen (2014).
• Stabilization stage: The internal erosion phenomenon observed between 60 and 70 min is identified as stabilization. No additional eroded soil grains are detected in the effluent over a period of 10 min after the suffosion stage ends. The hydraulic gradient and conductivity remain essentially constant with time in the latter stage of this phase, confirming that a state of equilibrium has been achieved. As shown in Figure 10E, the seepage flow within this preferential pathway formed by suffosion no longer segregates soil particles from the matrix soil. It should be noted that the rapid decrease in hydraulic conductivity and the accompanying increase in the hydraulic gradient in the early stage of this phase may be attributed to refilling the preferential pathway through episodic particle rearrangement. At the end of the stabilization stage, the hydraulic conductivity of the specimen has nearly reached four times its initial value. This is because the aforementioned internal erosion behavior increases the connectivity of adjacent pores, forming expanded flow pathways within the specimen to balance the inflow rate.
3.1.3 Erosion evolution with respect to hydraulic gradient
Through seepage tests conducted on cohesive specimens made of sand and clay, Bendahmane et al. (2008) demonstrated the existence of a secondary critical gradient, below which only the erosion of small quantities of clay particles is observed, beyond which both clay and sand transportation is initiated. Similar findings can be found in the literature (Chang and Zhang, 2011). In their study, two critical hydraulic gradients are defined, i.e., the initiation hydraulic gradient at which the first sign of internal erosion appears and the skeleton deformation hydraulic gradient beyond which sudden increases in the erosion rate and hydraulic conductivity are observed.
According to Figure 8, the plot of cumulative erosion mass against hydraulic gradient (driving force of internal erosion) for silty clay particles and sandy gravel particles can be obtained, as depicted in Figure 11. Compared to previous studies, Figure 11 allows for a more detailed delineation of the critical hydraulic gradient throughout the erosion process by interpreting the erosion evolution of two kinds of soil particles with respect to the hydraulic gradient. The variation trends of the cumulative erosion mass-hydraulic gradient curves for these two types of soil particles are similar. Before the discharging stage, the cumulative erosive mass of both soil grains increases with the growth of the hydraulic gradient. An increase in the cumulative erosion mass is observed even though the hydraulic gradient decreases after the discharging stage is initiated, which is consistent with the variations in the erosive mass rate of soil particles, as depicted in Figure 8. Upon completion of the internal erosion, approximately 8 g of eroded silty clay particles and approximately 9 g of eroded sandy gravel particles are collected. Five critical hydraulic gradients are identified, corresponding to the onset of different internal erosion behavior. They are:
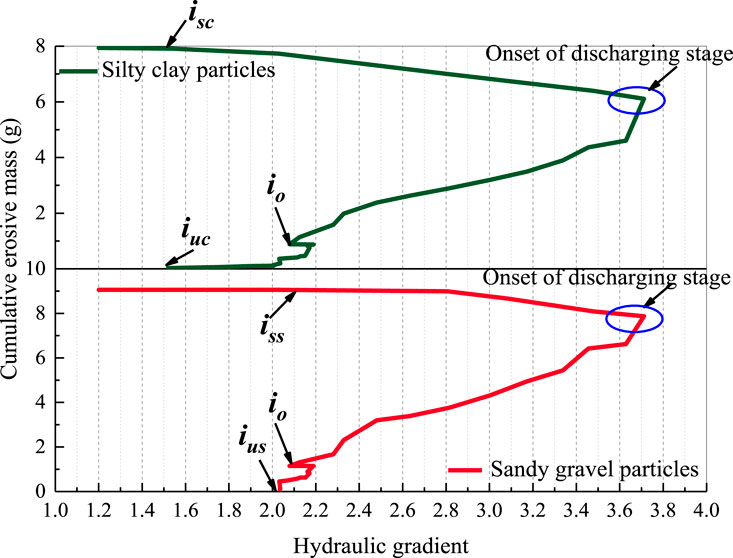
Figure 11. Evolution of the cumulative erosive mass of silty clay and sandy gravel particles versus the hydraulic gradient.
(a) At i =1.5, the erosion of silty clay particles is initiated in the form of suffusion, which is indicated by the onset of an increase in the cumulative erosion mass of the silty clay fraction. The hydraulic gradient of 1.5, iuc, is defined as the suffusion initiation critical hydraulic gradient of silty clay particles.
(b) At i = 2.0, the first sign of the erosion of sandy gravel particles appears in the suffusion stage. The hydraulic gradient of 2.0, ius, is referred to as the suffusion initiation critical hydraulic gradient of sandy gravel particles.
(c) At i = 2.1, a slight decrease in the hydraulic gradient occurs without soil particle erosion. This is followed by similar and simultaneous sharp increases in the cumulative erosion masses of silty clay particles and sandy gravel particles with increasing hydraulic gradients. It indicates the start of the suffosion stage. Because of the similarity in the erosion behaviors of silty clay particles and sandy gravel particles in the suffosion stage, no distinction is made between their suffosion critical hydraulic gradients. Thus, a hydraulic gradient of 2.1 is called the suffosion critical hydraulic gradient, io.
(d) When the hydraulic gradient falls back to 2.1, the end of the erosion of sandy gravel particles is first observed in the stabilization stage. Correspondingly, the hydraulic gradient of 2.1, iss, is called the stabilization initiation critical hydraulic gradient of sandy gravel particles. Interestingly, iss is approximately equal to ius.
(e) When the hydraulic gradient declines to 1.5, the erosion of silty clay particles ends. Therefore, the hydraulic gradient of 1.5, isc,is called the stabilization initiation critical hydraulic gradient of silty clay particles. Equally interestingly, isc is also equal to iuc.
It is worth emphasizing that the erosion behavior of silty clay particles and sandy gravel particles is similar during the suffosion stage, while it differs in the suffusion and stabilization stages. Furthermore, the cumulative erosive mass within the suffusion and stabilization stages is negligible compared with the suffosion stages. Henceforth, in the following sections of this paper, the ius and iss are employed to identify the initiation and cessation of the internal erosion process, respectively.
3.2 Effect of the inflow rate on the internal erosion process
As an external factor driving internal erosion within the current system, it is essential to study the influence of the inflow rate on the internal erosion process of WGLS. To this end, seepage tests are conducted on identical specimens at different inflow rates of 25, 39, 56, and 74 mL/min, as shown in Table 2. The seepage test on specimen T-0.45–25 is terminated at t = 75 min, while seepage tests conducted on specimens T-0.45–56 and T-0.45–74 stop at t = 90 min based on the test termination criteria, as presented in Table 2. Figure 12 shows the evolution of the cumulative erosive mass of soil particles as a function of time and hydraulic gradient for four different inflow rates.
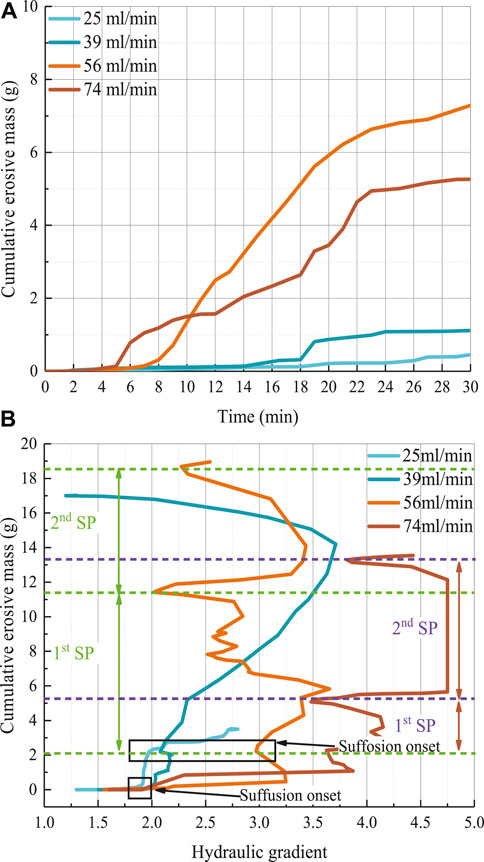
Figure 12. Internal erosion process for four different inflow rates: (A) Evolution of cumulative erosive mass of soil grains against time; (B) Evolution of cumulative erosive mass of soil grains against the hydraulic gradient.
Figure 12A indicates that a lower inflow rate delays the onset of particle erosion. The onset times of particle erosion are 18, 14, 6, and 5 min for cases of 25, 39, 56, and 74 mL/min, respectively. It is easy to shed light on this observation. A higher inflow rate for identical specimens will result in a higher hydraulic gradient applied to the specimen at the same moment. Indeed, the hydraulic gradient is precisely the fundamental cause that triggers internal erosion. Therefore, a higher inflow rate will instigate internal erosion more quickly.
Figure 12B shows that the suffusion initiation critical hydraulic gradient iu has no relation to the inflow rate for identical specimens, with values of 0.9, 1.0, 1.1, and 1.0 m/m for inflow rates of 25, 39, 56, and 74 mL/min, respectively. In fact, iu represents the hydraulic gradient at which the migration of particles initially loosely deposited in the interstice within the specimen starts, as shown in Figures 10A,B. In this way, the hydraulic gradient required to initiate the erosion of these particles should be consistent across these specimens. The nearly identical iu detected in the four specimens confirms that the resistance to suffusion, an inherent characteristic of granular material, is irrespective of the inflow rate. In turn, this phenomenon confirms the effectiveness of the newly proposed experimental device and soil-fluid separation scheme and the correctness of the experimental procedure adopted in the current study.
In contrast with iu, the suffosion initiation critical hydraulic gradients io increase with the inflow rate, but the corresponding cumulative erosion mass at each io remains nearly the same for different inflow rates. Specifically, the io and corresponding cumulative erosion mass for inflow rates of 25, 39, 56, and 74 mL/min are 2.0, 2.1, 3.0, 3.6, and 2.1, 2.2, 2.1, 2.2 g, respectively. As shown in Figure 10C, the io corresponds to a critical state where loose soil particles deposited in the interstice are completely eroded, and dislodgement of matrix soil initiates. Therefore, it is evident that the cumulative erosion mass corresponding to io remains the same for identical specimens at different inflow rates.
The inflow rate significantly impacts the erosion behavior after the suffusion stage. During the process of seeking the equilibrium state of the inflow rate control system, the specimen with an inflow rate of 25 mL/min only undergoes the suffusion stage without experiencing the suffosion stage. The specimen with an inflow rate of 39 mL/min experiences a complete suffosion process stage (referred to as the SP stage in Figure 12B). However, specimens with inflow rates of 56 mL/min and 74 mL/min undergo two occurrences of the SP stage due to continued seepage flow after suffusion. Furthermore, it can be anticipated that these two specimens require more occurrences of the SP stage to reach the ultimate equilibrium state, as both experiments showed increasing hydraulic gradient and cumulative erosion mass when terminating seepage tests at t = 90 min. It also implies that these two specimens will suffer more severe erosion damage when they reach the final equilibrium state.
3.3 Effect of the initial porosity on the internal erosion process
The initial porosity is universally recognized to have a significant effect on the physical and mechanical characteristics of the soil; therefore, studying its effect on the internal erosion process is essential. To this end, seepage tests are performed on specimens at a 39 mL/min inflow rate, which are prepared from identical material and compacted to initial porosities of 0.35, 0.4, 0.45, and 0.5, as shown in Table 2. The seepage tests conducted on specimens T-0.4–39 are stopped at t = 90 min, while the duration of tests on specimens T-0.35–39 and T-0.5–39 is separately 30 min and 65 min, based on the test termination criterion. In seepage tests of specimens T-0.35–39 and T-0.4–39, the maximum hydraulic gradient that the experimental device can apply is reached. Plots of the cumulative erosive mass against hydraulic gradients for the four specimens with different initial porosity are shown in Figure 13. The critical hydraulic gradients of the suffusion and suffosion stages, the cumulative mass of the eroded grains, and the height of the eroded specimen for the four specimens are summarized in Table 3.
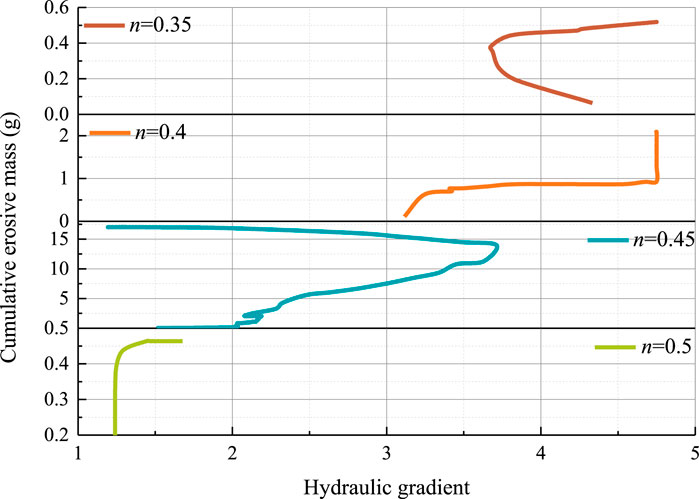
Figure 13. Evolution of cumulative erosive mass versus hydraulic gradient for four different initial porosity.
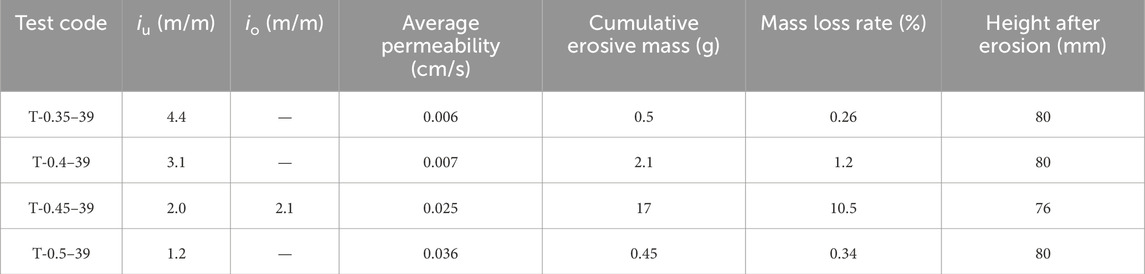
Table 3. Main erosion characteristics for four specimens with different initial porosities.
Figure 13 and Table 3 indicate that iu decreases as the initial porosity increases. It is because the erosion resistance of soil particles initially loosely deposited in the interstice is lower in samples with high initial porosity. Except for the seepage test conducted on specimen T-0.45–39, the suffosion stage does not occur in the other tests, causing the cumulative soil particle erosion mass of specimen T-0.45–39 to be significantly greater than that of the other specimens. According to the mass loss rate, the potential for the internal stability of sample T-0.45–39 is lower than that of the other samples. At this point, three anomalies arise. 1) when comparing specimen T-0.45–39 with specimen T-0.5–39, the result suggests that, somewhat counter-intuitively, reducing the initial porosity may not necessarily result in higher erosion potential; 2) no correlation exists between the mass loss rate and the initial porosity; 3) more significant internal erosion is expected to take place in specimens T-0.35–39 and T-0.4–39 subjected to higher hydraulic gradients (see Figure 12) if assessed solely based on the hydraulic gradient.
Before explaining these anomalies, it should first be noted that the detachment and transportation of particles are driven by the hydrodynamic force exerted on the particles by interstitial fluid (Khilar and Fogler, 1998). The hydrodynamic force generated by the interstitial fluid is referred to as the hydraulic shear stress, τ, and is believed to be a function of the hydraulic gradient, intrinsic permeability, and porosity (Reddi et al., 2000). It takes the following form
where
where k is the Darcy coefficient of permeability;
Figure 14 shows the evolutions of the hydraulic shear stress with time for four specimens with different initial porosities, which are obtained by substituting the experimental data of the hydraulic gradient, hydraulic conductivity, and initial porosity in Equations 10, 11.
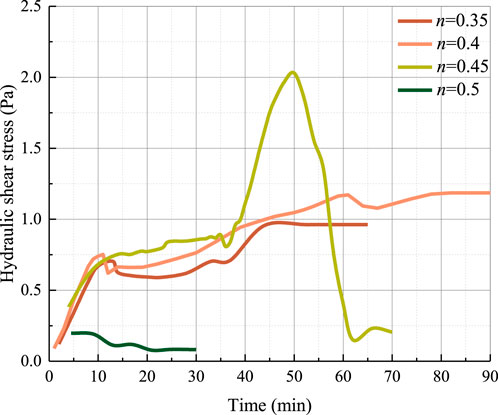
Figure 14. Evolution of hydraulic shear stress with respect to time for four different initial porosities.
The estimated hydraulic shear stress evolution can be used to shed light on these anomalies mentioned above and improve our knowledge of the fundamental causes responsible for internal erosion in WGLS. Specimen T-0.45–39 is subjected to the highest hydraulic shear stress during the internal erosion process. Consequently, the extent of damage induced by internal erosion in specimen T-0.45–39 is the most significant, which is confirmed by the largest cumulative mass of the eroded soil grains. Even though specimens T-0.35–39 and T-0.4–39 are subjected to relatively high hydraulic gradients, the relatively low hydraulic conductivities resulting from the low initial porosities (see Table 3) lead to relatively low hydraulic shear stresses and, thus relatively small amounts of damage caused by internal erosion. Specimen T-0.5–39 has the highest porosity of 0.5, thus exhibiting the highest hydraulic conductivity. Under identical infiltration rate conditions, specimen T-0.5–39 experiences the least hydraulic gradient applied to it. Therefore, its hydraulic shear stress is the lowest and is responsible for the lowest cumulative mass of eroded soil grains. The greater the hydraulic shear stress, the greater the cumulative erosion mass of soil particles, indicating a higher degree of internal erosion damage to the specimen. This positive correlation indicates that a well-defined relationship can be established between the initial porosity and the cumulative erosion mass by using hydraulic shear stress as an intermediate variable.
These results demonstrate that using hydraulic shear stress as an indicator of evaluating the potential of internal stability of the soil is more appropriate than the separate utilization of hydraulic gradient and porosity. This is due to the fact that internal erosion is a combined outcome of external triggering factors (hydraulic gradient) and intrinsic soil properties (permeability and porosity). Furthermore, these results also indicate that internal erosion in the WGLS is a highly complex process. Therefore, it is worth emphasizing that evaluating the internal stability potential of WGLS under rainfall infiltration through experimental testing is more reliable than relying solely on empirical guidelines.
4 Conclusion
Hydrodynamically induced internal erosion in widely graded loose soils (WGLS) due to rainfall infiltration is increasingly recognized as the leading cause of geologic and geotechnical disasters in fragile mountain areas and valley terrains, such as local collapse, shallow slope failure, and debris flows. Internal erosion in WGLS is a complex process that involves the dislodgment, migration, and potential redeposition at the pore throat of fine particles. Therefore, it is urgent to enhance the understanding of the internal erosion process and its influencing factors to elucidate mechanisms behind internal erosion-induced geological hazards under intense rainfall conditions.
In this study, an innovative fixed-wall permeameter is designed to conduct unidirectional downward seepage tests on unconsolidated specimens at the inflow rate-controlled condition. A soil-fluid testing protocol is proposed to separate silty clay particles, sandy gravel particles, and the permeating fluid from the collected effluent. Nine soil column seepage experiments are conducted using new equipment and novel test protocols to reveal the evolution of internal erosion and the influence of inflow rate and initial soil porosity on the process. These conclusions are as follows:
(1) During the process of soil seeking an equilibrium state in the inflow rate-controlled system, three successive erosion stages with different erosion phenomena, namely, the suffusion stage, suffosion stage, and stabilization stage, are observed based on the evolution of erosion indicators, including the erosion mass rates of silty clay and sandy gravel particles, outflow rate, hydraulic gradient, and hydraulic conductivity.
(2) Combining the changes in erosion indicators with the evolution of particle migration patterns, the microscopic mechanisms behind the different erosion phenomena of WGLS specimens are explained. Moreover, five critical hydraulic gradients required to initiate the different erosion stages are detected during the internal erosion process.
(3) The suffusion critical hydraulic gradient, which depends on the erosion resistance of the soil grains initially loosely deposited in the interstice within the specimen, is independent of the inflow rate. Suffosion critical hydraulic gradient increases with the increase in inflow rate. The inflow rate significantly affects erosion behavior during the suffosion stages.
(4) The initial porosity of the soil has an important effect on the critical hydraulic gradient of suffusion. However, specimens with high porosity do not necessarily result in severe erosion damage. It is better to use the hydraulic shear stress, which takes the initial porosity, hydraulic gradient, and hydraulic conductivity into account, to evaluate the potential extent of damage caused by internal erosion, compared to using these indicators individually.
It is worth noting that this study primarily focuses on the impact of internal erosion on the hydraulic properties of WGLS, while the investigation of its influence on the geomechanical properties of the soil is lacking. However, the latter is crucial for understanding the geological hazards caused by internal erosion and will be addressed in future research.
Data availability statement
The original contributions presented in the study are included in the article/supplementary material, further inquiries can be directed to the corresponding author.
Author contributions
LL: Conceptualization, Funding acquisition, Writing–original draft, Writing–review and editing. D-LT: Conceptualization, Data curation, Investigation, Methodology, Writing–original draft, Writing–review and editing. Z-CL: Conceptualization, Methodology, Writing–review and editing.
Funding
The author(s) declare that financial support was received for the research, authorship, and/or publication of this article. The work is supported by the project of science and technology research program of Chongqing Education Commission of China (No. KJQN202004306) and the project supported by graduate research and innovation foundation of Chongqing, China (Nos CYS22050 and CYS21351).
Acknowledgments
We acknowledge the preprint titled “Internal erosion process and its influence factors in widely graded loose soils due to rainfall infiltration” by D-LT, LL, and Z-CL, available at https://www.authorea.com/doi/full/10.22541/au.168802759.94576154/v1.
Conflict of interest
Authors D-LT and Z-CL were employed by Design and Research Institute Co., Ltd., Of CREEC.
The remaining author declares that the research was conducted in the absence of any commercial or financial relationships that could be construed as a potential conflict of interest.
Publisher’s note
All claims expressed in this article are solely those of the authors and do not necessarily represent those of their affiliated organizations, or those of the publisher, the editors and the reviewers. Any product that may be evaluated in this article, or claim that may be made by its manufacturer, is not guaranteed or endorsed by the publisher.
References
ASTM (2016). “Standard test methods for measurement of hydraulic conductivity of saturated porous materials using a flexible wall permeameter,” in Annual book of ASTM standards (Conshohocken, PA: ASTM International West).
ASTM (2018). “Standard test method for materials finer than 75-μm (no. 200) sieve in mineral aggregates by washing,” in Annual book of ASTM standards (Conshohocken, PA: ASTM International West).
Bendahmane, F., Marot, D., and Alexis, A. (2008). Experimental parametric study of suffusion and backward erosion. J. Geotech. Geoenviron. Eng. 134 (1), 57–67. doi:10.1061/(asce)1090-0241(2008)134:1(57)
Burenkova, V. V. (1993). “Assessment of suffusion in non-cohesive and graded soils: filters in geotechnical and hydraulic engineering,” in Brauns, Heibaum and Schuler (Rotterdam: Balkema), 357–360.
Chang, D. S., and Zhang, L. M. (2011). A stress-controlled erosion apparatus for studying internal erosion in soils. Geotech. Test. J. 34 (6), 579–589. doi:10.1520/gtj103889
Chapuis, R. P., and Saucier, A. (2020). Assessing internal erosion with the modal decomposition method for grain size distribution curves. Acta Geotech. 15, 1595–1605. doi:10.1007/s11440-019-00865-z
Chehlafi, A., Kchikach, A., Derradji, A., and Mequedade, N. (2019). Highway cutting slopes with high rainfall erosion in Morocco: evaluation of soil losses and erosion control using concrete arches. Eng. Geol. 260, 105200. doi:10.1016/j.enggeo.2019.105200
Crosta, G., and Prisco, C. D. (1999). On slope instability induced by seepage erosion. Can. Geotech. J. 36, 1056–1073. doi:10.1139/cgj-36-6-1056
Cui, P., Guo, C. X., Zhou, J. W., Hao, M. H., and Xu, F. G. (2014). The mechanisms behind shallow failures in slopes comprised of landslide deposits. Eng. Geol. 180, 34–44. doi:10.1016/j.enggeo.2014.04.009
Cui, Y. F., Jiang, Y., and Guo, C. X. (2019). Investigation of the initiation of shallow failure in widely graded loose soil slopes considering interstitial flow and surface runoff. Landslides 16, 815–828. doi:10.1007/s10346-018-01129-9
Cui, Y. F., Zhou, X. J., and Guo, C. X. (2017). Experimental study on the moving characteristics of fine grains in wide grading unconsolidated soil under heavy rainfall. J. Mt. Sci. 14 (3), 417–431. doi:10.1007/s11629-016-4303-x
Dou, J., Xiang, Z. L., Xu, Q., Zheng, P. L., Wang, X. K., Su, A. J., et al. (2023). Application and development trend of machine learning in landslide intelligent disaster prevention and mitigation. Earth Sci. 48 (5), 1657–1674. doi:10.3799/dqkx.2022.419
Dou, J., Yunus, A. P., Merghadi, A., Shirzadi, A., Nguyen, H., Hussain, Y., et al. (2020). Different sampling strategies for predicting landslide susceptibilities are deemed less consequential with deep learning. Sci. Tol. Environ. 720, 137320. doi:10.1016/j.scitotenv.2020.137320
Fang, K., Fu, Y. L., Tang, H. M., Gao, T. Z., An, P. J., and Wu, Q. (2024). Landslide model tests with a miniature 2D principal stress (PS) sensor. J. Rock Mech. Geotech. doi:10.1016/j.jrmge.2023.12.025
Fang, K., Miao, M. H., Tang, H. M., Jia, S. X., Dong, A., An, P. J., et al. (2023a). Insights into the deformation and failure characteristic of a slope due to excavation through multi-field monitoring: a model test. Acta Geotech. 18, 1001–1024. doi:10.1007/s11440-022-01627-0
Fang, K., Tang, H. M., Li, C. D., Su, X. X., An, P. J., and Sun, S. X. (2023b). Centrifuge modelling of landslides and landslide hazard mitigation: a review. Geosci. Front. 14, 101493. doi:10.1016/j.gsf.2022.101493
Fannin, R. J., and Slangen, P. (2014). On the distinct phenomena of suffusion and suffosion. Géotechnique Lett. 4, 289–294. doi:10.1680/geolett.14.00051
Frost, J. D., and Park, J. Y. (2003). A critical assessment of the moist tamping technique. Geotech. Test. J. 26 (1), 57–70. doi:10.1520/gtj11108j
Gu, D. M., Huang, D., Liu, H. L., Zhang, W. G., and Gao, X. C. (2019). A DEM-based approach for modeling the evolution process of seepage-induced erosion in clayey sand. Acta Geotech. 14, 1629–1641. doi:10.1007/s11440-019-00848-0
Guo, C. X., and Cui, Y. F. (2020). Pore structure characteristics of debris flow source material in the Wenchuan earthquake area Wenchuan earthquake area. Eng. Geol. 267, 105499. doi:10.1016/j.enggeo.2020.105499
Guo, X. J., Li, Y., Cui, P., Zhao, W. Y., Jiang, X. Y., and Yan, Y. (2016). Discontinuous slope failures and pore-water pressure variation. J. Mt. Sci. 13 (1), 116–125. doi:10.1007/s11629-015-3528-4
Han, T. C., Lin, B. W., Wu, J. Y., and Wei, X. (2024). Three-dimensional stability analysis of two-layer slope based on GIS under rainfall conditions. Georisk 18 (2), 423–446. doi:10.1080/17499518.2024.2302134
Havaee, S., Mosaddeghi, M. R., and Ayoubi, S. (2015). In situ surface shear strength as affected by soil characteristics and land use in calcareous soils of central Iran. Geoderma 237–238, 137–148. doi:10.1016/j.geoderma.2014.08.016
Hu, J. B., Weng, X. L., Yang, L. X., Lei, S. M., and Niu, H. S. (2022). Centrifugal modeling test on failure characteristics of soil-rock mixture slope under rainfall. Eng. Fail. Anal. 142, 106775. doi:10.1016/j.engfailanal.2022.106775
Israr, J., and Indraratna, B. (2019). Study of critical hydraulic gradients for seepage-induced failures in granular soils. J. Geotech. Geoenviron. Eng. 145 (7), 04019025. doi:10.1061/(asce)gt.1943-5606.0002062
Jiang, M. J., Konrad, J. M., and Leroueil, S. (2003). An efficient technique for generating homogeneous specimens for DEM studies. Comput. Geotech. 30 (7), 579–597. doi:10.1016/s0266-352x(03)00064-8
Jiang, X. G., Worman, A., Chen, X. Q., Zhu, Z. Y., Zou, Z. Y., Xiao, W. M., et al. (2023). Internal erosion of debris-flow deposits triggered by seepage. Eng. Geol. 314, 107015. doi:10.1016/j.enggeo.2023.107015
Ke, L., and Takahashi, A. (2014). Triaxial erosion test for evaluation of mechanical consequences of internal erosion. Geotech. Test. J. 37 (2), 347–364. doi:10.1520/gtj20130049
Kenney, T. C., and Lau, D. (1985). Internal stability of granular filters. Can. Geotech. J. 22, 215–225. doi:10.1139/t85-029
Khilar, K. C., and Fogler, H. S. (1998). Migrations of fines in porous media. Springer Science and Business Media.
Ladd, R. S. (1978). Preparing test specimens using undercompaction. Geotech. Test. J. 1 (1), 16–23. doi:10.1520/gtj10364j
Li, J. M., Li, L., Wang, W. L., Kang, H. L., Guo, M. M., Huang, J. Q., et al. (2023). Hydrological and erosion responses of steep spoil heaps to taproot and fibrous root grasses under simulated rainfalls. J. Hydrol. 618, 129169. doi:10.1016/j.jhydrol.2023.129169
Li, M., and Fannin, R. J. (2012). A theoretical envelope for internal instability of cohesionless soil. Géotechnique 62 (1), 77–80. doi:10.1680/geot.10.t.019
Li, W. C., Deng, G., Liang, X. Q., Sun, X. X., Wang, S. W., and Lee, M. L. (2020). Effects of stress state and fine fraction on stress transmission in internally unstable granular mixtures investigated via discrete element method. Powder Technol. 367, 659–670. doi:10.1016/j.powtec.2020.04.024
Liang, L., Tian, D. L., Ning, Y., and Wang, X. (2020a). Experimental investigation of internal stability of widely graded coarse granular soil and criteria of internal stability. Chin. J. Undergr. Space Eng. 16 (3), 835–843.
Liang, Y., Yeh, T. C. J., Ma, C., Zhang, Q., Yang, D. H., and Hao, Y. H. (2020b). Experimental investigation of internal erosion behaviours in inclined seepage flow. Hydrol. Process. 34 (26), 5315–5326. doi:10.1002/hyp.13944
Liang, Y., Zhang, B., Yang, Y. M., Zhang, H. J., and Dai, L. (2023). Experimental investigation on erosion progression and strength reduction of gap-graded cohesionless soil subjected to suffusion. Environ. Earth Sci. 82, 173. doi:10.1007/s12665-023-10871-w
Lindow, N., Fox, G. A., and Evans, R. O. (2009). Seepage erosion in layered stream bank material. Earth Surf. Proc. Land 34, 1693–1701. doi:10.1002/esp.1874
Lu, M., Wang, H. A., Sharma, A., and Zhang, J. (2024). A stochastic rainfall model for reliability analysis of rainfall-induced landslides. Georisk, 1–15. doi:10.1080/17499518.2024.2359957
Ma, Q. R., Wautier, A., and Zhou, W. (2021). Microscopic mechanism of particle detachment in granular materials subjected to suffusion in anisotropic stress states. Acta Geotech. 16, 2575–2591. doi:10.1007/s11440-021-01301-x
Mao, H. T., Zhang, C., He, T., and Yi, G. (2022). Influences of seepage of muddy water on the permeability of coarse-grained soil. Trans. CSAE. 38 (9), 140–150. doi:10.11975/j.issn.1002-6819.2022.09.015
Maroof, M. A., Mahboubi, A., and Noorzad, A. (2021). Effects of grain morphology on suffusion susceptibility of cohesionless soils. Granul. Matter. 23, 8. doi:10.1007/s10035-020-01075-1
Marot, D., Regazzoni, P. L., and Wahl, T. (2011). Energy-based method for providing soil surface erodibility rankings. J. Geotech. Geoenviron. Eng. 137 (12), 1290–1293. doi:10.1061/(asce)gt.1943-5606.0000538
Moffat, R. A., Fannin, R. J., and Garner, S. J. (2011). Spatial and temporal progression of internal erosion in cohesionless soil. Can. Geotech. J. 48 (3), 399–412. doi:10.1139/t10-071
Ni, H. Y., Zheng, W. M., Tie, Y. B., Su, P. C., Tang, Y. Q., Xu, R. G., et al. (2012). Formation and characteristics of post-earthquake debris flow: a case study from Wenjia Gully in Mianzhu, Sichuan, SW China. Nat. Hazards 61, 317–335. doi:10.1007/s11069-011-9914-5
Reddi, L. N., Lee, I. M., and Bonala, M. V. (2000). Comparison of internal and surface erosion using flow pump tests on a sand-kaolinite mixture. Geotech. Test. J. 23 (1), 116–122. doi:10.1520/gtj11129j
Richards, K. S., and Reddy, K. R. (2007). Critical appraisal of piping phenomena in earth dams. Bull. Eng. Geol. Environ. 66 (4), 381–402. doi:10.1007/s10064-007-0095-0
Rochim, A., Marot, D., Sibille, L., and Le, V. T. (2017). Effects of hydraulic loading history on suffusion susceptibility of cohesionless soils. J. Geotech. Geoenviron. Eng. 143 (7), 04017025. doi:10.1061/(asce)gt.1943-5606.0001673
Shire, T., O’Sullivan, C., Hanley, K. J., and Fannin, R. J. (2014). Fabric and effective stress distribution in internally unstable soils. J. Geotech. Geoenviron. Eng. 140 (12), 04014072. doi:10.1061/(asce)gt.1943-5606.0001184
Skempton, A. W., and Brogan, J. M. (1994). Experiments on piping in sandy gravels. Géotechnique 44 (3), 449–460. doi:10.1680/geot.1994.44.3.449
Slangen, P., and Fannin, R. J. (2017). A flexible wall permeameter for investigating suffusion and suffusion. Geotech. Test. J. 40 (1), 1–14. doi:10.1520/GTJ20150287
Taha, H., Nguyen, N. S., Marot, D., Hijazi, A., and Saleh, K. A. (2022). A DEM study of the effect of the loss of fine particles on the mechanical behavior of gap-graded soils. Geomech. Energy Envir. 31, 100305. doi:10.1016/j.gete.2021.100305
Tian, D. L. (2018). “Influence factor study of internal stability of silty clay containing rock fragments under Rainfall Infiltration,”. MPhil. thesis (Chongqing, China: Chongqing University).
Tian, D. L., Xie, Q., Fu, X., and Zhang, J. H. (2020a). Experimental study on the effect of fine contents on internal erosion in natural soil deposits. Bull. Eng. Geol. Environ. 79, 4135–4150. doi:10.1007/s10064-020-01829-4
Tian, D. L., Xie, Q., Ning, Y., Fu, X., and Zhang, J. H. (2020b). Experimental investigation on seepage deformation of gap-graded sand-gravel soils. Rock Soil Mech. 41 (11), 3663–3670. doi:10.16285/j.rsm.2020.0253
To, P., Agius, D., and Cussen, L. (2020). Influence of relative density of the granular base soil on filter Performance. Acta Geotech. 15, 3621–3627. doi:10.1007/s11440-020-01064-x
To, P., Scheuermann, A., and Williams, D. J. (2018). Quick assessment on susceptibility to suffusion of continuously graded soils by curvature of particle size distribution. Acta Geotech. 13, 1241–1248. doi:10.1007/s11440-017-0611-8
US Army Corps of Engineers (1953). “Filter experiments and design criteria,” in Technical memorandum (Vicksburg: Waterways Experiment Station).
Wan, C. F., and Fell, R. (2008). Assessing the potential of internal instability and suffusion in embankment dams and their foundations. J. Geotech. Geoenviron. Eng. 134 (3), 401–407. doi:10.1061/(asce)1090-0241(2008)134:3(401)
Wang, G., Deng, Z. Z., Yang, J., Chen, X. S., and Jin, W. (2022). A large-scale high-pressure erosion apparatus for studying internal erosion in gravelly soils under horizontal seepage flow. Geotech. Test. J. 45 (6), 1037–1053. doi:10.1520/gtj20220045
Wang, Z. B., Wang, R., Hu, M. J., Chen, N. Y., and Lü, S. Z. (2011). Effects of particle transport characteristics on permeability of soils from Jiangjiagou ravine. Rock Soil Mech. 32 (7), 2017–2024. doi:10.16285/j.rsm.2011.07.012
Xiang, Z. L., Dou, J., Yunus, A. P., Zhang, L. L., Wang, X. K., and Luo, W. Q. (2023). Vegetation-landslide nexus and topographic changes post the 2004 Mw 6.6 Chuetsu earthquake. Catena 223, 106946. doi:10.1016/j.catena.2023.106946
Xiao, M., and Shwiyhat, N. (2012). Experimental investigation of the effects of suffusion on physical and geomechanic characteristics of sandy soils. Geotech. Test. J. 35 (6), 104594–104900. doi:10.1520/gtj104594
Xiao, Y., Ma, G. L., Wu, H. R., Lu, H. M., and Zaman, M. (2022). Rainfall-induced erosion of biocemented graded slopes. Int. J. Geomech. 22 (1), 04021256. doi:10.1061/(asce)gm.1943-5622.0002239
Yin, Y. Z., Cui, Y. F., Liu, D. Z., and Lei, M. Y. (2019). Study on microscopic process of fine particle migration in loose soil. Adv. Eng. Sci. 51 (4), 21–29. doi:10.15961/j.jsuese.201900253
Yousefpour, N., and Fazel Mojtahedi, F. (2023). Early detection of internal erosion in earth dams: combining seismic monitoring and convolutional AutoEncoders. in Georisk, 1–21. doi:10.1080/17499518.2023.2251128
Yuan, G. L., and Che, A. L. (2022). Evolution and spatio-temporal characteristics of slope erosion due to rainfall in Southwest China. Bull. Eng. Geol. Environ. 81, 270. doi:10.1007/s10064-022-02767-z
Zhang, Z. L., Zeng, R. Q., Meng, X. M., Zhao, S. F., Ma, J. H., Wang, H., et al. (2022). Effects of material migration on the spatial distribution of topsoil moisture at the slope scale. Eng. Geol. 308, 106820. doi:10.1016/j.enggeo.2022.106820
Zhang, Z. L., Zeng, R. Q., Meng, X. M., Zhao, S. F., Wang, S. X., Ma, J. H., et al. (2023). Effects of changes in soil properties caused by progressive infiltration of rainwater on rainfall-induced landslides. Catena 233, 107475. doi:10.1016/j.catena.2023.107475
Zhang, Z. P., Fu, X. D., Sheng, Q., Du, Y. X., Zhou, Y. Q., and Huang, J. H. (2021). Stability of cracking deposit slope considering parameter deterioration subjected to rainfall. Int. J. Geomech. 21. doi:10.1061/(asce)gm.1943-5622.0002045
Zhu, Q., Su, L. J., Liu, Z. Y., and Yang, S. H. (2021). Study of seepage in wide-grading soils with particles migration. Rock Soil Mech. 42 (1), 125–134. doi:10.16285/j.rsm.2020.0623
Keywords: internal erosion, widely graded loose soils, fixed-wall permeameter, soil column seepage test, suffusion, suffosion
Citation: Liang L, Tian D-L and Li Z-C (2024) Internal erosion process and its influence factors in widely graded loose soils due to rainfall infiltration. Front. Earth Sci. 12:1418293. doi: 10.3389/feart.2024.1418293
Received: 16 April 2024; Accepted: 31 July 2024;
Published: 16 August 2024.
Edited by:
Jie Dou, China University of Geosciences Wuhan, ChinaReviewed by:
Tengyuan Zhao, Xi’an Jiaotong University, ChinaKun Fang, Hong Kong University of Science and Technology, Hong Kong SAR, China
Copyright © 2024 Liang, Tian and Li. This is an open-access article distributed under the terms of the Creative Commons Attribution License (CC BY). The use, distribution or reproduction in other forums is permitted, provided the original author(s) and the copyright owner(s) are credited and that the original publication in this journal is cited, in accordance with accepted academic practice. No use, distribution or reproduction is permitted which does not comply with these terms.
*Correspondence: Da-Lang Tian, dGlhbmRhbGFuZ0BjcXUuZWR1LmNu