- NOAA Atlantic Oceanographic and Meteorological Laboratory, Miami FL and Cooperative Institute for Marine and Atmospheric Studies, University of Miami, Miami, FL, United States
This study examines the influence of NASA Cyclone Global Navigation Satellite System (CyGNSS) Level 2-derived 10 m (near-surface) wind speed over the ocean on analyses and forecasts within the NOAA operational Hurricane Analysis and Forecast System (HAFS). HAFS is coupled with a regional configuration of the HYCOM ocean model. The primary advantages of data from the CyGNSS constellation of satellites include higher revisit frequency compared to polar-orbiting satellites, and the availability of reliable wind observations over the ocean surface during convective precipitation. CyGNSS data are available early in the life cycle of tropical cyclones (TCs) when aerial reconnaissance observations are not available. We focus on TCs whose forecasts were initialized when the TC was a depression or tropical storm. In the present study, we find first, that assimilation of CyGNSS near-surface winds improves storm track, intensity, and structure statistics in the analysis and early in the forecast, for many cases. Second, we find that assimilation of CyGNSS observations provides additional insights into the evolution of air-sea interaction in intensifying TCs: In effect, the ocean responds in the coupled model to modifications in the initial 10 m wind field, thereby impacting forecasts of intensity, storm structure, and sea surface height, as demonstrated by two case studies. We also discuss some forecasts where assimilating CYGNSS appears to degrade performance for either intensity or structure.
1 Introduction
Improving 10 m wind analyses is crucial to improving forecasts of potential hazards from tropical cyclones (TCs) such as wind gusts and, in particular, perhaps the deadliest TC hazard, storm surge (Rappaport et al., 2009; Powell and Reinhold, 2007). Storm surge in recent US landfalling TCs has accounted for more deaths than any other cause. For example, the National Hurricane Center (NHC), in its end-of-season report on landfall damage from Hurricane Ian, states, “Ian was responsible for at least 156 fatalities, 66 of which were considered deaths directly caused by the storm. […] Storm surge was the deadliest hazard, claiming 41 lives, with 36 of the 41 surge fatalities occurring in Lee County, Florida […] Of other causes, only] 4 were related to wind, and 1 was due to rough surf.” (NHC, 2023). In the present study, we will see that assimilating near-surface wind data can significantly influence forecasts of TC intensity, of the ocean conditions beneath the TC, and ultimately, the initial conditions upon which storm surge forecasts are based.
Extensive literature shows that satellite 10 m wind observations over the ocean help to improve the accuracy of numerical weather analyses and forecasts (Atlas et al., 2001; Atlas, 1997; Candy et al., 2009; Leidner et al., 2003; Schulz et al., 2007). However, most existing satellite observing systems have limited temporal resolution (e.g., 1–2 overpasses per day), and some of those based on scatterometry may saturate at higher wind speeds, and may provide less accurate ocean 10 m high wind speed data when there is precipitation. Scatterometry performance depends on the type of scatterometer: C-band scatterometers (e.g., ASCAT) perform well in precipitation, but usually have smaller swaths, while Ku-band scatterometers (e.g., QSCAT, OSCAT) experience significant attenuation in precipitation. Both types of scatterometers, however, tend to saturate at high wind speed (Dani et al., 2023).
Of satellite remote sensing instruments, only L-band receivers, such as those on the NASA Cyclone Global Navigation Satellite System (CyGNSS; Ruf C. S. et al., 2016; Ruf C. et al., 2016), can observe winds in the presence of heavy rain - a ubiquitous feature within the core and feeder bands of a TC. Thus, CyGNSS has the potential to mitigate some of the previous shortcomings in the temporal and spatial sampling of the 10 m wind field in TCs (Rappaport et al., 2009). CyGNSS also provides more frequent wind speed retrieval than other systems, which can be critical in sampling the rapid evolution of TC wind structure (Rogers et al., 2013), especially during rapid intensification (RI) or eyewall replacement cycles. These features of CyGNSS also have the potential to improve the accuracy of the forecast wind products which are required for operational and research storm surge models, e.g., the Coastal and Estuarine Storm Tide (CEST; Xiao et al., 2006) and the Sea, Lake, and Overland Surges from Hurricane (SLOSH; Glahn et al., 2009) models.
Due to coordinated efforts such as the Hurricane Forecast Improvement Project (HFIP; Gopalakrishnan et al., 2021), operational TC forecasting has improved markedly over the last 15 years. The accuracy of TC track forecasts has continued to improve, particularly at longer lead times (4 and 5 days, e.g., Landsea and Cangialosi, 2018). Furthermore, research programs have recently also improved intensity forecasts as measured by either maximum 10 m winds or minimum central pressure (Cangialosi et al., 2020; Alaka jr et al., 2024). Finally, recent research has focused on other metrics important to forecasting TC hazards, such as wind radii (e.g., Cangialosi and Landsea, 2016).
The current study presents the results of an observing system experiment (OSE), building upon previous research which used observing system simulation experiments (OSSEs). Numerous studies have explored the effects of simulated CyGNSS-derived winds through regional OSSEs (McNoldy et al., 2017; Zhang et al., 2017; Annane et al., 2018; Leidner et al., 2018). OSSEs operate on the same principle as OSEs, but utilize observations derived from a simulated atmosphere to assess observations that are not yet available (e.g., Hoffman and Atlas, 2016). The four CyGNSS OSSE studies mentioned earlier employed a regional OSSE system, wherein the Hurricane Weather Research and Forecasting (HWRF) limited-area model was utilized to generate TC forecasts using simulated observations.
McNoldy et al. (2017) and Zhang et al. (2017) investigated scalar winds' impact and identified enhancements in the analyses and forecasts of track, storm intensity, and storm structure. McNoldy et al. (2017) proposed that incorporating a directional component may improve results. Annane et al. (2018) observed positive impacts on track and intensity forecasts from scalar and vector winds, particularly when cycling every 3 h compared to 1- or 6-h cycling intervals. Leidner et al. (2018), on the other hand, noted more consistent improvements from wind data assimilation in storm intensity (2-5 knots) than in track forecasts, but their findings also showed that vector winds were more beneficial than scalar winds in improving model representation of 10 m wind field structures. Analyses without directional wind components were found to be more susceptible to dynamic imbalances and non-physical storm structure asymmetries.
This study focuses on the impact of CyGNSS-derived 10 m wind speed observations over the ocean on numerical weather prediction (NWP) analyses and forecasts of the NOAA operational Hurricane Analysis and Forecast System (HAFS). The aim of the present study is, first, to look at the impacts of CyGNSS on statistics for storm track, intensity, and structure, then, second, to analyze the effects of CyGNSS on the evolution of air-sea interaction in intensifying TCs. In the discussion below, we also briefly note that such data can contribute to improving NWP model parameterizations for surface air-sea fluxes (wind stress and sensible and latent heat). However, such improvements are beyond the scope of the present work. The paper is structured as follows: Section 2 outlines the OSE framework and presents the experimental design, while Section 3 discusses the results. Section 4 summarizes this study, focusing on its findings and limitations, and briefly outlines future planned studies.
2 Data and methods
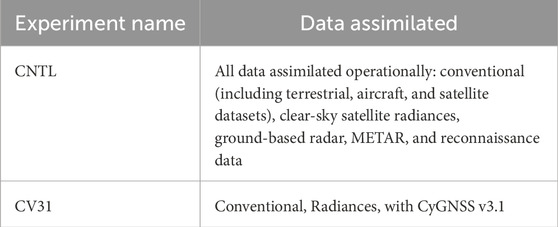
Since a global modeling system is heavily parameterized and cannot sufficiently resolve the small scales that are significant contributors to the rapid intensification processes of TCs, a regional model specifically developed for TCs is utilized in this study (Mueller et al., 2021). A version of the operational HAFS model is chosen (see Sec. 2.2). This approach enables the assessment of the impact of CyGNSS Level 2 data through improved HAFS initial conditions (ICs). We evaluated impacts of assimilating CyGNSS data on TC intensity and structure forecasts from the “B” configuration (hereafter, HFSB) of NOAA HAFS v1.0 (Hazelton et al., 2023) using two experiments (see Table 1). Initialization for all experiments occurs at the specified time indicated in column 2 of Table 2, until reaching the date and time specified in column 3. For each 5-day forecast within a given OSE experiment, Error metrics are computed every 6 h with respect to the Best Track data, where error is defined as the difference between the experiment and the Best Track data.
The initial four cycles (full day) of the experimental period for each storm is used to initialize the model state with CyGNSS observations, while forecast cycles from all subsequent days are utilized to generate TC statistics. Mueller et al. (2021) took a similar approach, but used 15 days to initialize the model state with CYGNSS observations; theirs however, was a global model. Annane et al. (2018) on the other hand used 1 day in the regional hurricane model HWRF.
2.1 CyGNSS
The CyGNSS constellation, comprising GPS receivers aboard eight minisats launched on 17 December 2016, captures reflected ocean surface signals of opportunity emitted by existing GPS satellites (level-1). Unlike traditional scatterometers with a monostatic setup, where the transmitter and receiver are collocated, CyGNSS utilizes a bistatic configuration as depicted in Figure 1, where the transmitter and receiver are positioned on separate platforms. CyGNSS Level 2 data comprises 10 m derived winds extracted from the level-1 data. These level-1 data represent the raw scattered GPS radio signals collected by CyGNSS receivers, initially processed into Level-1 observables such as normalized bistatic radar cross-section and leading-edge slope (Gleason et al., 2016; 2019; Clarizia and Ruf, 2016a; Clarizia and Ruf, 2016b).
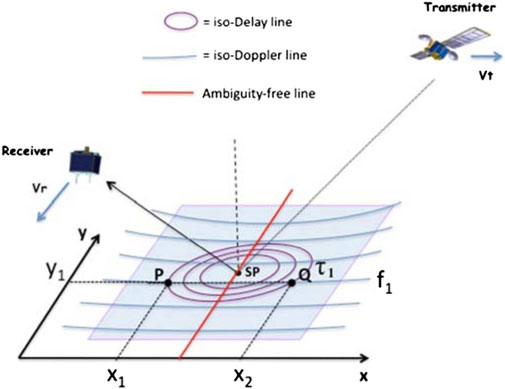
Figure 1. The geometry of bistatic radar measurement involving GPS-based quasi-specular surface scattering is depicted. The GPS direct signal, the transmitter, furnishes location, timing, and frequency references. Conversely, the forward scattered signal, received by CyGNSS as the receiver, carries ocean surface information. Image credit: Rose et al. (2014).
Various CyGNSS-retrieved ocean surface data versions are generated through different processing and calibration methods applied to the CyGNSS Level I data. The geophysical model functions (GMFs) used to convert Level-1 to Level-2 data vary based on the sea state (Ruf and Balasubramaniam, 2019). We have two sea states: young seas with limited fetch (YSLF), characterized by rapidly changing wind and sea state, often observed in stormy weather conditions, and fully developed seas (FDS), characterized by mature periodic waves without rapid changes in wind or sea state. For this study, winds retrieved using the YSLF algorithm were chosen because YSLF conditions prevail over a large portion of the ocean surface where the HAFS storm-following moving nest operates.
The CyGNSS Level 2 wind speed data (Version 3.1) is extracted from the NETCDF files available at the following link: https://podaac.jpl.nasa.gov/dataset/CyGNSS_L2_V3.1. The data undergoes quality control, where only winds with errors less than or equal to 3 m/s are retained. After this filtering, we are left with a relatively small sample, particularly at high wind speeds. Discrepancies in error statistics are observed when comparing different versions of CyGNSS Level 2 winds, as discussed by Pu et al. (2022). The latest operational versions, v3.0 and v3.1, show an increase in high wind speeds relative to v2; however, they also come with larger uncertainties. The 6-hourly prepbufr files required by HAFS DA are generated from CYGNSS for the times listed in Table 2.
Incorporating CYGNSS data into assimilation poses a challenge due to its spatial measurement density, which stands at 6 km along the specular path. This leads to notable overlap between consecutive observations, sampling much of the same ocean surface area within seconds, thereby introducing a correlation between observations. Using all these observations without adjustments risks overfitting the model state to the data. In our OSE, we choose not to thin the CyGNSS data but to utilize all available data and inflate the errors associated with CyGNSS relative to other observation sources with smaller observation samples, to avoid overfitting with CyGNSS. This follows the approach outlined by Mueller et al., 2021. Figure 2 depicts an example of CyGNSS Level 2 10 m winds for the analysis time of 06:00 UTC on 7 October 2018.

Figure 2. CyGNSS Level 2 10 m winds for analysis time: 7 October 2018 06:00 UTC. Assimilation windows span 6 h ( ± 3 h) and are centered at the analysis times. Each individual point on the plot corresponds to observations at specular points. Due to the scale of the plots, these points may appear to create lines, commonly referred to as specular point tracks.
2.2 Hurricane Analysis and Forecast System
The HFSB configuration of NOAA HAFS v1.0 was made operational in 2023. HAFS is a hurricane application of NOAA’s Unified Forecast System (UFS) framework, which couples a regional configuration of the FV3 finite-volume atmospheric model (Lin and Rood, 1996; Lin, 2004) using assimilation of atmospheric observations, with the Hybrid-Coordinate Ocean Model (HYCOM) (Bleck et al., 2002) through the Community Mediator for Earth Prediction Systems (CMEPS). The HFSB version of HAFS incorporates updated parameterizations for planetary boundary layer (PBL) mass flux and atmospheric microphysics. HFSB uses a fixed, storm-centric, 75x75° outer regional atmospheric domain based on Extended Schmidt Gnomonic (ESG) projection with horizontal resolution of 6 km. Coupled with this outer domain is a moving nest of about 12x12° at 2 km horizontal resolution (Figure 3). The moving nest vertical grid has 81 vertical levels reaching 2 hPa. The HYCOM domain is fixed (non-storm centric) and covers the NHC’s areas of responsibility for the North Atlantic, Eastern North Pacific and Central North Pacific basins, at 1/12-degree horizontal grid spacing with 41 vertical ocean levels.
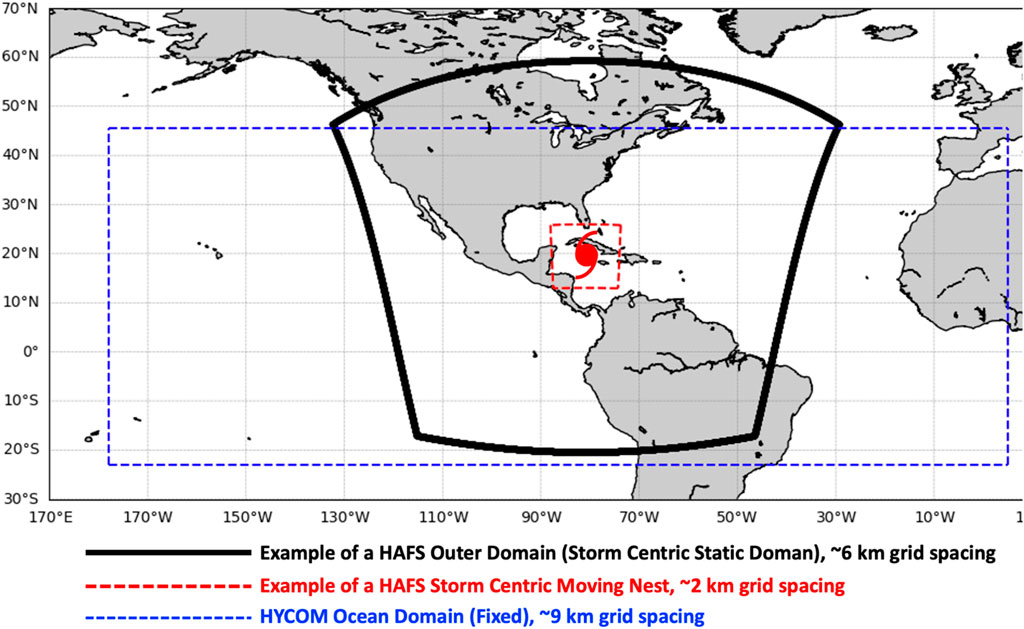
Figure 3. The black box represents the outer domain (fixed, initially storm-centric with 6-km grid spacing). The red box indicates the storm-centered moving nest with 2-km grid spacing. The HYCOM ocean domain (with 9-km grid spacing) is depicted in blue.
The Global Forecasting System version 16 (GFSv16) provides atmospheric initial conditions and 3-hourly lateral boundary conditions for the outer domain. HFSB also features vortex initialization (e.g., Lin, 2004), comprising vortex relocation for all cases and vortex modification (intensity and size) when initial TC intensity is ≥30 m/s. Techniques used to assimilate atmospheric observations include four-dimensional ensemble variational (4DEnVar, using GDAS ENKF ensemble members) and First-Guess at Appropriate Time (FGAT). HAFS also implements self-cycling (warm-cycling) for the atmospheric model, initializing subsequent forecast cycles utilizing the previous cycle. HAFS currently only performs DA on the inner moving atmospheric nest. Ocean initial conditions come from the operational Real Time Ocean Forecasting System (RTOFSv2; Garraffo et al., 2020), which performs ocean DA; HAFS HYCOM itself performs no ocean DA. At each coupling time step, FV3 and HYCOM exchange coupling variables as outlined in the companion paper by Gramer et al. (2024). HFSB uses atmospheric physics parameterization options as documented in Hazelton et al., 2023, including the scale-aware Simplified Arakawa-Schubert (SAS) convective scheme (Han et al., 2017), the turbulent-kinetic-energy (TKE)-based eddy diffusivity mass flux (EDMF-TKE) PBL scheme (Han and Bretherton, 2019), and the Thompson microphysics scheme (Thompson et al., 2004). See Hazelton et al. (2023) for further details.
The version of HAFS described here can be obtained from the production/hafs. v1 branch of the HAFS GitHub repository, https://github.com/hafs-community/HAFS.
To assess the impact of CyGNSS, we generated forecasts from the time of cyclogenesis for each TC case, taking advantage of self-cycling atmospheric DA. The CyGNSS forecasts utilized an identical atmospheric model configuration to that described above, including atmospheric DA, but also incorporating CyGNSS v3.1 data as described above.
2.3 Experimental setup
Two experiments (Table 1) are conducted to evaluate the simulated impact of CyGNSS observations on hurricane analysis and forecasting. Firstly, a control DA experiment (CNTL) assimilates standard conventional data routinely integrated into the 2023 HAFS Global DA System (GDAS). This includes radiosondes, tail Doppler radar, ground-based radar, atmospheric motion vectors, and various satellite-based observations, as listed in Zhang (2021), but excludes CyGNSS data. The second experiment (CV31) involves adding CyGNSS v3.1 Level 2 wind speeds to the control.
2.4 Case selection
Two criteria guide the selection of case studies for this analysis, aiming to showcase the potential impact of CyGNSS data.
1. Intensity Forecast Errors: Based on previous OSSE results, cases where the operational HWRF model exhibited notable errors in intensity forecasting were chosen. The objective is to assess whether CyGNSS data can enhance these forecasts.
2. Early-Stage TCs: Specifically targeting initial forecasts of tropical depressions and tropical storms, which often lack adequate observation (e.g., TC Larry). Leveraging CyGNSS’s frequent revisit time, valuable insights into the structure of these developing systems can be obtained. However, CyGNSS winds are not reliable at higher wind speeds (see above). In addition, many of the TCs in this study began to display some subtropical and extratropical features later in their life cycles, making it increasingly less likely that ocean impacts would be important. For both of these reasons, the full lifecycle of most TCs was not evaluated, except for Ian.
All TCs listed in Table 2 meet the two criteria above and are included in this data impact study. In each experiment, a 5-day HAFS forecast is initiated every 6 h, with verification against the NHC Best Track conducted for each case.
2.5 Diagnostic and evaluation methods
The TCs analyzed are illustrated in Figure 4. All TCs occurred between 2021 and 2022. Tracking of TCs was performed using the latest version of the GFDL vortex tracker (Marchok, 2021). Forecast verification was conducted using Best Track data from the NHC HURDAT-2 database (Landsea and Franklin, 2013). These Best Track data provided TC location in increments of 0.1° for latitude and longitude, maximum 10 m winds in increments of 5 kt, and minimum sea-level pressure in increments of 1 hPa. The results presented are based on homogeneous samples of all analyzed forecasts for that experiment, and were verified every 6 h. Additional forecast metrics presented below include the consistency metric, described in Ditchek et al. (2023), and other commonly calculated mean absolute error (MAE) and bias statistics. MAE skill, as referred to below, is the ratio between MAEs for two experiments, expressed as a percentage.
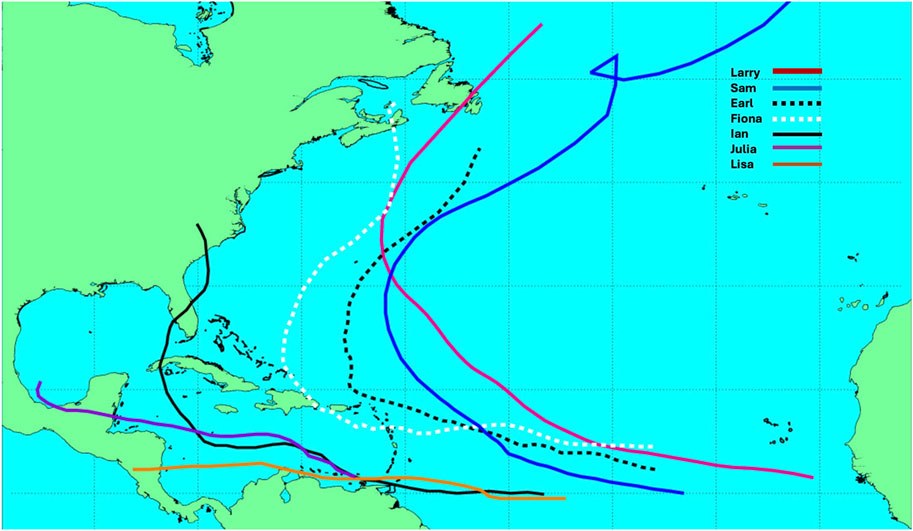
Figure 4. Storm track from NHC Best Track (colored lines) for TCs investigated in this study: Ian 2022AL09, Fiona 2022AL07, Lisa (2022AL15), Sam (2021AL18), Earl 2022AL06,Julia (2022AL13), and Larry (2021AL12).
Additional statistics were defined as follows: we calculated 100 km annular “footprint” averages and standard deviations, centered at the forecast storm center, for each of sea surface temperature (SST), total latent and sensible heat fluxes at the air-sea interface, planetary boundary layer (PBL) height, and (average only) warm core anomaly. PBL heights were determined based on mean height of zero inflow (radial) velocity, following the method of Zhang et al. (2020). The definition of warm core anomaly used here is the difference between the azimuthal mean potential temperature profile at each radial distance bin, and that of the azimuthal mean potential temperature averaged in the 200–300 km annulus from the center of the storm (Stern and Nolan, 2012; Zhang et al., 2020).
3 Results
The outcomes of the experiments are presented in two parts: First, we analyze forecast metrics from each experiment across all cycles (see Table 2 above), including absolute positional errors, intensity in the form of minimum central pressure (PMIN), radius from the TC center at which maximum 10 m wind occurs (radius of maximum wind or RMW), and radii averaged over all four cardinal quadrants for 34, 50, and 64 kts, respectively (R34, R50, R64). We then examine two individual forecast case studies, which for the CV31 experiment incorporate several previous cycles of CyGNSS data, in order to elucidate likely mechanisms by which CyGNSS 10 m wind initialization impacted the above-mentioned forecast metrics. As outlined below, these studies were chosen to represent both an open ocean TC in the Atlantic and a landfalling TC case that transited the Gulf of Mexico.
3.1 Statistical forecast results
Figure 5 compares the overall track results of the CNTL (red) and CV31 (green) experiments. We see improvements in absolute track accuracy across more than half of all lead times, excepting hours 0 and 24 h. Overall, the MAE track skill showed a 4.7% improvement over CNTL.
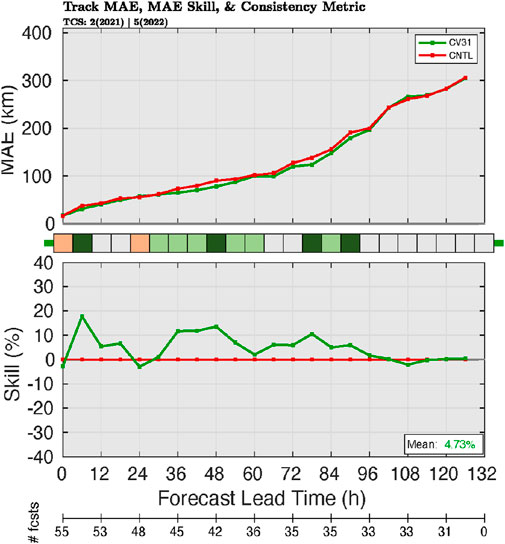
Figure 5. Mean Absolute Error (MAE, top panels, [km]) and MAE skill (bottom panels) for the CV31 (green) and CNTL (red) experiments for absolute track error. Shaded boxes between the MAE and MAE skill panels indicate, for individual forecast lead times, whether results were fully consistent (dark green), marginally consistent (light green to light orange), or not consistent (dark red, none in this figure). Sample size is given below the x-axis in each panel. Mean relative skill percentage is highlighted in boxes at the lower right of each panel.
Figure 6 compares the overall PMIN and VMAX results of the CNTL (red) and CV31 (green) experiments. In the panel at left, we see enhanced performance of CV31 for PMIN in the initial state (Figure 6A), and improvement (positive values) in skill space (line graph) and in the consistency metric (shaded boxes; see Ditchek et al., 2023) in five of the 22 forecast periods (every 6 h through forecast hour 126), peaking at 20% MAE skill and positive consistency metric at hours 0 and 84. However, we do note that the only extended period of marginally consistent improvement was forecast hours 84–90, and that there were three forecast periods of marginally consistent degradation for hours 42, 48, and 96. In addition, in the panel at right (Figure 6B), we see skill improvements (positive line graph and positive consistency in the shaded boxes) in maximum surface wind speed accuracy across nearly half of all lead times. We also see forecast periods showing consistent CV31 degraded performance at hours 0, 6, and 48. Overall, the MAE skill for PMIN in CV31 showed a 4.3% improvement over CNTL; for MAE VMAX skill, this improvement was 5.8%. Statistical results for RMW, R34, R50, and R64 (figures not shown) indicated mixed outcomes when comparing CV31 to CNTL. At analysis time, when DA has the most significant impact, both RMW and R34 for CV31 demonstrated improvements over CNTL (not shown).
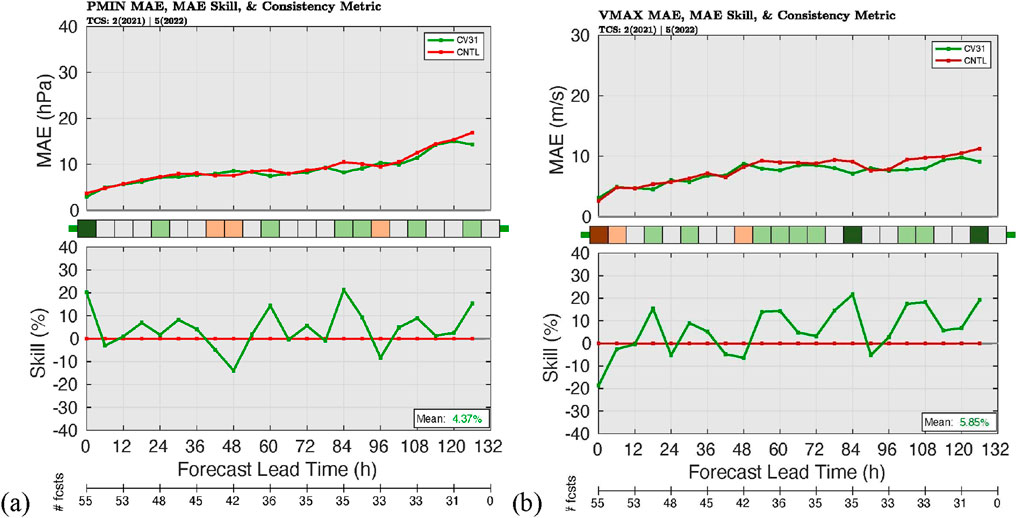
Figure 6. The MAE (top panels) and MAE skill (bottom panels) for the CV31 (green) and CNTL (red) experiments for (A) minimum central pressure (PMIN [hPa]), (B) maximum wind speed (VMAX; [m/s]). Shaded boxes between the MAE and MAE skill panels indicate consistency for each forecast lead time, as in Figure 5. The sample size is given below the x-axis in each panel. Mean relative skill percentage is highlighted in boxes at the lower right of each panel.
Overall, we find that CyGNSS data enhanced TC intensity forecasts statistically (Figure 6) relative to CNTL. We also note that the consistency metric takes into account Frequency of Superior Performance (FSP), MAE, and median absolute difference in errors (MDAE), as well as MAE skill. Forecast track was also improved at most forecast hours throughout 5 days forecasts with the assimilation of CyGNSS data (Figure 5).
Supplementary Figure S1 in the Supplementary Information (SI) plots percentage-point contributions (Ditchek et al., 2023) from forecast life cycles of individual storms to mean absolute error skill for intensity. Consistent with Figure 6, these results show overall improvement in PMIN (Supplementary Figure S1A) and slight degradation in VMAX (Supplementary Figure S1B) at hour 0. However, the degraded VMAX at analysis time is shown to be largely the result of three storms, Earl, Fiona, and Ian - two of which show marked positive impact of CV31 on PMIN at that same forecast hour 0. We finally note that for VMAX, published observational uncertainties in Best Track have been shown in prior studies to exceed 10 kts (Landsea and Franklin, 2013).
Additional statistical analyses for two case studies follow in the succeeding sections.
3.2 TC-ocean interaction case studies
We next examine individual forecast cycles for two storms, Ian and Larry, chosen to represent the cumulative warm-start impact of several previous cycles of CYGNSS DA. We chose the case study for Ian at a cycle for which the CNTL had settled on a very good track relative to Best Track, and just 24 h prior to its major impact at Florida landfall; this case provides useful insights into the interaction between the forecast TC and the continental shelf and coast of western Florida. The other case study for Larry was chosen to show the interaction of a major hurricane with the open ocean in the central tropical Atlantic. The Ian forecast shows an over intensification in the CNTL; the Larry cycle by contrast shows an under forecast in CNTL.
3.2.1 Shelf and coastal interaction (TC Ian)
In this subsection, we will delve into TC Ian, which made landfall in Florida as a Category 4 hurricane, one of the most impactful hurricanes of 2022 (NHC, 2023). Ian originated over the Caribbean Sea in late September and underwent rapid intensification before crossing western Cuba. It then further intensified into a Category 5 hurricane in the Gulf of Mexico before hitting southwest Florida with powerful winds, heavy rainfall, and destructive storm surges. Figure 4A illustrates Ian’s track. Aerial reconnaissance for Ian was initiated on September 21 when it was an INVEST, but regular flights did not begin until after 09:38 UTC on September 23.
Initialization for the Ian case study starts at 23 September 2022 at 06:00 UTC, incorporating a CyGNSS overpass into the CV31 experiment. A 5-day HAFS forecast was initiated every 6 h. Cycling continued until 28 September at 18:00 UTC, resulting in a total of 27 analyses and forecasts. Verification against the Best Track was performed for each experiment.
In Figure 7, we look at statistical results for all forecasts of TC Ian considered in this study. We see multiple forecast periods with enhancements from CV31 relative to CNTL, in consistency metrics for track, intensity (both VMAX and PMIN), R34, and R64 during the initial 18–24 h of all forecasts, with improvements in R34 apparent out to 48 h; these early results are then followed by varying outcomes thereafter. Significant degradation is only seen in one parameter, R64 at forecast hour 48. By contrast, we see marginally consistent improvements with CV31 for track throughout much of the 5 days forecasts represented in the figure, and persistent improvements in R34 within the first 2 days of each forecast. Overall, we see nine periods of improvement for CV31 in track, seven periods of improvement in PMIN including fully consistent improvement during the first forecast period, and eight periods of improvement in R34.
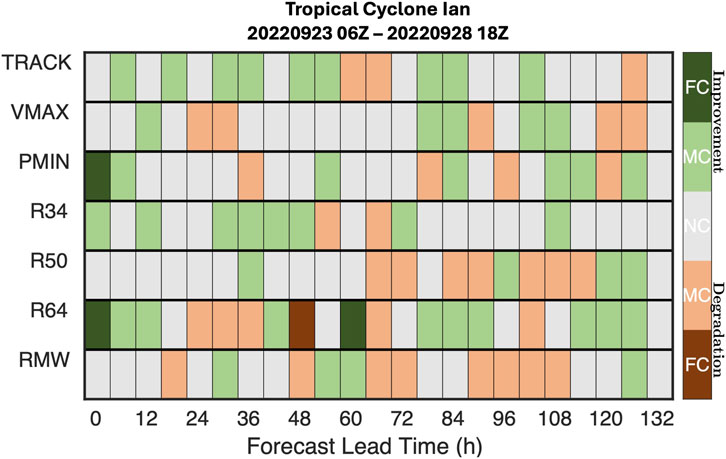
Figure 7. A consistency scorecard detailing CyGNSS’s direct influence on all TC Ian forecasts considered for the present study, covering track, VMAX, PMIN, R34, R50, R64, and RMW error metrics, arranged in descending order. Box colors are as described in Figure 5, with shades of green indicating improvement in the CV31 results vs CNTL.
We now examine in more detail, as a case study, a single forecast for Ian initialized on 27 September 2022, at 18:00 UTC, because it shows the impact of 4 days of accumulated cycled DA with CyGNSS on a TC which is also close to landfall. (Note that the prior statistical results in Figure 7 included a number of forecasts where Ian was primarily over the Caribbean, and where the track bias in HFSB tended to bring Ian to the west and north of its final landfall location.). Landfall in this forecast occurred between hours 21 and 24 in each of the CNTL and CV31, matching NHC-reported landfall at 20:20 UTC on September 28 (NHC, 2023). The track for both the CNTL forecast (plotted in red in Figure 8A) and CV31 forecast (in blue) matched well with the Best Track (in black) up through Ian’s landfall and passage over Florida.
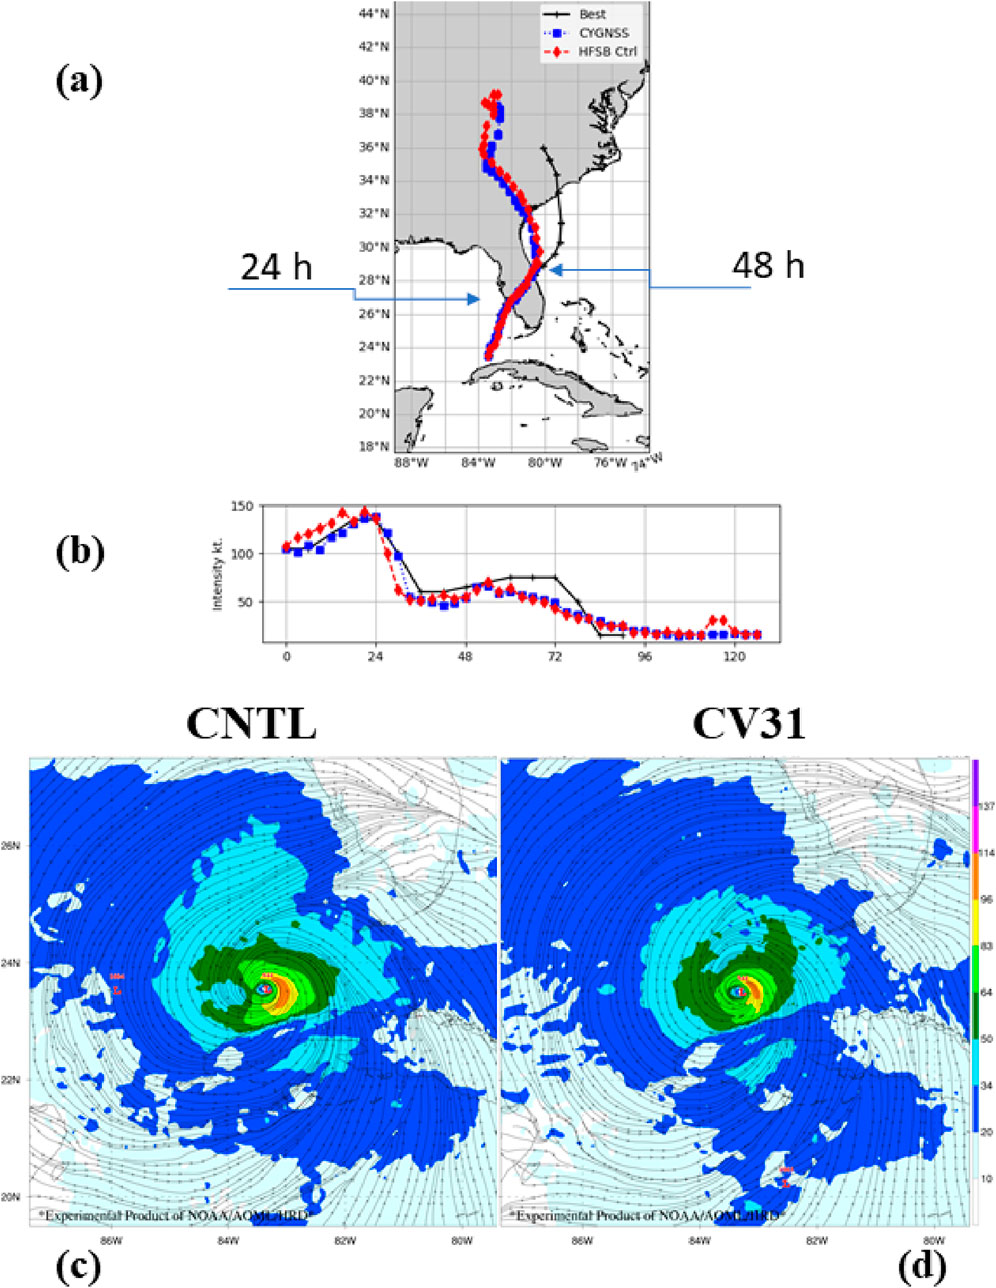
Figure 8. Hurricane Ian forecasts initialized on 27 September 2022 at 18:00 UTC. (A) Track from NHC Best Track (black), CV31 (blue), and CNTL (red). (B) Intensity [kts]. Wind field at analysis time [kts] for (C) CNTL, and (D) CV31.
The intensity (Figure 8B) for the CNTL shows an increase relative to CV31 and Best Track at forecast hours 0–18, just prior to Ian’s landfall in west Florida. The CV31 experiment by contrast matches the NHC Best Track intensity (plotted in black) more closely through landfall and the rapid weakening which followed. After passage of the storm center onto land, 10 m winds for CV31 decay less rapidly (9 h to decrease below hurricane intensity) than for CNTL (6 h), matching the Best Track more closely for a period of 12 h. The 10 m wind field analysis for the CNTL (Figure 8C) shows broader 34 and 64 kt wind fields than CV31 (Figure 8D), with CV 31 verifying more closely with Best Track (figure not shown). Both of these initial outer core wind fields show pronounced asymmetry. However, the inner core winds for the CNTL (>83 kt, shown in yellow and red) not only are broader than those of CV31 but also, unlike CV31, wrap nearly the entire way around the center.
We next examine the available enthalpy at the air-sea interface in the two coupled model configurations, to identify differences which may be related to these disparate intensity forecasts. In Figure 9, we observe broader and more intense air-sea enthalpy fluxes (ASEF) around the eyewall in the CNTL (left; brighter, broader yellows) as compared to CV31 (right; dimmer, darker greens and yellows) throughout the initial period of the forecast. The enthalpy fluxes also show greater symmetry around the inner core for the CTRL. In the CTRL, these broader, more symmetric features in the ASEF correlate well with a broader initial wind field, and greater wind-field symmetry in the inner core (compare winds >83 kt, shown in yellow and red in Figure 8C, with Figure 9B) relative to CV31 (compare Figures 8D, 9D).
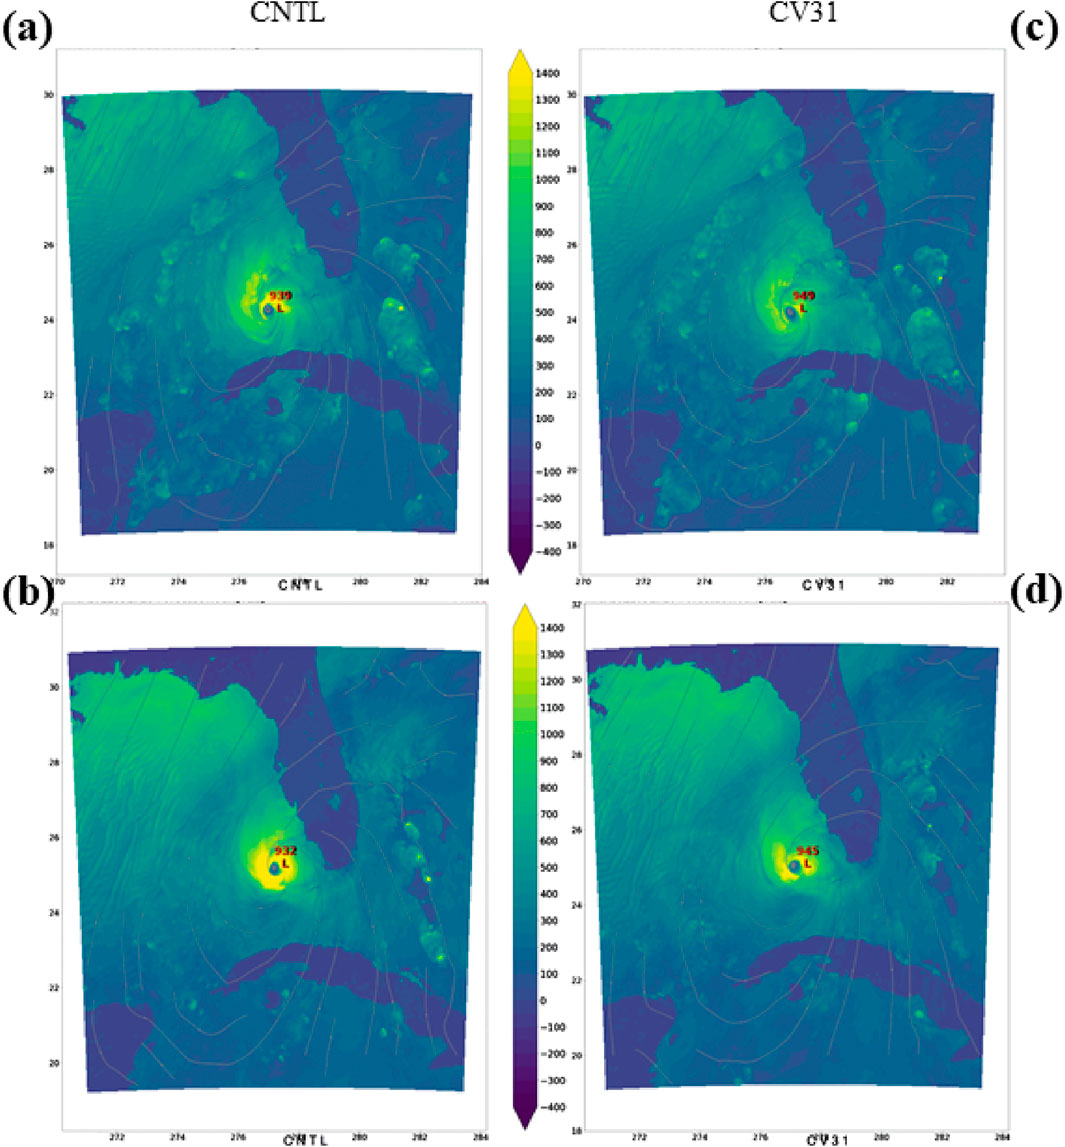
Figure 9. As in Figure 8, Hurricane Ian forecasts initialized on 27 September 2022, at 18:00 UTC. Net (sensible + latent) enthalpy fluxes [W/m2] at hours 6 (panels a and c) and 12 (B, D) for CTRL (A, B) and CV31 (C, D).
In Figure 10, we see azimuthal (“footprint”) averages within 100 km around the storm center at each forecast hour, for SST (Figure 10A), ASEF (Figure 10B), and PBL height (Figure 10C), as well as warm-core temperature anomaly (WCA, Figure 10D), for both CTRL (red) and CV31 (blue). Figure 10A shows identical footprint average SSTs between the two experiments at hour 0; however, the average and standard deviations increase more rapidly for the CNTL in the first 18 h. We note here that the two forecasts made landfall within approximately 3 h of one another, between forecast hours 24 (CNTL) and 27 (CV31). Similarly, ASEF (Figure 10B) for the CNTL is slightly less than CV31 at hour 0, but then also increases much more rapidly, already surpassing CV31 at hour 6. Finally, footprint statistics for PBL height (Figure 10C) and WCA (Figure 10D) for the CTRL begin at lower values, but then increase more rapidly, surpassing CV31 by hour 12. As a result of assimilating CyGNSS, Ian’s initial outer-core wind field in CV31 was weaker but more symmetric (Figure 8D) than the CTRL (Figure 8C). The greater initial symmetry in the CV31 winds explains the fact that the footprint average ASEF for CV31 was slightly greater than for CNTL (Figure 10B) at hour 0.
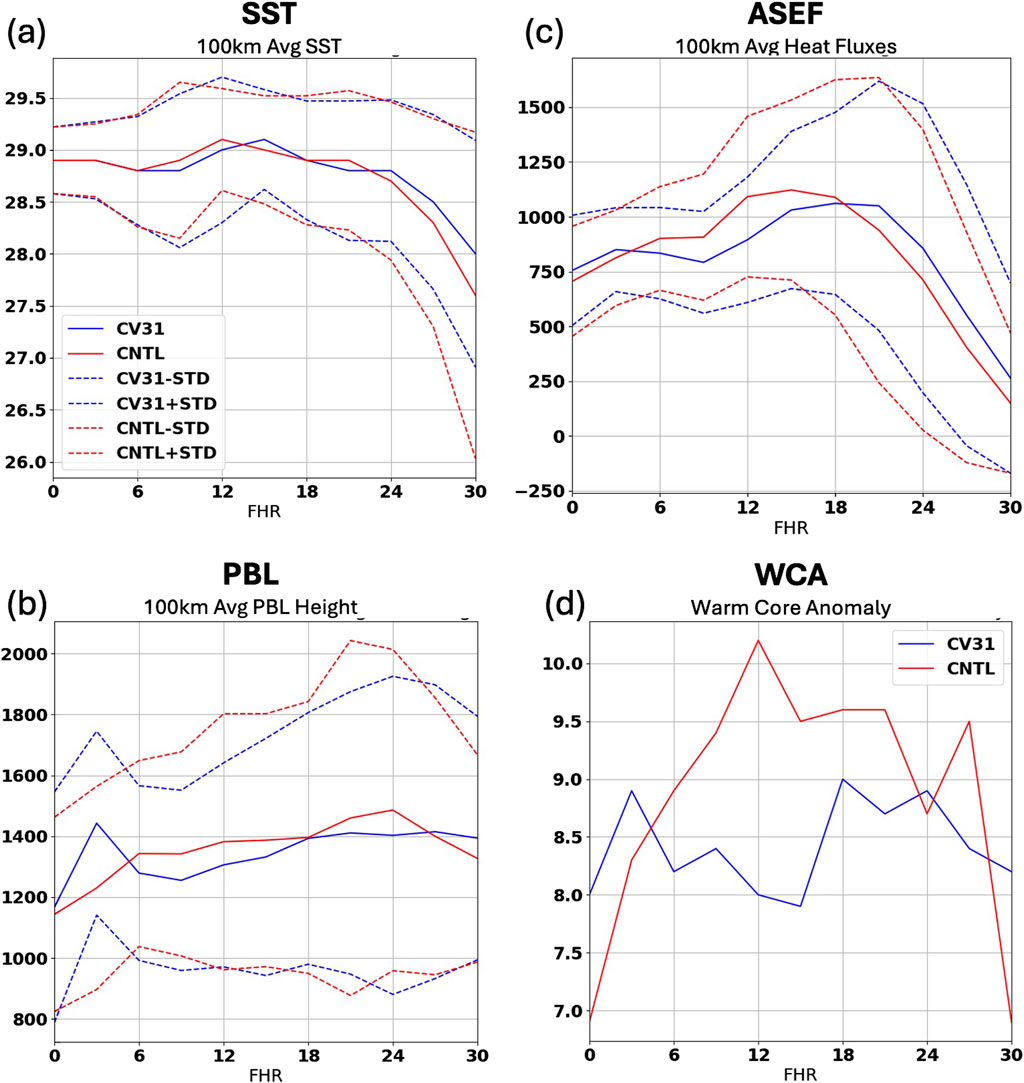
Figure 10. As in Figure 8, Hurricane Ian forecasts initialized on 27 September 2022 at 18:00 UTC. 100-km azimuthal averages (solid lines) and standard deviations (dashed) from CTRL (red) and CV31 (blue) for: (A) SST [°C], (B) ASEF [W/m2], (C) PBL height [m], and (D) warm-core-anomaly [K].
Interestingly, CTRL’s broader and stronger initial wind field (Figure 8C) relative to CV31 (Figure 8D) corresponds to a more rapid footprint SST warming in CNTL than in CV31 (Figure 10A). The reasons for this are apparent in the differences between sea-surface heights produced by the ocean models in the two experiments over the west Florida ocean shelf (Figure 11A, with corresponding SST differences in Figure 11B). At forecast hour 18, red areas along the southern Florida shelf break in Figure 11C show that the larger, stronger wind field of the CNTL was already forcing significant convergence in ocean surface currents (Supplementary Figure S2A, showing convergence at hour 12), resulting in a pronounced sea-surface “bulge” relative to CV31 (Figure 11D; Supplementary Figure S2B). Such bulges in shelf sea surface height over one or more inertial periods are associated with the development of coastal downwelling (Gramer et al., 2022), resulting in sustenance or enhancement of SST over the shelf. The differences in SST between CNTL and CV31 at the same forecast hour (Figure 11B) bear this result out, with a region of significantly warmer SST beneath the core of the TC on the outer shelf shown at hour 18. As a final comment, we note again that the improvement in intensity in the first 24 h of this CV31 forecast relative to CNTL, as seen in Figure 8A, differs from the overall intensity statistics as presented in Figure 7.
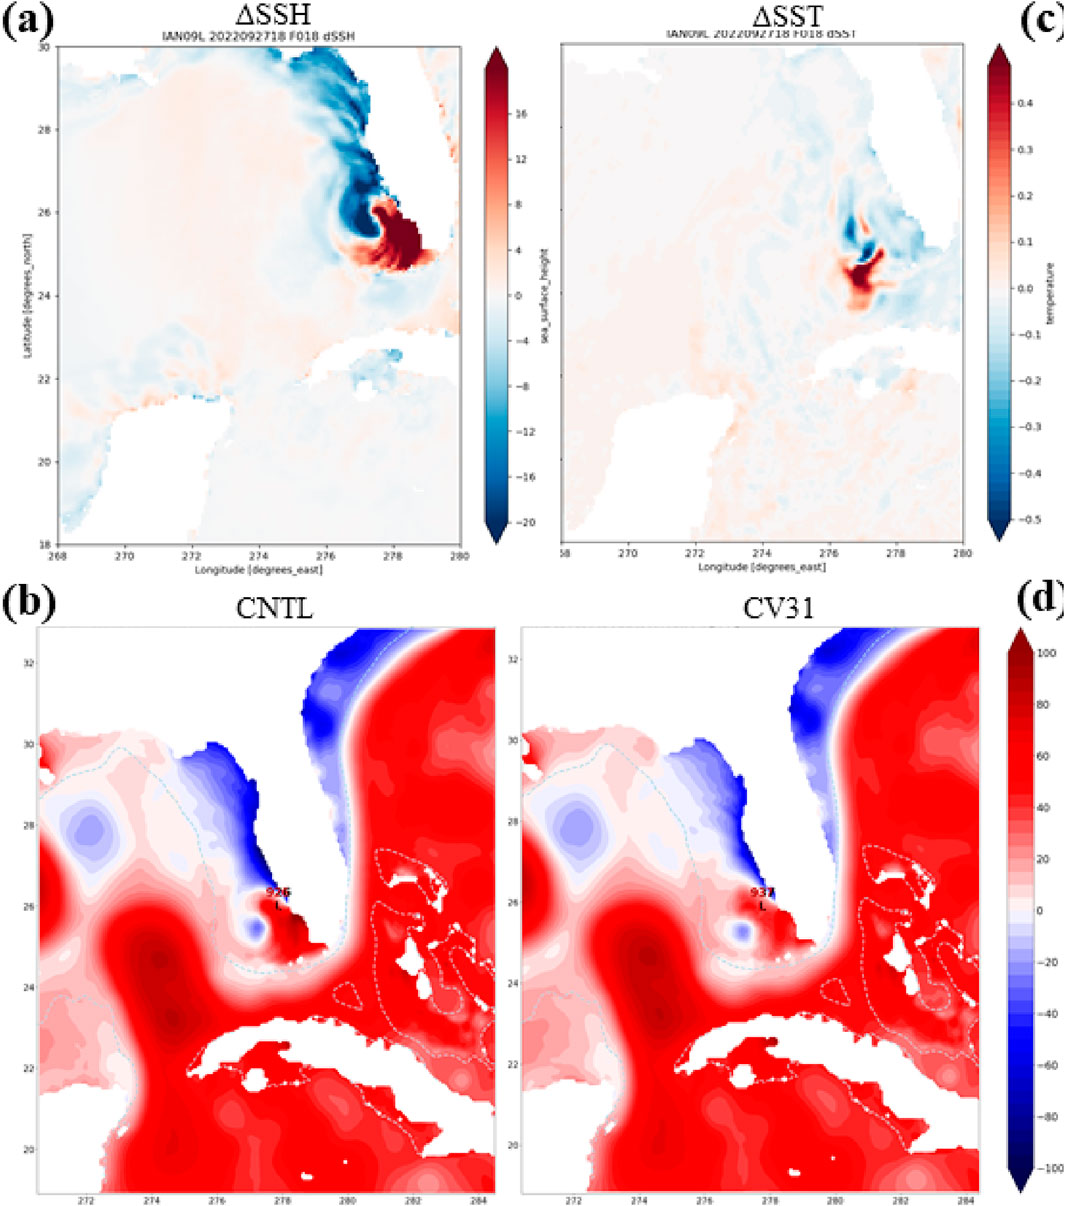
Figure 11. As in Figure 8, Hurricane Ian forecasts initialized on 27 September 2022, at 18:00 UTC. (A, B) Differences at forecast hour 18 between CNTL and CV31 for TC Ian, in (A) sea surface height [m], and (B) SST [K]. (C, D) Sea surface height at forecast hour 18, just before Florida landfall, in (C) CNTL and (D) CV31.
The impact of the enhanced initial 10 m wind field in the CNTL was not limited to its greater forecast maximum intensity: as Figure 11C shows, the broader, stronger wind field in CNTL may have produced a greater likelihood of widespread storm-flooding on Florida’s west coast than CV31. The region of sea surface height above 1 m in the CNTL stretched from Tampa Bay to Florida Bay, as compared with a narrower, shorter band of extreme sea-surface height increase for CV31 (Figure 11D). This is a direct consequence of the enhanced coastal Ekman convergence associated with the wind fields in CNTL, and would have likely produced a forecast for more widespread inundation than the corresponding CV31 forecast would have done. Corresponding differences in the expected impacts to coastal and shelf marine ecosystems from the CNTL vs CV31 forecasts could have resulted as well.
The more rapid SST warming in CTRL in hours 3–18 (Figure 10A), in combination with higher 10 m winds, led to more rapidly increasing ASEF in hours 6–18 (Figures 9, 10B). Greater ASEF in the CTRL would have been consistent with more buoyant uplift near the surface and a higher PBL (Figure 9A) for hours 6 through landfall. Inflow of this increased buoyancy would have been consistent with a more buoyant eyewall and greater WCA (Figure 9B) for CNTL. The ensuant deepening of convection associated with this enhanced WCA would very likely have contributed to the anomalous over intensification of the CTRL forecast vs CV31 in those later forecast hours.
The authors clearly acknowledge however, that the anomalous intensification of the CTRL in the very early forecast (hours 3–12) would have been driven largely by other differences in the near-storm environment between the experiments, beyond the scope of the present analysis; the above results however demonstrate that as the forecast progressed, the dynamic ocean response to the surface wind field, evolving from the different analysis in CV31 vs CNTL, appears to have influenced the available enthalpy, in a way that was consistent with and likely contributed to the evolution of the forecast intensity during hours 9 through Florida landfall. Finally, the enhanced breadth and strength of the wind field for CNTL produced greater convergence and larger areas of enhanced sea-surface height near the coast (Figure 11C) relative to CV31 (Figure 11D). Although a storm surge model was not a part of the present study, the sea-surface height difference just offshore of the coast highlighted here would have provided substantially different boundary conditions for storm surge modeling.
Supplementary Figure S3A is a histogram of data points assimilated from CYGNSS per cycle for TC Ian, from tropical depression through hurricane landfall in Florida. In general, we have three passes over the storm per day, and the data coverage is often inconsistent; coincidentally, the cycles with greatest coverage in the vicinity of Ian were 25/12Z, 26/12Z, and 27/12Z. Supplementary Figure S3B–M show data coverage and quality-controlled speed retrievals for individual overpasses over the moving model nest for Ian. The 00Z and 06Z cycles for this period, particularly 06Z, have much less data than the 12Z cycles; there is no coverage for 18Z cycles.
We previously noted (discussion of Supplementary Figure S1 above) that in the early cycles of several of the TCs from our experiment, the impact of initial CYGNSS data assimilation on forecast metrics was more mixed. In Supplementary Figure S4, we show track and intensity (VMAX), translation speed, and the structure metrics (RWM, R34, R50, R64) for a forecast earlier in the life cycle of Ian, initialized on 25 September 2022 at 06Z. This cycle forecast landfall further west in Cuba, and much further north and west in Florida and Alabama. CV31 VMAX was stronger from the analysis time until continental landfall, as a result of initializing with a slightly stronger, substantially more symmetric near-surface wind field (Supplementary Figure S5A) as compared to CNTL (Supplementary Figure S5B).
3.2.2 Open ocean interaction (TC Larry)
TC Larry (12L) originated from a tropical wave that emerged off the coast of Africa, coalescing into a tropical depression on 2021 August 31. Within a day, the depression intensified into a tropical storm named Larry. Rapidly traversing the far eastern tropical Atlantic, it escalated into a Category 1 hurricane by the morning of September 2. After a period of swift intensification, Larry surged to a major Category 3 hurricane early on September 4. Figure 4G illustrates Larry’s track. Aerial reconnaissance for Larry was not initiated until September 5.
Initialization for the Larry case study started at 31 August 2021 at 18:00 UTC. A 5-day HAFS forecast was initiated every 6 h. Cycling continued until 03 September at 12:00 UTC, resulting in a total of 12 analyses. Verification against the Best Track data was performed for each experiment.
Larry is a TC which intensified rapidly over the open, tropical ocean. For our second case study we examine the forecast of Larry initialized on 2021 September 03 at 12Z, when several overpasses of CyGNSS had previously provided surface winds for atmospheric DA. For this cycle, both experiments performed well in forecasting the center position relative to Best Track throughout the 5 days forecasts (Figure 12A). However, unlike in the case of Ian, CV31 forecast a stronger TC (Figure 12B, blue) relative to CNTL (red). This stronger forecast verified better versus Best Track (black) for hours 6–66, but worse thereafter.
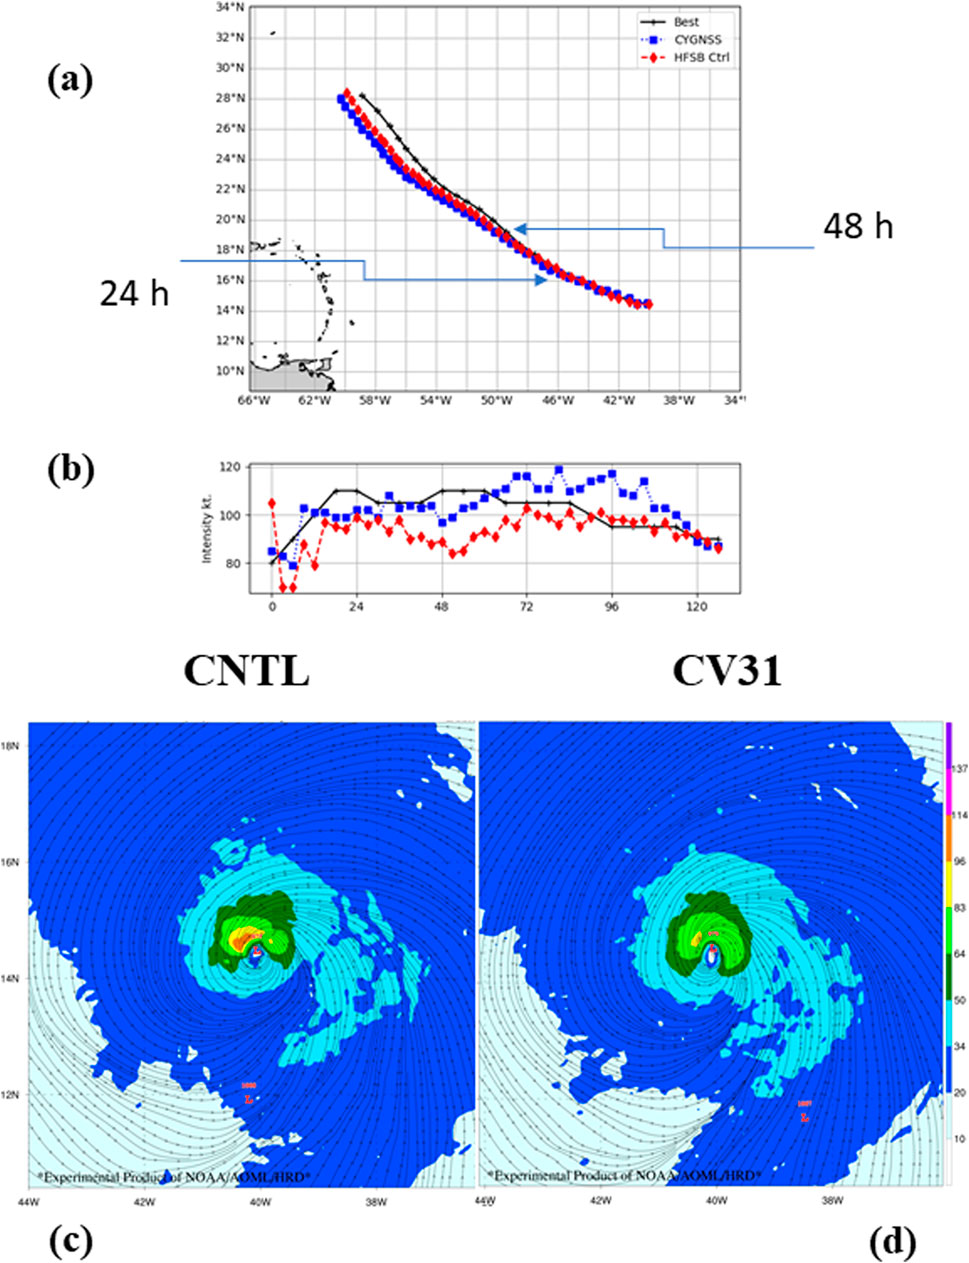
Figure 12. Larry forecasts initialized 2021 September 03 at 12Z. (A) Track from NHC Best Track (black), CV31 (blue), and CNTL (red). (B) Intensity in kts. Wind field at analysis time for (C) CNTL, and (D) CV31.
The initial 10 m wind field for CNTL (Figure 12C) was both smaller (narrow fields between 34 and 83 kts in cyan and green), and more intense (>96 kts in the northwestern quadrant, bright red) than that for CV31 (Figure 12D). However, an important feature of the hour 0 wind field in CNTL was the presence of 105 kts wind in the inner core (Figures 12B, red), a feature which was not present in either CV31 or the Best Track. The rapid intensification in the CV31 forecast occurred within 9 h of initialization. Although this was a more rapid intensification than Best Track, it does suggest that the improvement in intensity forecast was closely associated with the additional information on the initial 10 m winds from CyGNSS.
In the CNTL experiment, DA produced a vortex at analysis time that had a substantial imbalance as evidenced by the initial 10 m wind field in Figure 12. The result of this imbalance was a spindown between hours 0 and 3 (Tong et al., 2018). This spindown was not present in CV31. The impact of this difference between the experiments on the ocean, and on the evolving structure of the TC after hour 6 is examined in Figure 13. In particular, this difference in 10 m wind field analysis and early evolution between CNTL and CV31 corresponds to differences in the SST (Figure 13A) and ASEF (Figure 13B) beginning in forecast hour 6. Although footprint SST at hours 6–18 cooled rapidly for both CNTL and CV31, the patterns of this cooling differed between the experiments: initially, through hour 6, CV31 cooled more rapidly than CNTL. Nevertheless, by hour 9, this pattern reversed, with CNTL SST continuing to cool rapidly, while CV31 cooling began to moderate. What these results show is that the initial spindown in the CNTL corresponded for most of the hours 9–54 with reduced ASEF (Figure 13B), PBL height, and WCA, relative to CV31.
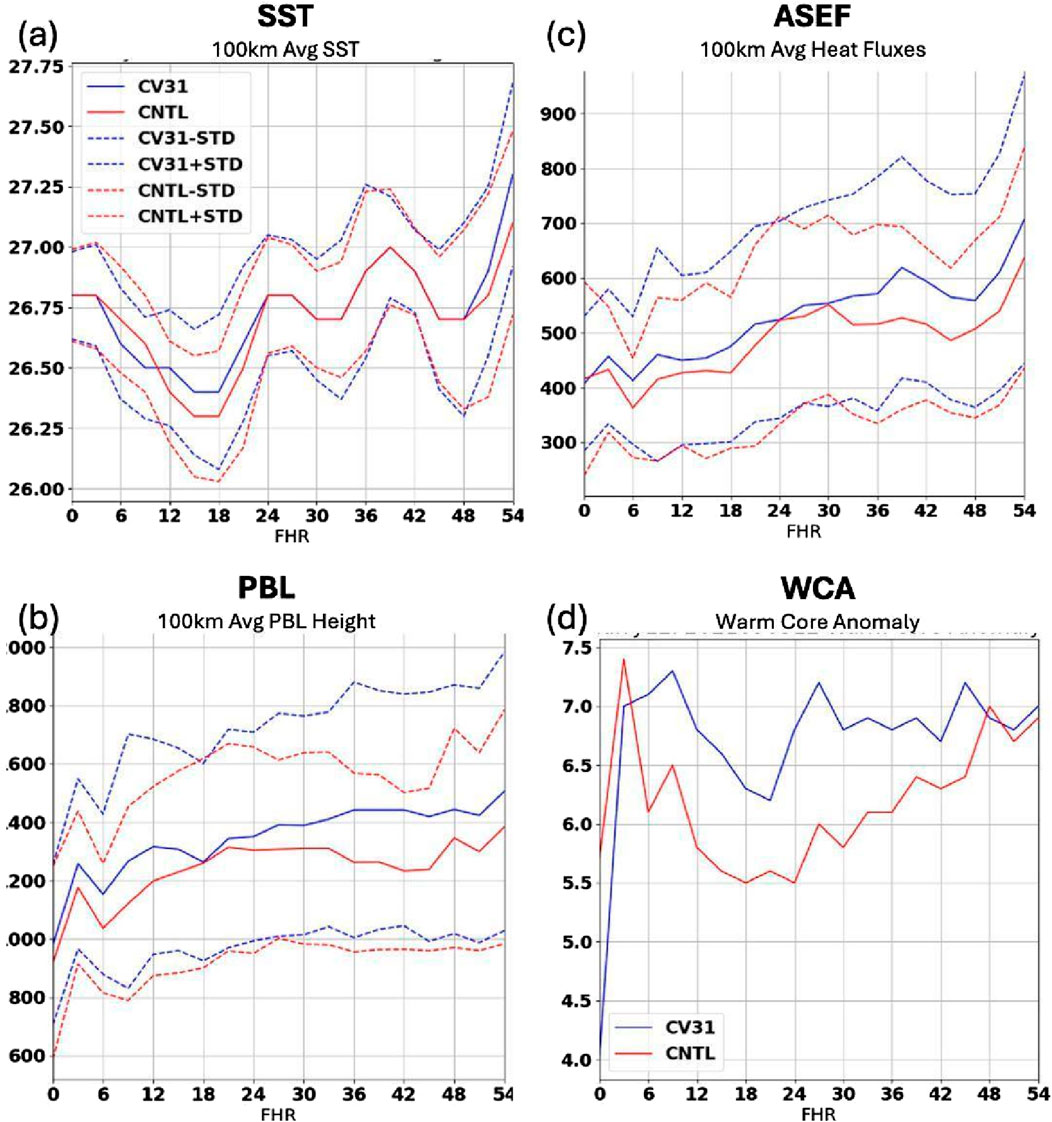
Figure 13. As for Figure 12, Larry forecasts initialized 2021 September 03 at 12Z. 100-km azimuthal averages (solid lines) and standard deviations (dashed) from CTRL (red) and CV31 (blue) for (A) SST [°C], (B) ASEF [W/m2], (C) PBL height [m], and (D) warm-core-anomaly [K].
The result of the reduced 10 m wind in the CNTL forecast, together with the enhanced cooling, was to substantially reduce production of buoyancy by ASEF within 100 km of the center. This reduced ASEF in turn corresponded with reduced PBL height within CNTL relative to CV31 (Figure 13C) beginning at hour 18, reaching a peak difference from CV31 at hour 42. The impact of an initial vortex imbalance in the CNTL was reflected very quickly (by forecast hour 6) in the reduced WCA peak temperature in the CNTL relative to CV31 (Figure 13D). However, this WCA difference was enhanced up to hour 18, and maintained itself through hour 45. These features were all coincident with the weaker intensification of CNTL relative to both CV31 and Best Track (Figure 12B).
4 Conclusion
In this study, we utilized the Hurricane Analysis and Forecast System (HAFS) to assess the impact of CyGNSS-derived scalar (CV31) near-surface winds on TC track, intensity, and storm structure forecasts. The initial day of the experimental period for each storm was used to spin up the model state with CyGNSS observations, while subsequent days were utilized for generating TC statistics. All observational data were assimilated using the hybrid 4DEnVar, which was the assimilation method employed in operational settings during the experimental period. Observations were assimilated within 6-h windows centered on four daily analysis times (0000, 0600, 1,200, and 1800 UTC).
As a newly established observing system, CyGNSS posed a challenge to the current study by necessitating the consideration of serial correlation in the information content and errors inherent in the 1-Hz CyGNSS specular point tracks of retrieved winds. Future research endeavors will prioritize the development of a more foundational approach to address CyGNSS observation error correlation within each specular point track and its integration into the operational model.
For the present study, 7 TCs were selected for OSEs in the Atlantic Basin using HFSB, a configuration of the coupled operational HAFS. These TCs covered a range of conditions such as deep water, shelf, Gulf storms, weakening and intensifying storms (Table 2). A broad summary of the conclusions in the present study included the following.
• CyGNSS enhanced initial TC intensity forecasts as evidenced by PMIN (Figures 5, 7).
• Forecast track improved with the assimilation of CyGNSS data (Figure 5).
• PMIN for CV31 showed an overall improvement of 4.7%; VMAX showed overall improvement of 5.8%.
• Later CV31 forecasts in the sample for five out of 7 TCs showed more consistent improvement in PMIN vs CNTL within the first 36 h, resulting from the accumulation of several days of CYGNSS data assimilation. For four of the TCs, later CV31 forecasts showed marginal or fully consistent improvements in early-forecast VMAX as well.
• For one case study, that of a late, landfalling forecast for TC Ian, assimilating near-surface winds modified the modeling of ocean mixing and transport (e.g., upwelling and downwelling) in such a way as to potentially contribute to an improved intensity forecast (Figure 8), and modified the sea-surface height forecast (Figure 11) in a way which would have substantially modified surge-model boundary conditions and so could well have significantly modified storm surge forecasts (Dullaart et al., 2024; Powell and Reinhold, 2007). We also briefly examined an earlier forecast for Ian, showing an example where the experiment produced some forecast degradation.
• An additional case study over the open ocean, TC Larry, also showed improvement in intensity and structure from CyGNSS data. In this case, coastal and shelf interaction played no role. Furthermore, this was a case where the CNTL persistently underforecast the TC’s intensity relative to both Best Track and CV31. However, in this case, as for Ian, the ocean is implicated as playing a role, albeit a somewhat different one, and in this case, in the later evolution of intensity from forecast hours 9 onward.
• For the present study, CyGNSS provided critical observations early in the TC lifecycle, when aerial reconnaissance is seldom available.
Some inconsistencies in CV31 improvements in surface wind and MSLP fields presented here suggest that assimilating purely dynamical observations may lead to inconsistencies in thermodynamic fields from cross-variable corrections. Previous studies. Like Lu and Wang (2020), showed that this issue can be addressed by assimilating more coincident near-storm thermodynamic observations during DA. The maximum wind speed is closely tied to MSLP through the relationship between wind and pressure gradient (Knaff and Zehr, 2007). Commenting on the wind-pressure relationship in HAFS is a complicated topic (e.g., Chavas et al., 2017) and beyond the scope of the present study; however, we note that our sample was dominated by early life-cycle forecasts (when systems were tropical depressions or tropical storms), when the wind-pressure gradient relationship would have been weaker (Hazelton et al., 2023). Furthermore, given that this study is limited to a small sample, future work could address this question more directly using larger samples, incorporating full life cycles of multiple TCs.
Including CyGNSS led to improvements in average wind radii for the first 6 hours of forecasts analyzed here. Mixed results at later forecast hours relative to Best Track, including times when there were no aerial or ground observations of TC wind fields, will bear further examination in future work. Previous analyses have acknowledged (Cangialosi and Landsea, 2016) considerable uncertainty in wind radii estimates from Best Track, particularly for TCs that are not yet monitored by aircraft reconnaissance or ground radar, which are precisely the candidate cycles we chose for the present work. We therefore hypothesize that, notwithstanding the limitations to structure validation statistics for the present study, CyGNSS data may actually prove useful to improve the uncertainty in Best Track estimates of these important wind radii in further studies.
Understanding how these results align with previous efforts to enhance TC forecasts using CyGNSS data is crucial. As outlined in section 1, prior OSSEs conducted with the HWRF model (Annane et al., 2018; Leidner et al., 2018) reported neutral impacts on track forecasts and modest improvements (generally ≤5 knots) in maximum wind speed (VMAX) forecasts for individual TC case studies. Previous OSEs (Pu et al., 2022; Cui et al., 2019), which also utilized HWRF, demonstrated generally neutral to positive impacts on track and intensity forecasts, offering promising results. In the Mueller et al. (2021) OSE, CyGNSS was globally assimilated, and this run was used as a lateral boundary condition (LBC) in HWRF, also showing an improvement in track and intensity. The present study, however, is the first that the authors are aware of that looks at operational HAFS retrospective forecasts, and the first to examine over 50 individual forecasts spanning 7 TCs.
The current study identified enhancements in track forecasts and improvements in intensity metrics. A primary distinction between the findings of this study and those of previous studies is the utilization of a coupled model that integrates HYCOM, which may contribute to HAFS’s superiority over HWRF in providing greater skill at modeling the air-sea dynamics which can be critical to TC forecasting (e.g., Kim et al., 2024). As a result of the considerations above, any direct comparisons between the outcomes of previous studies and this study should be approached with caution, as the methodologies employed here represent a significant break with past work.
It is critical to point out that the impact of assimilating observations from CyGNSS for the initial 10 m wind field were not limited simply to improved intensity and structure forecasts. As both case studies (TC Ian in Figure 11, TC Larry in Figure 13) demonstrate, the near-surface wind structure in hour 0 analysis can also significantly impact the evolution of the ocean beneath the storm. As the Ian case showed, storm flooding for landfalling TCs may also be significantly impacted as a result. Corresponding differences in the forecast impact to marine ecosystems may also occur. Verifying these hypotheses will require inputting surface wind and sea level data into storm inundation models in future studies.
Finally, the present study highlights an important mechanism by which near-surface wind analysis can impact both sea-surface height and TC intensity structure, namely, by modifying the air-sea enthalpy fluxes during early forecast hours. Changes in SST warming or cooling, in combination with differing 10 m winds, can lead to significant differences in air-sea enthalpy fluxes. These modified inputs of moisture and heat in turn result in modifications to the forecast buoyant uplift within the PBL, and thus to modifications in the buoyancy in the TC core as evidenced by warm-core anomaly differences in the present study (Figures 11, 13). Finally, moving forward, we hope that future observational studies utilizing CyGNSS as a component will allow for improvement and verification of air-sea enthalpy parameterizations for TC forecasting models.
We further hope that future modeling studies will be able to provide additional insights into the broader impacts of improving near-surface analyses using CyGNSS and future observational systems. Ultimately, we wish to more directly address the mechanisms by which improving surface wind analysis with CYGNSS can improve intensity forecasts with HAFS, particularly in the case of RI. Based on analyses carried out with the sample in this study, not described, our approach in a future work will be to examine the impact of CYGNSS DA on inflow for rapidly intensifying TCs.
Data availability statement
The datasets presented in this study can be found in online repositories. The names of the repository/repositories and accession number(s) can be found in the article/Supplementary Material.
Author contributions
BA: Conceptualization, Formal Analysis, Investigation, Project administration, Resources, Software, Validation, Writing–original draft. LG: Conceptualization, Formal Analysis, Investigation, Project administration, Resources, Software, Validation, Writing–original draft.
Funding
The author(s) declare that financial support was received for the research, authorship, and/or publication of this article. The authors disclose that financial support was received for the research, authorship, and/or publication of this article. Lead author BA acknowledges support from NASA grant GR-019922. Funding from the NASA project (GR-019922) and NOAA projects GR013873 and GR021701 (A. Hazelton, PI) supported LJG in performance of the experiments and preparation of this manuscript.
Acknowledgments
The authors express gratitude to the staff of the NOAA RDHPCS computing resources, including those overseeing the Jet, Hera supercomputers, for their technical support and guidance, which enabled the design and implementation of these real-time runs. Funding from NOAA projects GR013873 and GR021701 (A. Hazelton, PI) supported LJG in performance of the experiments and preparation of this manuscript. Initial conceptualization for this study came out of conversations between BA and LJG. The authors gratefully acknowledge additional guidance and encouragement from S Aberson and J Cione of NOAA-HRD, S Ditchek of CIMAS and NOAA-HRD, and B McNoldy and S Majumdar of University of Miami. A Aksoy and K Sellwood of CIMAS and NOAA-HRD also provided helpful internal review of the manuscript prior to submission. Concision and clarity of the final manuscript were greatly improved by consultations with University of Miami Writing Center, particularly A Mann and L Albritton. Finally, this manuscript was immensely improved by the comments and suggestions of two reviewers.
Conflict of interest
The authors declare that the research was conducted in the absence of any commercial or financial relationships that could be construed as a potential conflict of interest.
Publisher’s note
All claims expressed in this article are solely those of the authors and do not necessarily represent those of their affiliated organizations, or those of the publisher, the editors and the reviewers. Any product that may be evaluated in this article, or claim that may be made by its manufacturer, is not guaranteed or endorsed by the publisher.
Supplementary material
The Supplementary Material for this article can be found online at: https://www.frontiersin.org/articles/10.3389/feart.2024.1418158/full#supplementary-material
References
Alaka Jr, G. J., Sippel, J. A., Zhang, Z., Kim, H. S., Marks, F. D., Tallapragada, V., et al. (2024). Lifetime performance of the operational hurricane weather research and forecasting model (HWRF) for North Atlantic tropical cyclones. Bull. Am. Meteorological Soc. 105, E932–E961. doi:10.1175/bams-d-23-0139.1
Annane, B., McNoldy, B., Leidner, S. M., Hoffman, R., Atlas, R., and Majumdar, S. J. (2018). A study of the HWRF analysis and forecast impact of realistically simulated CYGNSS observations assimilated as scalar wind speeds and as VAM wind vectors. Mon. Wea. Rev. 146, 2221–2236. doi:10.1175/MWR-D-17-0240.1
Atlas, R. (1997). Atmospheric observations and experiments to assess their usefulness in data assimilation (gtSpecial IssueltData assimilation in meteology and oceanography: theory and practice). J. Meteor. Soc. Jpn. 75 (1B), 111–130. doi:10.2151/jmsj1965.75.1b_111
Atlas, R., Hoffman, R. N., Leidner, S. M., Sienkiewicz, J., Yu, T. W., Bloom, S. C., et al. (2001). The effects of marine winds from scatterometer data on weather analysis and forecasting. Bull. Amer. Meteor. Soc. 82 (9), 1965–1990. doi:10.1175/1520-0477(2001)082<1965:TEOMWF>2.3.CO;2
Bleck, R., Halliwell, G. R., Wallcraft, A. J., Carroll, S., Kelly, K., and Rushing, K. (2002). HYbrid Coordinate Ocean Model (HYCOM) user’s manual: details of the numerical code. HYCOM, 211.
Candy, B., English, S. J., and Keogh, S. J. (2009). A comparison of the impact of QuikScat and WindSat wind vector products on Met Office analyses and forecasts. IEEE Trans. Geosci. Remote Sens. 47 (6), 1632–1640. doi:10.1109/tgrs.2008.2009993
Cangialosi, J. P., and Landsea, C. W. (2016). An examination of model and official national hurricane center tropical cyclone size forecasts. Weather Forecast. 31 (4), 1293–1300. doi:10.1175/waf-d-15-0158.1
Cangialosi, J. P., Landsea, C. W., Blake, E., DeMaria, M., Penny, A., Latto, A., et al. (2020). Recent progress in tropical cyclone intensity forecasting at the National Hurricane Center. Wea. Forecast. 35, 1913–1922. doi:10.1175/WAF-D-20-0059.1
Chavas, D. R., Reed, K. A., and Knaff, J. A. (2017). Physical understanding of the tropical cyclone wind-pressure relationship. Nat. Commun. 8, 1360. doi:10.1038/s41467-017-01546-9
Clarizia, M. P., and Ruf, C. S. (2016a). On the spatial resolution of GNSS-reflectometry. IEEE Geosci. Remote Sens. Lett. 13, 1064–1068. doi:10.1109/LGRS.2016.2565380
Clarizia, M. P., and Ruf, C. S. (2016b). Wind speed retrieval algorithm for the cyclone global navigation satellite system (CYGNSS) mission. IEEE Trans. Geosci. Remote Sens. 54 (8), 4419–4432. doi:10.1109/TGRS.2016.2541343
Cui, Z., Pu, Z., Tallapragada, V., Atlas, R., and Ruf, C. S. (2019). A preliminary impact study of CYGNSS ocean surface wind speeds on numerical simulations of hurricanes. Geophys. Res. Lett. 46, 2984–2992. doi:10.1029/2019gl082236
Dani, H., Saleh, A., Fabrice, A., Jean-Raymond, B., Bourassa, M., Cotton, D., et al. (2023). Satellite remote sensing of surface winds, waves, and currents: where are we now? Surv. Geophys. 44, 1357–1446. doi:10.1007/s10712-023-09771-2
Ditchek, S. D., Sippel, J., Marinescu, P., and Alaka, G. (2023). Improving best-track verification of tropical cyclones: a new metric to identify forecast consistency. Weather Forecast 38 (6), 817–831. doi:10.1175/WAF-D-22-0168.1
Dullaart, J. C., de Vries, H., Bloemendaal, N., Aerts, J. C., and Muis, S. (2024). Improving our understanding of future tropical cyclone intensities in the Caribbean using a high-resolution regional climate model. Sci. Rep. 14 (1), 6108. doi:10.1038/s41598-023-49685-y
Garraffo, Z. D., Cummings, J. A., Paturi, S., Iredell, D., Spindler, T., Balasubramanian, B., et al. (2020). Research activities in Earth system modelling. Programme Geneva: World Climate Research.
Glahn, B., Taylor, A., Kurkowski, N., and Shaffer, W. A. (2009). The role of the SLOSH model in National Weather Service storm surge forecasting. Natl. Weather Dig. 33 (1), 3–14.
Gleason, S., Ruf, C. S., Clarizia, M. P., and O’Brien, A. J. (2016). Calibration and unwrapping of the normalized scattering cross section for the cyclone Global Navigation Satellite System. IEEE Trans. Geosci. Remote Sens. 54, 2495–2509. doi:10.1109/TGRS.2015.2502245
Gleason, S., Ruf, C. S., O’Brien, A. J., and McKague, D. S. (2019). The CYGNSS level 1 calibration algorithm and error analysis based on on-orbit measurements. IEEEJ. Sel. Top. Appl.Earth Obs.Remote Sens. 12, 37–49. doi:10.1109/JSTARS.2018.2832981
Gopalakrishnan, S., Hazelton, A., and Zhang, J. A. (2021). Improving hurricane boundary layer parameterization scheme based on observations. Earth Space Sci. 8, e2020EA001422. doi:10.1029/2020ea001422
Gramer, L. J., Steffen, J., Aristizabal, M., and Kim, H.-S. (2024). The impact of coupling a dynamic ocean in the hurricane analysis and forecast system. Front. Earth Sci. Special Ed. 12. doi:10.3389/feart.2024.1418016
Gramer, L. J., Zhang, J. A., Alaka, G., Hazelton, A., and Gopalakrishnan, S. (2022). Coastal downwelling intensifies landfalling hurricanes. Geophys. Res. Lett. 49, e2021GL096630. doi:10.1029/2021gl096630
Han, J., and Bretherton, C. S. (2019). TKE-based moist eddy-diffusivity mass-flux (EDMF) parameterization for vertical turbulent mixing. Weather Forecast 34, 869–886. doi:10.1175/WAF-D-18-0146.1
Han, J., Wang, W., Kwon, Y. C., Hong, S.-Y., Tallapragada, V., and Yang, F. (2017). Updates in the NCEP GFS cumulus convection schemes with scale and aerosol awareness. Weather Forecast 32, 2005–2017. doi:10.1175/WAF-D-17-0046.1
Hazelton, A., Alaka, G. J., Gramer, L., Ramstrom, W., Ditchek, S., Chen, X. M., et al. (2023). 2022 real-time hurricane forecasts from an experimental version of the Hurricane Analysis and Forecast System (HAFSv0.3S). Front. Earth Sci. 11, 17. doi:10.3389/feart.2023.1264969
Hoffman, R. N., and Atlas, R. (2016). Future observing system simulation experiments. Bull. Amer. Meteor. Soc. 97 (9), 1601–1616. doi:10.1175/BAMS-D-15-00200.1
Kim, H.-S., Liu, B., Thomas, B., Rosen, D., Wang, W., Hazelton, A., et al. (2024). Ocean component of the first operational version of hurricane analysis and forecast system: HYbrid coordinate Ocean model (HYCOM). Submitt. this Front. Earth Sci. Special Ed. 12. doi:10.3389/feart.2024.1399409
Knaff, J. A., and Zehr, R. M. (2007). Reexamination of tropical cyclone wind–pressure relationships. Wea. Forecast. 22, 71–88. doi:10.1175/WAF965.1
Landsea, C. W., and Cangialosi, J. P. (2018). Have we reached the limits of predictability for tropical cyclone track forecasting? Bull.Amer. Meteor. Soc. 99, 2237–2243. doi:10.1175/BAMS-D-17-0136.1
Landsea, C. W., and Franklin, J. L. (2013). Atlantic hurricane database uncertainty and presentation of a new database format. Mon.Wea. Rev. 141, 3576–3592. doi:10.1175/MWR-D-12-00254.1
Leidner, S. M., Annane, B., McNoldy, B., Hoffman, R., and Atlas, R., 2018: Variational analysis of simulated ocean surface winds from the cyclone global navigation satellite system (CYGNSS) and evaluation using a regional OSSE evaluation using a regionalOSSE. J. Atmos. Ocean., 35, 1571–1584. doi:10.1175/JTECH-D-17-0136.1
Leidner, S. M., Isaksen, L., and Hoffman, R. N. (2003). Impact of NSCAT winds on tropical cyclones in the ECMWF 4D-Var assimilation system. Mon. Wea. Rev. 131 (1), 3–26. doi:10.1175/1520-0493(2003)131<0003:ionwot>2.0.co;2
Lin, S.-J. (2004). A “vertically Lagrangian” finite-volume dynamical core for global models models. Mon. Weather Rev. 132, 2293–2307. doi:10.1175/1520-0493(2004)132<2293:AVLFDC>2.0.CO;2
Lin, S.-J., and Rood, R. B. (1996). Multidimensional flux-form semi-Lagrangian transport schemes transport schemes. Mon. Weather Rev. 124, 2046–2070. doi:10.1175/1520-0493(1996)124<2046:MFFSLT>2.0.CO;2
Lu, X., and Wang, X. (2020). Improving hurricane analyses and predictions with TCI, IFEX field campaign observations, and CIMSS AMVs using the advanced hybrid data assimilation system for HWRF. Part II: observation impacts on the analysis and prediction of patricia (2015). Mon. Weather Rev. 148, 1407–1430. doi:10.1175/mwr-d-19-0075.1
Marchok, T. (2021). Important factors in the tracking of tropical cyclones in operational models. J. Appl. Meteorol. Climatol. 60, 1265–1284. doi:10.1175/JAMCD-20-0175.1
McNoldy, B., Annane, B., Majumdar, S. J., Delgado, J., Bucci, L., and Atlas, R., 2017: Impact of assimilating CYGNSS data on tropical cyclone analyses and forecasts in a regional OSSE framework framework. Mar. Technol. Soc. J., 51, 7–15. doi:10.4031/MTSJ.51.1.1
Mueller, M. J., Annane, B., Leidner, S. M., and Cucurull, L. (2021). Impact of CYGNSS-derived winds on tropical cyclone forecasts in a global and regional model. Mon. Weather Rev. 149, 3433–3447. doi:10.1175/MWR-D-21-0094.1
NHC (2023). Available at: https://www.nhc.noaa.gov/data/tcr/AL092022_Ian.pdf.
Powell, M. D., and Reinhold, T. A. (2007). Tropical cyclone destructive potential by integrated kinetic energy. Bull. Amer. Meteor. Soc. 88 (4), 513–526. doi:10.1175/bams-88-4-513
Pu, Z., Wang, Y., Li, X., Ruf, C., Bi, L., and Mehra, A. (2022). Impacts of assimilating CYGNSS satellite ocean surface wind on prediction of landfalling hurricanes with the HWRF model. Remote Sens. 14, 2118. doi:10.3390/rs14092118
Rappaport, E. N., Franklin, J. L., Avila, L. A., Baig, S. R., Beven, J. L., Blake, E. S., et al. (2009). Advances and challenges at the national hurricane center. Wea. Forecast. 24 (2), 395–419. doi:10.1175/2008waf2222128.1
Rogers, R., Reasor, P., and Lorsolo, S. (2013). Airborne Doppler observations of the inner-core structural differences between intensifying and steady-state tropical cyclones. Mon. Wea. Rev. 141 (9), 2970–2991. doi:10.1175/MWR-D-12-00357.1
Rose, R., Gleason, S., and Ruf, C. (2014). The NASA CYGNSS mission: a pathfinder for GNSS scatterometry remote sensing applications. SPIE 9240, Remote Sensing of the Ocean, Sea Ice, Coastal Waters, and Large Water Regions, 924005. doi:10.1117/12.2068378
Ruf, C., and Balasubramaniam, R. (2019). Development of the CYGNSS geophysical model function for wind speed. IEEE J. Sel. Top. Appl. Earth Obs. Remote Sens. 12, 66–77. doi:10.1109/JSTARS.2018.2833075
Ruf, C., Chang, P., Clarizia, M. P., Gleason, S., Jelenak, Z., Murray, J., et al. (2016b). CYGNSS handbook. Ann Arbor, MI: Michigan Pub., 154.
Ruf, C. S., Atlas, R., Chang, P. S., Clarizia, M. P., Garrison, J. L., Gleason, S., et al. (2016a). New ocean winds satellite mission to probe hurricanes and tropical convection. Bull. Amer. Meteor. Soc. 97 (3), 385–395. doi:10.1175/BAMS-D-14-00218.1
Schulz, E. W., Kepert, J. D., and Greenslade, D. J. M. (2007). An assessment of marine surface winds from the Australian Bureau of Meteorology numerical weather prediction systems. Wea. Forecast. 22 (3), 613–636. doi:10.1175/WAF996.1
Stern, D. P., and Nolan, D. S. (2012). On the height of the warm core in tropical cyclones. J. Atmos. Sci. 69 (5), 1657–1680. doi:10.1175/jas-d-11-010.1
Thompson, G., Rasmussen, R. M., and Manning, K. (2004). Explicit forecasts of winter precipitation using an improved bulk microphysics scheme. Part I: description and sensitivity analysis. Mon. Weather Rev. 132 (2), 519–542. doi:10.1175/1520-0493(2004)132<0519:efowpu>2.0.co;2
Tong, M., Sippel, J. A., Tallapragada, V., Liu, E., Kieu, C., Kwon, I.-H., et al. (2018). Impact of assimilating aircraft reconnaissance observations on tropical cyclone initialization and prediction using operational HWRF and GSI ensemble–variational hybrid data assimilation. Mon. Wea. Rev. 146, 4155–4177. doi:10.1175/mwr-d-17-0380.1
Zhan, Z., Mehra, A., Tallapgrada, V., Bi, L., Weng, Y., Liu, B., et al. (2021). HFIP real-time demo project: HAFSv0.2D regional data assimilation real-time experiment. Available at: https://hfip.org/sites/default/files/events/269/1230-bi-hafs-v02dpptx.pdf.
Zhang, J. A., Kalina, E. A., Biswas, M. K., Rogers, R. K., Zhu, P., and Marks, F. D. (2020). A review and evaluation of planetary boundary layer parameterizations in hurricane weather research and forecasting model using idealized simulations and observations. Atmosphere 11, 1091. doi:10.3390/atmos11101091
Zhang, K., Li, Y., Liu, H., Rhome, J., and Forbes, C. (2013). Transition of the coastal and estuarine storm Tide model to an operational storm surge forecast model: a case study of the Florida coast. Weather Forecast 28, 1019–1037. doi:10.1175/waf-d-12-00076.1
Keywords: tropical cyclones, numerical weather prediction, surface winds, data impact, data assimilation, ocean models, air-sea heat fluxes
Citation: Annane B and Gramer LJ (2024) Influence of CyGNSS L2 wind data on tropical cyclone analysis and forecasts in the coupled HAFS/HYCOM system. Front. Earth Sci. 12:1418158. doi: 10.3389/feart.2024.1418158
Received: 16 April 2024; Accepted: 02 September 2024;
Published: 23 October 2024.
Edited by:
Zhan Zhang, NCEP Environmental Modeling Center (EMC), United StatesReviewed by:
Xu Lu, Lynker Technologies LLC, United StatesJason Sippel, Atlantic Oceanographic and Meteorological Laboratory (NOAA), United States
Copyright © 2024 Annane and Gramer. This is an open-access article distributed under the terms of the Creative Commons Attribution License (CC BY). The use, distribution or reproduction in other forums is permitted, provided the original author(s) and the copyright owner(s) are credited and that the original publication in this journal is cited, in accordance with accepted academic practice. No use, distribution or reproduction is permitted which does not comply with these terms.
*Correspondence: Bachir Annane, QmFjaGlyLkFubmFuZUBub2FhLmdvdg==
 Bachir Annane
 Lewis J. Gramer