 Fankun Meng
 Lin Cao1,2*
 Yuhui Zhou
94% of researchers rate our articles as excellent or good
Learn more about the work of our research integrity team to safeguard the quality of each article we publish.
Find out more
ORIGINAL RESEARCH article
Front. Earth Sci., 20 June 2024
Sec. Geochemistry
Volume 12 - 2024 | https://doi.org/10.3389/feart.2024.1418087
This article is part of the Research TopicUnconventional Resources: Provenance Analysis, Sediment Transport, Reservoir Evaluation, Geo-energyView all 29 articles
Introduction: Contrary to the traditional recognition that CO2 has large injectivity (the ratio of CO2 injection volume to pressure drop) in low permeability oil reservoirs to keep the formation pressure at a high level, the CO2 injection rate usually cannot attain the set value. It is essential to study the factors that influence CO2 injectivity and propose the optimal strategies to improve the CO2 injectivity.
Methods: Therefore, in this study, several core samples collected from low permeability oil reservoirs are used to experimentally investigate the influences of CO2 injection rate, formation permeability, pressure and water saturation on CO2 injectivity, and the corresponding pressure drop, oil and gas production are examined. To determine the primary factor that influences the CO2 injectivity, orthogonal experimental design (ODE) and numerical simulations are utilized. In addition, to improve CO2 injectivity, the techniques of mini-fracturing and radial perforation are presented, and the threshold values for these two parameters are determined.
Result and discussion: The results demonstrate that according to the magnitude of the extent that influences CO2 injectivity, the rank for the above factors is CO2 injection rate, reservoir pressure, formation water saturation and permeability. The oil recovery is mainly influenced by CO2 injection rate and formation permeability, and the influences of reservoir pressure and water saturation on oil recovery are smaller. The threshold values for radial perforation and fracture half-length are 25 m and 50m, respectively, which can provide some guidance for the strategies that should be taken to improve the CO2 injectivity and recover more oil from low permeability oil reservoirs.
Plenty of laboratory experiments and field pilot tests show that CO2 flooding can enhance oil recovery significantly. According to the magnitude of formation pressure and minimum miscible pressure (MMP), there are two typical flooding types, miscible flooding and immiscible flooding (Dong et al., 2019). In the condition of miscible flooding, CO2 can mix with the oil phase easily, which reduces the oil viscosity and density greatly, and the displacement efficiency is much higher than the immiscible flooding (Liu et al., 2020; Wang et al., 2020). In addition, the effects of CO2 viscous fingering and gas override are weakened largely (Singh, 2018). Therefore, to improve CO2 sweep efficiency and oil recovery, CO2 miscible flooding should be utilized preferentially. To keep the condition of miscible flooding, the formation pressure should be larger than the MMP, and the amount of injected CO2 should be increased as large as possible. However, in some low permeability oil reservoirs, the CO2 injection rate cannot attain the set value, which causes the rapid decline of formation pressure, and the status gradually changes from miscible to immiscible flooding. Hence, it is significant to study the primary factors that influence the CO2 injectivity, and to present the optimal strategies that improve the CO2 injectivity.
As there are complex fluid distribution patterns, more researches focused on the abnormality of CO2 injectivity during the water-alternating-gas/CO2 (WAG) process. Experimentally, the effect of some primary features, such as relative permeability, water saturation, WAG ratio and CO2 slug size, on CO2 and bring injectivity during WAG flooding were studied and analyzed (Prieditis et al., 1991; Kamath et al., 1998; Shen et al., 2010; Yang et al., 2015). As the laboratory experiments are complicated and time-consuming, analytical or numerical methods are always used to evaluate the WAG injectivity. Some simple analytical models were developed to analyze the reasons that result in the differences of laboratory- and filed-observed CO2 tertiary injectivity (Christman and Gorell, 1990; Meng et al., 2018; Meng et al., 2020). Nevertheless, for analytical models, it is difficult to consider some complex effects, such as phase behavior, dispersive mixing, gravity, viscous instability and crossflow. Therefore, numerical simulators are widely utilized to study the impact of these factors on WAG injectivity (Jr et al., 1992; Jr et al., 1992; Faisal et al., 2009; Qiao et al., 2016). For the factors that affect WAG injectivity (John and Rogers, 2001), summarized that wettability, chemical effects, entrapment, relative permeability, saturation effects, interfacial tension (IFT), formation heterogeneity, anisotropy, and stratification have significant impacts on the injectivity.
In analogy to the abundant studies on the injectivity during WAG flooding, the evaluation of CO2 injectivity during CO2 sequestration has been researched comprehensively. In terms of the factors that affect CO2 injectivity (Sokama-Neuyam et al., 2017), found that the fines mobilization can seriously impair CO2 injectivity in sandstone cores, which is more important than salt precipitation. In addition, the effects of SO2 as an impurity, irreducible water saturation in a near-well region, non-Darcy flow, phase miscibility and gas compressibility on CO2 injectivity in sandstone saline aquifer also have been investigated (Mijic et al., 2014; Raza et al., 2015; Wang et al., 2016; Parka et al., 2019). To select the suitable sites for CO2 storage, and determine the CO2 injectivity and storage capacity for these sites, some reactive transport models, which consider salt precipitation, and CO2-water-rock geochemical reactions, were established properly (Xie et al., 2016; Dai et al., 2017; Cui et al., 2018). However, during the CO2 injection process, several CO2 storage reservoirs exhibit insufficient formation properties to support commercial-scale injection. Therefore, the application of hydraulic fracturing to enhance CO2 injectivity was explored, which could significantly increase the CO2 injection rate and reduce the well bottom-hole pressure (Raziperchikolaee et al., 2013; Huerta et al., 2020; Jung et al., 2020).
According to the above comprehensive reviews about CO2 injectivity, we can see that the factors that cause the abnormality of CO2 and water injectivity during WAG flooding have been investigated sufficiently. However, few studies pay attention to the evaluation of CO2 injectivity during CO2 flooding in low permeability oil reservoirs. Furthermore, specific measures to improve CO2 injectivity have not been presented. Although the method of hydraulic fracturing has been implemented to enhance CO2 injectivity during CO2 sequestration, there are many differences between CO2 flooding in low permeability oil reservoirs and CO2 storage in saline aquifers. Hence, firstly, this paper studies the principal factors that influence CO2 injectivity during CO2 flooding in low permeability oil reservoirs through an experimental approach. Then, with the numerical simulation and ODE methods, the primary factors that affect CO2 injectivity are ranked. Finally, the threshold values for two measures, mini-fracturing and radial perforation are determined, which could provide some guidance for the practical operations.
The core, oil and brine samples are collected from a low permeability oil reservoir in the Shengli oil field. The measured size, porosity and permeability for eight cores are shown in Table 1. In addition, the pore volume (PV) of cores is also calculated. As can be seen, for all of the cores, the permeability is lower than 10 mD, whereas the porosity is almost the same.
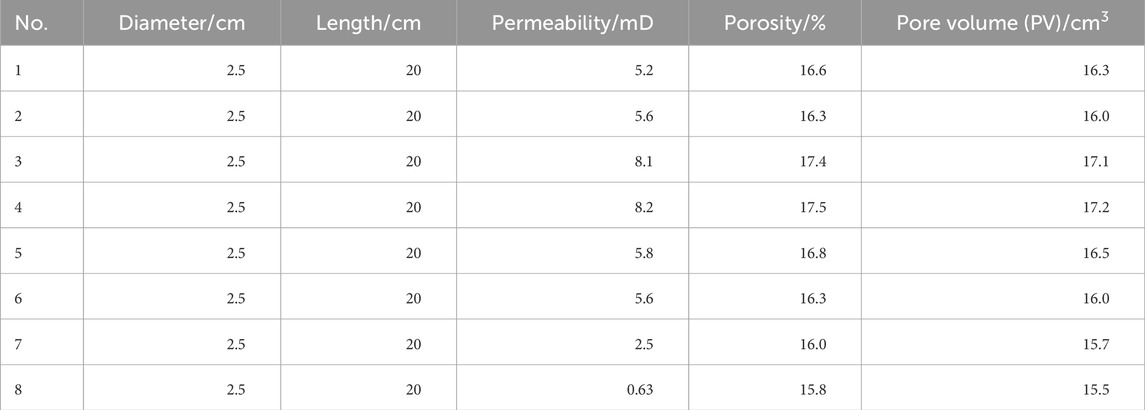
Table 1. Measured size, porosity and permeability for collected cores.
For oil samples, through the PVT experiments, the viscosity and density for live oil are measured to be 2.46 mPas and 0.7914 g/cm3 at the initial reservoir pressure 43.6 MPa and the reservoir temperature 126°C. The measured bubble-point pressure is 10.2 MPa, and the oil-gas ratio and formation volume factor are 37.6 and 1.144, respectively. With the slim-tube displacement tests, the MMP of the oil sample utilized in experiments is 28.9 MPa under reservoir temperature. The detailed compositional analysis for the oil sample is shown in Table 2. It can be seen that the oil samples mainly consist of light or medium components, particularly for C1, which accounts for 14.77%, while the mole fraction of heavy component C11+ is only 27.19%. The measured molecular weight for C11+ is 313 g/mol.
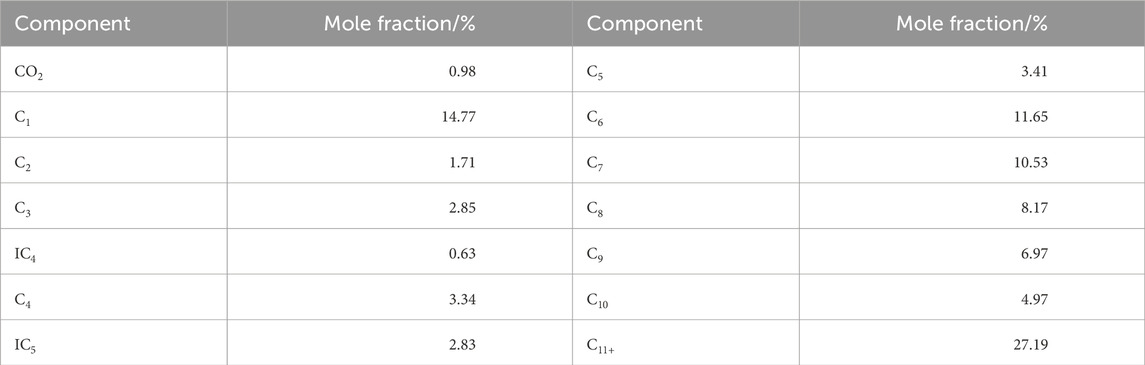
Table 2. Components of oil sample with compositional analysis.
For formation brine, the total salinity is 62428 mg/L, and the concentrations for Chloride, Sodium/Potassium are 37764 mg/L and 20617 mg/L. Then, according to the measured results, the salinity of synthetic brine for core experiments could be prepared.
Figure 1 shows a schematic of the laboratory experimental setup utilized in this study. In this experimental set-up, there are five subsystems, which include the pump system, storage system, displacement system, monitoring system and temperature control system. For the fluid pump system, on the one hand, the fluids of oil, synthetic water and CO2 are injected into the core sample under constant injection rate with a syringe pump, on the other hand, the nitrogen with high pressure is used to support the overburden pressure to the core holder. The back pressure at the outlet is set to be greater than the critical pressure of CO2 (7.39 MPa), which can make the CO2 keep in a supercritical state. In the monitoring system, the CO2 injection pressure, the produced oil and gas, are measured with pressure gauge, liquid collector, and gas flow meter, respectively. With the temperature control system, the experiment temperature is maintained at reservoir temperature.
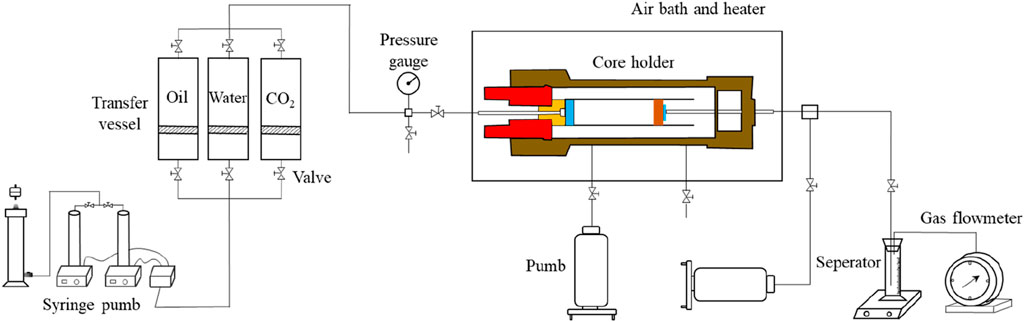
Figure 1. Schematic of the experimental setup for CO2 flooding.
The factors that affect CO2 injectivity could be classified into geological features and production parameters. In this experimental study, the effects of four primary factors on CO2 injectivity and oil recovery, which are CO2 injection rate, formation pressure, water saturation, and formation permeability, are investigated. Some scholars had also studied these four parameters. The presence of residual natural gas saturation, in the short term, would decrease the CO2 injectivity considerably. However, with a permeability dependent rate, the situation would improve as more natural gas is recovered (Saeedi and Rezaee, 2012). In addition, it would be wised to evaluate injectivity experimentally or numerically by considering the residual constraints (fraction of water, remaining gas, and condensate (oil phase)) as it varies with the injection rates, formation pressure (Raza A., et al., 2017; Lzgec O., et al., 2008). However, to further investigate the effect of these four parameters on CO2 injectivity, four scenarios are designed reasonably, and the detailed information of used cores in each scenario is listed in Table 3. The introduction for each scenario is shown as follows.
(1) Scenario #1. CO2 is injected into the two core samples with similar porosity, permeability and connate water saturation at rates of 0.1 mL/min and 0.05 mL/min.
(2) Scenario #2. The production pressure is set to be 20 MPa and 10 MPa for two core samples with similar porosity, permeability and connate water saturation.
(3) Scenario #3. Two core samples with similar porosity and permeability, whose connate water saturation are 0.42 and 0.69, are selected and used to conduct CO2 flooding.
(4) Scenario #4. Two core samples with similar porosity and connate water saturation, whose formation permeability are 2.5 mD and 0.63 mD, are employed to conduct CO2 flooding.
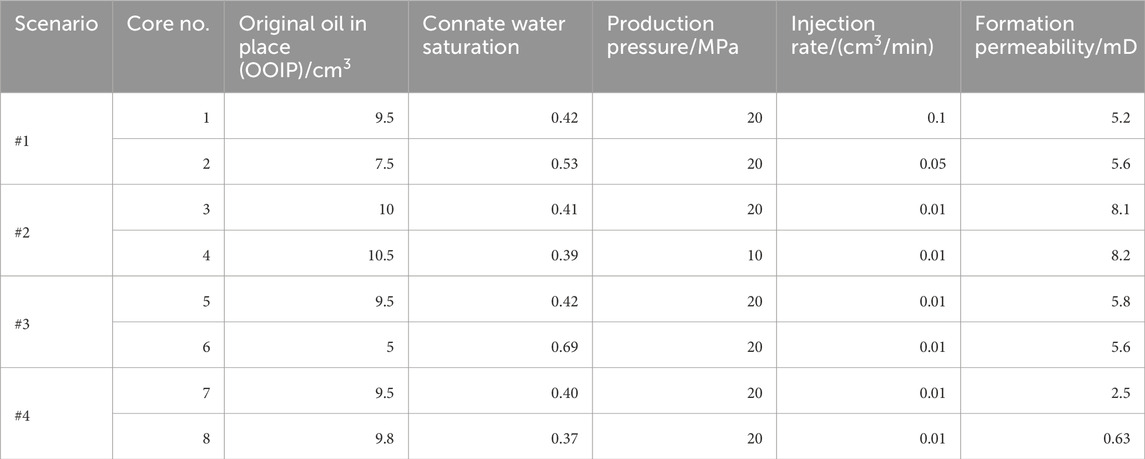
Table 3. Core sample specifications and designed parameters for four scenarios.
The experimental procedure is as follows.
Step 1: to simulate the oil reservoir under the initial condition, the core samples should be evacuated with a vacuum pump before the implementation of CO2 flooding.
Step 2: synthetic water is injected into the cores at different rates. Subsequently, the core samples are flooded with live oil at a constant rate until there is no water production. Thus, the irreducible water saturation (connate water saturation) and original oil in place (OOIP) for each core sample can be acquired, which is shown in Table 3.
Step 3: The production pressure is set to be 20 MPa, which makes it identical to the current formation pressure.
Step 4: During the CO2 flooding process for these four scenarios, the pressure drop, gas production and oil production are measured. Then, the oil recovery and CO2 injectivity are calculated. In this study, CO2 injectivity is defined as the ratio of CO2 injection rate to a measured pressure drop. Once the CO2 flooding is terminated, by reducing the backpressure in a stepwise manner, the system pressure could be reduced to the atmospheric pressure.
Scenario #1 evaluates the effects of CO2 injection rate on CO2 injectivity. For different CO2 injection rates, the oil recovery and cumulative gas production versus injected volume are shown in Figure 2, and the pressure drop and CO2 injectivity versus injected volume are shown in Figure 3. As can be seen from these two figures, in the beginning, the CO2 is compressed and injected into the core sample, in this stage, the injection pressure drop increase, and there is no oil production. It is obvious that the ultimate oil recovery and pressure drop increase with injection rate, while the gas breakthrough time and CO2 injectivity in the later period decrease with it. The reasons for this phenomenon can be attributed to the fact that a larger CO2 injection rate can greatly increase formation pressure, which increases the miscibility between CO2 and oil and reduces the moving velocity of the CO2 displacement front. Due to the better miscibility under a high CO2 injection rate (0.1 cc/min), thus the swept efficiency of CO2 and oil recovery are improved, and after CO2 breakthrough the CO2 injectivity is much lower than the injectivity under a small CO2 injection rate (0.05 cc/min).
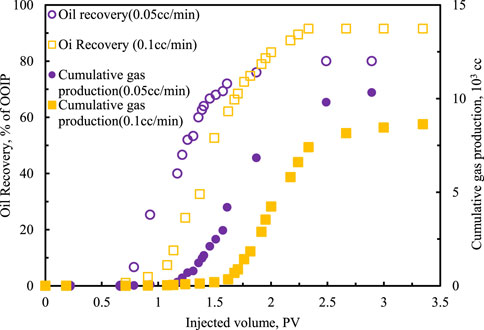
Figure 2. Measured oil recovery, cumulative gas production versus CO2 injected volume.
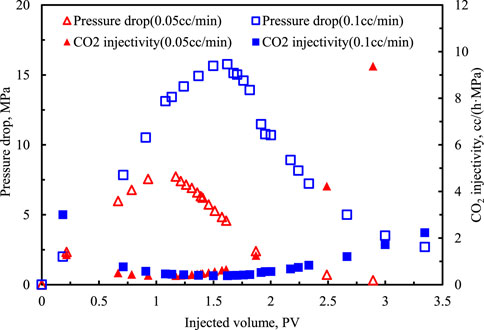
Figure 3. Measured injection pressure drop, calculated CO2 injectivity versus CO2 injected volume.
The influences of formation pressure on CO2 injectivity are studied in scenario #2. Figure 4 and Figure 5 show the oil recovery and cumulative gas production versus injected volume, the pressure drop and CO2 injectivity versus injected volume, respectively. Since a larger formation pressure can increase the miscibility of CO2 and oil, then as shown in Figure 4, the growth rate of cumulative gas production for this case is less than the case with lower formation pressure, and the ultimate oil recovery is higher. As the CO2 injection rate is the same for both cases, the gas breakthrough time, maximum pressure drop and injectivity are almost identical. Nevertheless, with the decline of pressure drop, the CO2 injectivity increases gradually. Since on the condition of large formation pressure, the mixing of CO2 and oil is sufficient, thus the rising rate of CO2 injectivity is less than the case with lower formation pressure.
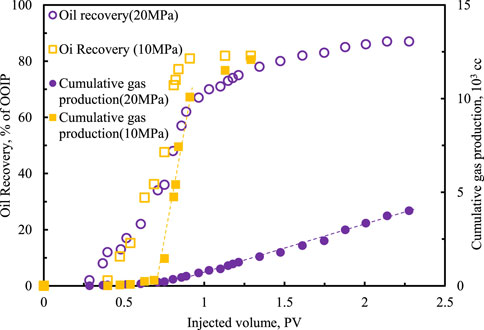
Figure 4. Measured oil recovery, cumulative gas production versus CO2 injected volume.
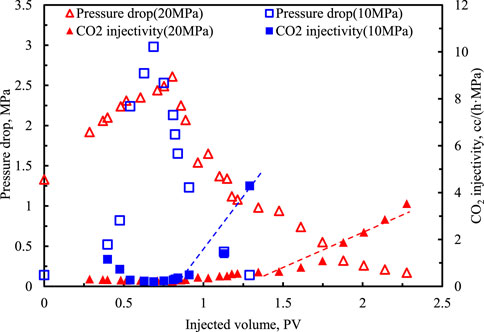
Figure 5. Measured injection pressure drop, calculated CO2 injectivity versus CO2 injected volume.
Under the different water saturation conditions, Figure 6 and Figure 7 plot the measured oil recovery, cumulative gas production versus CO2 injected volume and measured pressure drop, calculated CO2 injectivity versus CO2 injected volume, respectively. As shown in these two figures, for the case with higher water saturation, the maximum values of cumulative gas production and pressure drop are significantly less than the case with lower saturation, which also causes the CO2 injectivity for the former case to be larger than the latter case. Through the comprehensive analysis for the above phenomenon, it can be speculated that with high water saturation, CO2 flooding is similar to carbonated water or WAG displacement, thus CO2 mobility is greatly reduced, and CO2 swept efficiency is improved. In addition, influenced by the capillary trapping effect for cases with high water saturation, a large amount of CO2 is trapped in the porous media, which results in the decline of gas production. Since the mobility of oil is much lower than the water, the CO2 injectivity in the formation with low water saturation is less than the formation with high water saturation.
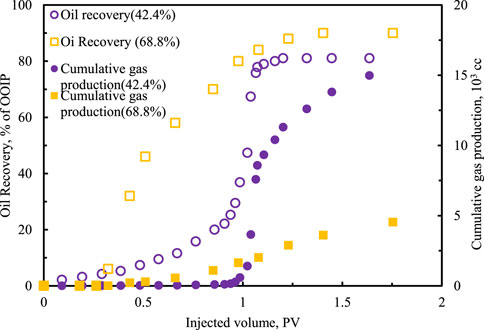
Figure 6. Measured oil recovery, cumulative gas production versus CO2 injected volume.
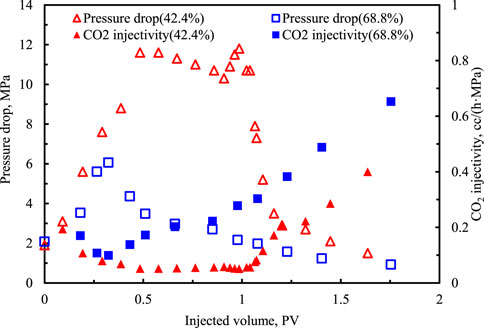
Figure 7. Measured injection pressure drop, calculated CO2 injectivity versus CO2 injected volume.
For core samples with different permeability, Figure 8 shows the oil recovery, gas production versus CO2 injected volume, and Figure 9 shows the injection pressure drop, CO2 injectivity versus CO2 injected volume. As the porous space for formation with lower permeability is mainly consisted of micro and nanopores, the CO2 moving velocity in these pores is slower, and a large number of CO2 is trapped in the micropores, which causes that the rising rate of oil recovery and gas production is lower, as shown in Figure 2. To obtain a higher oil recovery, more CO2 is needed for tight formation in practice. Furthermore, impacted by the large portion of micro and nanopores, the CO2 injectivity for tight formation is significantly less than the formation with larger permeability.
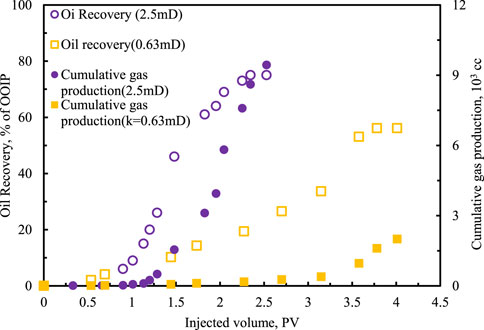
Figure 8. Measured oil recovery, cumulative gas production versus CO2 injected volume.

Figure 9. Measured injection pressure drop, calculated CO2 injectivity versus CO2 injected volume.
As shown in the above parts, the factors that influence the CO2 injectivity have been studied through experiments; however, due to the complexity and time-consuming of experiments, it is difficult to evaluate the influence of these factors on CO2 injectivity quantitatively. Therefore, the combinations of numerical simulation and OED methods are used to solve the mentioned problems.
The oil reservoir of interest is located in Bohai Bay Basin, Shengli oilfield, which has 19 production wells and 11 injection wells in total. As can be seen from Figure 10A that there are many faults in this reservoir, which belongs to a complex fault-block oil formation. Currently, CO2 flooding is only implemented in the main body of this reservoir, and the well group is a classical five-point pattern. To evaluate the CO2 injectivity of injection wells and the production performance of production wells directly, one of the well groups is selected, and the detailed information about formation and production parameters is shown in Table 4. The fluid compositional components are shown in Table 2. With Eclipse compositional simulator, a grid system of 70 × 70 × 5 is developed and represented the target well group, which results in a grid block size of 5 × 5 × 2.12 m, as shown in Figure 10B.
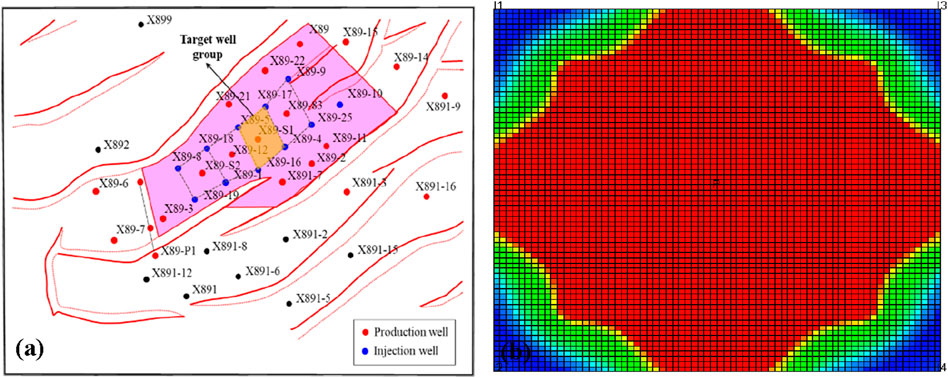
Figure 10. (A) Well locations in the reservoir of interest and (B) the presented model in this paper.
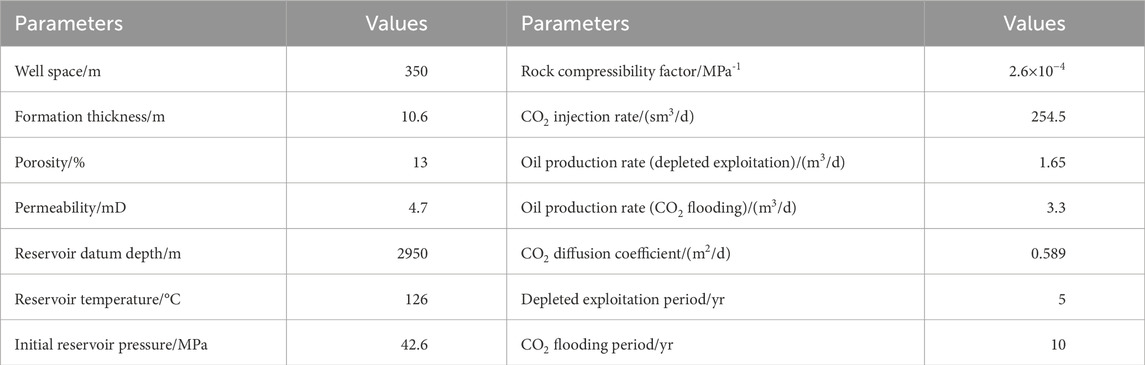
Table 4. Formation and production parameters for target well group.
Initially, the depleted development is adopted, and after 5 years of depleted production, CO2 flooding is used to enhance oil recovery in the low permeability reservoir. The relative permeability curves for oil/gas phases and oil/water phases used in this study are shown in Figure 11, which are acquired from the laboratory experiments. The measurement process of the relative permeability curve for oil/water phases and oil/gas phases is as follows:
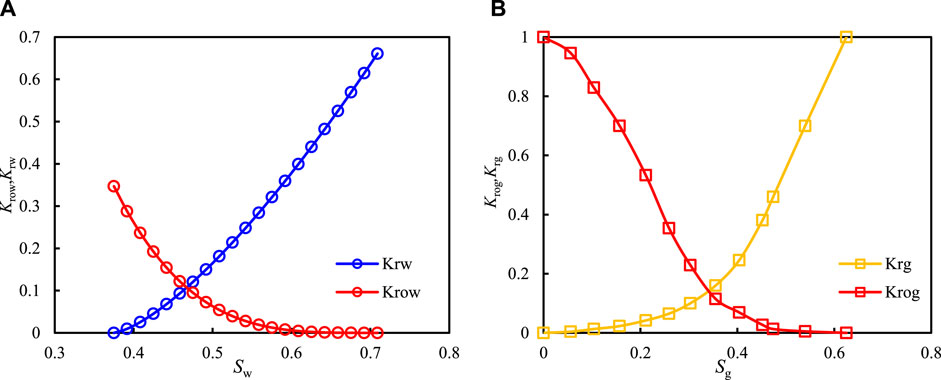
Figure 11. Relative permeability curves for (A) oil-water phase and (B) oil-gas phase.
The oil and water are injected into the core at a certain flow rate at the same time, which creates a pressure difference at both ends of the core. When the oil/water flow rate are stable, the oil/water saturations in the core do not change. According to Darcy’s law, the permeabilities of the oil/water phases at a certain saturation are calculated. By changing the oil/water flow ratio, the permeabilities of the oil/water phases under different saturations can be calculated, and then the relative permeability curve for oil/water phases can be drawn. The same is true for the relative permeability curve of gas and oil.
To evaluate the influences of four factors (CO2 injection rate, formation pressure, water saturation, and permeability) mentioned in the experimental study quantitatively, the OED method is employed. According to a practical variation range for injection rate, formation pressure, reservoir water saturation, and rock permeability, the levels for these parameters are designed reasonably, which are shown in Table 5.
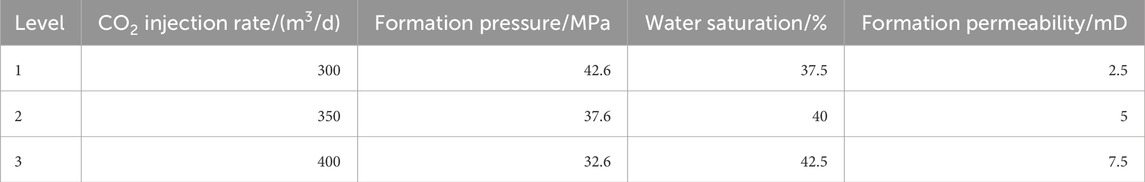
Table 5. Design of levels for four primary influential factors.
Since there are four factors, thus orthogonal array L9 (34) is used to design the schemes, which is shown in Table 6. For each scheme, through the application of the numerical simulator, the production performances for the reservoir and wells can be obtained. The other essential parameters during the simulation can be found in Section 4.1. In Table 6, the CO2 injectivity is defined as the ratio of total CO2 injection volume to formation pressure drop. The used pressure drop is the difference between the formation average pressure in the last moment and the value before CO2 flooding.
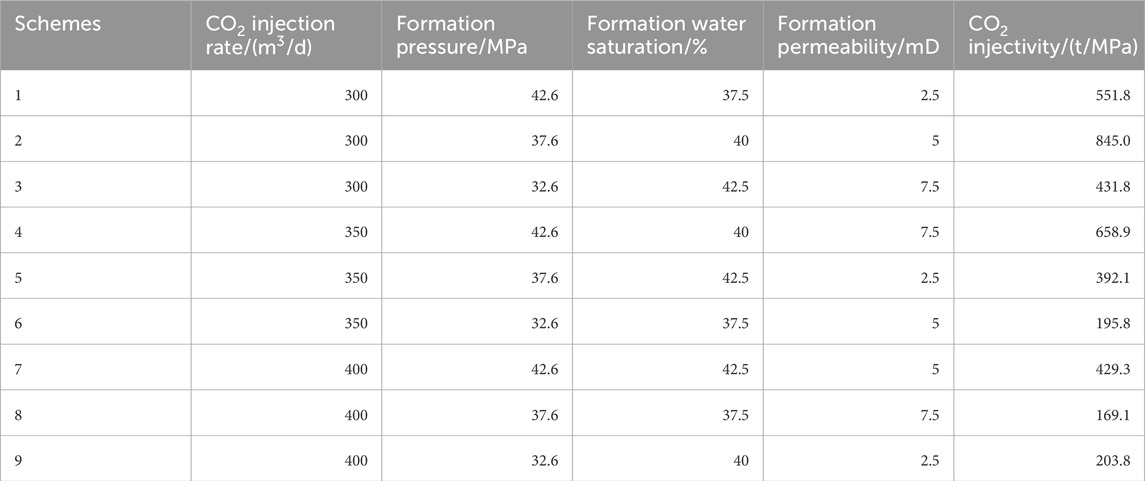
Table 6. Orthogonal design schemes and simulation results.
According to the numerical simulation results, the mean value for each level can be calculated, which is expressed as K1, K2and K3in Table 7. In addition, the range for each level, R, can also be obtained.
It can be seen from Table 7 that the range R for different CO2 injection rate is the largest (342.1 t/MPa), while for formation permeability it is the lowest (107.5 t/MPa), which indicates that CO2 injectivity is primarily influenced by CO2 injection rate, and the formation permeability has few effects on CO2 injectivity. The formation water saturation and permeability have moderate impacts on CO2 injectivity. The results are identical to experimental observations. For instance, through the comparisons of Figures 3, 5, 7, and 9, we can see that the difference of maximum CO2 injectivity for different injection rates is largest, which is 7.15 cc/(hMPa). Whereas the difference of maximum injectivity for different permeability is 0.07 cc/(hMPa), which is lower than the other factors. For different formation pressure and water saturation, the differences of maximum injectivity are 0.76 cc/(hMPa) and 0.25 cc/(hMPa), respectively, which are intermediate between the injection rate and formation permeability. Therefore, through the combination of OED results and experimental observations, we can conclude that the rank for the influential factors of CO2 injectivity is CO2 injection rate, reservoir pressure, formation pressure, and permeability.
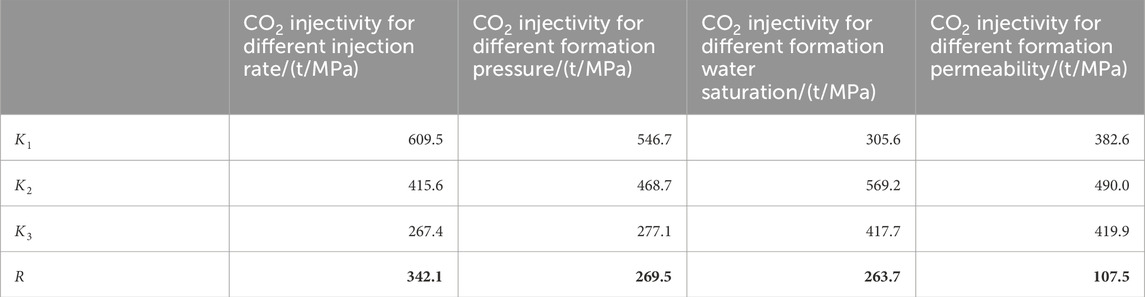
Table 7. Analysis for the simulation results of designed schemes.
As mentioned above, the CO2 injection rate is the primary factor that affects CO2 injectivity, therefore, reasonable measures that can improve the CO2 injection rate should be presented. In this study, two measures are proposed, which are radial perforation and mini-fracturing. The locations of radial perforation wellbore and mini-fractures are shown in Figure 12. To simulate the mini-fractures properly, Local Grid Refinement (LGR) technology is utilized, and the refined grids conform to the logarithmic distribution pattern.
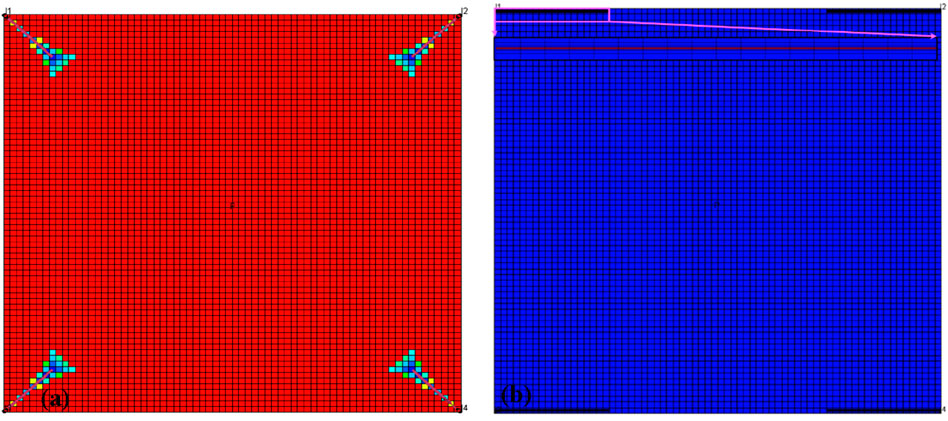
Figure 12. Numerical simulation models for (A) radial perforation and (B) mini-fracturing measures.
On the one hand, the employment of radial perforation and mini-fracturing can enhance the CO2 injectivity, on the other hand, the implementation of radial perforation and mini-fracturing can result in the appearance of gas channeling in advance. To obtain large CO2 injectivity and avoid the early gas breakthrough simultaneously, the lengths for radial perforation and mini-fracturing should be optimized. The parameters that are used have been listed in Section 4.1.
Figure 13 plots the relationship curve between radial perforation length and CO2 injectivity. The method to calculate CO2 injectivity has been stated in Section 4.2. It can be seen from this figure that when the radial perforation length is less than 25 m, the CO2 injectivity increases with the radial perforation length; when it is larger than 25 m, the CO2 injectivity for different radial perforation lengths is nearly the same, which demonstrates that the threshold value for radial perforation length is 25 m. The reasons for this phenomenon may be attributed to the fact that on the condition of identical injection volume for different radial perforation lengths, when it is lower than one certain value, the formation energy cannot be supplemented in time. However, when it is larger than this critical value, the formation energy can be supplemented, and the rise of radial perforation length has few effects on the CO2 injectivity.
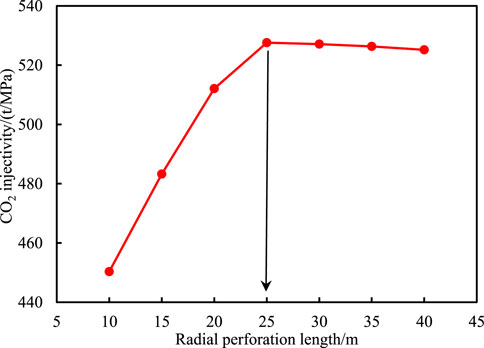
Figure 13. Relationship between radial perforation length and CO2 injectivity.
The relationship between mini-fracture half-length and CO2 injectivity is shown in Figure 14. As can be seen from this figure, in the beginning, the CO2 injectivity increases with min-fracture half-length drastically. Nevertheless, when the half-length is larger than 50 m, the increasing rate of CO2 injectivity decline obviously. Therefore, it can be concluded that the threshold value for min-fracture half-length is 50 m in this study. In addition, it can be seen that the relationship curves in Figure 13 and Figure 14 are similar, which indicates that the reasons for interpreting the variation rule are also the same as each other.
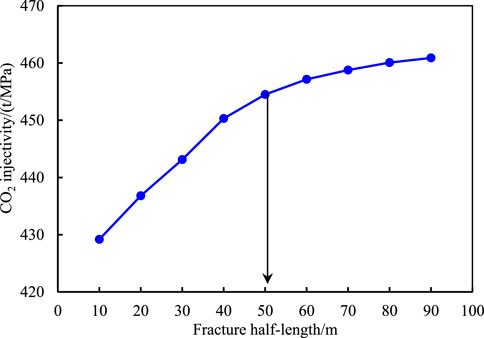
Figure 14. Relationship between mini-fracture half-length and CO2 injectivity.
This paper studies the factors that affect CO2 injectivity and oil recovery through the experiments. With the numerical simulation and OED method, the rank for primary factors that influence CO2 injectivity is given, and the optimal radial perforation length and mini-fracture half-length are presented. Some highlights of this work include the following.
(1) CO2 injection has the largest impact on CO2 injectivity, while the formation permeability has the lowest influence on CO2 injectivity, and the formation saturation and pressure are intermediate between the CO2 injection and formation permeability.
(2) For formation with large water saturation, the injectivity and displacement efficiency is higher, while the gas production is lower, which indicates that it is more suitable for the implementation of CO2 flooding and sequestration.
(3) On the condition of large formation pressure, due to the sufficient solution and diffusivity of oil and CO2, the gas production is less, and the CO2 injectivity increases gradually, which indicates that the earlier CO2 flooding is implemented, the better production performance can be obtained.
(4) To enhance CO2 injectivity, the measures of radial perforation and mini-fracturing can be taken, and the threshold values for the perforation length and the fracture half-length are 25 m and 50 m, respectively.
The raw data supporting the conclusion of this article will be made available by the authors, without undue reservation.
FM: Writing–review and editing. LC: Writing–original draft. YZ: Resources, Project administration, Software, Writing–review and editing. BL: Writing–original draft, Resources, Supervision. CW: Conceptualization, Data curation, Formal Analysis, Writing–original draft. JL: Investigation, Methodology, Software, Validation, Writing–review and editing.
The author(s) declare that financial support was received for the research, authorship, and/or publication of this article. This work is supported by the National Natural Science Foundation of China (Grant No. 52104018, 52274030).
The authors would like to appreciate reviewers and editors whose critical comments were helpful in preparing this article.
The authors declare that the research was conducted in the absence of any commercial or financial relationships that could be construed as a potential conflict of interest.
All claims expressed in this article are solely those of the authors and do not necessarily represent those of their affiliated organizations, or those of the publisher, the editors and the reviewers. Any product that may be evaluated in this article, or claim that may be made by its manufacturer, is not guaranteed or endorsed by the publisher.
Christman, P. G., and Gorell, S. B. (1990). Comparison of laboratory-and field-observed CO2 tertiary injectivity. J. Petroleum Technol. 42 (2), 226–233. doi:10.2118/17335-pa
Cui, G., Wang, Y., Rui, Z., Chen, B., Ren, S., and Zhang, L. (2018). Assessing the combined influence of fluid-rock interactions on reservoir properties and injectivity during CO2 storage in saline aquifers. Energy 155, 281–296. doi:10.1016/j.energy.2018.05.024
Dai, Z., Zhang, Y., Stauffer, P., Xiao, T., Zhang, M., Ampomah, W., et al. (2017). Injectivity evaluation for offshore CO2 sequestration in marine sediments. Energy Procedia 114, 2921–2932. doi:10.1016/j.egypro.2017.03.1420
Dong, P., Liao, X., Chen, Z., and Chu, H. (2019). An improved method for predicting CO2 minimum miscibility pressure based on artificial neural network. Adv. Geo-Energy Res. 3 (4), 355–364. doi:10.26804/ager.2019.04.02
Faisal, A., Bisdom, K., Zhumabek, B., Mojaddam Zadeh, A., and Rossen, W. R. (2009). “Injectivity and grativity segregation in WAG and SWAG enhanced oil recovery,” in Paper presented at SPE annual technical conference and exhibition, 4–7.
Huerta, N. J., Cantrell, K. J., White, S. K., and Brown, C. F. (2020). Hydraulic fracturing to enhance injectivity and storage capacity of CO2 storage reservoirs: benefits and risks. Int. J. Greenh. Gas Control 100 (1013105), 103105–103112. doi:10.1016/j.ijggc.2020.103105
Izgec, O., Demiral, B., Bertin, H., and Akin, S. (2008). CO2 injection into saline carbonate aquifer formations I: laboratory investigation. Transp. Porous Media 72 (1), 1–24. doi:10.1007/s11242-007-9132-5
JohnRogers, D. R. B. G., and Grigg, R. B. (2001). A literature analysis of the WAG injectivity abnormalities in the CO2 process. SPE Reserv. Eval. Eng. 4 (5), 375–386. doi:10.2118/73830-pa
Jr, M. K. R., Cheng, C. T., Varnon, J. E., Pope, G. A., and Sepehrnoori, K. (1992). “Interpretation of a CO2 WAG injectivity test in the San Andres formation using a compositional simulator,” in Paper presented at SPE/DOE eighth symposium on enhanced oil recovery. Tulsa, Oklahoma, USA.
Jr, M. K. R., Pope, G. A., and Sepehrnoori, K. (1992). “Analysis of tertiaryinjectivity of carbon dioxide,” in Paper presented at SPE permian basin oil and gas recovery conference midland, 18–20.
Jung, H., Espinoza, D. N., and Hosseini, S. A. (2020). Wellbore injectivity response to step-rate CO2 injection: coupled thermo-poro-elastic analysis in a vertically heterogeneous formation. Int. J. Greenh. Gas Control 102, 103156. doi:10.1016/j.ijggc.2020.103156
Kamath, J., Nakagawa, F. M., Boyer, R. E., and Edwards, K. A. (1998). “Laboratory investigation of infectivity losses during WAG in West Texas Dolomites,” in Paper presented at SPE permian badn oil and gas recovery cofderence, midland,Texas, USA, 22–27.
Liu, H., Zhu, Z., Patrick, W., Liu, J., Lei, H., and Zhang, L. (2020). Numerical visualization of supercritical CO2 displacement in pore-scale porous and fractured media saturated with water. Adv. Geo-Energy Res. 4 (4), 419–434. doi:10.46690/ager.2020.04.07
Meng, F., Su, Y., Hao, Y., Li, Y., and Tong, G. (2018). Injectivity of CO2 WAG in low permeability oil reservoirs based on B-L equation. J. China Univ. Petroleum 42 (4), 91–99. doi:10.3969/j.issn.1673-5005.2018.04.011
Meng, F., Su, Y., Wang, W., Lei, Q., and He, D. (2020). Semi-analytical evaluation for water-alternating-CO2 injectivity in tight oil reservoirs. Int. J. Oil Gas Coal Technol. 24 (1), 62–84. doi:10.1504/ijogct.2020.106704
Mijic, A., LaForce, T. C., and Muggeridge, A. H. (2014). CO2 injectivity in saline aquifers: the impact of non-Darcy flow, phase miscibility, and gas compressibility. Water Resour. Res. 50 (5), 4163–4185. doi:10.1002/2013wr014893
Parka, Y.-C., Kimb, S., Leec, J. H., and Shinn, Y. J. (2019). Effect of reducing irreducible water saturation in a near-well region on CO2 injectivity and storage capacity. Int. J. Greenh. Gas Control 86, 134–145. doi:10.1016/j.ijggc.2019.04.014
Prieditis, J., Wolle, C. R., and Notz, P. K. (1991). “A laboratory and field injectivity study CO2 WAG in the San Andres formation of West Texas,” in Paper presented at SPE 66rd annual technical conference and exhibition, Dallas, TX, USA.
Qiao, C., Li, L., Johns, R. T., and Xu, J. (2016). Compositional modeling of dissolution-induced Injectivity alteration during CO2 flooding in carbonate reservoirs. SPE J. 21 (03), 0809–0826. doi:10.2118/170930-pa
Raza, A., Gholami, R., Rezaee, R., Bing, C. H., Nagarajan, R., and Hamid, M. A. (2017). Preliminary assessment of CO2 injectivity in carbonate storage sites. Petroleum 3 (1), 144–154. doi:10.1016/j.petlm.2016.11.008
Raza, A., Rezaee, R., Gholami, R., Rasouli, V., Bing, C. H., Nagarajan, R., et al. (2015). Injectivity and quantification of capillary trapping for CO2 storage: a review of influencing parameters. J. Nat. Gas Sci. Eng. 26, 510–517. doi:10.1016/j.jngse.2015.06.046
Raziperchikolaee, S., Alvarado, V., and Yin, S. (2013). Effect of hydraulic fracturing on long-term storage of CO2 in stimulated saline aquifers. Appl. Energy 102, 1091–1104. doi:10.1016/j.apenergy.2012.06.043
Saeedi, A., and Rezaee, R. (2012). Effect of residual natural gas saturation on multiphase flow behaviour during CO2 geo-sequestration in depleted natural gas reservoirs. J. Petroleum Sci. Eng. 82-83, 17–26. doi:10.1016/j.petrol.2011.12.012
Shen, P., Chen, X., and Qin, J. (2010). Pressure characteristics in CO2 flooding experiments. Petroleum Explor. Dev. 37 (2), 211–215. doi:10.1016/s1876-3804(10)60026-2
Singh, H. (2018). Impact of four different CO2 injection schemes on extent of reservoir pressure and saturation. Adv. Geo-Energy Res. 2 (3), 305–318. doi:10.26804/ager.2018.03.08
Sokama-Neuyam, Y. A., Ginting, P. U. R., Timilsina, B., and Ursin, J. R. (2017). The impact of fines mobilization on CO2 injectivity: an experimental study. Int. J. Greenh. Gas Control 65, 195–202. doi:10.1016/j.ijggc.2017.08.019
Wang, W., Meng, F., Su, Y., Hou, L., Geng, X., Hao, Y., et al. (2020). A simplified capillary bundle model for CO2-alternating-water Iinjection using an equivalent resistance method. Geofluids 2020, 1–14. doi:10.1155/2020/8836287
Wang, Z., Wang, J., Lan, C., Ko, V., Ryan, D., and Wigston, A. (2016). A study on the impact of SO2 on CO2 injectivity for CO2 storage in a Canadian saline aquifer. Appl. Energy 184, 329–336. doi:10.1016/j.apenergy.2016.09.067
Xie, J., Zhang, K., Li, C., and Wang, Y. (2016). Preliminary study on the CO2 injectivity and storage capacity of low-permeability saline aquifers at Chenjiacun site in the Ordos Basin. Int. J. Greenh. Gas Control 52, 215–230. doi:10.1016/j.ijggc.2016.07.016
Keywords: CO2 injectivity, low permeability oil reservoir, CO2 flooding, experimental study, numerical simulation
Citation: Meng F, Cao L, Zhou Y, Liu B, Wen C and Liu J (2024) Experimental and numerical studies on CO2 injectivity in low permeability oil reservoirs. Front. Earth Sci. 12:1418087. doi: 10.3389/feart.2024.1418087
Received: 16 April 2024; Accepted: 03 June 2024;
Published: 20 June 2024.
Edited by:
Wenguang Wang, Northeast Petroleum University, ChinaReviewed by:
Guoqiang Xing, Changzhou University, ChinaCopyright © 2024 Meng, Cao, Zhou, Liu, Wen and Liu. This is an open-access article distributed under the terms of the Creative Commons Attribution License (CC BY). The use, distribution or reproduction in other forums is permitted, provided the original author(s) and the copyright owner(s) are credited and that the original publication in this journal is cited, in accordance with accepted academic practice. No use, distribution or reproduction is permitted which does not comply with these terms.
*Correspondence: Lin Cao, c2hlbmdsaXpoaWd1YW5nMTIzQDE2My5jb20=
Disclaimer: All claims expressed in this article are solely those of the authors and do not necessarily represent those of their affiliated organizations, or those of the publisher, the editors and the reviewers. Any product that may be evaluated in this article or claim that may be made by its manufacturer is not guaranteed or endorsed by the publisher.
Research integrity at Frontiers
Learn more about the work of our research integrity team to safeguard the quality of each article we publish.