 Wei Xu1,2
 Yulong Cui
 LingFeng Gong
- 1Chengdu Center, China Geological Survey (Geosciences Innovation Center of Southwest China), Chengdu, China
- 2Key Laboratory of Geohazard Prevention and Geoenvironment Protection, Chengdu University of Technology, Chengdu, China
- 3School of Civil Engineering and Architecture, Anhui University of Science and Technology, Huainan, China
Liangshan Prefecture, located at the northeastern edge of the Hengduan Mountain System and within the southern section of the Sichuan-Yunnan tectonic belt in Sichuan Province, China, a region prone to landslides, collapses and debris flows due to its active tectonics, complex topography and significant river erosion. By analysing a dataset of environment factors and geological hazard catalogue, the research uses the Relief algorithm to identify critical influencing factors for each hazard type, selecting 10, 9 and 9 factors for landslides, collapses and debris flows, respectively. Five models are used to assess the vulnerability of these hazards: the Information Value model, the Evidence Weight model, the Logistic Regression model, and both the Evidence Weight-Logistic Regression and the Information Value-Logistic Regression coupled models. The effectiveness of these models is confirmed by confusion matrix and ROC curve analyses, with the combined models showing particularly high accuracy in assessing susceptibility. High risk zones were identified in specific areas and along major fault zones in Liangshan Prefecture. The research provides significant insights into the susceptibility of geological hazards in mountainous and canyon regions, offering a comprehensive approach that goes beyond the limitations of single model applications. This methodology not only provides more accurate and comprehensive results, but also serves as a fundamental reference for geological hazard mitigation and management in Liangshan Prefecture, potentially benefiting similar regions worldwide.
1 Introduction
Geological hazards pose a major threat to human life, infrastructure and the environment, especially in mountainous areas with complex geological and environmental conditions. Evaluation models in geological disaster susceptibility analysis can be divided into qualitative evaluation and quantitative evaluation. Current quantitative methods for landslide susceptibility analysis include BP neural networks (Wang et al., 2005; Hongtao, 2020; Huang et al., 2022), hierarchical analysis (Komac, 2006; Wu and Chen, 2009), the information quantity method (Sarkar et al., 2013; Tan et al., 2015; Du et al., 2017; Tsangaratos et al., 2017; Wubalem and Meten, 2020; He et al., 2023; Nie et al., 2023), coupled models (Zhao et al., 2017; Arabameri et al., 2019; Luguang et al., 2021; Wang et al., 2023), MaxEnt models (Liu et al., 2022), Evidence Weight model (Lee and Choi, 2004; Ilia and Tsangaratos, 2016), and various machine (Kadavi et al., 2018) and deep learning models (Bui et al., 2020). Each method, however, has its limitations. For instance, the right-of-evidence model overlooks the interplay between factors, while the information quantity method acknowledges the contribution of individual factors but neglects their interrelations. Consequently, scholars globally engage in comparative research using diverse methodologies to address these analytical gaps (Lombardo et al., 2015; Wang et al., 2016; Nhu et al., 2022; Conforti et al., 2023).
This study focuses on Liangshan Prefecture in Sichuan Province, employing an integrative approach that combines detailed field investigations of geological hazards with a comprehensive analysis of the causative geological conditions and development characteristics of these hazards. The research primarily addresses the susceptibility of landslides, collapses, and debris flows within the region. Utilizing the collinearity method and the Relief algorithm, the study investigates the interrelation and contribution of various influencing factors. For the assessment of landslides, collapses, and debris flows, 10, 9, and 9 evaluative factors are respectively selected. The methodology incorporates five distinct evaluation models: the Information Volume Model, the Evidence Weight Model, the Logistic Regression Model, and two coupling models - the Evidence Weight-Logistic Regression Coupling Model and the Information Volume-Logistic Regression Coupling Model. These models facilitate a comparative analysis of the susceptibility and accuracy of the three types of geological hazards. The findings of this study not only offer a foundational reference for the mitigation and management of geological disasters in Liangshan Prefecture but also contribute valuable insights for susceptibility assessments of geological hazards in regions characterized by high mountain and canyon topographies.
2 Study area
Liangshan Yi Autonomous Prefecture, situated in the southwestern sector of Sichuan Province, encompasses an extensive area of approximately 60,400 square kilometers. Xichang City serves as its administrative center, with the prefecture governing two county-level cities and fifteen counties. Geotectonically, Liangshan is strategically positioned at the juncture of several significant geological features: it lies on the western fringe of the Yangtze Paleocontinent Block and the eastern boundary of the Tibetan Plateau. This location is also at the confluence of the Kang-Yunnan fault zone and the southern segment of the Sichuan-Yunnan tectonic belt, making it a region of pronounced tectonic evolution. Liangshan is centrally situated within China’s north-south seismic belt, marking it as a zone of heightened tectonic and seismic activity. This is exemplified by the peak ground acceleration depicted in Figure 1A.
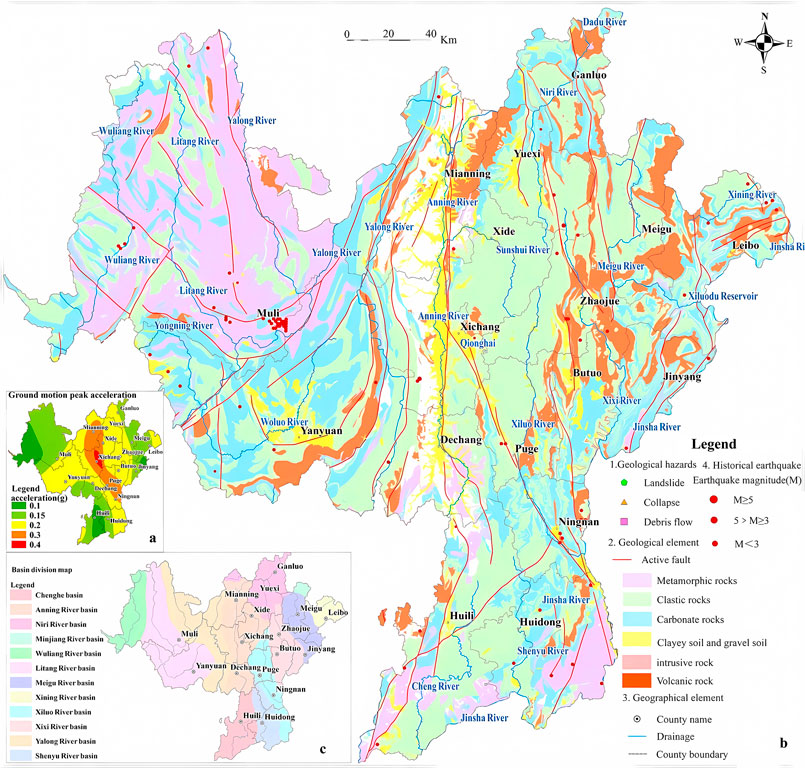
Figure 1. Geological hazard distribution map of Liangshan Prefecture.
The geological structure within the study area is notably complex and diverse. Based on the distinct physical and mechanical properties of various geotechnical entities, the region’s engineering geological rock formations have been classified into five categories: clayey soil and gravelly soil, clastic rock, carbonate rock, metamorphic rock, and magmatic rock. This classification is further illustrated in Figure 1B, providing a clear visual representation of the area’s intricate geological composition.
Liangshan Prefecture, situated on the northeastern edge of the Hengduan Mountains in southwestern Sichuan, is a region of complex topography, marked by high elevations in the northwest and lower ones in the southeast, with predominantly north-south oriented mountain ranges. The area’s landforms are diverse, categorized into river valley accumulative, mid-mountain, and tectonic erosion alpine types. Influenced by a subtropical monsoon climate, Liangshan experiences distinct dry and wet seasons, rather than clear-cut four seasons, and receives an average annual rainfall of 995.5 mm, mainly between May and September. The dry-hot valleys of the Jinsha River, receiving about 600 mm of annual rainfall, are characterized by hot, arid conditions, leading to a fragile ecosystem and frequent natural disasters. Rainfall is a triggering factor that causes landslides, especially in the regions where landslides often occur after consecutive days of heavy rainfall (Doan et al., 2024). Hydrologically, the prefecture is abundant in rivers, encompassing three major water systems: the Jinsha, Yalong, and Dadu Rivers, which further divide into twelve key watersheds such as the Litang, Anning, Meigu, and Minjiang Rivers, as shown in Figure 1C.
The region is prone to several geological hazards, including landslides, debris flows, collapses, and ground subsidence. As of the end of 2021, there were 4,016 recorded geological disasters, accounting for about 13.4% of Sichuan’s total, with landslides and debris flows being the most common. These disasters primarily consist of small to medium-sized soil landslides, rock collapses, and channel-type debris flows.
3 Data and methodology
3.1 Data
Landslide investigation is the first step of vulnerability analysis and the necessary condition of modeling. The data of geological disaster catalog in this paper are from geological disaster risk survey in Liangshan Prefecture, Sichuan Province.
An evaluation factor is a fundamental metric reflecting specific characteristics of the subject under evaluation. A comprehensive collection of such factors forms the evaluation factor system, which is intrinsically linked to the evaluation object. In the context of susceptibility assessment, the construction of this system is paramount. However, developing a model that encompasses all geological environmental factors for susceptibility evaluation is impractical. This limitation arises partly cause certain factor parameters may be challenging to acquire, and the presence of numerous evaluation parameters often leads to complex interdependencies and interactions. Therefore, judicious selection of dominant reference factors, which are both stable and quantifiable, becomes crucial in constructing an effective evaluation factor system. The foundational data sources for these factors are delineated in Table 1.
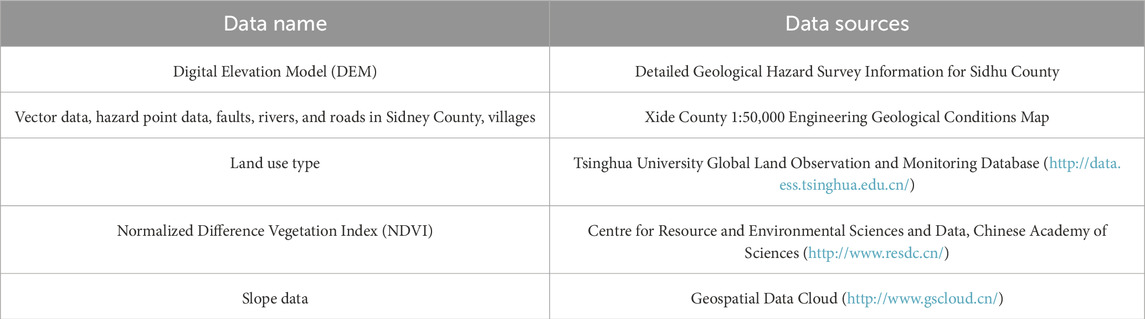
Table 1. Sources of basic data.
In this study, a comprehensive assessment of geological hazards in Liangshan Prefecture was conducted, informed by extensive literature review and analysis of the region’s specific conditions. Initially, 13 influencing factors for landslides were selected, including elevation, slope, aspect, slope position, curvature, proximity to roads, water systems, and faults, the Normalized Vegetation Index (NDVI), Terrain Wetness Index (TWI), stratigraphy, rock groups, and land use types. For debris flows, 11 factors were identified, such as slide density, average slope, terrain relief, vertical drop, land use type, NDVI, engineering geological rock groups, distance from faults and roads, average annual rainfall, and river network density. Lastly, 12 influencing factors were considered for collapses, encompassing elevation, slope, aspect, curvature, distance from faults and water systems, NDVI, engineering rock formations, rainfall, earthquakes, and human engineering activities.
A multicollinearity test was applied to these factors to assess the collinearity among them. The results, indicated by the Variance Inflation Coefficient (VIF), showed that all factors for landslides, debris flows, and collapses had a VIF less than 10, suggesting no significant collinearity and affirming their independence. The Relief algorithm was then used to analyse the contribution of these factors to landslides, collapses, and debris flows, with the results presented in Table 2. It was found that the contributions of curvature, distance from water systems, and engineering geological rock groups in landslide factors were negligible, as were the contributions of average slope and land use type in debris flow factors, and curvature, average annual rainfall, and NDVI in collapse factors.
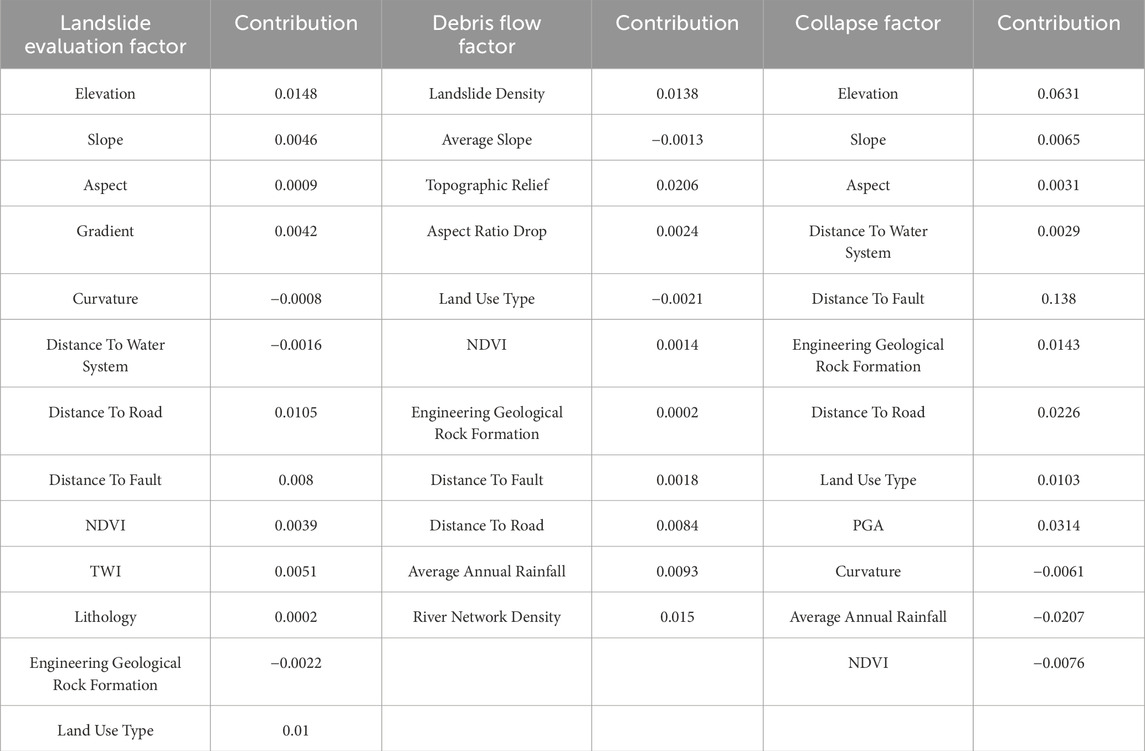
Table 2. Contribution of landslide, landslide and debris flow impact factors.
After excluding these less influential factors, an optimal set of factors was established for evaluating the susceptibility of landslides, collapses, and debris flows. These factors were then imported into ArcGIS software for reclassification, converting them into 100 m×100 m raster layers. This process facilitated the production of grading maps for each evaluation factor, as detailed in Figures 2–4. This methodological approach provides a robust framework for assessing geological hazard susceptibility in Liangshan Prefecture.
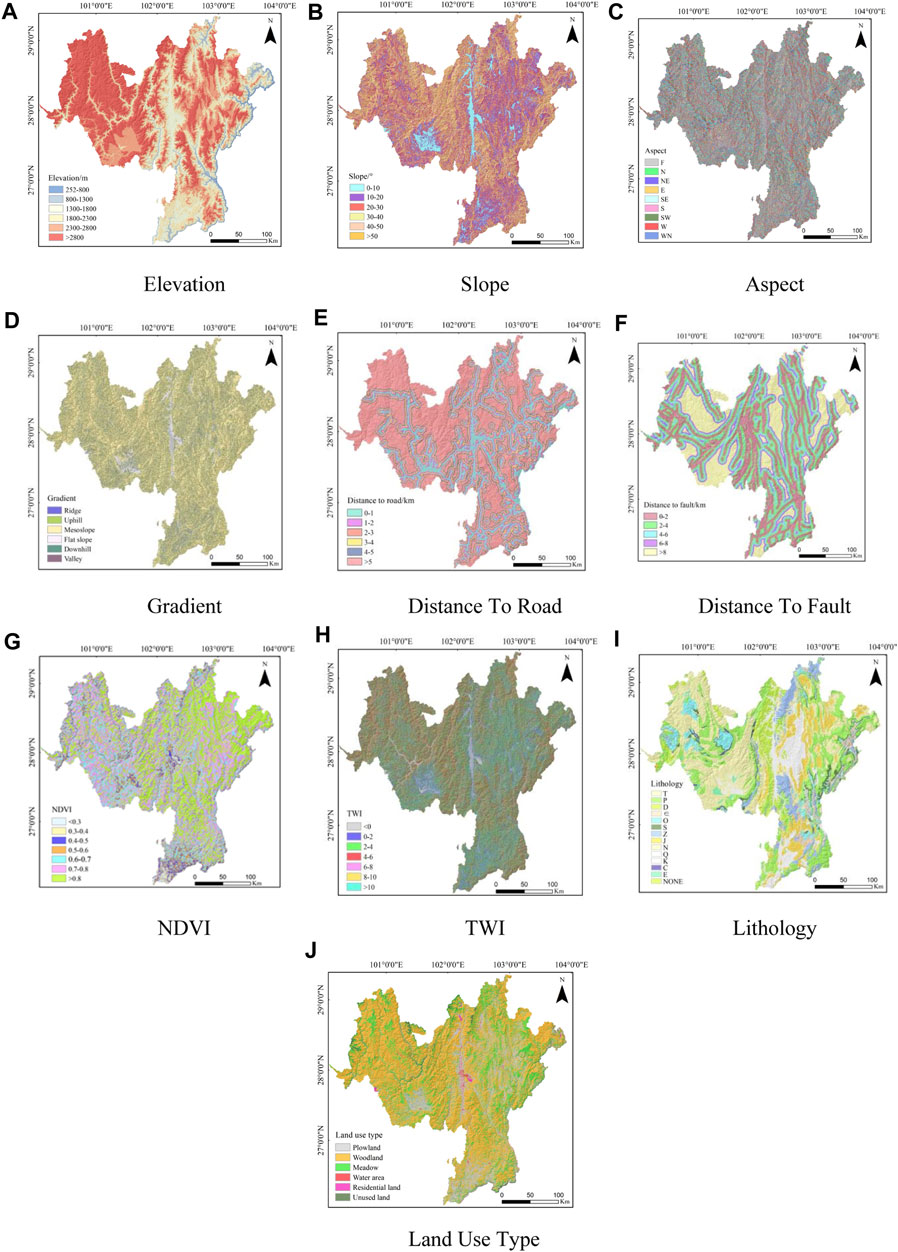
Figure 2. Reclassification map of landslide evaluation factors. (A) Elevation; (B) Slope; (C) Aspect; (D) Gradient; (E) Distance to road; (F) Distance to fault; (G) NDVI; (H) TWI; (I) Lithology; (J) Land use type.
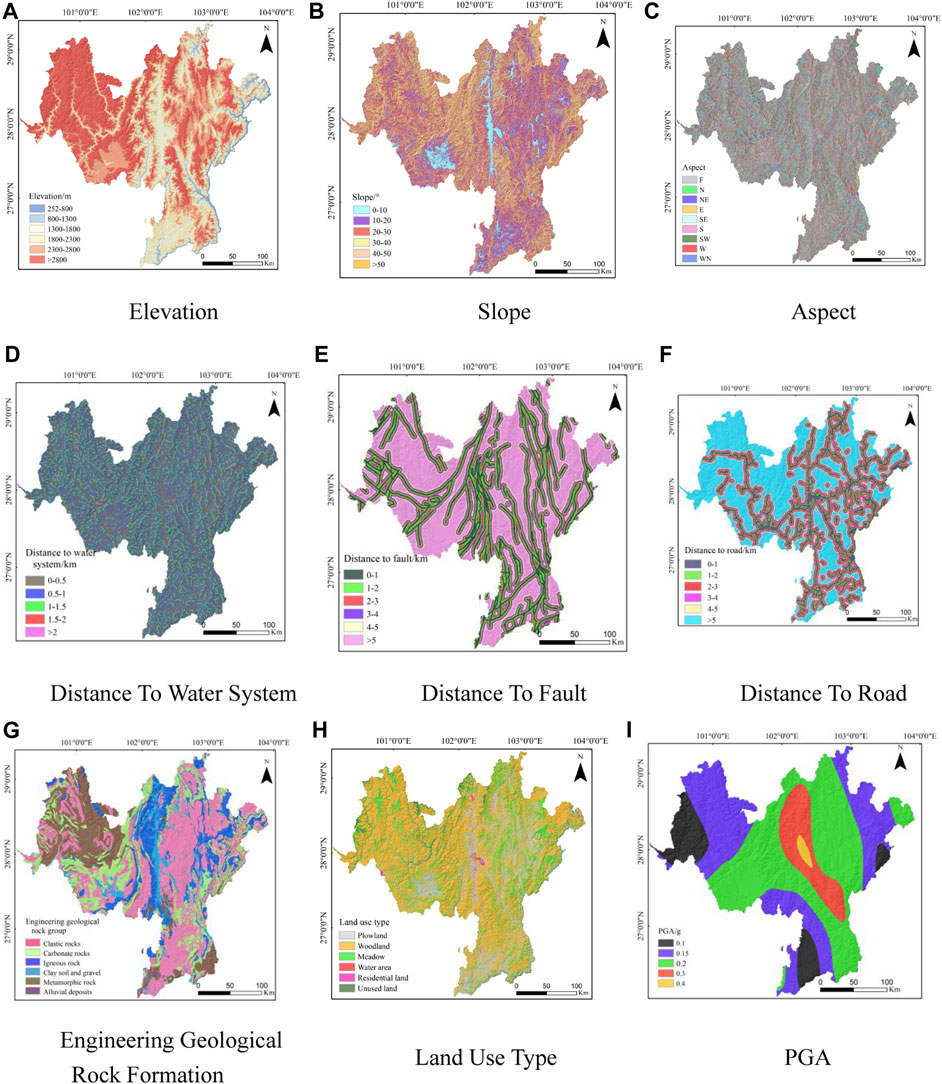
Figure 3. Reclassification map of debris flow factor. (A) Elevation; (B) Slope; (C) Aspect; (D) Distance to water system; (E) Distance to fault; (F) Distance to road; (G) Engineering geological rock formation;(H) Land use type; (I) PGA.
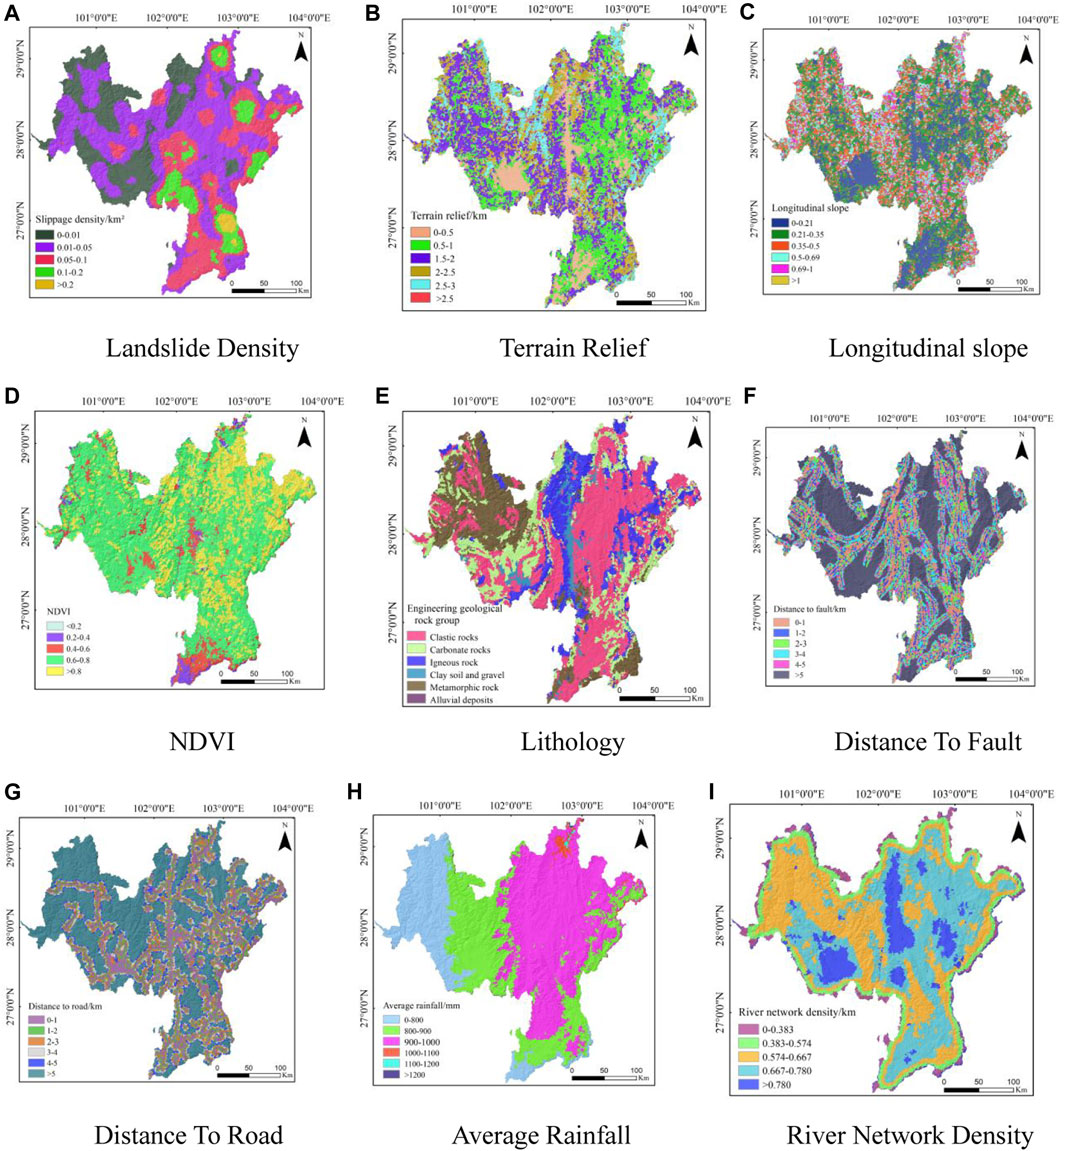
Figure 4. Reclassification map of collapse factor. (A) Landslide density; (B) Terrain relief; (C) Longitudinal slope; (D) NDVI; (E) Lithology; (F) Distance to fault; (G) Distance to road; (H) Average rainfall; (I) River network density.
3.2 Methodology
This study is divided into three steps. First of all, based on the geological disaster database, 10 environmental factors located in the study area are preferentially selected and factor correlation test is carried out. Then, different model evaluation methods are used: the Information Value model, the Evidence Weight model, the Logistic Regression model, and both the Evidence Weight-Logistic Regression and the Information Value-Logistic Regression coupled models. Finally, the evaluation results of each model are evaluated and compared. Figure 5 shows the flow chart of the research method in this paper.
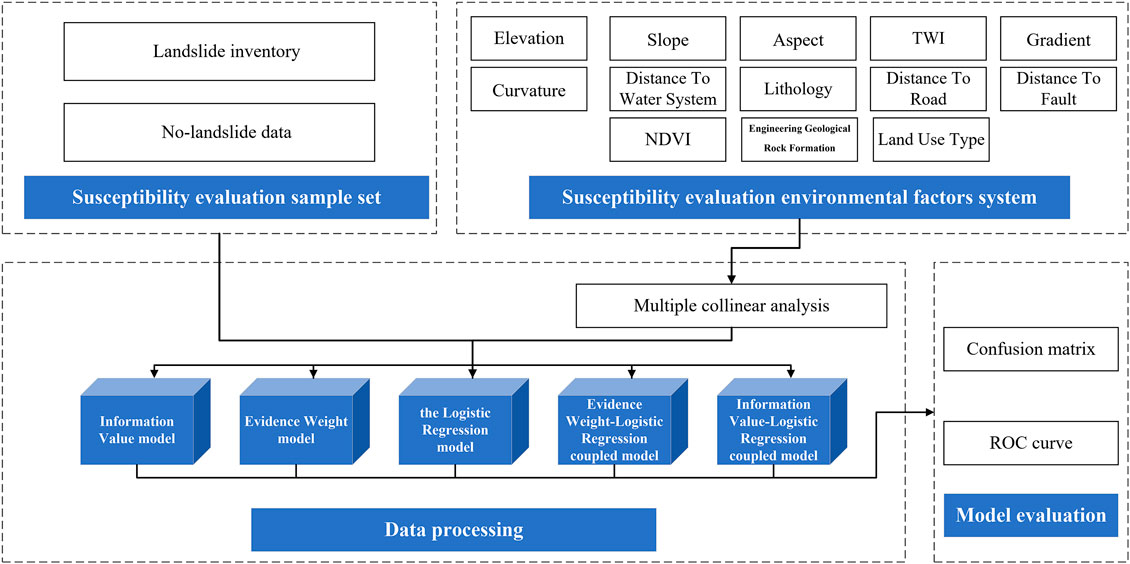
Figure 5. The flow chart of the research method in this paper.
3.2.1 Information value method
Information Value model is a statistical prediction method based on information theory, the Information Value model needs to combine various landslide factors to calculate the Information Value under each grading of each landslide influencing factor, in which the larger the Information Value is, the higher the susceptibility to landslides under the grading of the influencing factor is (Wang et al., 2014). The formula for calculating the informativeness value is given in the following equation:
Where: Ii denotes the integrated information quantity value of a certain impact factor, Ni is the number of landslides in the study area under a certain grading of the impact factor, N is the total number of landslides, Si is the graded area under a certain grading of the impact factor, and S is the total area of the study area.
3.2.2 Evidence weight
Evidence model was initially applied to the medical field, and was applied to the evaluation of mineral resources in the late 1980s, and was later introduced to landslide hazard evaluation. It is a vulnerability evaluation model based on Bayes’ theorem, in which there are two assumptions: the first assumption is that each evaluation factor is independent of each other, and the second assumption is that each evaluation factor will not change in a relatively long period of time (Xu et al., 2013). The formula for calculating the specific weight of evidence is shown in the following equation:
Where:
3.2.3 Logistic regression
The logistic regression model is a particularly classical model for statistical analysis, which is mainly applicable to the case where the dependent variable is a categorical variable, and for landslides there are only two cases, occurrence and non-occurrence, so binary logistic regression is generally used to analyse the relationship between the evaluation factor and the dependent variable. The model has fewer requirements for the independent variable, whether it is a discrete variable, a continuous variable, or both, regardless of whether it obeys a normal distribution or not, it can be evaluated as an evaluation factor (Dai et al., 2001). The specific calculation is shown in the following equation.
Where: β0 is a constant term; β1, β2 … … βn are the values of logistic regression coefficients of each influencing factor; χi denotes each influencing factor; Z is the weighted sum of all the influencing factors; and P denotes the probability of the occurrence of landslides.
3.2.4 Weight of evidence and logistic regression coupling model
In landslide susceptibility evaluation, there’s been a pivotal shift from the exclusive use of single models, which often come with inherent limitations, to the adoption of more robust coupled models. Traditional models like the weight-of-evidence model, while popular, did not fully account for the intricate interactions between various influencing factors. To overcome these limitations, the development of coupled models has been initiated, merging the strengths of multiple distinct methodologies into a single, unified approach. This amalgamation not only addresses the shortcomings of individual models but also combines their diverse advantages, leading to more accurate and comprehensive evaluation outcomes. A prime example of this is the coupling of logistic regression with the weight-of-evidence model. The logistic regression model, known for its effectiveness in categorizing and evaluating variables against landslide data, is particularly adept at handling inter-factor interactions. Its integration with the weight-of-evidence model significantly alleviates the latter’s limitations, especially in dealing with factor interdependencies. This results in a substantial enhancement in the predictive accuracy and reliability of landslide susceptibility assessments, marking a significant advancement in the field of geological hazard analysis.
3.2.5 Application of information and logistic regression coupling model
The concept of a coupled model, which merges multiple individual models into a single analytical framework, has become increasingly significant in the field of landslide susceptibility evaluation. This innovative approach harnesses the collective strengths of various model paradigms, thus overcoming the limitations inherent in using single-model approaches. For instance, while the logistic regression model is adept at classifying variables and offering a comprehensive evaluation based on landslide data, it lacks the capability to assess the individual contributions of specific factors to landslides. Conversely, methods like the information quantity model are focused on evaluating the impact of each factor but may neglect their interrelationships. By integrating these distinct methodologies, the coupled model approach effectively balances the weaknesses of each model, resulting in a more holistic and nuanced analysis. This integration not only facilitates a detailed classification of variables and a comprehensive evaluation but also ensures a meticulous assessment of the contribution of each factor, leading to more accurate and insightful landslide susceptibility evaluations.
4 Results
4.1 Landslide susceptibility evaluation of five models
The assessment of landslide susceptibility using the information quantity model is based on the application of Formula 1 to determine the information value associated with each category of contributing factors. Notably, the information values associated with the altitude and land use classifications are relatively more substantial, suggesting a pronounced influence of these factors on landslide genesis. Conversely, a low information value for formation lithology implies a low contribution to landslide occurrence. This conclusion is consistent with the values of the contributing factors detailed in the previous analysis. The quantified information for each factor is then integrated into ArcGIS software. The application of a weighted sum algorithm facilitates the merging of the information values and the subsequent overlaying of layers, culminating in the derivation of the landslide susceptibility index map (Figure 6A).
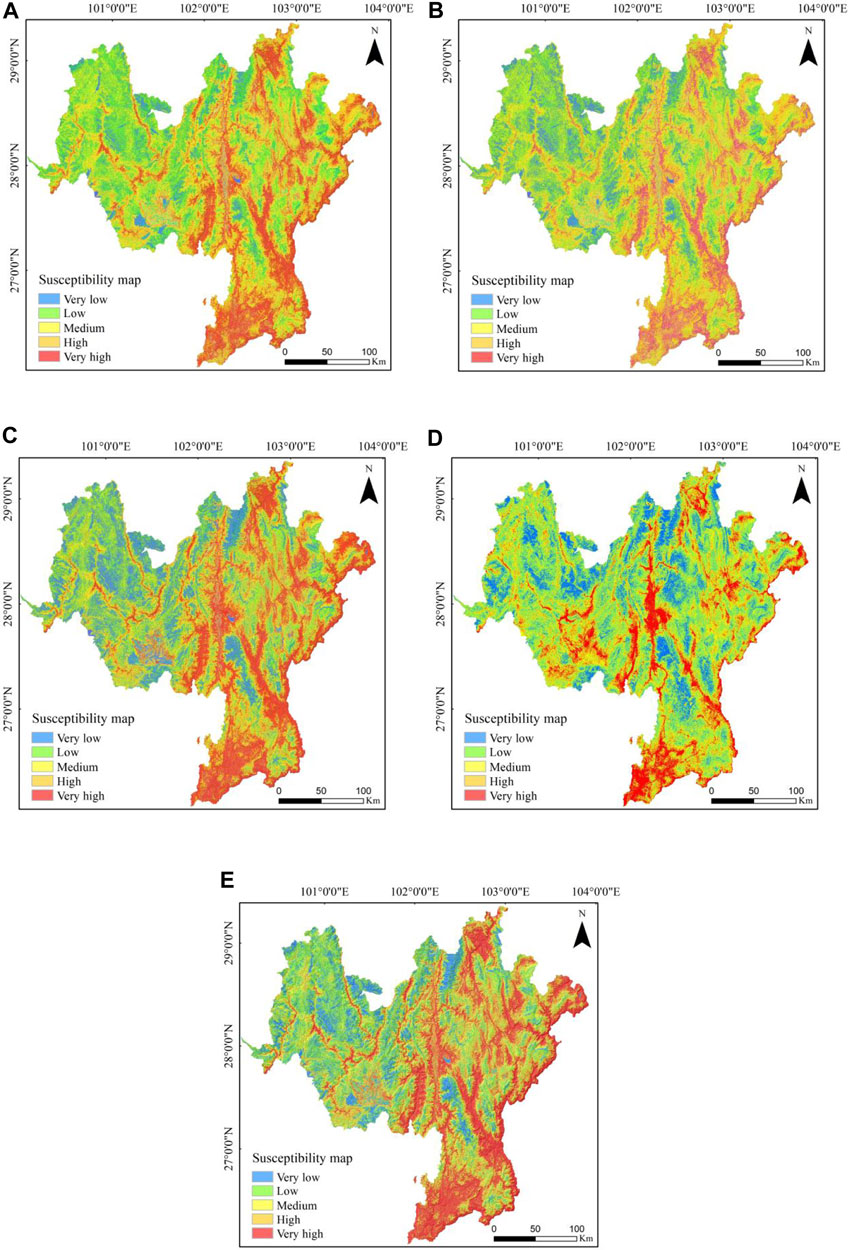
Figure 6. Landslide susceptibility assessment map. (A) Information Value model; (B) Evidence Weight model; (C) Logistic Regression model; (D) Evidence Weight and Logistic Regression Coupled Modelling; (E) Information Value and Logistic Regression Coupled Modelling.
Susceptibility assessment using the evidence weight model in landslide analysis is performed by calculating the evidence weight (Wf) of each factor rating as shown in Eqs 2–4. The Wf value indicates the effect of a factor on landslide occurrence, with a negative value indicating an inhibitory effect on landslide formation and a positive value indicating a facilitatory role. Notably, factors such as elevation and land use type have higher evidence weights, suggesting that they contribute significantly to landslide formation. In practice, these Evidence Weight values for each factor rating are entered into ArcGIS software. Using a weighted sum function, the Evidence Weights are multiplied by their corresponding layers in an overlay process, resulting in a landslide susceptibility index map. This map acts as both a visual and analytical tool, showing areas of varying landslide susceptibility and providing a comprehensive, data-driven understanding of potential landslide risk based on the combined effects of various influencing factors (Figure 6B).
In the logistic regression model of this study, a balanced ratio of non-slip points to landslide points (1:1) is used to improve the accuracy of the model. A methodical approach is adopted for the sampling of slip points, in which an area extending two hundred metres beyond the area of influence of geological hazards in Liangshan Prefecture is defined. Within this defined area, samples are randomly selected to ensure a minimum distance of 200 m between each slip point. In this model, the independent variables are the influencing factors, while the dependent variable is the occurrence of landslides, coded as 1 for landslide points and 0 for non-slide points. The probability map of landslides is then generated using Eqs 5, 6 (Figure 6C).
The study also introduces the Evidence Weight Logistic Regression Coupled Model, which incorporates the outputs of Eqs 2–4 as independent variables in SPSS software to determine the β values. These values are then utilised in ArcGIS software through Eqs 5, 6 to produce a probability map showing the occurrence of landslides in Liangshan Prefecture (Qian et al., 2023). Similarly, the information value logistic regression coupled model inputs the output of Eq. 1 as an independent variable into SPSS software to obtain β-values. These are then used in ArcGIS to generate a landslide occurrence probability map for Liangshan (Hu et al., 2023) (Figure 6D).
The natural discontinuity method is used to categorise landslide susceptibility, dividing the area into five different zones: very low, low, medium, high and very high susceptibility. This classification results in the production of landslide susceptibility assessment maps for each of the five models. The very high and high susceptibility zones are mainly located in critical areas such as the southern part of the Heishui River rupture zone, the Zemu River rupture zone, the Jinghe River rupture zone, the Lujujiang River rupture zone, the Hanyuan-Ganluo rupture zone, the areas surrounding the Ebian-Jinyang rupture zone, the vicinity of National Highway 108, and the southern and central regions of Huili County (Figure 6E).
4.2 Collapse susceptibility evaluation of five models
Following the calculation of Eq. 1, the resulting information value was imported into ArcGIS software where it was integrated using the weighted sum function. This function was used to multiply the Information Value by the layer overlay, resulting in the generation of a collapse susceptibility index map based on the Information Value model. At the same time, the evidence weights for each factor rating were also entered into ArcGIS and the weighted sum function was again used to merge these weights with the layer overlay, producing a second collapse susceptibility index map. In addition, Eqs 5, 6 were used to develop a collapse probability map based on the logistic regression model. The outputs from Eqs 2–4 were entered as independent variables into SPSS software to calculate the β value, which was then used in ArcGIS alongside Eqs 5, 6 to produce a collapse occurrence probability map. This map was informed by the evidence weight logistic regression coupled model. In addition, these results were also used as independent variables in SPSS to derive another set of β-values, which were processed with Eqs 5, 6 in ArcGIS to generate a collapse occurrence probability map based on the coupled Information Value-Logistic Regression model, thus providing a comprehensive and multi-faceted approach to assessing collapse vulnerability.
These probabilities were then classified into five categories using the natural discontinuity method: very low susceptibility, low susceptibility, medium susceptibility, high susceptibility and very high susceptibility. This classification made it possible to produce collapse susceptibility rating maps for the five models, as shown in Figure 7. The very high and high susceptibility areas were mainly located in the southern and central parts of Haili County, central and eastern Leibo County, central Ganluo County, the border area between Yanyuan County and Dechang County in Xichang City, around the National Highway 108, the Zemu River fault zone, and along the Jinsha River on the eastern and southern borders of Liangshan Prefecture. This comprehensive approach provides a detailed and nuanced understanding of collapse-prone areas, supporting effective geohazard management and planning (Figure 7).
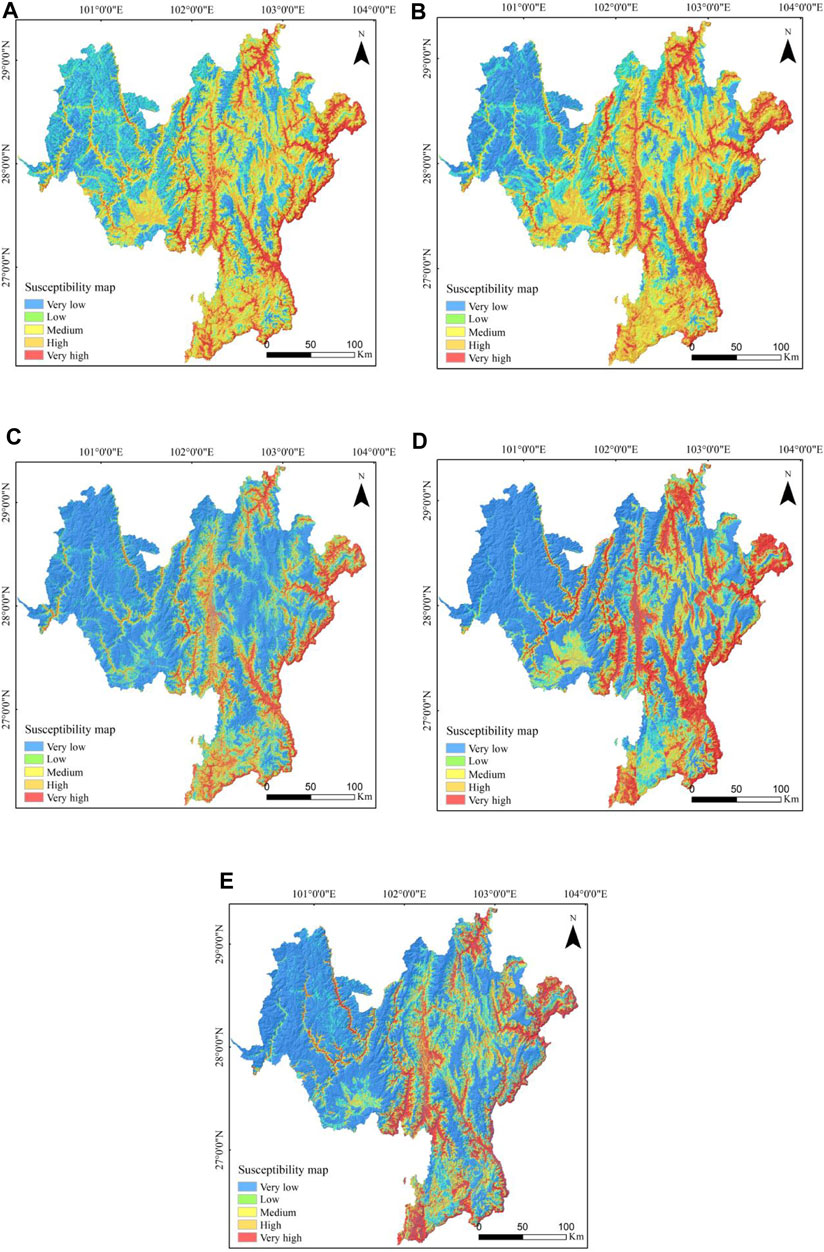
Figure 7. Collapse susceptibility assessment map. (A) Information Value model; (B) Evidence Weight model; (C) Logistic Regression model; (D) Evidence Weight and Logistic Regression Coupled Modelling; (E) Information Value and Logistic Regression Coupled Modelling.
4.3 Debris flow susceptibility evaluation of five models
After calculating the Information Value for each factor’s rating, this data was imported into ArcGIS software. Using the weighted sum function, the Information Value was combined with the layer overlay to produce a mudflow susceptibility index map according to the Information Value model. Similarly, the evidence weight for each factor rating was added to ArcGIS, where the weighted sum function was used to merge the evidence weight with the layer overlay, resulting in an additional mudslide susceptibility index map. In addition, a mudslide probability map was derived using the logistic regression model according to Eqs 5, 6. The outputs from Eqs 2–4 were used as independent variables in SPSS software to calculate the β value. This β-value was then used in ArcGIS in conjunction with Eqs 5, 6 to produce a mudflow probability map based on the evidence weight logistic regression coupled model. In addition, the output of Eq. 1 was entered into SPSS software as an independent variable to obtain another β-value, which, when processed using Eqs 5, 6 in ArcGIS, facilitated the generation of a mudslide occurrence probability map using the Information Value-Logistic Regression coupled model, thus providing a comprehensive approach to assessing mudslide susceptibility.
Utilizing the natural discontinuity method, these probabilities were classified into five categories: very low susceptibility zone, low susceptibility zone, medium susceptibility zone, high susceptibility zone, and very high susceptibility zone. This classification led to the final development of mudslide susceptibility evaluation maps for each of the five models, as illustrated in Figure 8. Notably, the zones of very high and high susceptibility to mudslides were predominantly located in central Zhaoguo County, central Haili County, central Ganluo County, the Zemuhe Fracture Zone, and the areas surrounding the 108 National Highway, providing crucial insights for targeted mitigation and planning in these high-risk areas (Figure 8).
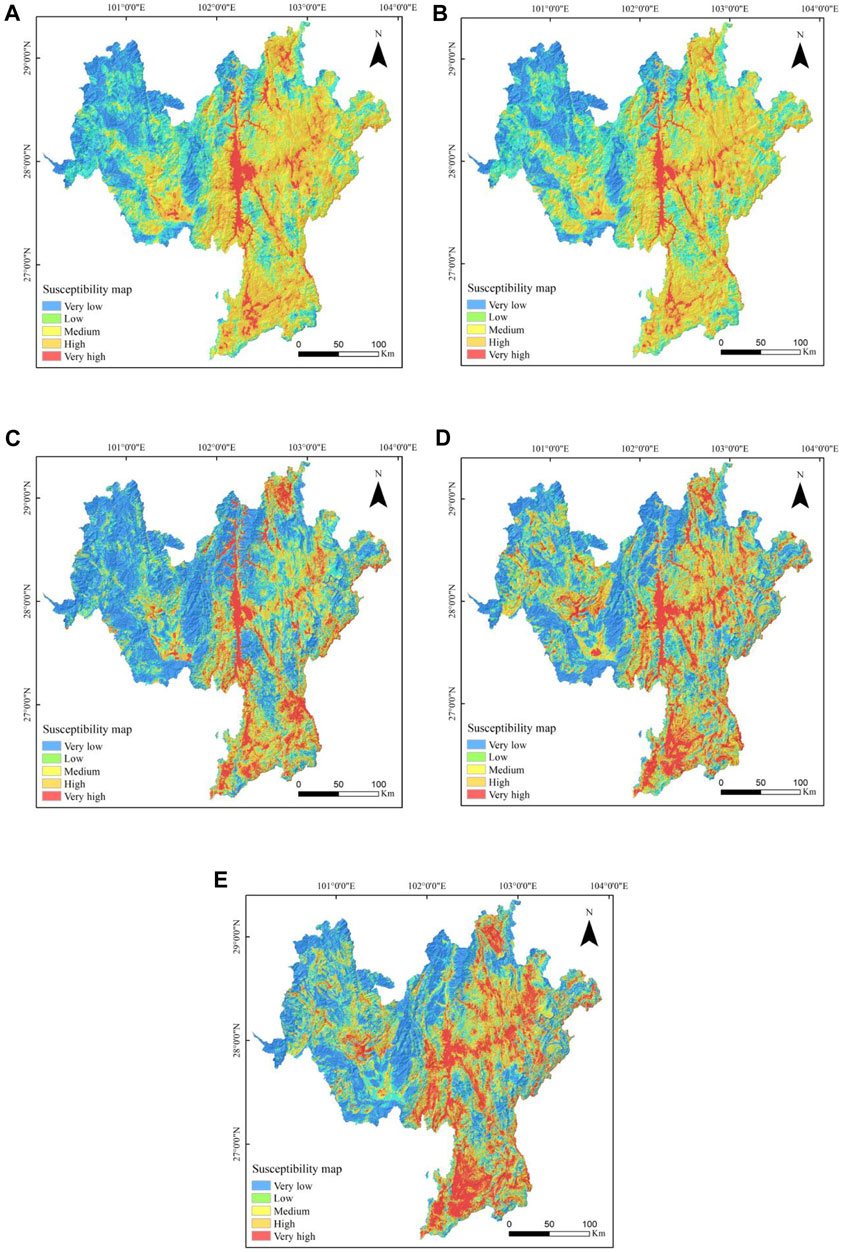
Figure 8. Debris flow susceptibility assessment map. (A) Information Value model; (B) Evidence Weight model; (C) Logistic Regression model; (D) Evidence Weight and Logistic Regression Coupled Modelling; (E) Information Value and Logistic Regression Coupled Modelling.
5 Discussion
5.1 Confusion matrix verification
The confusion matrix, often referred to as the error matrix, provides a clear and straightforward method for evaluating the accuracy of susceptibility models. Its basic purpose is to categorise and compare predicted samples with actual samples to form a matrix. In this study, the models used are all binary classification models. The confusion matrix for such models consists of four primary indicators: True Positives (TP), which are the number of positive samples correctly identified; False Positives (FP), which are the number of positive samples incorrectly classified; True Negatives (TN), which are the number of negative samples correctly classified; and False Negatives (FN), which are negative samples incorrectly classified. Together, these indicators form the basis for assessing the accuracy of the model. The accuracy calculation formula is derived from these four indicators and is essential in assessing the overall effectiveness of the model in accurately classifying samples. The accuracy is calculated with Eq. 7.
The evaluation of the effectiveness of the five models in assessing the susceptibility of landslides, collapses and debris flows was determined by calculating confusion matrices. As shown in Table 3, the accuracy rates for the Information Content and Evidence Weight models in assessing landslide susceptibility are relatively low at 57.1% and 56.8% respectively. This suggests that these models have limited predictive power. In contrast, the logistic regression, information content-logistic regression and evidence weight-logistic regression models have significantly higher accuracy rates, all above 70%. In particular, the coupled information quantity logistic regression and evidence weight logistic regression models achieve the highest accuracy of 78.3%, indicating strong predictive performance.

Table 3. Confusion matrix validation results.
In the context of debris flow susceptibility assessment, all five models show accuracy rates above 75%. The information volume logistic regression model stands out with the highest accuracy of 79%. Similarly, when assessing collapse susceptibility, the accuracy rates of all five models exceed 75%, with the information quantity-logistic regression coupled model achieving the highest accuracy at 84.5%. These results highlight the effectiveness of the coupled models, particularly the information quantity-logistic regression coupled model, in providing more accurate susceptibility assessments for these geological hazards.
5.2 ROC curve verification
The Receiver Operating Characteristic (ROC) curve is used as a tool to assess the accuracy of each model’s scores, where the AUC (Area Under the Curve) value, which ranges from 0 to 1, represents the area under the ROC curve. Higher AUC values indicate greater accuracy in the model’s scoring results.
As shown in Figure 9, the ROC curves for the landslide susceptibility scores of five different models show different levels of accuracy. The Information Value model achieves an AUC of 0.797, while the Evidence Weight model is close behind with an AUC of 0.795. The logistic regression model shows a higher accuracy with an AUC of 0.846. Among the coupled models, the Evidence Weight-logistic regression model achieves an AUC of 0.862, and the Information Weight-logistic regression coupled model comes out on top with an AUC of 0.863. These results show that the coupled models, which combine different analytical approaches, have superior evaluation performance. They show improved accuracy in landslide susceptibility assessment compared to the individual models, underlining the effectiveness of integrating multiple methods in geological hazard assessment (Figure 9).
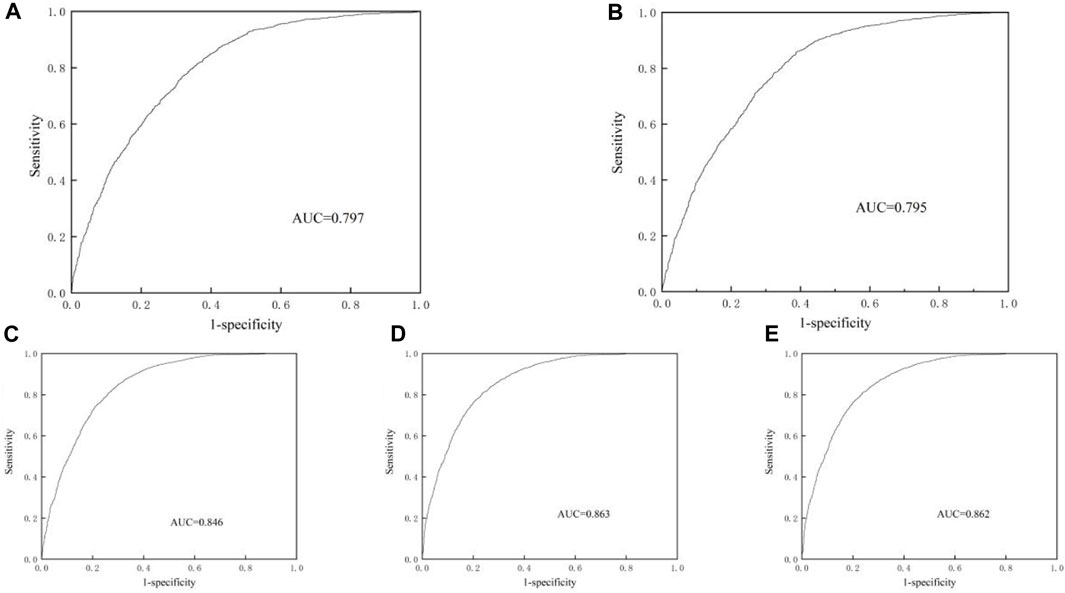
Figure 9. Landslide susceptibility modelling ROC plot. (A) Information Value model; (B) Evidence Weight model; (C) Logistic Regression model; (D) Evidence Weight and Logistic Regression Coupled Modelling; (E) Information Value and Logistic Regression Coupled Modelling.
As shown in Figure 10, the ROC curves for the five collapse susceptibility models show that all models have AUC (area under the curve) values greater than 0.85, indicating a high level of accuracy. Specifically, the logistic regression model achieves an AUC value of 0.926, while the Evidence Weight-logistic regression coupled model and the Information Value-logistic regression model have AUC values of 0.924 and 0.929 respectively. The Evidence Weight model has an AUC of 0.901 and the Information Value model has an AUC of 0.896.
Among these, the logistic regression, Evidence Weight-logistic regression coupled and Information Value-logistic regression coupled models stand out for their higher accuracy in assessing collapse susceptibility. This indicates that these models, especially the coupled ones, are well suited to assess the susceptibility to collapse disasters in the study area. Their higher AUC values reflect a more accurate and reliable prediction capability, making them the preferred choice for collapse hazard assessment in this specific geographical context (Figure 10).
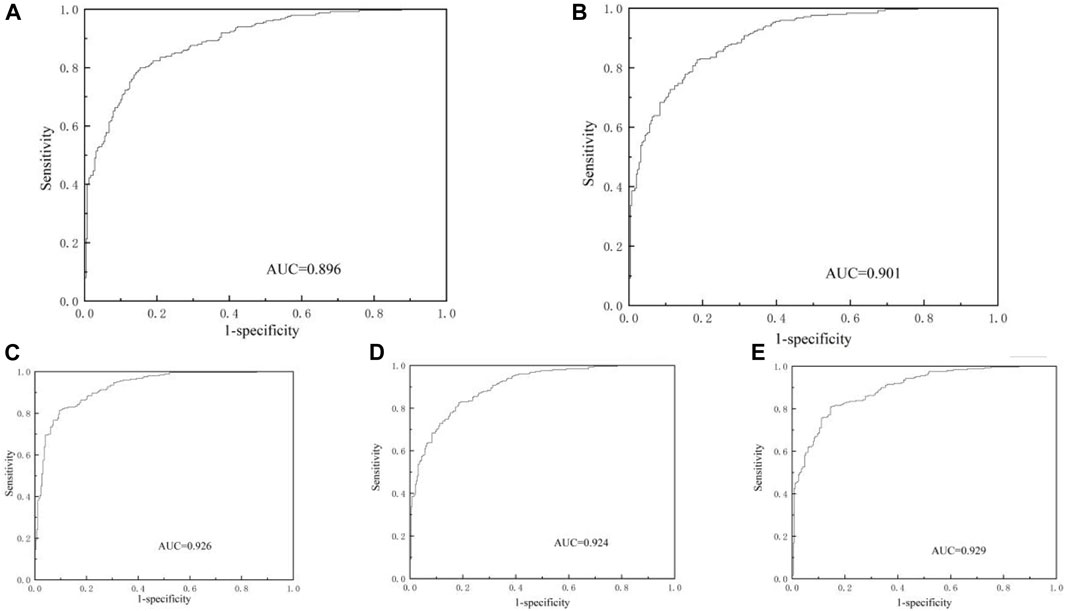
Figure 10. Collapse susceptibility modelling ROC plot. (A) Information Value model; (B) Evidence Weight model; (C) Logistic Regression model; (D) Evidence Weight and Logistic Regression Coupled Modelling; (E) Information Value and Logistic Regression Coupled Modelling.
As shown in Figure 11, the Receiver Operating Characteristic (ROC) curves for the five debris flow susceptibility models indicate that each model has an AUC (Area Under the Curve) value greater than 0.8. This indicates a commendable level of accuracy for all models in predicting debris flow susceptibility. Of these models, the logistic regression model stands out as having the highest AUC value at 0.879. This high value suggests that the logistic regression model is the most accurate and effective of the five in assessing debris flow susceptibility. Its superior performance highlights the robust predictive ability of the logistic regression model, making it a particularly valuable and reliable tool for debris flow hazard assessment in this study (Figure 11).
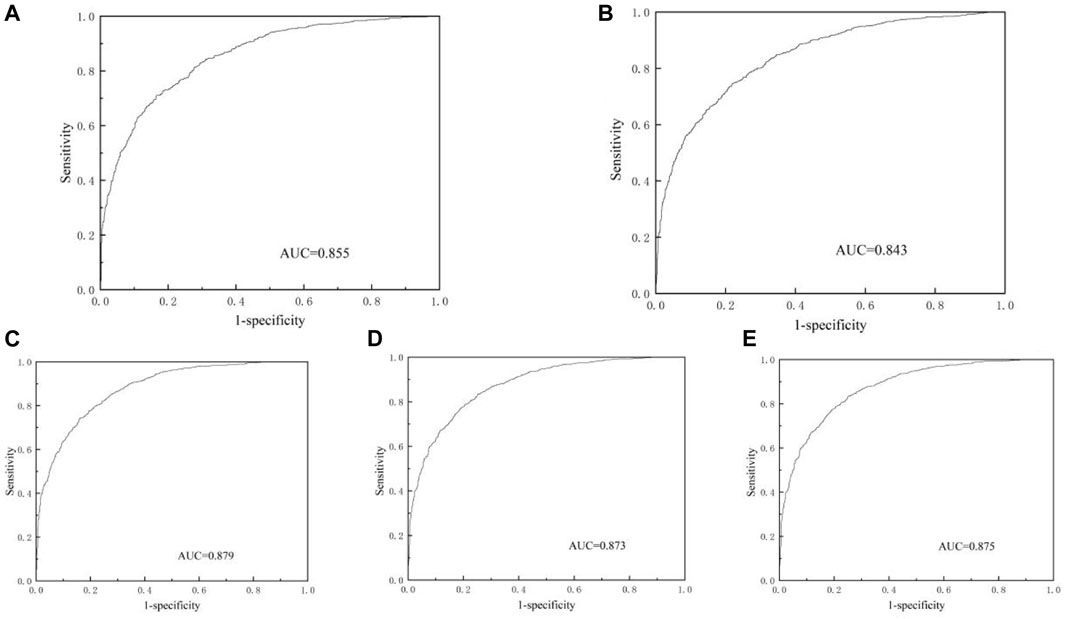
Figure 11. Debris flow susceptibility modelling ROC plot. (A) Information Value model; (B) Evidence Weight model; (C) Logistic Regression model; (D) Evidence Weight and Logistic Regression Coupled Modelling; (E) Information Value and Logistic Regression Coupled Modelling.
5.3 Active faults and inactive faults
In landslide susceptibility evaluation, distinguishing between active and inactive faults is of significant importance. Active faults exhibit distinct mechanical properties compared to inactive faults, such as lower cohesion, lower shear strength, and higher pore water pressure. These characteristics make active faults more prone to triggering landslides. Therefore, accurately identifying and distinguishing active faults from inactive ones is crucial for the precision of landslide susceptibility assessments. Due to the objective limitations of data sources, this study cannot differentiate between active and inactive faults. This limitation may impact the results of the study. The inability to distinguish active faults could lead to conservative estimates of landslide susceptibility, potentially underestimating or overestimating the risk in certain areas. Additionally, using mixed data from active and inactive faults may reduce the accuracy of the evaluation model, thereby affecting the reliability of landslide predictions. To address this issue, future research should focus on obtaining higher precision data on fault activity or employing more advanced methods to identify fault activity. For instance, using high-resolution remote sensing imagery, geophysical exploration techniques, and detailed field surveys can more accurately determine the activity characteristics of faults. Moreover, incorporating big data and machine learning techniques can further enhance the ability to differentiate between active and inactive faults, thus improving the accuracy and reliability of landslide susceptibility evaluations.
6 Conclusion
(1) Focusing on Liangshan Prefecture, Sichuan Province, this study used the Relief algorithm to select optimal sets of evaluation factors for landslides and debris flows identified by covariance diagnosis. A total of 10, 9 and 9 evaluation factors were selected for landslides, collapses and debris flows, respectively. Five evaluation models - the information value model, the evidence weight model, the logistic regression model, the evidence weight-logistic regression coupled model and the information value-logistic regression coupled model - were used to assess the vulnerability of landslides, collapses and debris flows.
(2) A comparative analysis of the landslide susceptibility evaluation results of these models showed that the Evidence Weight-Logistic Regression and its coupled model achieved the highest accuracy rate of 78.3%, indicating a superior predictive effect. ROC curve tests showed that both the evidence weight logistic regression and information value logistic regression models had the highest AUC values, making them the most effective for assessing landslide susceptibility in the region. The areas of very high and high landslide susceptibility were mainly located in the major fault zones (Heishui River, Zemu River, Jinghe River, Lujujiang River, Hanyuan-Ganluo, Ebian-Jinyang) around National Highway 108 and in the southern and central parts of Haili County.
(3) In the evaluation of collapse susceptibility, the information value logistic regression model showed the highest accuracy at 84.5%. The ROC curve accuracy tests indicated that the logistic regression, evidence weight logistic regression coupled and information value logistic regression coupled models had the best performance and were suitable for assessing collapse susceptibility in the region. High collapse susceptibility areas were mainly found in the southern and central areas of Haili County, central and eastern Leibo County, central Ganluo County, along the border between Yanyuan County and Dechang County of Xichang City, near National Highway 108, around the Zemu River fault zone, and along the eastern and southern borders of the Jinsha River in Liangshan Prefecture.
(4) For debris flow susceptibility, the information value-logistic regression coupled model had the highest accuracy at 79%. The ROC curve analysis showed that the logistic regression model had the highest AUC value of 0.879, making it the most suitable model for assessing debris flow susceptibility in the area. Areas with very high and high debris flow susceptibility were mainly located in central Zhaojue County, central Huili County, central Ganluo County, the Zemu River fault zone, and around National Highway 108.
Data availability statement
The original contributions presented in the study are included in the article/Supplementary material, further inquiries can be directed to the corresponding author.
Author contributions
WX: Writing–original draft. YC: Writing–review and editing. JW: Conceptualization, Data curation, Writing–review and editing. LG: Data curation, Writing–review and editing. LZ: Methodology, Software, Writing–review and editing.
Funding
The author(s) declare that financial support was received for the research, authorship, and/or publication of this article. This research was supported by Key R&D Program Projects of Yunnan Province (202403AA080001), Geological Survey Project of China Geological Survey Bureau (DD20221746), National Natural Science Foundation of China (42277136), and Natural Science Research Project of the Colleges and Universities in Anhui Province (KJ2020ZD34).
Conflict of interest
The authors declare that the research was conducted in the absence of any commercial or financial relationships that could be construed as a potential conflict of interest.
Publisher’s note
All claims expressed in this article are solely those of the authors and do not necessarily represent those of their affiliated organizations, or those of the publisher, the editors and the reviewers. Any product that may be evaluated in this article, or claim that may be made by its manufacturer, is not guaranteed or endorsed by the publisher.
References
Arabameri, A., Pradhan, B., Rezaei, K., and Lee, M. (2019). Assessment of landslide susceptibility using statistical-and artificial intelligence-based FR–RF integrated model and multiresolution DEMs. Remote Sens. 11 (9), 999. doi:10.3390/rs11090999
Bui, D. T., Tsangaratos, P., Nguyen, V.-T., Liem, N. V., and Trinh, P. T. (2020). Comparing the prediction performance of a Deep Learning Neural Network model with conventional machine learning models in landslide susceptibility assessment. Catena 188, 104426. doi:10.1016/j.catena.2019.104426
Conforti, M., Borrelli, L., Cofone, G., and Gullà, G. (2023). Exploring performance and robustness of shallow landslide susceptibility modeling at regional scale using different training and testing sets. Environ. Earth Sci. 82, 161. doi:10.1007/s12665-023-10844-z
Dai, F., Lee, C., Li, J., and Xu, Z. (2001). Assessment of landslide susceptibility on the natural terrain of Lantau Island, Hong Kong. Environ. Geol. 40, 381–391. doi:10.1007/s002540000163
Doan, V. L., Nguyen, C. C., and Nguyen, C. T. (2024). Effect of time-variant rainfall on landslide susceptibility: a case study in Quang Ngai Province, Vietnam. Vietnam J. Earth Sci. 46 (2), 203–221. doi:10.15625/2615-9783/20065
Du, G.-L., Zhang, Y.-S., Iqbal, J., Yang, Z. h., and Yao, X. (2017). Landslide susceptibility mapping using an integrated model of information value method and logistic regression in the Bailongjiang watershed, Gansu Province, China. J. Mt. Sci. 14, 249–268. doi:10.1007/s11629-016-4126-9
He, W., Chen, G., Zhao, J., Lin, Y., Qin, B., Yao, W., et al. (2023). Landslide susceptibility evaluation of machine learning based on information volume and frequency ratio: a case study of Weixin County, China. Sensors 23 (5), 2549. doi:10.3390/s23052549
Hongtao, N. (2020). Smart safety early warning model of landslide geological hazard based on BP neural network. Saf. Sci. 123, 104572. doi:10.1016/j.ssci.2019.104572
Huang, J., Zeng, X., Ding, , Yin, Y., and Li, Y. (2022). Landslide susceptibility evaluation using different slope units based on BP neural network. Comput. Intell. Neurosci., 2022. doi:10.1155/2022/9923775
Hu, Y., Zhang, Z., and Lin, S. (2023). Evaluation of landslide susceptibility in ili valley, xinjiang based on the coupling of woe model and logistic regression. J. Eng. Geol. 31 (4), 1350–1363. doi:10.13544/j.cnki.jeg.2023-0128
Ilia, I., and Tsangaratos, P. (2016). Applying weight of evidence method and sensitivity analysis to produce a landslide susceptibility map. Landslides 13, 379–397. doi:10.1007/s10346-015-0576-3
Kadavi, P. R., Lee, C.-W., and Lee, S. (2018). Application of ensemble-based machine learning models to landslide susceptibility mapping. Remote Sens. 10 (8), 1252. doi:10.3390/rs10081252
Komac, M. (2006). A landslide susceptibility model using the analytical hierarchy process method and multivariate statistics in perialpine Slovenia. Geomorphology 74 (1-4), 17–28. doi:10.1016/j.geomorph.2005.07.005
Lee, S., and Choi, J. (2004). Landslide susceptibility mapping using GIS and the weight-of-evidence model. Int. J. Geogr. Inf. Sci. 18 (8), 789–814. doi:10.1080/13658810410001702003
Liu, Y., Zhao, L., Bao, A., Li, J., and Yan, X. (2022). Chinese high resolution satellite data and GIS-based assessment of landslide susceptibility along highway G30 in Guozigou Valley using logistic regression and MaxEnt model. Remote Sens. 14 (15), 3620. doi:10.3390/rs14153620
Lombardo, L., Cama, M., Conoscenti, C., Märker, M., and Rotigliano, E. (2015). Binary logistic regression versus stochastic gradient boosted decision trees in assessing landslide susceptibility for multiple-occurring landslide events: application to the 2009 storm event in Messina (Sicily, Southern Italy). Nat. Hazards 79, 1621–1648. doi:10.1007/s11069-015-1915-3
Luguang, L., Xiangjun, P., Runqiu, H., Zuan, P., and Ling, Z. (2021). Landslide susceptibility assessment in Jiuzhaigou scenic area with GIS based on certainty factor and Logistic regression model. J. Eng. Geol. 29 (2), 526–535. doi:10.13544/j.cnki.jeg.2019-202
Nhu, V.-H., Bui, T. T., My, L. N., Vuong, H., and Duc, H. N. (2022). A new approach based on integration of random subspace and C4.5 decision tree learning method for spatial prediction of shallow landslides. Vietnam J. Earth Sci. 44 (3), 327–342. doi:10.15625/2615-9783/16929
Nie, Z., Lang, Q., Zhang, Y., Zhang, J., Chen, Y., and Pan, Z. (2023). Risk assessment of landslide collapse disasters along national highways based on information quantity and random forest coupling methods: a case study of the G331 national highway. ISPRS Int. J. Geo-Information 12 (12), 493. doi:10.3390/ijgi12120493
Qian, Z., Wang, P., Li, N. A., Juan, W., Ya, X., and Yang, X. (2023). Risk analysis of loess seismic landslides based on an information value-logistic regression coupling mode. China Earthq. Eng. J., 706–715. doi:10.20000/j.1000-0844.20221121003
Sarkar, S., Roy, A. K., and Martha, T. R. (2013). Landslide susceptibility assessment using information value method in parts of the Darjeeling Himalayas. J. Geol. Soc. India 82, 351–362. doi:10.1007/s12594-013-0162-z
Tan, Y., Guo, D., and Xu, B. (2015). A geospatial information quantity model for regional landslide risk assessment. Nat. Hazards 79, 1385–1398. doi:10.1007/s11069-015-1909-1
Tsangaratos, P., Ilia, I., Hong, H., Chen, W., and Xu, C. (2017). Applying Information Theory and GIS-based quantitative methods to produce landslide susceptibility maps in Nancheng County, China. Landslides 14, 1091–1111. doi:10.1007/s10346-016-0769-4
Wang, L. J., Guo, M., Sawada, K., Lin, J., and Zhang, J. (2016). A comparative study of landslide susceptibility maps using logistic regression, frequency ratio, decision tree, weights of evidence and artificial neural network. Geosci. J. 20, 117–136. doi:10.1007/s12303-015-0026-1
Wang, H., Xu, J., Tan, S., and Zhou, J. (2023). Landslide susceptibility evaluation based on a coupled informative–logistic regression model—shuangbai county as an example. Sustainability 15 (16), 12449. doi:10.3390/su151612449
Wang, H., Xu, W., and Xu, R. (2005). Slope stability evaluation using back propagation neural networks. Eng. Geol. 80 (3-4), 302–315. doi:10.1016/j.enggeo.2005.06.005
Wang, J., Yin, K., and Xiao, L. (2014). Landslide susceptibility assessment based on GIS and weighted information value: a case study of Wanzhou district, three gorges reservoir. Chin. J. Rock Mech. Eng. 33 (4), 797–808. doi:10.13722/j.cnki.jrme.2014.04.012
Wu, C.-H., and Chen, S.-C. (2009). Determining landslide susceptibility in Central Taiwan from rainfall and six site factors using the analytical hierarchy process method. Geomorphology 112 (3-4), 190–204. doi:10.1016/j.geomorph.2009.06.002
Wubalem, A., and Meten, M. (2020). Landslide susceptibility mapping using information value and logistic regression models in Goncha Siso Eneses area, northwestern Ethiopia. SN Appl. Sci. 2, 807–819. doi:10.1007/s42452-020-2563-0
Xu, C., Xu, X.-W., and Yu, G.-H. (2013). The Yushu earthquake triggered landslide hazard evaluation based on weight of evidence method. Dizhen Dizhi Seismology Geol. 35 (1), 151–164. doi:10.3969/j.issn.0253-4967.2013.01.01
Keywords: landslide susceptibility zoning, utilizing evidence weight, logistic regression, geological hazards, liangshan prefecture
Citation: Xu W, Cui Y, Wang J, Gong L and Zhu L (2024) Landslide susceptibility zoning with five data models and performance comparison in Liangshan Prefecture, China. Front. Earth Sci. 12:1417671. doi: 10.3389/feart.2024.1417671
Received: 15 April 2024; Accepted: 04 June 2024;
Published: 09 July 2024.
Edited by:
Chong Xu, National Institute of Natural Hazards, Ministry of Emergency Management, ChinaReviewed by:
Trinh Phan Trong, Vietnam Academy of Science and Technology, VietnamMassimo Conforti, National Research Council (CNR), Italy
Zhao Zhou, Xi’an University of Science and Technology, China
Copyright © 2024 Xu, Cui, Wang, Gong and Zhu. This is an open-access article distributed under the terms of the Creative Commons Attribution License (CC BY). The use, distribution or reproduction in other forums is permitted, provided the original author(s) and the copyright owner(s) are credited and that the original publication in this journal is cited, in accordance with accepted academic practice. No use, distribution or reproduction is permitted which does not comply with these terms.
*Correspondence: Yulong Cui, eWxjdWlAYXVzdC5lZHUuY24=