 Lu Kaidong
 Cui Tingting*
- State Key Laboratory of Hydrology-Water Resources and Hydraulic Engineering and Science, Nanjing Hydraulic Research Institute, Nanjing, China
Precipitation and incoming water are the key contributing factors to local flooding events, and analyzing the intra-annual distribution and change characteristics of precipitation and incoming water will be beneficial to the understanding of flooding contributing factors in this region. In this paper, the characteristics of intra-annual distribution of precipitation and incoming water and the synchronization of their changes in the lower reaches of the Yangtze River Basin (LYRB) from 1980 to 2020 are studied using the concentration degree and concentration period as quantitative indicators. The results are as follows: 1) the maximum precipitation occurs earlier in the year, while maximum incoming water occurs with little variation in timing but significant variation in total volume; 2) the concentration degree of both precipitation and incoming water show a slowly decreasing trend. The concentration period of precipitation is slightly advanced, and that of incoming water is significantly delayed; 3) the occurrence time and concentration period of the incoming water peak during 2010–2020 lagged behind that of precipitation, which played a role in suppressing the occurrence of floods in the LYRB. This study can provide a scientific basis for the future supply and demand of water resources in the LYRB for safe use.
1 Introduction
Global climate change is a growing concern for society (Armstrong McKay et al., 2022; Yuan et al., 2023). In recent years, the climate of the Yangtze River basin in China has been warming significantly, with the temperature rising by 0.2°C/10a (Lu et al., 2022). At the same time, precipitation in the lower reaches of the Yangtze River Basin (LYRB) has increased significantly, and most of the areas have experienced the trend of ‘warming and humidification’ with higher temperatures and increased precipitation (Wei et al., 2022; Zhu C. et al., 2023). This will inevitably cause different degrees of spatial and temporal redistribution of water resources and intra-annual allocation changes (Yang H. et al., 2023; Yang P. et al., 2023).
As the most crucial climatic element in the study of climate change and water cycle process (Guo et al., 2020; Wang et al., 2021), changes in precipitation elements have profound impacts on the formation of water resources (Wu et al., 2022), hydrological movement patterns (Chai et al., 2020), the stability of agriculture (Tian et al., 2022) and ecosystem (Bi et al., 2023) at different stages of urbanization development. The increase in precipitation will bring about changes in the intra-annual distribution of rainfall, which will inevitably lead to changes in runoff as a source of precipitation recharge (Jiang et al., 2015; Alemu and Bawoke, 2019; Kim and Kim, 2020; Zhang et al., 2021). Meanwhile, local precipitation and incoming water are the key causative factors affecting the local flooding events (Oppel and Fischer, 2020; Wang et al., 2022; Zhu Y. et al., 2023). Analyzing the characteristics of intra-annual distribution and changes in precipitation and incoming water will be beneficial to the understanding of the flood-causing factors in the region (Zhang et al., 2020; Ren et al., 2021), contribute to the rational development, utilization and allocation of water resources (Gong et al., 2020; Ndione et al., 2020; Li C. et al., 2021), and provide a scientific basis for the safe use of future water supply and demand (Jo et al., 2021; Bashevkin and Mahardja, 2022).
The LYRB is the core area of the Yangtze River Economic Belt, a major strategic region related to the overall development of the country. It is one of the regions in China with the most rapid economic and social development, the densest population and the highest rate of urbanization, and at the same time one of the regions in China that are most frequently affected by floods. Some studies have been done on the intra-annual changes of precipitation and incoming water in the LYRB (Duan et al., 2016; Li Y. et al., 2021; Qian et al., 2022; Sun et al., 2023), for example, Li Y. et al. (2021) found in their study of the precipitation changes in the Yangtze River Basin from 1961 to 2014 that the intra-annual precipitation is mainly concentrated in the summer months and the maximum amount of precipitation is received in June; Qian et al. (2022) found that during the period of 1961–2020, as a result of the increase of precipitation the incoming water in the LYRB also showed an increasing trend. Duan et al. (2016) analyzed the intra-annual distribution characteristics of the incoming water in the LYRB and the results showed that the intra-annual variations of the incoming water in the LYRB were large, and the distribution was uneven, mainly focusing on the months of June-October. This provides a basis for the study of the relationship between precipitation, runoff and water resources in the LYRB. However, the existing studies are basically conducted separately for precipitation or runoff, and there is a lack of research on the synchronization of the intra-annual changes of the two (Lu et al., 2022; Yang et al., 2022; Wu et al., 2023; Yin et al., 2023). Therefore, it is important to study the synchronization of the intra-annual distributional characteristics of precipitation and incoming water in the LYRB, and to explore the response of precipitation and incoming water to changes in flooding vulnerability in the LYRB.
The concentration degree and concentration period are popularly used to calculate the uneven distribution of variables, which are most used in the field of precipitation, i.e., precipitation concentration degree (PCD) and precipitation concentration period (PCP) (Amiri and Gocić, 2021; Darand and Pazhoh, 2022; Liu et al., 2022; Meng et al., 2023; Ashrafi et al., 2024). With the advancement of research, they have also been used on other variables, such as Zhao et al. (2021) applied concentration degree and concentration period to temperature, and explored the uneven distribution of temperature through the two indicators of temperature concentration and temperature concentration period. Zhou et al. (2022) also used concentration degree and concentration period metrics in their analysis of the intra-annual distribution of wind speeds. In present study, it is further extended to the field of incoming water, i.e., incoming water concentration degree (ICD) and incoming water concentration period (ICP).
In this study, the LYRB is taken as the study area, and the PCD, PCP, ICD and ICP are used as quantitative indicators to investigate the characteristics of intra-annual distribution of precipitation and incoming water in the LYRB and the synchronization of their changes. The study will contribute to the rational use of water resources and flood disaster defense in the LYRB, and provide a scientific basis for the safe use of water resources supply and flood disaster response in the future.
2 Materials and methods
2.1 Study area
The study area is the LYRB (29.6°-32.8°N, 115.5°-122.0°E), which is located in the east of China, with a total area of about 117,800 km2, and is the core of the Yangtze River Economic Belt, including the provinces and cities of Jiangsu, Zhejiang, Anhui and Shanghai. The climate type of the study area is subtropical monsoon climate, and the region is mainly influenced by East Asian summer winds in summer and East Asian winter winds in winter (Guo et al., 2024).
The elevation of the LYRB is within the range of -67-1685 m. The Datong hydrographic station is the last main stream runoff control station in the LYRB, and the interval incoming flow of the main stream of the Yangtze River accounts for only about 2-3% (Bian et al., 2021) of the flow at the Datong hydrographic station, so the flow characteristics of the Datong hydrographic station basically represent the overall incoming water characteristics of the river section of the LYRB. The distribution of geographic information, meteorological stations and the location of the Datong hydrographic station in the LYRB is shown in Figure 1.
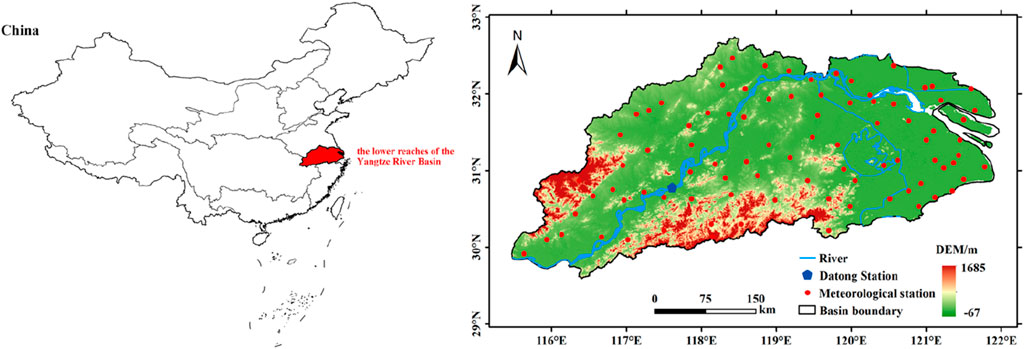
Figure 1. The geographical location and elevation of the LYRB in China.
2.2 Data
In this study, 88 meteorological stations with complete day-by-day precipitation data series from 1980 to 2020 in the LYRB, as compiled by the China Meteorological Administration, are collected. We obtained raster precipitation data with 0.1°×0.1° resolution for the LYRB, spatially interpolated the precipitation data from 88 meteorological stations by the inverse distance-weighted interpolation method, and obtained the surface-averaged precipitation data for the whole LYRB by raster averaging, so as to analyze the characteristics of precipitation changes in the region.
For the upstream incoming water, the daily flow data from 1980 to 2020 at Datong hydrographic station in the LYRB were selected.
2.3 Methodology
(1) Concentration degree and period
Concentration degree and concentration period are used as the concentration index in this study. PCD and ICD defined based on the vector expression of the temporal distribution of precipitation and incoming water during the year, which can effectively describe the non-uniformity of the distribution of precipitation and incoming water over the study period and is widely used. PCP and ICP are also used to determine the interannual variability of precipitation and inflow concentration dates.
Concentration degree and concentration period, the calculation method of this indicator is defined based on the vector principle, which is capable of describing the non-uniform distribution pattern of precipitation and incoming water during the time period, and reflecting the concentration degree and concentration time of the intra-annual distribution of precipitation and incoming water by using the process of precipitation and incoming water (Zhao et al., 2021). It is considered that the value of the variable of each segment under the total amount is a vector, including changes in magnitude and direction, which is expressed as a 360° circle by the inverse tangent function (Amiri and Gocić, 2021; Du et al., 2022; Ashrafi et al., 2024). CP and CP are calculated in Eqs 1, 2.
Where: CD and CP represent concentration degree and concentration period, respectively. n is the total number of days in year i, j is the number of days in year i,
(2) Mann-Kendall test
In time series trend analysis, Mann-Kendall test (M-K) is a non-parametric test recommended by the World Meteorological Organization and has been widely used, initially proposed by Mann and Kendall (Mann, 1945; Kendall, 1948; Zhang et al., 2022). The M-K test does not require the samples to comply with a certain distribution, and is not subject to the interference of a small number of outliers, and is suitable for hydrological, meteorological and other non-normally distributed data (Jiang et al., 2022; Wan et al., 2023). Many scholars have continued to apply the M-K test to analyze the trend and significance of precipitation, runoff, water level, sedimentation, temperature, water quality and other elements of the time series (Hu et al., 2023; Wan et al., 2023; Wang et al., 2023). Therefore, this study used the M-K trend test to analyze the trends of PCD, PCP, ICD and ICP.
Its test statistic variable
(3) Standardized processing
In the synchronization analysis of precipitation and incoming water, it is necessary to eliminate the effect of unit and magnitude differences between precipitation and incoming water because they have different units. Therefore, standardized curves were used to compare the intra-annual distribution of precipitation and incoming water and the characteristics of their synchronization. The standardized curve z is calculated by Eq. 3.
Where
3 Results
3.1 Changes in intra-annual distribution of precipitation
Figure 2 shows the characteristics of the intra-annual (monthly) distribution of precipitation in the LYRB from 1980 to 2020 for the multi-year average and four chronological averages. In terms of the multi-year average precipitation, the intra-annual distribution shows a ‘single-peak’ curve, and the annual precipitation is mainly concentrated in the May-August, with the precipitation in these 4 months accounting for about 54% of the annual precipitation. The amount of precipitation starts to increase from January and reaches the maximum in June, accounting for 16.9% of the annual precipitation, and then starts to decrease to the minimum in December, accounting for only 3% of the annual precipitation. The intra-annual distribution of precipitation by decade shows that intra-annual precipitation is also concentrated in May-August for all decades, with a small weighting of precipitation from October to February. Maximum precipitation occurs in June during the 1990s, 2000s, and 2010–2020, which shows a consistent pattern with the multi-year average, while maximum precipitation occurs in July during the 1980s. summer precipitation varied considerably among the decades, with the 2000s decade showing significantly smaller summer precipitation compared to all other time periods, while the 2010–2020 period showed significantly larger precipitation. Meanwhile, the 1980s and 2010–2020 period show a “single-peak” pattern like the multi-year average, while the 1990s and 2000s show a “double-peak” pattern.
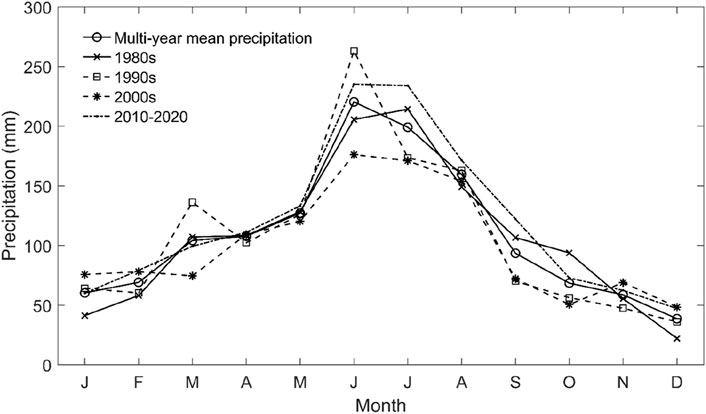
Figure 2. Characteristics of monthly precipitation in the LYRB, 1980–2020.
Figure 3 shows the interannual variation of PCD and PCP in the LYRB. From the 1980–2020 time series changes, the PCD has a large interannual variation, with a maximum value of 0.58 (2011) and a minimum value of 0.19 (2000), the extreme difference reaches 0.39, which is equivalent to 2/3 of the maximum annual PCD. and the PCD has a slow decreasing trend with a linear tendency rate of 0.01/10a (Figure 3A). In terms of the PCP, the maximum value is 196° (1981) and the minimum value is 148° (1992), with a time difference of about 48 days between the two occurrences. From the trend of the PCP from 1980 to 2020, the interannual variation is relatively smooth, but the fluctuation changes are large and show a weak upward trend with a linear tendency rate of 0.25°/10a (Figure 2B).
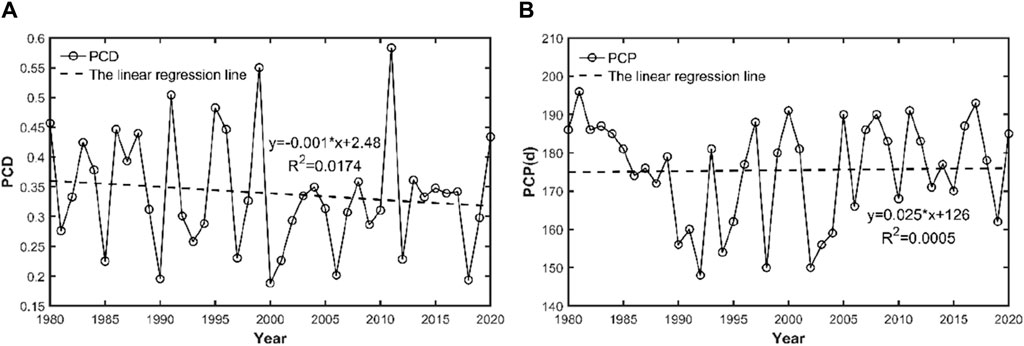
Figure 3. Interannual variations of PCD and PCP in the LYRB.
3.2 Changes in intra-annual distribution of incoming water
Figure 4 shows the intra-annual (monthly) distribution characteristics of incoming water in the LYRB from 1980 to 2020, from which it can be found that the intra-annual distribution characteristics of incoming water in the 1980–2020 multi-year average and the four epochs at the Datong station show an obvious “single-peak type” (Figure 4). In terms of the multi-year average incoming water, the annual incoming water is mainly concentrated in the months of June-September, which accounts for about 50.8% of the annual incoming water, and the incoming water in May and October also accounts for a relatively large proportion, accounting for 9.2% and 8.8% of the annual incoming water, respectively. The incoming water starts to increase in January and reaches its maximum in July, where it accounts for 15.0% of the annual incoming water, and then starts to decrease until December, while its incoming water is relatively stable. From the point of view of the annual distribution of incoming water in each decade, the annual incoming water in each decade is also mainly concentrated in June-September, and the incoming water from October to May of the following year also occupies a certain proportion. This shows a similar pattern to the multi-year average incoming water. In the 2000s, the summer incoming water was significantly smaller compared to all other periods, while in the 1990s, the summer incoming water was significantly larger and the annual incoming water was significantly larger. This indicates that the total amount of incoming water has varied considerably since the different eras, and this instability will make it more difficult to develop and utilize water resources in the LYRB.
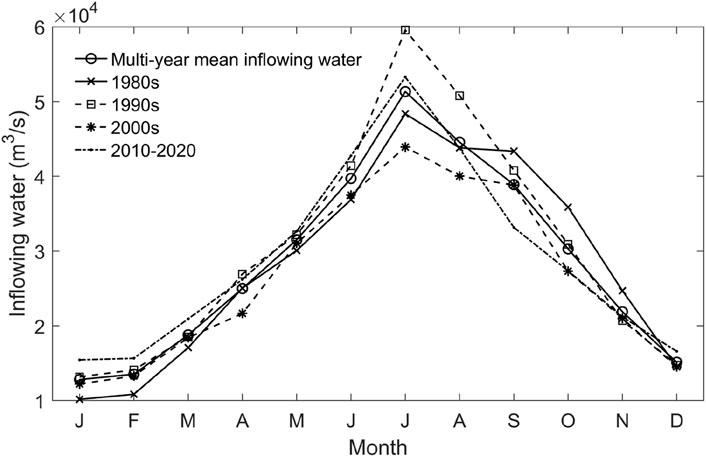
Figure 4. Characteristics of monthly incoming water in the LYRB, 1980–2020.
The ICD and ICP of the incoming water in the LYRB from 1980 to 2020 are shown in Figure 5. From the change of the ICD (Figure 5A), it can be seen that its maximum value is 0.44 (1999), while the minimum value is 0.23 (2001), and the extreme difference between the two amounts to 0.11. Meanwhile, the ICD shows a slow decreasing trend with a linear tendency rate of 0.01/10a. In terms of ICP (Figure 5B), the maximum value of ICP was 228° (2000), while the minimum value was 174° (2006), with a difference of about 54 days. The interannual trend of ICP showed a significant decreasing trend of 5.3°/10a, and the decreasing trend passed the 95% significance test.
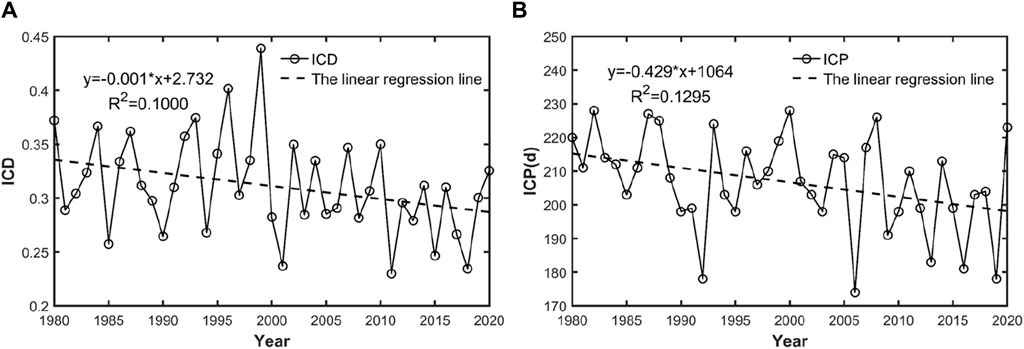
Figure 5. Inter-annual variation of ICD and ICP in the LYRB.
3.3 Synchronization analysis
Figure 6 gives the change curves of PCD, ICD and their PCP, ICP in the LYRB in 1980–2020 after standardization. From Figure 6A, it can be seen that the interannual changes of PCD and ICD during 1980–2002 and 2015–2020 have a good synchronization. The fluctuations and ups and downs of the two correspond well, and the synchronization rate of whether the peaks and valleys of the two correspond to each other during this period can be up to 65%. To some extent, the intra-annual PCD and ICD are basically synchronized during this period, while the inter-annual changes of PCD and ICD are less synchronized during the period 2003–2014. From Figure 6B, it can be seen that the synchronization between PCP and ICP is poor during 1980–1988, and there is a good synchronization between PCP and ICP during 1989–2020. The fluctuations of the two during the period 1989–2020 corresponded well, and the peaks and valleys of the two corresponded to a synchronization rate of up to 75%. Meanwhile, it is also found that the ICP lags behind the PCP between 2010 and 2020, and the “staggered peaks” of precipitation and incoming water also play a certain role in suppressing the occurrence of floods in the LYRB.
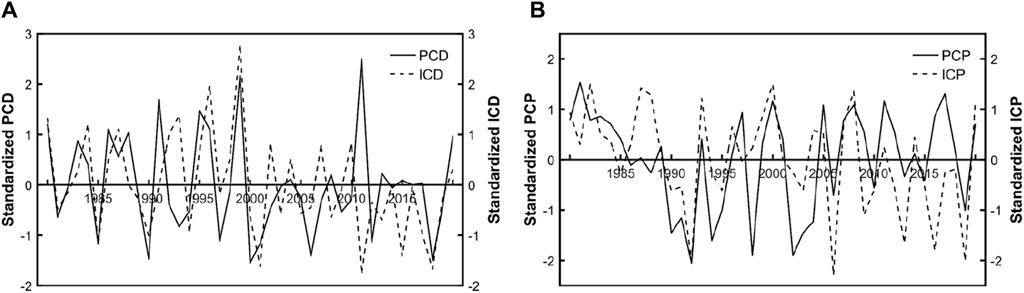
Figure 6. Normalized curve of PCD, ICD and their PCP, ICP in the LYRB.
The standardized intra-annual distribution characteristics of precipitation and incoming water in the LYRB for different time periods are shown in Figure 7. From the figure, it can be seen that the changes of precipitation and runoff during the same period in different eras are relatively synchronized, especially the 1980s and 2010–2020 periods, during which the intra-annual distribution characteristics of precipitation and incoming water are roughly similar, showing strong synchronization. Among them, the peaks of both occurred in July in 1980s, while the peaks of incoming water occur at a time lagging behind the peaks of precipitation in 1990s, 2000s and 2010–2020 periods. This shows that the effects of climate change and subsurface and other comprehensive factors make the intra-annual distribution of precipitation and incoming water uncertain, but the peak incoming water occurs with a lag behind peak precipitation, which plays a certain role in inhibiting the occurrence of floods.
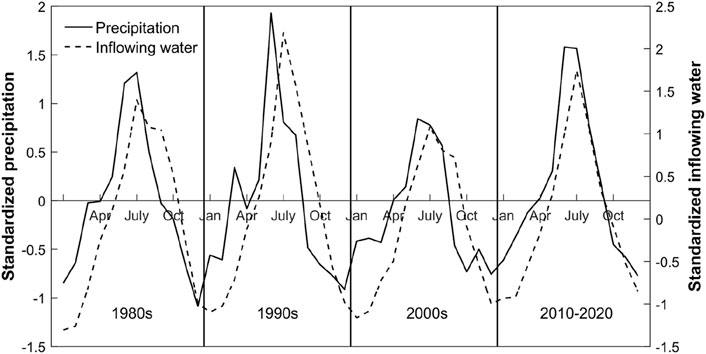
Figure 7. Normalized curve of monthly precipitation and incoming water in the LYRB.
In the previous paragraph, we learned that the peak incoming water occurs with a lag behind the peak precipitation. In order to further determine the lag time therein, we used box plots to analyze the number of days in which the peak incoming water occurs with a lag behind the peak precipitation between different eras as shown in Figure 8. We found that the peaks of incoming water lagged behind the peaks of precipitation in most of the years from 1980 to 2020, and the lag days of six of these years had outliers that we excluded from the study. In the four time periods, the mean and median values of the number of lagged days are positive, indicating that the peak of water inflow lags behind the peak of precipitation in most of the years in each time period. The average lagged days in 1980s, 1990s, 2000s and 2010–2020 are 11.6, 22.1, 44.5 and 8.9 days, respectively. The number of lag days between 2010 and 2020 is the shortest, significantly shorter than 2000 s. The shorter lag days will result in the peak of rainfall and the peak of incoming water occurring at a similar time, and the convergence of the two peaks is not conducive to the timely and effective drainage of the lower reaches of the Yangtze River, which may increase the probability of flooding events.
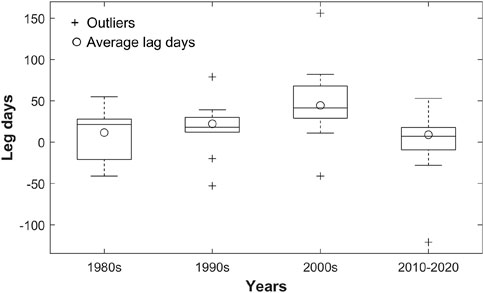
Figure 8. Box plots of days when peak incoming water lags peak precipitation.
4 Discussion
Precipitation and upstream incoming water in the region are important causes of local flooding events, and the results of intra-annual distribution of precipitation and upstream incoming water influence the generation and process of flooding (Madsen et al., 2014; Hu et al., 2018; Oppel and Fischer, 2020; Tabari, 2020; Feng et al., 2021; Xu et al., 2022). In this study, it was found that precipitation in the LYRB is concentrated in the summer months, with the peak occurring mainly in June, except for the 1980s when the peak occurred in July, which is consistent with the pattern found in the study of precipitation in the LYRB by Li Y. et al. (2021). In terms of incoming water, flows from Datong Hydrographic Station are used as the incoming water for the LYRB. The intra-annual distribution of incoming water in the LYRB is relatively similar in different decades from 1980 to 2020, with all incoming water reaching its maximum in July. Duan et al. (2016) found the same pattern during his study. They analyzed the runoff data from the Datong hydrographic station during the period 1949–2014 and found that during the time periods 1949–1998, 1999–2014 and 2008–2014, the incoming water was all concentrated in July.
In this study, both PCD and ICD were found to be decreasing, which may be due to the influence of the monsoon circulation (Zhao et al., 2021). Huang et al. (2018) found that PCD in the middle and lower reaches of the Yangtze River Basin tends to be negatively correlated with the intensity of the monsoon, and a decrease in PCD indicates a more uniform distribution of precipitation each year. Since the incoming water in the LYRB is closely related to the precipitation in the middle reaches, the decrease of PCD in the middle reaches of the Yangtze River Basin will also cause the decrease of ICD in the LYRB. Precipitation and incoming water not only affect flooding, but also have a very important impact on sediment behavior (Pignalosa et al., 2022; Mostafazadeh et al., 2023), agriculture (Ghaderpour et al., 2023; Pueyo-Ros et al., 2024), and hydropower (Jin et al., 2023), etc. Decreases in PCD and ICD can bring benefits: slowing down the process of soil erosion in the river channels (Hamududu and Killingtveit, 2012); securing the supply of water for irrigation in agriculture (Sun et al., 2010); and allowing the individual power generation reservoirs to increase the reservoir level and thus obtain greater benefit of power generation (Boehlert et al., 2016).
When a precipitation event occurs in the upstream area, surface flow or groundwater flow in the upstream area begins to gradually increase to a peak and is transported downstream (i.e., the peak of incoming water in the LYRB). In this paper, we have identified two lags in the period 2010–2020, one is that the period of concentration of incoming water lags behind the period of concentration of precipitation, and the other is that the peak of incoming water occurs at a time lagging behind the peak of precipitation. This period also exhibits phenomena that may be influenced by a number of factors, such as the form of precipitation (persistent rainfall, heavy rainfall, etc.), the infiltration capacity of the soil, and the topography of the landscape (Currier et al., 2017; Cheah et al., 2019; Chin, 2019; Zhao et al., 2019; Liao and Barros, 2023; Zhao et al., 2023; Yatagai and Saruta, 2024). Due to this situation mentioned above, the incoming water from the upstream is not immediately transformed into floods in the LYRB. This delayed effect may allow more time for the LYRB to take flood prevention and response measures, thus playing a certain inhibitory role and alleviating the impact of floods on the LYRB.
5 Conclusion
Taking the lower reaches of the Yangtze River Basin as the study area, this study uses the concentration degree and concentration period as quantitative indicators to explore the synchronous changes in the intra-annual distribution characteristics of precipitation and incoming water, which is of great significance to the research in the area of flood causality change response in the lower reaches of the Yangtze River. The following conclusions are drawn.
(1) The intra-annual distribution of precipitation and incoming water in different eras each has significant differences. The precipitation and incoming water in the summer of 2000s are significantly smaller, while the precipitation in the summer of 2000–2010 and the incoming water in the summer of 1990s are significantly larger. The time of occurrence of the maximum precipitation in the period of 1990–2020 is earlier compared with that of 1980s, and the annual incoming water distribution is smoother within the year, but the change in total incoming water varies greatly between years.
(2) Both PCD and ICD has had a slow downward trend over the past 41 years, and the interannual changes of the two are well synchronized between the 1980–2002 and 2015–2020 periods. There is a weak upward trend in PCP and a significant downward trend in ICP, but the synchronization between the two is high.
(3) The changes in precipitation and incoming water during the same period in different eras are relatively synchronized, especially in the 1980s and 2010–2020 periods, both precipitation and incoming water intra-annual distribution characteristics are roughly similar. During the period 1990–2020, the peak of incoming water lags behind the peak of precipitation, and it is also found that the concentration period of incoming water lags behind the concentration period of precipitation during the period 2010–2020, which also plays a certain inhibitory effect on the occurrence of floods.
This study points out some characteristics of the hydrological processes in the upper reaches of the Yangtze River during the period from 2010 to 2020, especially in relation to the time relationship between precipitation and incoming water and flood formation. This delayed phenomenon is of great significance for hydrological processes and flood risk management, and requires further in-depth research and monitoring.
Data availability statement
The original contributions presented in the study are included in the article/supplementary material, further inquiries can be directed to the corresponding author.
Author contributions
LK: Conceptualization, Data curation, Formal Analysis, Methodology, Software, Validation, Visualization, Writing–original draft, Writing–review and editing. CT: Conceptualization, Data curation, Formal Analysis, Funding acquisition, Investigation, Validation, Writing–review and editing. WY: Funding acquisition, Resources, Supervision, Visualization, Writing–review and editing. LY: Resources, Supervision, Writing–review and editing.
Funding
The author(s) declare that financial support was received for the research, authorship, and/or publication of this article. This research received funding from National Key Research and Development Program of China (2021YFC3000101).
Acknowledgments
The authors would like to thank editors and reviewers for their constructive comments and suggestions.
Conflict of interest
The authors declare that the research was conducted in the absence of any commercial or financial relationships that could be construed as a potential conflict of interest.
Publisher’s note
All claims expressed in this article are solely those of the authors and do not necessarily represent those of their affiliated organizations, or those of the publisher, the editors and the reviewers. Any product that may be evaluated in this article, or claim that may be made by its manufacturer, is not guaranteed or endorsed by the publisher.
References
Alemu, M. M., and Bawoke, G. T. (2019). Analysis of spatial variability and temporal trends of rainfall in Amhara region, Ethiopia. J. Water Clim. Change 11, 1505–1520. doi:10.2166/wcc.2019.084
Amiri, M. A., and Gocić, M. (2021). Analyzing the applicability of some precipitation concentration indices over Serbia. Theor. Appl. Climatol. 146, 645–656. doi:10.1007/s00704-021-03743-5
Armstrong McKay, D. I., Staal, A., Abrams, J. F., Winkelmann, R., Sakschewski, B., Loriani, S., et al. (2022). Exceeding 1.5°C global warming could trigger multiple climate tipping points. Science 377, eabn7950. doi:10.1126/science.abn7950
Ashrafi, S., Karbalaee, A. R., and Kamangar, M. (2024). Projections patterns of precipitation concentration under climate change scenarios. Nat. Hazards 120, 4775–4788. doi:10.1007/s11069-024-06403-9
Bashevkin, S. M., and Mahardja, B. (2022). Seasonally variable relationships between surface water temperature and inflow in the upper San Francisco Estuary. Limnol. Oceanogr. 67, 684–702. doi:10.1002/lno.12027
Bi, W., Li, M., Weng, B., Yan, D., Dong, Z., Feng, J., et al. (2023). Drought-flood abrupt alteration events over China. Sci. Total Environ. 875, 162529. doi:10.1016/j.scitotenv.2023.162529
Bian, J., Yu, H., Li, Q., Wang, Y., Li, M., and Lin, M. (2021). Analysis on wetness-dryness encounter and evolution of mult-dimensional runoff in lowerreaches of Changjiang River. Yangtze River 52, 120–127+175. doi:10.16232/j.cnki.1001-4179.2021.10.018
Boehlert, B., Strzepek, K. M., Gebretsadik, Y., Swanson, R., McCluskey, A., Neumann, J. E., et al. (2016). Climate change impacts and greenhouse gas mitigation effects on U.S. hydropower generation. Appl. Energy 183, 1511–1519. doi:10.1016/j.apenergy.2016.09.054
Chai, Y., Zhu, B., Yue, Y., Yang, Y., Li, S., Ren, J., et al. (2020). Reasons for the homogenization of the seasonal discharges in the Yangtze River. Hydrology Res. 51, 470–483. doi:10.2166/nh.2020.143
Cheah, R., Billa, L., Chan, A., Teo, F. Y., Pradhan, B., and Alamri, A. M. (2019). Geospatial modelling of watershed peak flood discharge in selangor, Malaysia. Water 11, 2490. doi:10.3390/w11122490
Chin, D. A. (2019). Anomalous behavior of the curve-number infiltration model. J. Irrigation Drainage Eng. 145, 06019002. doi:10.1061/(ASCE)IR.1943-4774.0001381
Currier, W. R., Thorson, T., and Lundquist, J. D. (2017). Independent evaluation of frozen precipitation from WRF and PRISM in the olympic mountains. J. Hydrometeorol. 18, 2681–2703. doi:10.1175/JHM-D-17-0026.1
Darand, M., and Pazhoh, F. (2022). Spatiotemporal changes in precipitation concentration over Iran during 1962–2019. Clim. Change 173, 25. doi:10.1007/s10584-022-03421-z
Du, W., Guo, E., Wang, A., Tong, Z., Liu, X., Zhang, J., et al. (2022). Spatiotemporal variation in precipitation concentration and its potential relationship with drought under different scenarios in Inner Mongolia, China. Int. J. Climatol. 42, 7648–7667. doi:10.1002/joc.7670
Duan, W., Guo, S., Wang, J., and Liu, D. (2016). Impact of cascaded reservoirs group on flow regime in the middle and lower reaches of the Yangtze River. Water 8, 218. doi:10.3390/w8060218
Feng, B., Zhang, Y., and Bourke, R. (2021). Urbanization impacts on flood risks based on urban growth data and coupled flood models. Nat. Hazards 106, 613–627. doi:10.1007/s11069-020-04480-0
Ghaderpour, E., Mazzanti, P., Mugnozza, G. S., and Bozzano, F. (2023). Coherency and phase delay analyses between land cover and climate across Italy via the least-squares wavelet software. Int. J. Appl. Earth Observation Geoinformation 118, 103241. doi:10.1016/j.jag.2023.103241
Gong, X., Zhang, H., Ren, C., Sun, D., and Yang, J. (2020). Optimization allocation of irrigation water resources based on crop water requirement under considering effective precipitation and uncertainty. Agric. Water Manag. 239, 106264. doi:10.1016/j.agwat.2020.106264
Guo, R., Zhu, Y., and Liu, Y. A. (2020). A comparison study of precipitation in the Poyang and the dongting lake basins from 1960–2015. Sci. Rep. 10, 3381. doi:10.1038/s41598-020-60243-8
Guo, W., Wang, B., Jiao, X., Huang, L., Yang, H., Yu, L., et al. (2024). Synergistic evolution and attribution analysis of water-sediment in the middle and lower reaches of the Yangtze River. J. Hydrology Regional Stud. 51, 101626. doi:10.1016/j.ejrh.2023.101626
Hamududu, B., and Killingtveit, A. (2012). Assessing climate change impacts on global hydropower. Energies 5, 305–322. doi:10.3390/en5020305
Hu, C., Wu, Q., Li, H., Jian, S., Li, N., and Lou, Z. (2018). Deep learning with a long short-term memory networks approach for rainfall-runoff simulation. Water 10, 1543. doi:10.3390/w10111543
Hu, K., He, J., Danierhan, S., and Tuerxun, Y. (2023). Sensitivity of river ecological baseflow to climate change in arid areas. Front. Environ. Sci. 10. doi:10.3389/fenvs.2022.1080810
Huang, Y., Wang, H., Xiao, W. H., Chen, L. H., Zhou, Y. Y., Song, X. Y., et al. (2018). Contributions of climate change and anthropogenic activities to runoff change in the Hongshui River, Southwest China. IOP Conf. Ser. Earth Environ. Sci. 191, 012143. doi:10.1088/1755-1315/191/1/012143
Jiang, C., Xiong, L., Wang, D., Liu, P., Guo, S., and Xu, C.-Y. (2015). Separating the impacts of climate change and human activities on runoff using the Budyko-type equations with time-varying parameters. J. Hydrology 522, 326–338. doi:10.1016/j.jhydrol.2014.12.060
Jiang, W., Niu, Z., Wang, L., Yao, R., Gui, X., Xiang, F., et al. (2022). Impacts of drought and climatic factors on vegetation dynamics in the yellow River Basin and Yangtze River Basin, China. Remote Sens. 14, 930. doi:10.3390/rs14040930
Jin, G., Hong, R., Lu, Y., and Gholinia, F. (2023). The evaluation distribution of runoff value on hydroelectric potential change-based RCPs scenarios and soft-computing: a case study. J. Electr. Eng. Technol. 18, 2551–2565. doi:10.1007/s42835-022-01343-5
Jo, Y.-J., Song, J.-H., Her, Y., Provolo, G., Beom, J., Jeung, M., et al. (2021). Assessing the potential of agricultural reservoirs as the source of environmental flow. Water 13, 508. doi:10.3390/w13040508
Kim, C., and Kim, D.-H. (2020). Effects of rainfall spatial distribution on the relationship between rainfall spatiotemporal resolution and runoff prediction accuracy. Water 12, 846. doi:10.3390/w12030846
Li, C., Cai, Y., Tan, Q., Wang, X., Li, C., Liu, Q., et al. (2021a). An integrated simulation-optimization modeling system for water resources management under coupled impacts of climate and land use variabilities with priority in ecological protection. Adv. Water Resour. 154, 103986. doi:10.1016/j.advwatres.2021.103986
Li, Y., Yan, D., Peng, H., and Xiao, S. (2021b). Evaluation of precipitation in CMIP6 over the Yangtze River Basin. Atmos. Res. 253, 105406. doi:10.1016/j.atmosres.2020.105406
Liao, M., and Barros, A. P. (2023). Toward optimal rainfall for flood prediction in headwater basins—orographic QPE error modeling using machine learning. Water Resour. Res. 59, e2023WR034456. doi:10.1029/2023WR034456
Liu, Y., Wen, A., Yan, D., and Shi, Z. (2022). Influence of precipitation characteristics and vegetation on runoff and sediment: a case on the basin in the three gorges reservoir region. Water 14, 2141. doi:10.3390/w14132141
Lu, K., Arshad, M., Ma, X., Ullah, I., Wang, J., and Shao, W. (2022). Evaluating observed and future spatiotemporal changes in precipitation and temperature across China based on CMIP6-GCMs. Int. J. Climatol. 42, 7703–7729. doi:10.1002/joc.7673
Madsen, H., Lawrence, D., Lang, M., Martinkova, M., and Kjeldsen, T. R. (2014). Review of trend analysis and climate change projections of extreme precipitation and floods in Europe. J. Hydrology 519, 3634–3650. doi:10.1016/j.jhydrol.2014.11.003
Mann, H. B. (1945). Nonparametric tests against trend. Econometrica 13, 245–259. doi:10.2307/1907187
Meng, F., Sun, Z., Dong, F., Jiang, Y., Zhang, H., Zheng, E., et al. (2023). Spatiotemporal evolution of precipitation heterogeneity characteristics in the heilongjiang province from 1961 to 2020. Agronomy 13, 3057. doi:10.3390/agronomy13123057
Mostafazadeh, R., Talebi Khiavi, H., Esmali-Ouri, A., and Golshan, M. (2023). Surface runoff and sediment yield response under the rainfall simulation condition controlled by soil variables of a semi-arid landscape. Environ. Dev. Sustain. 25, 12339–12356. doi:10.1007/s10668-022-02569-z
Ndione, D. M., Sambou, S., Kane, S., Diatta, S., Sane, M. L., and Leye, I. (2020). Ensemble forecasting system for the management of the Senegal River discharge: application upstream the Manantali dam. Appl. Water Sci. 10, 126. doi:10.1007/s13201-020-01199-y
Oppel, H., and Fischer, S. (2020). A new unsupervised learning method to assess clusters of temporal distribution of rainfall and their coherence with flood types. Water Resour. Res. 56, e2019WR026511. doi:10.1029/2019WR026511
Pignalosa, A., Silvestri, N., Pugliese, F., Corniello, A., Gerundo, C., Del Seppia, N., et al. (2022). Long-term simulations of Nature-Based Solutions effects on runoff and soil losses in a flat agricultural area within the catchment of Lake Massaciuccoli (Central Italy). Agric. Water Manag. 273, 107870. doi:10.1016/j.agwat.2022.107870
Pueyo-Ros, J., Škerjanec, M., Castellar, J. A. C., Atanasova, N., Comas, J., and Corominas, L. (2024). Beyond food: a stochastic model to estimate the contributions of urban agriculture to sustainability. Landsc. Urban Plan. 241, 104930. doi:10.1016/j.landurbplan.2023.104930
Qian, H., Liu, J., Yang, Y., Liu, Y., and Chai, Y. (2022). Quantitative study of climatic and anthropogenic contributions to streamflow and sediment load in the Yangtze River, China. Water 14, 3104. doi:10.3390/w14193104
Ren, K., Huang, Q., Huang, S., Ming, B., and Leng, G. (2021). Identifying complex networks and operating scenarios for cascade water reservoirs for mitigating drought and flood impacts. J. Hydrology 594, 125946. doi:10.1016/j.jhydrol.2020.125946
Sun, H., Shen, Y., Yu, Q., Flerchinger, G. N., Zhang, Y., Liu, C., et al. (2010). Effect of precipitation change on water balance and WUE of the winter wheat–summer maize rotation in the North China Plain. Agric. Water Manag. 97, 1139–1145. doi:10.1016/j.agwat.2009.06.004
Sun, S., Zhao, Y., He, Y., Xia, Z., Chen, S., Zhang, Y., et al. (2023). Exacerbated climate risks induced by precipitation extremes in the Yangtze River basin under warming scenarios. Front. Ecol. Evol. 11. doi:10.3389/fevo.2023.1127875
Tabari, H. (2020). Climate change impact on flood and extreme precipitation increases with water availability. Sci. Rep. 10, 13768. doi:10.1038/s41598-020-70816-2
Tian, Q., Lu, J., and Chen, X. (2022). A novel comprehensive agricultural drought index reflecting time lag of soil moisture to meteorology: a case study in the Yangtze River basin, China. CATENA 209, 105804. doi:10.1016/j.catena.2021.105804
Wan, L., Bento, V. A., Qu, Y., Qiu, J., Song, H., Zhang, R., et al. (2023). Drought characteristics and dominant factors across China: insights from high-resolution daily SPEI dataset between 1979 and 2018. Sci. Total Environ. 901, 166362. doi:10.1016/j.scitotenv.2023.166362
Wang, G., Yang, J., Hu, Y., Li, J., and Yin, Z. (2022). Application of a novel artificial neural network model in flood forecasting. Environ. Monit. Assess. 194, 125. doi:10.1007/s10661-022-09752-9
Wang, W., Lin, H., Chen, N., and Chen, Z. (2021). Evaluation of multi-source precipitation products over the Yangtze River Basin. Atmos. Res. 249, 105287. doi:10.1016/j.atmosres.2020.105287
Wang, Z., Sun, M., Zhang, M., Zhang, L., Gu, L., and Zhang, Y. (2023). Enhanced atmospheric water cycle processes induced by climate warming over the three rivers source region. Atmos. Res. 295, 107040. doi:10.1016/j.atmosres.2023.107040
Wei, J., Wang, Z., Han, L., Shang, J., and Zhao, B. (2022). Analysis of spatio-temporal evolution characteristics of drought and its driving factors in Yangtze River Basin based on SPEI. Atmosphere 13, 1986. doi:10.3390/atmos13121986
Wu, H., Lei, H., Lu, W., and Liu, Z. (2022). Future changes in precipitation over the upper Yangtze River basin based on bias correction spatial downscaling of models from CMIP6. Environ. Res. Commun. 4, 045002. doi:10.1088/2515-7620/ac620e
Wu, X., Feng, X., Wang, Z., Chen, Y., and Deng, Z. (2023). Multi-source precipitation products assessment on drought monitoring across global major river basins. Atmos. Res. 295, 106982. doi:10.1016/j.atmosres.2023.106982
Xu, Y., Hu, C., Wu, Q., Jian, S., Li, Z., Chen, Y., et al. (2022). Research on particle swarm optimization in LSTM neural networks for rainfall-runoff simulation. J. Hydrology 608, 127553. doi:10.1016/j.jhydrol.2022.127553
Yang, H., Nie, S., Deng, S., Zhou, H., and Zhou, X. (2023a). Evaluation of water yield and its driving factors in the Yangtze River Basin, China. Environ. Earth Sci. 82, 429. doi:10.1007/s12665-023-11113-9
Yang, L., Zhao, G., Tian, P., Mu, X., Tian, X., Feng, J., et al. (2022). Runoff changes in the major river basins of China and their responses to potential driving forces. J. Hydrology 607, 127536. doi:10.1016/j.jhydrol.2022.127536
Yang, P., Zhang, Y., Li, J., Xia, J., Huang, H., and Zhu, Y. (2023b). Characterization of precipitation and temperature equilibrium and its driving forces in the Yangtze river basin under climate change. Clim. Dyn. 61, 5861–5873. doi:10.1007/s00382-023-06888-3
Yatagai, A., and Saruta, S. (2024). Precipitation and moisture transport of the 2021 shimokita heavy precipitation: a transformed extratropical cyclone from Typhoon#9. Atmosphere 15, 94. doi:10.3390/atmos15010094
Yin, L., Wang, L., Keim, B. D., Konsoer, K., Yin, Z., Liu, M., et al. (2023). Spatial and wavelet analysis of precipitation and river discharge during operation of the Three Gorges Dam, China. Ecol. Indic. 154, 110837. doi:10.1016/j.ecolind.2023.110837
Yuan, X., Wang, Y., Ji, P., Wu, P., Sheffield, J., and Otkin, J. A. (2023). A global transition to flash droughts under climate change. Science 380, 187–191. doi:10.1126/science.abn6301
Zhang, G., Su, X., Ayantobo, O. O., Feng, K., and Guo, J. (2021). Spatial interpolation of daily precipitation based on modified ADW method for gauge-scarce mountainous regions: a case study in the Shiyang River Basin. Atmos. Res. 247, 105167. doi:10.1016/j.atmosres.2020.105167
Zhang, Q., Jian, W., and Lo, E. Y. (2020). Assessment of flood risk exposure for the foshan-zhongshan region in guangdong province, China. Water 12, 1159. doi:10.3390/w12041159
Zhang, R., Wu, X., Zhou, X., Ren, B., Zeng, J., and Wang, Q. (2022). Investigating the effect of improved drought events extraction method on spatiotemporal characteristics of drought. Theor. Appl. Climatol. 147, 395–408. doi:10.1007/s00704-021-03838-z
Zhao, D., Gao, X., and Wu, S. (2021). Nonuniform variations of precipitation and temperature across China over the period 1960–2015. Int. J. Climatol. 41, 316–327. doi:10.1002/joc.6622
Zhao, S., Zheng, X.-J., Yin, L., and Wang, Y. (2023). Forest stand factors determine the rainfall pattern of crown allocation of Picea schrenkiana in the northern slope of Mount Bogda, Tianshan Range, China. Front. Plant Sci. 13, 1113354. doi:10.3389/fpls.2022.1113354
Zhao, Y., Wang, M., Li, J., Yang, X., Zhang, N., and Chen, H. (2019). Diurnal variations in summer precipitation over the yellow River Basin. Adv. Meteorology 2019, 1–10. doi:10.1155/2019/2482656
Zhou, H., Hu, S., Wu, J., Qin, F., Li, D., and Wei, H. (2022). Method to describe the distribution of wind velocity and its application in wind resource evaluation. Energy Sci. Eng. 10, 4747–4755. doi:10.1002/ese3.1302
Zhu, C., Yue, Q., and Huang, J. (2023a). Projections of mean and extreme precipitation using the CMIP6 model: a study of the Yangtze River Basin in China. Water 15, 3043. doi:10.3390/w15173043
Keywords: the lower reaches of the Yangtze river basin, concentration degree, concentration period, synchronization analysis, intra-annual distribution
Citation: Kaidong L, Tingting C, Yintang W and Yong L (2024) Characteristics of intra-annual distribution of precipitation and incoming water and the synchronization analysis of their changes in the lower reaches of the Yangtze river basin. Front. Earth Sci. 12:1415276. doi: 10.3389/feart.2024.1415276
Received: 10 April 2024; Accepted: 07 June 2024;
Published: 02 July 2024.
Edited by:
Budi Indra Setiawan, IPB University, IndonesiaReviewed by:
Mehedi Hasan Tarek, Streams Tech, Inc., United StatesBinquan Li, Hohai University, China
Copyright © 2024 Kaidong, Tingting, Yintang and Yong. This is an open-access article distributed under the terms of the Creative Commons Attribution License (CC BY). The use, distribution or reproduction in other forums is permitted, provided the original author(s) and the copyright owner(s) are credited and that the original publication in this journal is cited, in accordance with accepted academic practice. No use, distribution or reproduction is permitted which does not comply with these terms.
*Correspondence: Cui Tingting, dHRjdWlAbmhyaS5jbg==