 Hongyi Yan
 Xiaoyan Zhao
 Liming Jian1
- 1Faculty of Geosciences and Environmental Engineering, Southwest Jiaotong University, Chengdu, Sichuan, China
- 2China Academy of Railway Sciences Corporation Limited, Beijing, China
In the red-bed areas of southwestern China, subgrade uplift deformation poses a serious safety concern for high-speed trains. However, the subgrade uplift mechanisms are still not well-defined, and there is a lack of effective prediction methods for addressing this issue. The objective of this study is to build prediction model of subgrade uplift using three machine learning techniques (MLTs): artificial neural network (ANN), random forest (RF), and support vector machine (SVM). The Chengdu-Chongqing passenger dedicated line (CCPDL) was selected as the research object, and a total of 200 cuttings along the CCPDL were randomly divided into two groups: a training set (70%) and a testing set (30%). The subgrade uplift mechanism was concluded by conducting the laboratory test, field investigation and mathematical statistics. Then six subgrade uplift-conditioning factors were identified, including subgrade excavation height, subgrade excavation width, dip angle, interbedded characteristics between sandstone and mudstone, mudstone rheology, and mudstone swelling. To assess the model performance, various evaluation metrics were employed, including receiver operating characteristic curve (ROC), area under the curve (AUC), accuracy, precision, recall, specificity, and F-1 score. The results demonstrate that the RF model outperforms the other MLTs in predicting subgrade uplift. Notably, among the six factors considered, subgrade excavation height was identified as the most influential factor. These findings provide valuable insights into the prediction of subgrade uplift and offer guidance for mitigating the risks associated with subgrade uplift during the construction of high-speed railways.
1 Introduction
The smoothness of the track surface in high-speed railways (HSRs) is an essential assurance for the high-speed operation of trains (Murray et al., 2015). However, in recent years, HSRs situated in the red-bed areas of Southwest China have encountered significant uplift deformations ranging from 20 to 60 mm. These deformations present a critical safety risk to train operations and result in substantial economic losses (Dai et al., 2021). In order to prevent subgrade uplift deformation and take appropriate measures during the early stages of railway construction, it is essential to clarify the subgrade uplift mechanism and utilize suitable prediction methods.
The subgrade uplift mechanism in railways is typically determined by the geological environment characteristics in which they are located. For example, in permafrost regions, the subgrade deformation is controlled by environmental conditions (e.g., permafrost environment, natural environment, engineering environment), and the ice content can be considered as the main factor affecting the stability of the subgrade (Huang et al., 2019). As for the HSRs in the swelling rock area, some scholars carried out the field investigation and laboratory swelling tests to analyze the subgrade deformation mechanism, and it is found that the content of the swelling rock and the water in the foundation are the main causes of the uplift deformation (Tang et al., 2009; Hendry et al., 2013; Kong et al., 2018). Moreover, in the soft rock strata, the subgrade uplift was mainly caused by the long-term creep deformation of the mudstone in the deep excavation cuttings (Zhong et al., 2020). However, the subgrade uplift of the HSRs in Southwest China, which mainly located in the red-bed strata, has just attracted the attention of scholars in recent years, and the subgrade uplift mechanism in red-bed strata remains unclear.
Red-bed is a continental clastic stratum deposited under high temperature and oxidizing environments, mainly formed during the Jurassic and Cretaceous (Tan et al., 2003; Eren et al., 2014; Jin et al., 2015). The red-bed mudstone, as a typical soft rock, possesses swelling (Tang et al., 2009; Jiang et al., 2018; Wang et al., 2021) and significant rheological properties (Lu et al., 2017; Du et al., 2018; Wang et al., 2020; Jia et al., 2021). Many scholars (Zhong et al., 2019; Dai et al., 2021) have analyzed the subgrade uplift mechanism based on the swelling characteristics of red-bed mudstone. For instance, Zhong et al. (2019) conducted extensive swelling tests on red-bed mudstone, revealing its inherent swelling potential. The resultant swelling deformation, induced by water absorption, poses a threat to the smoothness of the track surface. Other scholars have examined the subgrade uplift mechanism from the perspective of the creep behavior of red-bed mudstone. For example, Yan (2023) considered the creep of red-bed mudstone as a predictive indicator for subgrade uplift prediction. Through the collection of information from typical uplift sections, it was verified that the creep characteristic of mudstone is also a key factor affecting subgrade uplift. In fact, under the action of water and unloading stress, the basement mudstone will produce long-term uplift deformation in the deep cuttings of a railway (Zhong et al., 2020). Moreover, besides the inherent deformation characteristics of mudstone (swelling and rheology), the cutting excavation is a key predisposing factor causing mudstone deformation, because the stress and humidity field around basement mudstone could be changed after cutting excavation. Although the scholars have analyzed the subgrade uplift problem based on the different influencing factors, no unified understanding has been formed so far.
Although there have been achievements in the subgrade uplift mechanism, the research on subgrade uplift prediction is still in the exploratory stage. Dai et al. (2021) have predicted the subgrade deformation using the monitoring data of the subgrade deformation, but the practical applicability of the prediction results is limited, because the subgrade uplift has already been produced. Jiang et al. (2018) used a simple method to predict the subgrade uplift based on the one-dimensional swelling test results. However, the consideration of only a single factor in the prediction process makes the results less convincing, and the prediction model may not be applicable to other similar engineering scenarios. In fact, subgrade uplift has multiple and interconnected causes which are usually of complex parameterization. To address this type of issue, machine learning techniques (MLTs) is an applicable method of predicting a subject with multiple factors. MLTs have been widely used in the geology yield, such as spatial prediction models for shallow landslide hazards (Bui et al., 2016), accurate classification of hyperspectral images (Tarabalka et al., 2010), and landslide susceptibility mapping (Kavzoglu et al., 2014), but few scholars predict the subgrade uplift of HSR using MLTs.
In this research, the Chengdu-Chongqing passenger dedicated line (CCPDL) was selected as the object, and the main objectives are as follows: (1) clarifying the subgrade uplift mechanism of HSR in red-bed areas and selecting the subgrade uplift conditioning-factors for prediction; (2) building the subgrade uplift prediction models and assessing the performance of the prediction models; (3) evaluating the variable importance of the conditioning-factors. In addition, the output of this study will be useful to decision makers and engineers in railway design institute to identify the subgrade uplift-prone areas.
2 Material and methods
2.1 Study area
Chengdu-Chongqing Passenger Dedicated Line (CCPDL), which is designed with a speed of 350 km, was completed in March 2010. In April 2015, it was found that the elevation of the track was about 20 mm higher than the design elevation at Neijiang North Railway Station. The 20 mm over-limit uplift deformation forced the train to run at a speed of 60–80 km/h, causing lots of economic losses.
The study area is located in Sichuan and Chongqing Provinces, China (Figure 1A), and 95% of the CCPDL were built in the red-bed areas, which are mainly composed of the Jurassic and Cretaceous strata (Figure 1B). The main lithologies consist of grey hard sandstone (Figure 2A) and purple soft mudstone (Figure 2B), and they commonly occur as interbedded structures (Figure 2C).
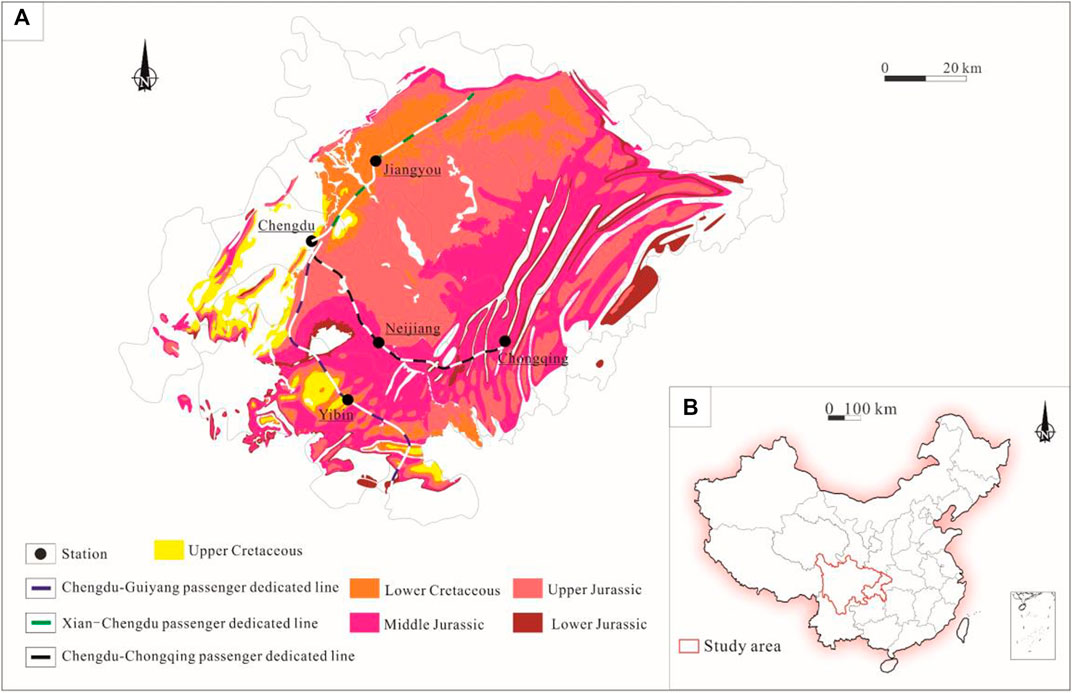
Figure 1. (A) Distribution of Sichuan red-bed and several HSRs experiencing subgrade uplift (B) Distribution map of the study area.
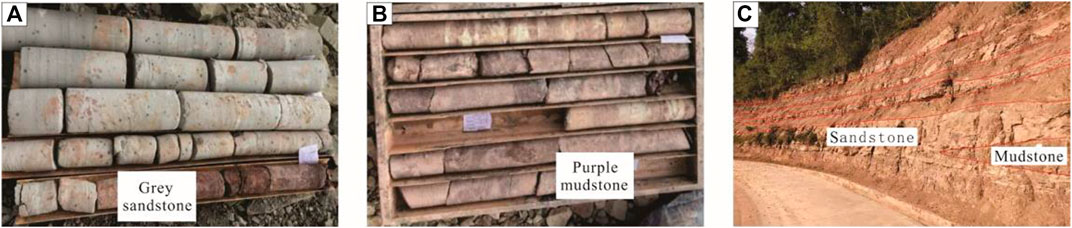
Figure 2. (A) Rock sample of grey sandstone (B) Rock sample of purple mudstone (C) Interbedded strata composed of sandstone and mudstone.
2.2 Methodology
There are four main steps of subgrade uplift prediction in this research (Figure 3):
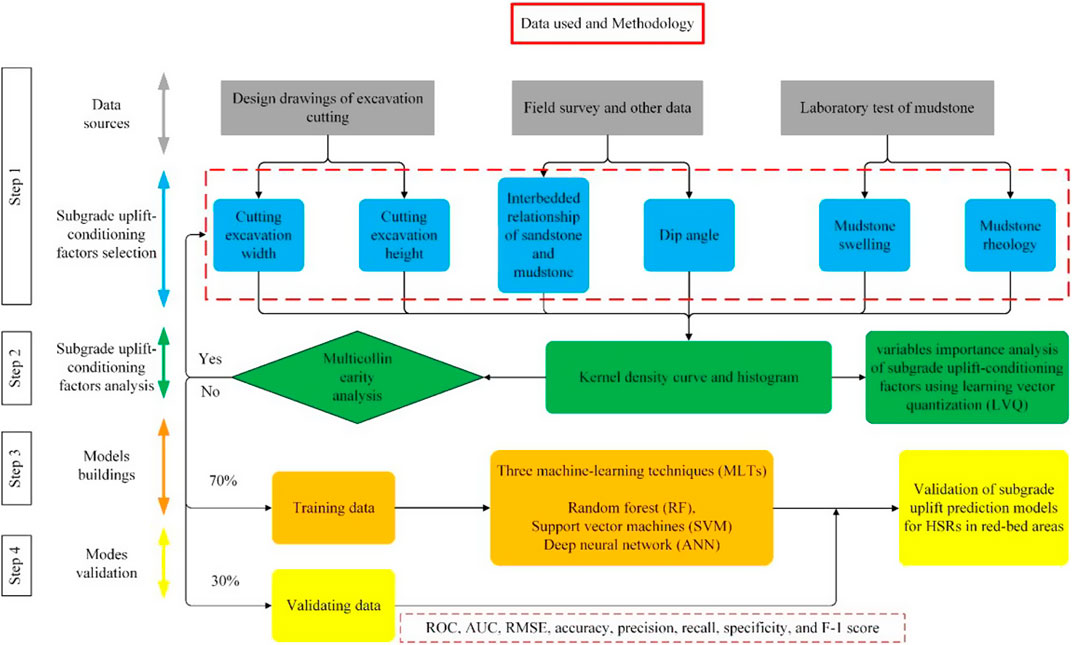
Figure 3. Flow chart of subgrade uplift prediction.
Step1. Determination of the subgrade uplift-conditioning factors;
Step2. Preparing of the dataset, analysis of subgrade uplift-conditioning factors;
Step3. Application of the three MLTs to build subgrade uplift prediction models;
Step4. Performance evaluation of the three prediction models.
In this research, the field investigations comprise two main parts: the collection of field survey data from other scholars (Zhong et al., 2020; Dai et al., 2021); our investigations into the engineering geological conditions along the CCPDL, including lithology, dip angles, and strata structure of both uplift and non-uplift sections (More details are described in Sections 2.3.3, 2.3.4). The laboratory tests primarily focus on the swelling and creep characteristics of red bed mudstone. They mainly include X-ray diffraction (XRD) tests (the results were showed in Section 2.3.6) and uniaxial compression creep tests (Zhong et al., 2020), which were conducted to verify the swelling and creep properties of red bed mudstone, respectively.
All the steps are further explained in the following sections (Sections 2.3–2.8).
2.3 Subgrade uplift-conditioning factors
In order to elucidate the mechanism of subgrade uplift in red bed areas, scholars have conducted many physical-mechanical experiments on red-bed mudstone and analyzed field monitoring data (Zhong et al., 2019; Dai et al., 2023; Yan et al., 2023). The results indicate that the swelling and creep deformations of red bed mudstone are key factors leading to subgrade uplift. Moreover, the engineering experience indicates that typical uplift sections of high-speed railway in red bed mudstone areas exhibit several characteristics: the higher content of mudstone, smaller dip angles, and deeper excavation height. Based on the aforementioned conclusions from previous studies and engineering experience, three main causes of subgrade uplift of HSR in red-bed areas, including cutting excavation, strata and mudstone (Figure 4) were determined. Based on these three causes, six subgrade uplift-conditioning factors were determined through laboratory tests, field investigations, and mathematical statistics. These factors include: cutting excavation width, cutting excavation height, dip angle, interbedded characteristics between sandstone and mudstone, mudstone rheological, and mudstone swelling. These six subgrade uplift-conditioning factors are further explained in Sections 2.3.1–2.3.6.
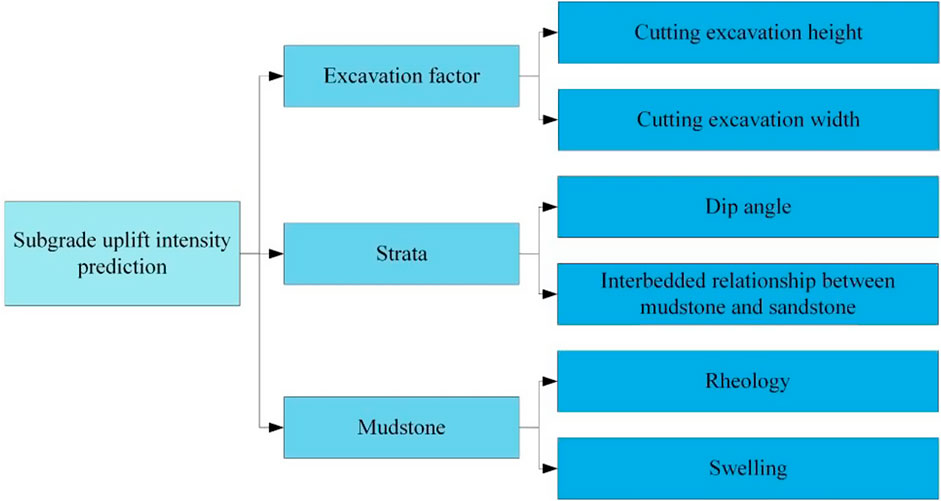
Figure 4. The subgrade uplift-conditioning factors.
2.3.1 Cutting excavation height
The excavation of cuttings is widely recognized as a primary triggering factor for subgrade uplift in red-bed areas of HSRs. The cutting excavation height (CEH), represented by the variable 'h' (Figure 5A), controls the unloading stress in the underlying bedrock. Statistical analysis of the relationship between subgrade uplift deformation and CEH (Figure 5B) has led to the conclusion that there is a positive correlation between subgrade uplift deformation and CEH. Therefore, it is reasonable to select CEH as one of the subgrade uplift-conditioning factors. The data for CEH is obtained from the cutting design drawings of the CCPDL.
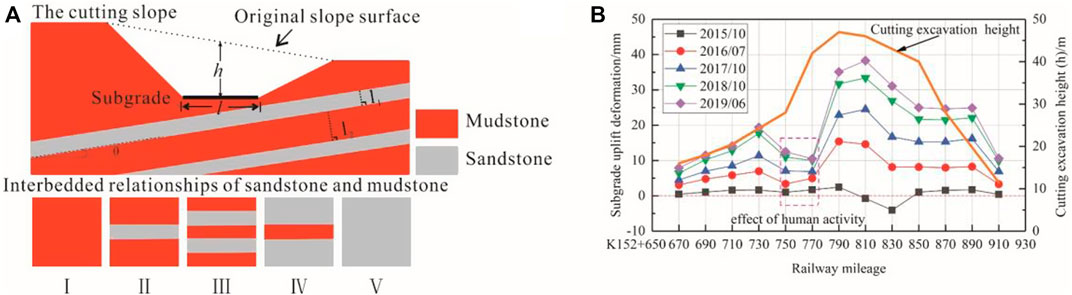
Figure 5. (A) Schematic diagram illustrating cutting excavation and interbedding characteristics in a red-bed area (B) Relationship between the subgrade uplift deformation and the cutting excavation height.
2.3.2 Cutting excavation width
The cutting excavation width (CEW), represented by the variable 'l' (Figure 5A), is another important factor that controls the unloading stress in the underlying bedrock. Based on engineering experience, it has been observed that cuttings with larger excavation widths are more prone to subgrade uplift. Therefore, the CEW has been determined as one of the subgrade uplift-conditioning factors in this study. The data for CEW is obtained from the cutting design drawings of CCPDL.
2.3.3 Dip angle
The dip angle, represented by the variable 'θ' in Figure 5A, plays a significant role in subgrade uplift deformation (Chen et al., 2021). It has been observed that the uplift sections of the CCPDL generally have smaller dip angles compared to other sections.
2.3.4 Interbedded characteristics between sandstone and mudstone
In the red-bed formations of Sichuan, China, mudstone and sandstone often occur as interbedded structures. It is well known that sandstone exhibits higher strength compared to mudstone (Zhong et al., 2020), providing significant deformation resistance in the underlying bedrock. Quantifying the interbedded relationship between mudstone and sandstone through field investigations can be challenging. Therefore, this study proposes five categories to describe the interbedded characteristics (Figure 5A): mudstone with no sandstone, mudstone intercalated with sandstone, mudstone interbedded with sandstone, sandstone intercalated with mudstone, sandstone with no mudstone.
2.3.5 Mudstone rheology
The rheology of soft rock is widely recognized as a critical factor contributing to engineering deformation (Chu et al., 2019). In the context of red-bed areas, mudstone is commonly categorized as soft rock, and its rheological behavior is considered an important factor in subgrade uplift deformation. However, due to the time-consuming nature of mudstone rheological tests and the challenges associated with obtaining accurate rheological parameters, it is not feasible to select rheological parameters as subgrade uplift-conditioning factors. In sedimentary rocks, there is a positive correlation between uniaxial compressive strength and elastic modulus. Therefore, in this study, the uniaxial compressive strength will be used to characterize the rheological properties of mudstone.
To account for the spatial variability of soil layers, it is expected that the uniaxial compressive strength of mudstone samples taken at different depths within the same location may vary. In order to minimize errors arising from sample variations when determining the uniaxial compressive strength of mudstones, five samples were collected from the boreholes in each uplift section. To ensure the reliability of the results, any abnormal values were identified and removed using Grubbs’s Test (Jian et al., 2022). The average value of the remaining samples was then determined as the saturated uniaxial compressive strength for that specific uplift section. Furthermore, the selection of these five samples was done with consideration for weak weathering conditions. Specifically, all samples were chosen from the depth range of 10–15m, where the borehole survey report indicated the presence of predominantly weak weathered mudstone.
2.3.6 Mudstone swelling
Mudstone swelling is recognized as a significant factor contributing to subgrade uplift deformation (Zhong et al., 2019). The extent of mudstone swelling is typically related to the content of swelling clay minerals present. In this study, mudstone samples were collected from the Neijiang North Railway Station, and their mineral composition and content were determined using XRD analysis. The XRD results of the mudstone are presented in Figure 6 and Table 1 provides the XRD mineral analysis results. The analysis reveals that the mudstone contains a significant amount of hydrophilic clay mineral (illite) with a content of 46.1%. This finding suggests that the red mudstone observed in CCPDL possesses the necessary material characteristics for swelling deformation.
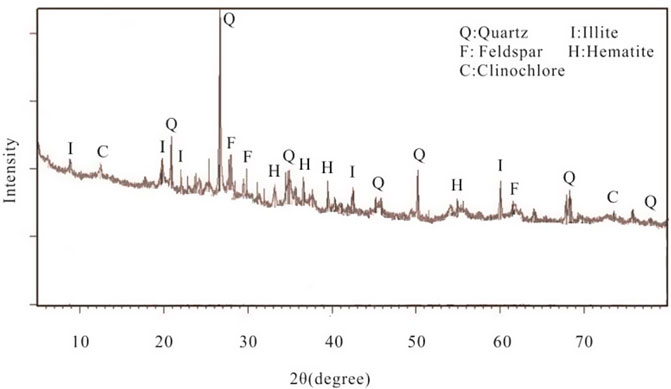
Figure 6. XRD results of the red-bed mudstone.

Table 1. XRD mineral analysis results of mudstone.
Thirteen displacement monitoring points were established at equal intervals between K152+670 and K152+910 along the CCPDL. The relationship between subgrade uplift deformation and monthly mean precipitation was investigated, and the findings are presented in Figure 7. The plot demonstrates that the three deceleration stages coincided with months of low precipitation. This observation indicates a positive correlation between subgrade uplift deformation and precipitation. Hence, it can be inferred that mudstone swelling plays a significant role in predicting subgrade uplift.
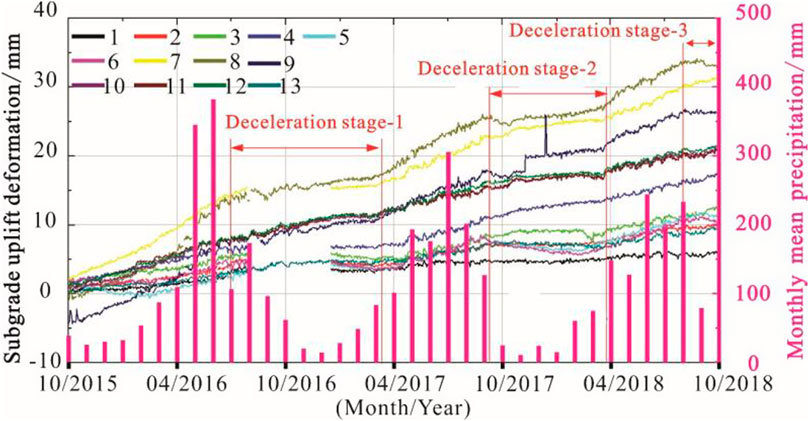
Figure 7. Relationship between subgrade uplift deformation and precipitation.
The extent of mudstone swelling is closely related to the presence of swelling clay minerals, such as illite, kaolinite, and montmorillonite (Hendry et al., 2013; Jiang et al., 2018; Zhong et al., 2020). In this study, the subgrade uplift-conditioning factor “mudstone swelling” is categorized into four types (strong swelling-1, medium swelling-2, weak swelling-3, non-swelling-4) based on the classification standard presented in Table 2 (Zhu and Yang, 2009).
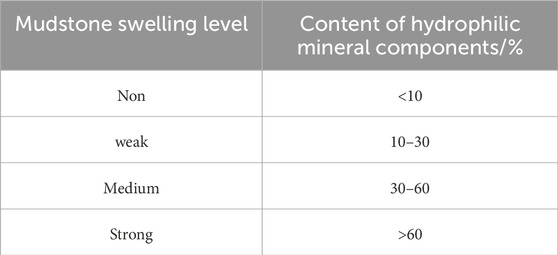
Table 2. Summary of grading criteria for expansive rocks.
2.4 Preparation of training and testing data
A total of 200 sections along the CCPDL were investigated, comprising 100 uplifted railway sections and 100 unuplifted railway sections. Among these, 70% (70 uplifted railway sections and 70 unuplifted railway sections) were randomly assigned as training data, while the remaining 30% (30 uplifted railway sections and 30 unuplifted railway sections) were designated as test data (After conducting comparative analyses on different train-validation-test split methods, it was found that the 70%–30% split method exhibited the highest prediction accuracy). The histogram and kernel density curve (KDE) of the six subgrade uplift-conditioning factors are presented in Figure 8.
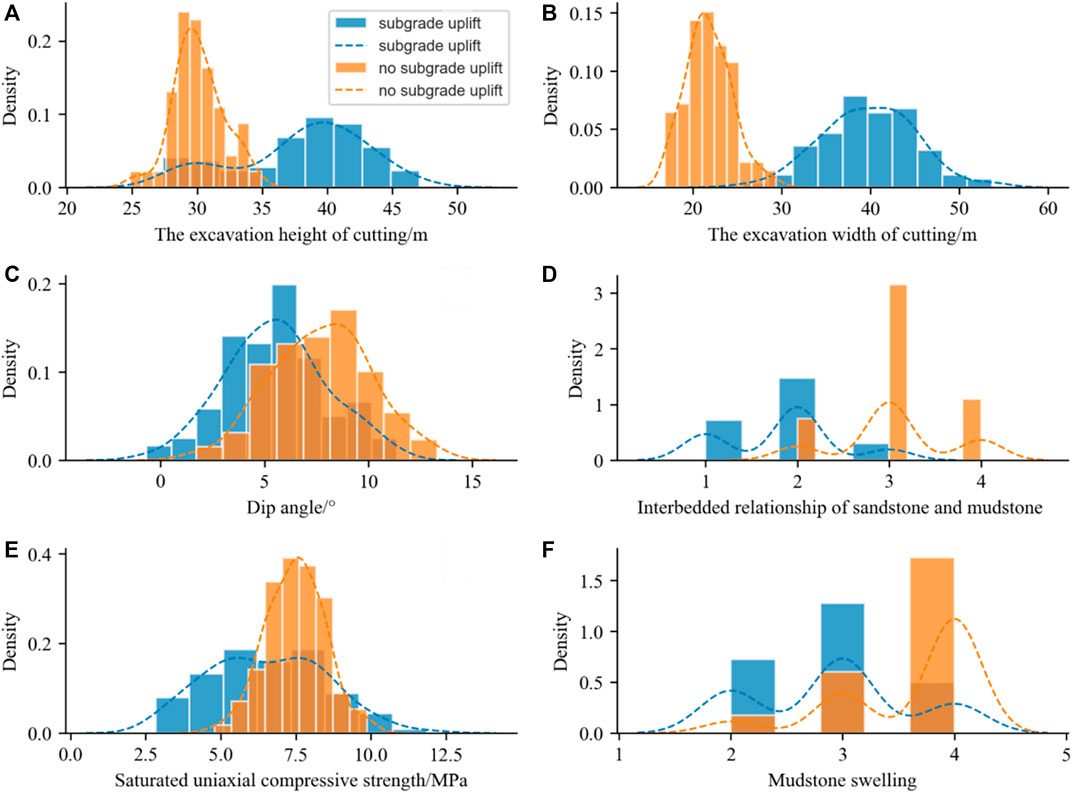
Figure 8. The kernel density estimation curves and the histogram, (A) subgrade excavation height, (B) subgrade excavation width, (C) dip angle, (D) interbedded characteristics between sandstone and mudstone, (E) mudstone rheology, and (F) mudstone swelling.
As showed in Figure 8A, the cutting excavation height in the study area varies between 25 and 45 m, with the subgrade uplift predominantly observed in sections with excavation heights ranging from 35 to 45 m. Regarding the cutting excavation width (Figure 8B), it ranges from 15 to 55 m, with the subgrade uplift primarily occurring in sections with excavation widths of 35–45 m. The dip angle (Figure 8C) spans from 0°–13°, and the subgrade uplift is more prominent in sections with dip angles of 0°–5°. In terms of the interbedded characteristics between sandstone and mudstone (Figure 8D), the occurrence of subgrade uplift is more likely in strata with a higher proportion of mudstone. The uniaxial compressive strength of mudstone (Figure 8E) ranges from 2.5 to 10 MPa, with the subgrade uplift being more pronounced in sections with mudstone strengths of 2.5–5 MPa. Furthermore, the mudstone in the study area is predominantly classified as weak-swelling and non-swelling, with the sections containing non-swelling mudstone tending to exhibit greater stability (Figure 8F).
2.5 Multicollinearity analysis of subgrade uplift-conditioning factors
In order to assess the presence of multicollinearity among the predictor variables, commonly used metrics such as tolerance (TOL) and variance inflation factor (VIF) were employed. Tolerance values greater than 0.2 or VIF values less than five indicate no significant multicollinearity issues between variables (Chen and Huang, 2019; Yi et al., 2020). By examining these metrics, we can evaluate the independence and stability of the predictor variables in the analysis.
The results of the multicollinearity analysis for the subgrade uplift-conditioning factors are presented in Table 3. The analysis revealed that the minimum tolerance (TOL) value observed was 0.23, while the maximum variance inflation factor (VIF) value was 4.31. These findings suggest that there is no significant multicollinearity issue among the independent factors examined. The values of TOL and VIF indicate that the predictor variables are sufficiently independent and do not suffer from excessive correlation, ensuring the reliability of the analysis.
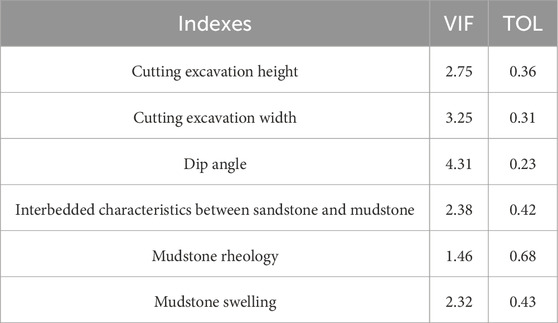
Table 3. The outcomes derived from the VIF statistical tests.
2.6 Importance analysis of subgrade uplift-conditioning factors
To gain a deeper understanding of the relationship between subgrade uplift and the uplift-conditioning factors, the learning vector quantization (LVQ) algorithm was employed to assess the influence of each uplift-conditioning factor on subgrade uplift. LVQ is a supervised learning algorithm commonly used in computer science for statistical classification purposes (Kohonen and Kohonen, 1995). In recent years, the LVQ technique has been applied in various fields, including groundwater potential mapping (Naghibi et al., 2016; Rahmati et al., 2016) and landslide susceptibility prediction (Pourghasemi et al., 2018), to quantify the importance of variables. By employing the LVQ algorithm, this study aims to determine the significance of each uplift-conditioning factor in predicting subgrade uplift.
2.7 Application of the machine learning techniques
2.7.1 Artificial neural networks
Artificial neural networks (ANNs) are widely used in the field of engineering geology. ANNs consist of interconnected artificial neurons that have the ability to learn and uncover intricate relationships between input and output variables (Fausett, 1994). The application of ANNs offers several advantages compared to other statistical methods. One significant advantage is their ability to operate independently of the distribution of the variables, eliminating the need for specific statistical assumptions (Pradhan and Lee, 2010). This makes ANNs a versatile and powerful tool for analyzing complex geotechnical and geological data in engineering geology research.
In this study, the Multi-Layer Perceptron (MLP) trained with the back-propagation algorithm (BPA) was selected as the analytical framework (Figure 9). The MLP, which is the most commonly used neural network methodology, aims to establish a model that can predict outputs based on new inputs. To train the MLP using BPA, a set of input and output values was used as examples. The MLP consists of an input layer, a hidden layer, and an output layer. The neurons in the hidden and output layers process their inputs by assigning weights to each input, summing the weighted inputs, and passing the sum through a nonlinear transfer function to generate an output. The artificial neural network “learns” by adjusting the weights between the neurons to minimize the differences between the predicted outputs and the target outputs. After the training phase, the neural network model should be capable of predicting the target value for a given input value.
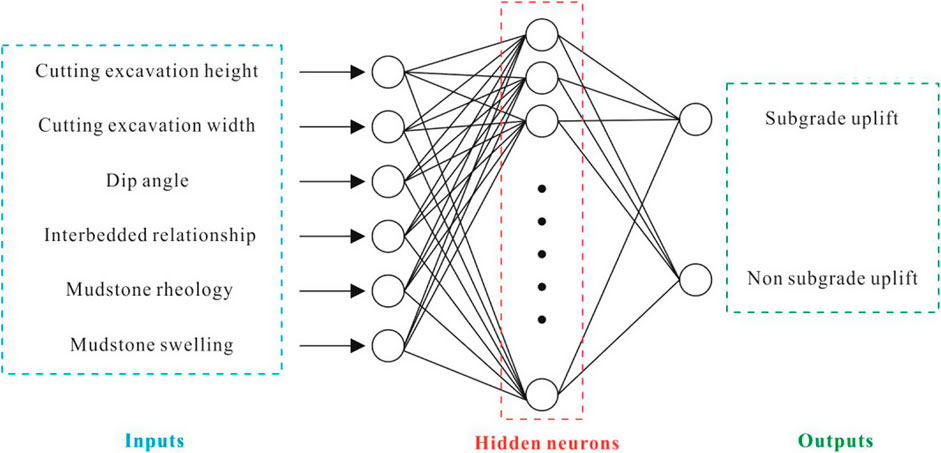
Figure 9. Architecture of neural network model.
In addition, the optimal number of neurons in the hidden layer was determined through a thorough optimization process, as it has a significant impact on the model’s performance (Kuo et al., 2004). The implementation of the ANN model in this research was conducted using the Jupyter Notebook application, running on the Python 3.6.5 environment.
2.7.2 Random forest
Another highly efficient algorithm commonly used for regression and classification problems is Random Forest (RF), which is based on the concept of model aggregation and was introduced by Breiman (2001).
The RF algorithm consists of two main steps. Firstly, multiple bootstrap samples, also known as training sets, are created, and a classification rule or tree is constructed for each sample. During this process, some observations are excluded from the training set and form a test set called out-of-bag (OOB) samples. These OOB samples are used to evaluate misclassification error and estimate the expected predictive accuracy (Pourghasemi et al., 2018).
Compared to other methods such as classification or multivariate regression, the Random Forest (RF) method provides several advantages. Firstly, it eliminates the need for assumptions regarding the distribution of explanatory factors. This flexibility allows for the inclusion of both categorical and numerical factors without the need for indicator variables. Secondly, RF has the capability to capture interactions and nonlinear relationships between factors, as highlighted by Aertsen et al. (2010). These characteristics make RF a versatile and powerful tool for data analysis and prediction in various fields. The implementation of the RF model in this research was conducted using the Jupyter Notebook application, running on the Python 3.6.5 environment.
2.7.3 Support vector machine
Vapnik (1999) defines a support vector machine (SVM) as a generalized linear classifier that employs supervised learning for binary classification tasks. The decision boundary of an SVM is determined by the maximum margin hyperplane, which separates the learning samples. In SVM, the empirical risk is calculated using the hinge loss function, and regularization terms are incorporated into the solution system to optimize the structural risk. SVM is widely recognized for its ability to handle complex classification problems and provide robust decision boundaries.
In order to achieve accurate predictions, careful selection of a kernel function is crucial for a support vector machine (SVM). Among various kernel functions, the Gaussian radial basis function (RBF) is particularly promising due to its strong localization and ability to map samples to a higher dimensional space. The RBF kernel function is widely recognized for its excellent performance in both large and small sample scenarios, requiring fewer parameters compared to polynomial kernel functions (Pourghasemi and Rahmati, 2018). In this study, the RBF kernel function was chosen, and the SVM model was implemented using the Python 3.6.5 environment.
2.8 Model evaluation
The performance of the model was assessed using a comprehensive set of metrics, including the receiver operating characteristic curve (ROC), area under the curve (AUC), accuracy, precision, recall, specificity, and F-1 score. The ROC and AUC are well-established measures for evaluating model performance, with a higher AUC indicating better predictive capabilities (Xi et al., 2022). Additionally, accuracy, precision, recall, specificity, and F-1 score were calculated as Eqs 1–5:
3 Results
3.1 Prediction results using ANN model
Parameter tuning plays a crucial role in optimizing the performance of artificial neural networks. In this study, the learning rate and the number of hidden layer nodes were identified as the key parameters that significantly impact the prediction results. Through preliminary debugging and previous calculation experience, a comprehensive analysis was conducted to determine the optimal values for these parameters. Figure 10 illustrates the evaluation of different learning rates in terms of loss, as well as the accuracy under different numbers of hidden layer nodes. The results of this analysis indicate that the optimal learning rate for the neural network is determined to be 0.24. Furthermore, it was determined that the optimal number of hidden layer nodes is 14, based on the accuracy achieved by the network. By carefully tuning these parameters, the neural network can achieve improved prediction accuracy and enhance its overall performance.
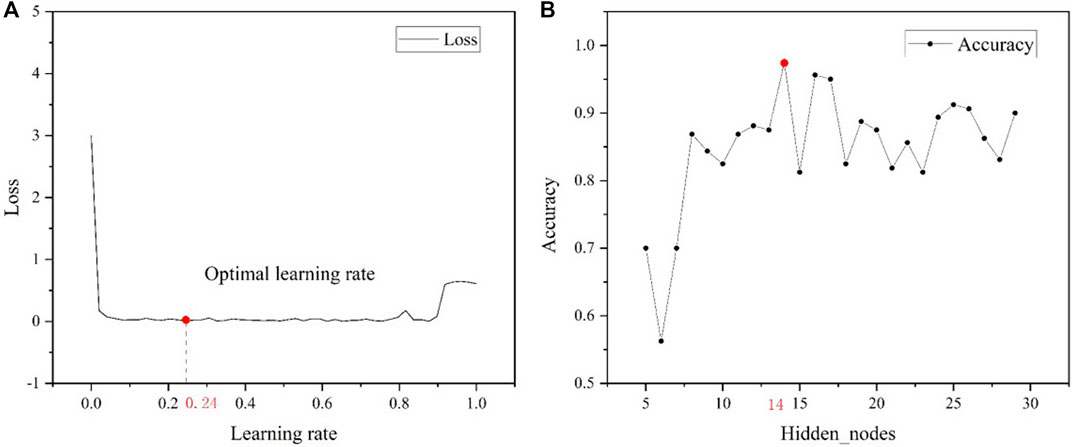
Figure 10. Tuning results of (A) learning rate and (B) number of hidden layer nodes.
The results obtained from the artificial neural network (ANN) models are presented in Table 4. The performance of the models was evaluated using both the training dataset and the validation dataset. In the training dataset, the ANN model successfully predicted 65 out of 70 subgrade uplift segments accurately, indicating a high level of prediction accuracy. Similarly, the model accurately predicted 64 out of 70 segments with no subgrade uplift. These results demonstrate the effectiveness of the ANN model in capturing the patterns and relationships in the training dataset. Furthermore, when the ANN model was applied to the validation dataset, it achieved a satisfactory level of performance. Out of the 30 segments in the validation dataset, the model correctly predicted 25 subgrade uplift segments, showcasing its ability to identify potential areas of subgrade uplift. Additionally, the model accurately predicted 23 out of 30 segments with no subgrade uplift. These findings indicate that the ANN model exhibits good performance in both training and validation datasets, suggesting its applicability and reliability for predicting subgrade uplift in the study area.
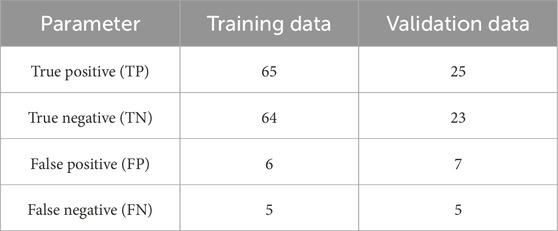
Table 4. Prediction results using ANN model.
3.2 Prediction results using RF model
The number of trees in the Random Forest (RF) model plays a crucial role in determining its performance. A small number of trees may result in low accuracy and limited generalization ability, while an excessively large number of trees can significantly increase the training time of the model. Therefore, it is important to select an appropriate number of trees that balances performance and efficiency. To assess the performance of the RF models with different numbers of trees, the Out-of-Bag Error (OOBE) was employed as an evaluation metric. The OOBE provides an estimate of the model’s prediction error based on the samples not included in the bootstrap training set. As shown in Figure 11, the OOBE values of the RF models were plotted against the number of trees. It can be observed that as the number of trees increases, the OOBE initially decreases and then reaches a plateau. The RF model with 71 trees achieved the lowest OOBE value of 0.032, indicating superior performance and predictive accuracy. Based on these results, it can be concluded that selecting 71 trees for the RF model strikes a balance between accuracy and computational efficiency. This optimal number of trees ensures reliable predictions while minimizing the training time of the model.
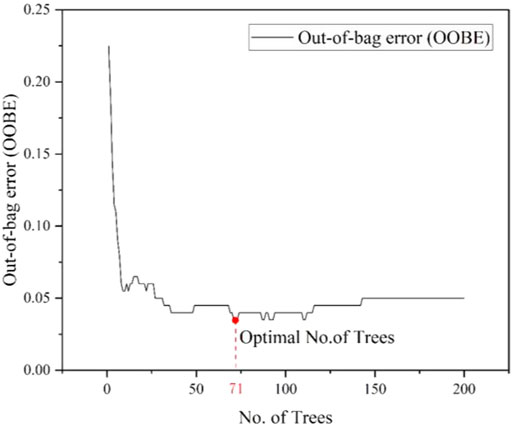
Figure 11. Tuning results of No. of Trees.
The performance of the Random Forest (RF) models was evaluated based on the results presented in Table 5. In the training dataset, all the segments were correctly predicted. In the validation dataset, the RF model correctly predicted 27 out of 30 subgrade uplift segments, indicating a prediction accuracy rate of 90%. Additionally, the model correctly predicted 26 out of 30 segments with no subgrade uplift, resulting in an accuracy rate of 87%. These results indicate that although the RF model has exhibited signs of overfitting, its overall accuracy remains high, allowing it to perform reasonably well in prediction.

Table 5. Prediction results using RF model.
3.3 Prediction results using SVM model
The penalty parameter 'C' is a crucial factor in training the SVM model. Through grid search, it was determined that setting 'C' to 4.2 resulted in the highest accuracy. This optimized parameter selection improved the model’s performance in predicting subgrade uplift.
The performance of the SVM models was evaluated and the results are presented in Table 6. In the training dataset, the SVM model correctly predicted 62 out of 70 subgrade uplift segments and 63 out of 70 segments with no subgrade uplift. This indicates that the training results of the SVM model are favorable, demonstrating its ability to accurately classify subgrade uplift. Similarly, in the validation dataset, the SVM model achieved a high level of accuracy by correctly predicting 22 subgrade uplift segments out of 30 and 23 segments with no subgrade uplift out of 30. These results highlight the SVM model’s good applicability and its potential for effectively predicting subgrade uplift in practical applications.

Table 6. Prediction results using SVM model.
4 Discussion
4.1 Accuracy assessment and comparison
The evaluation of different machine learning approaches for subgrade uplift prediction is crucial, considering the limited research in this area. The ROC curves and AUC values are presented in Figure 12. The AUC values of the ANN, RF, and SVM models using the training dataset are 0.74, 1.00, and 0.81, respectively, as shown in Figure 12A. These results indicate that the RF model demonstrates the best predictive accuracy among the three models for the training dataset. Similarly, in the validation dataset, the AUC values of the ANN, RF, and SVM models are 0.73, 0.81, and 0.78, respectively, as depicted in Figure 12B. The RF model again exhibits the highest suitability for predicting subgrade uplift in the validation dataset. Thus, based on the analysis of the ROC curves, it can be concluded that the RF model outperforms the ANN and SVM models in terms of predictive performance, making it the most effective approach for subgrade uplift prediction.
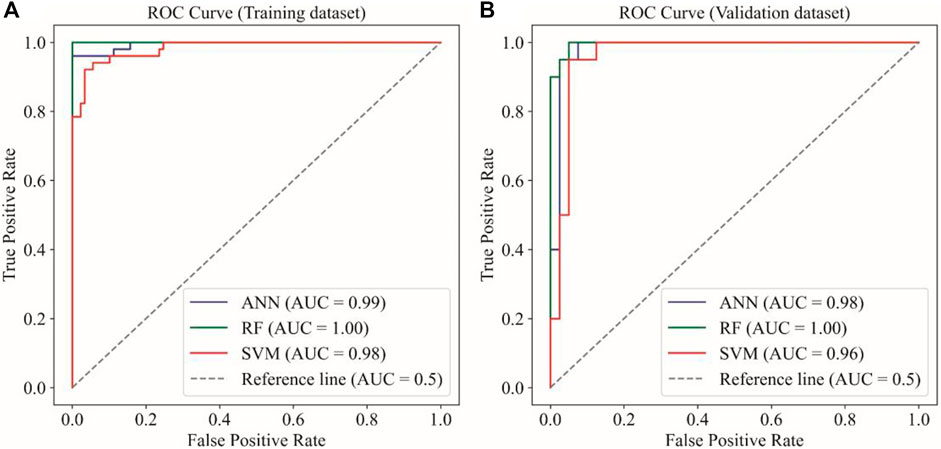
Figure 12. The ROC curves of the ANN, RF, SVM models using the (A) training and (B) validation dataset.
The prediction results obtained using the ANN, RF, and SVM methods are presented in Figure 13. All three prediction models demonstrate excellent performance in terms of prediction accuracy, precision, recall, specificity, and F1-score. Specifically, the RF model exhibits the highest performance among the three models, followed by the ANN model and the SVM model.
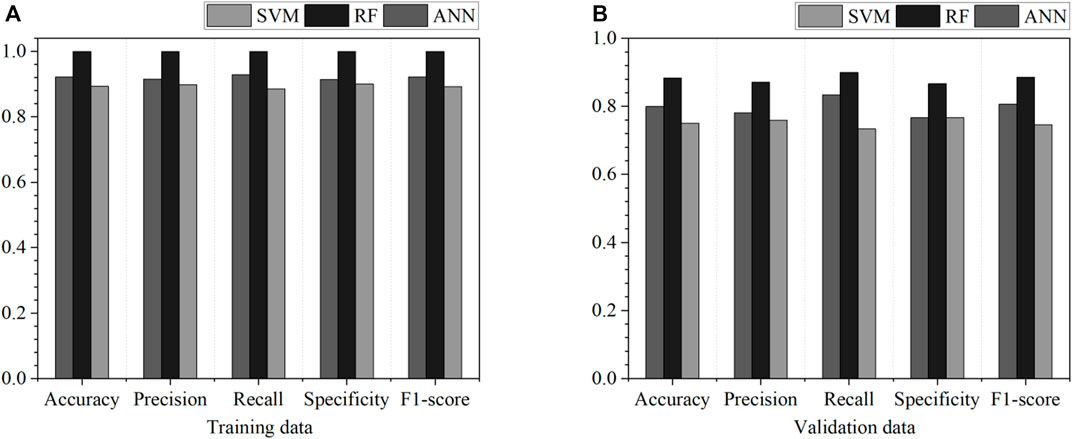
Figure 13. Performances of ANN, RF, SVM models using the (A) training and (B) validation dataset.
4.2 K-fold cross-validation
To evaluate the robustness of the predictive models against variations in data distribution, K-fold cross-validation was employed to validate the model and test its accuracy. The data (comprising 100 uplifted railway sections and 100 unuplifted railway sections) were randomly divided into five groups. For each group, the other four groups were used to train the prediction model. The selected group was then used to predict the subgrade uplift intensity based on the proposed model.
As showed in Figure 14, the average accuracy of the five k-fold cross-validation results for the three predictive models were 89% (RF model), 86% (ANN model), and 80% (SVM model), respectively. This average predictive accuracy is consistent with the predictive accuracy (Figure 13) obtained in this study, indicating that the robustness of the predictive models against variations in data distribution is satisfactory.
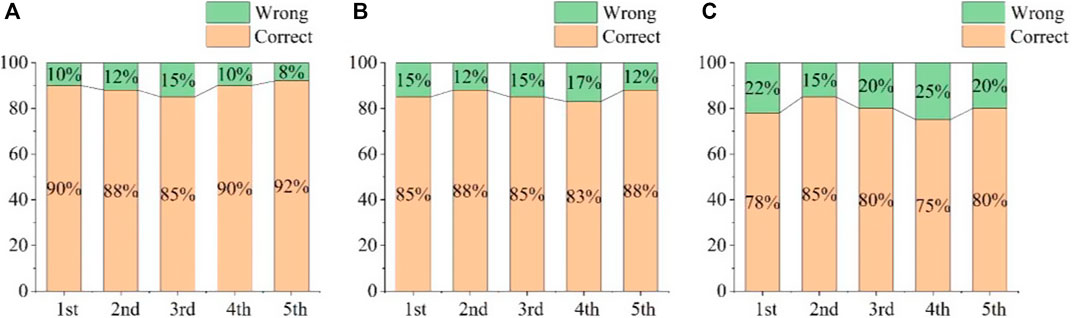
Figure 14. K-fold cross-validation result plot using (A) RF (B)ANN (C) SVM prediction models.
4.3 Variables contribution analysis
The weights (ANN) of the conditioning factors were calculated after training the model, and the averaged weights are presented in Table 7. To account for the variability caused by the random initialization of weights, the model was trained five times, and the weights were averaged. The standard deviation values, ranging from 0.02 to 0.06, indicate that the random sampling has minimal impact on the weight calculation, ensuring the credibility of the obtained weights. The results indicate that the excavation height holds the highest weight (0.25), followed by rock rheology (0.20), rock swelling (0.19), excavation width (0.13), interbedded relationship (0.13), and the dip angle has the lowest weight (0.08).
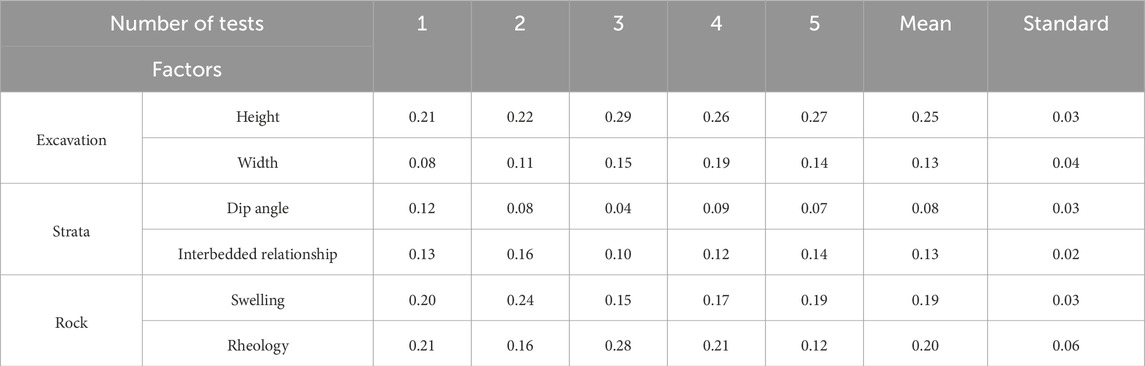
Table 7. Determination of the weight of each factor using ANN model.
In the RF model, Mean Decrease Accuracy (MDA) and Mean Decrease Gini (MDG) are commonly used measures to assess the importance of each factor in the model. Based on the MDA results (Figure 15), excavation height (0.08) has the highest impact on subgrade uplift, followed by mudstone swelling (0.064) and mudstone rheology (0.061). The interbedded relationship and excavation width have the same MDA importance, while the dip angle (0.026) has the lowest effect on subgrade uplift. The MDG results also indicate a similar ranking of factor importance, with the only difference being an increased influence of cutting excavation on subgrade uplift.
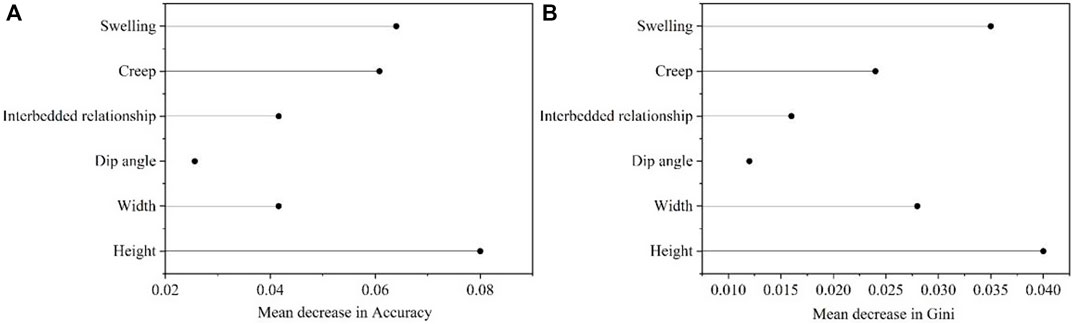
Figure 15. (A) Mean decrease accuracy and (B) mean decrease Gini of effective factors in RF model.
Due to the discrepancies in the importance ranking of factors obtained from ANN and RF, further exploration and validation of the factor importance were conducted using the Learning Vector Quantization (LVQ) method. The results, as depicted in Figure 16, indicate that the ranking of factor importance from LVQ analysis aligns well with those from ANN and RF. Therefore, it can be concluded that cutting height and mudstone expansion have the greatest influence on subgrade uplift. They are followed by mudstone creep and excavation width. On the other hand, the interbedding relationship and rock dip angle have the least impact on subgrade uplift.

Figure 16. The variable importance of effective factors using LVQ method.
4.4 The scalability of the predictive models
To verify whether the subgrade uplift prediction model proposed is applicable to other railways in red mudstone areas, we selected the Chengdu-Guiyang Passenger Dedicated Line (CGPDL) and the Xi’an-Chengdu Passenger Dedicated Line (XCPDL), both of which have also experienced subgrade uplift deformation (Figure 1), as the prediction subjects. From the two HSRs, ten typical uplift sections (five from CGPDL, five from XCPDL) and ten non-uplift sections (five from CGPDL, five from XCPDL) were randomly selected as the validation set. After applying the validation set to the three subgrade uplift prediction models (RF, ANN, SVM), the prediction results (Figure 17) indicate that the RF model exhibits the best scalability among the three models. The prediction accuracy for CGPDL exceeds 80% and for XCPDL exceeds 90%. The results suggest that the subgrade uplift prediction model (RF) proposed in this study still has good applicability for other high-speed railways in red mudstone areas.
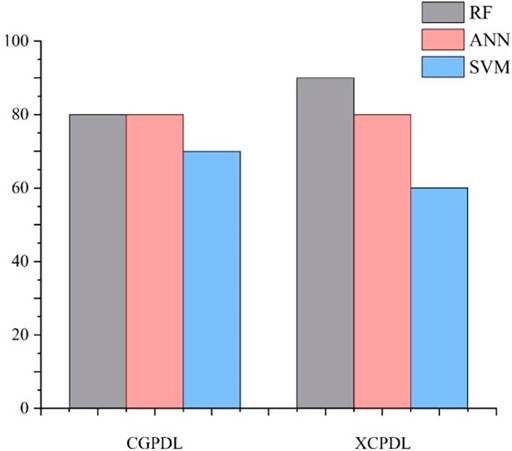
Figure 17. The prediction results of CGPDL and XCPDL using the three subgrade uplift prediction models.
4.5 The limitations and future directions of this study
According to the results, the subgrade uplift prediction model established in this study demonstrates good applicability for high-speed railways in red bed areas. However, modifications to the prediction model may be necessary in practical applications, depending on actual engineering conditions. For example, if the high-speed railway traverses active fault zones, the seismic effects on track deformation should be considered in the prediction model. Therefore, to enhance the applicability of the subgrade uplift prediction model for high-speed railways in red bed areas, future research efforts could focus on conducting tailored uplift prediction studies based on specific geological conditions.
Moreover, the successful implementation of the subgrade uplift prediction model relies heavily on the availability of comprehensive and accurate data regarding geological conditions and other relevant factors. Obtaining such data may be challenging, particularly in remote or inaccessible areas.
5 Conclusion
In this study, 200 cuttings of the CCPDL were examined to develop a subgrade uplift prediction model utilizing artificial neural networks (ANN), random forests (RF), and support vector machine (SVM). The key findings are as follows:
(1) Six subgrade uplift-conditioning factors, which include subgrade excavation width, subgrade excavation height, dip angle, interbedded characteristics between sandstone and mudstone, mudstone rheology, and mudstone swelling, were determined through laboratory tests, field investigations, and mathematical statistics. These factors were found to be effective predictors of subgrade uplift in the high-speed railway within the red-bed area.
(2) Three machine learning techniques, namely, ANN, RF, and SVM, were employed to construct subgrade uplift prediction models. All three models exhibited strong predictive performance, with RF demonstrating the highest accuracy.
(3) Among the conditioning factors, the cutting height and mudstone expansion exerted the most significant influence on subgrade uplift, followed by mudstone creep and excavation width. The interbedding relationship and rock dip angle had a comparatively lesser impact on subgrade uplift.
Data availability statement
The original contributions presented in the study are included in the article/Supplementary Material, further inquiries can be directed to the corresponding author.
Author contributions
HY: Conceptualization, Data curation, Formal Analysis, Funding acquisition, Investigation, Methodology, Project administration, Resources, Software, Supervision, Validation, Visualization, Writing–original draft, Writing–review and editing. XZ: Methodology, Writing–review and editing. LJ: Data curation, Writing–review and editing. RL: Methodology, Writing–review and editing. DX: Investigation, Writing–review and editing. MC: Software, Writing–review and editing.
Funding
The author(s) declare that financial support was received for the research, authorship, and/or publication of this article. This study was jointly supported by the National Natural Science Foundation of China (Grant No. 41672295).
Acknowledgments
We are thankful to Tianyi Luo and Shoukuan Zhang for his support during the experiments. We are thankful to the Innovative Practice Bases of Geological Engineering and Surveying Engineering of Southwest Jiaotong University (YJG-2022-JD04).
Conflict of interest
Author DX was employed by China Academy of Railway Sciences Corporation Limited.
The remaining authors declare that the research was conducted in the absence of any commercial or financial relationships that could be construed as a potential conflict of interest.
Publisher’s note
All claims expressed in this article are solely those of the authors and do not necessarily represent those of their affiliated organizations, or those of the publisher, the editors and the reviewers. Any product that may be evaluated in this article, or claim that may be made by its manufacturer, is not guaranteed or endorsed by the publisher.
References
Aertsen, W., Kint, V., Van Orshoven, J., Özkan, K., and Muys, B. (2010). Comparison and ranking of different modelling techniques for prediction of site index in Mediterranean mountain forests. Ecol. Model. 221 (8), 1119–1130. doi:10.1016/j.ecolmodel.2010.01.007
Afrazi, M., Razavi, M., Monjezi, M., Bhatawdekar, R., and Mohamad, E. T. (2023). Development and evaluation of a computer-aided educational platform for advancing understanding of slope stability analysis. Civ. Eng. Infrastructures J. doi:10.22059/ceij.2023.362554.1945
Breiman, L. (2001). Random forests: machine learning. Mach. Learn. 45 (1), 5–32. doi:10.1023/a:1010933404324
Bui, D. T., Tuan, T. A., Klempe, H., Pradhan, B., and Revhaug, I. (2016). Spatial prediction models for shallow landslide hazards: a comparative assessment of the efficacy of support vector machines, artificial neural networks, kernel logistic regression, and logistic model tree. Landslides 13 (2), 361–378. doi:10.1007/s10346-015-0557-6
Chen, C. Y., and Huang, J. J. (2019). Deriving fuzzy weights of the fuzzy analytic network process via fuzzy inverse matrix. Mathematics 7 (10), 914. doi:10.3390/math7100914
Chen, M., Zhao, X., Zhang, G., Yan, H., and Fu, K. (2021). Research on the risk assessment method of subgrade heaving deformation of high-speed railway. J. Railw. Eng. Soc. 38 (10), 31–36.
Chu, Z. F., Liu, B. G., Ren, D. R., Song, Y., and Ma, Q. (2019). Development of rheology similar material of soft rock and its application in model test. Rock and Soil Mechanics 40 (6), 2172–2182. doi:10.16285/j.rsm.2017.2503
Dai, Z. J., Guo, J. H., Yu, F., Zhou, Z., Li, J., and Chen, S. X. (2021). Long-term uplift of high-speed railway subgrade caused by swelling effect of red-bed mudstone: case study in Southwest China. Bullet. Eng. Geol. Environ. 80 (6), 4855–4869. doi:10.1007/s10064-021-02220-7
Du, H., Wang, G., Deng, G. C., and Cao, C. (2018). Modelling the effect of mudstone cuttings on rheological properties of KCl/Polymer water-based drilling fluid. J. Petrol. Sci. Eng. 170, 422–429. doi:10.1016/j.petrol.2018.06.071
Eren, M., Kadir, S., Zucca, C., Aksit, I., Kaya, Z., and Kapur, S. (2014). Pedogenic manganese oxide coatings (calcium buserite) on fracture surfaces in Tortonian (Upper Miocene) red mudstones, southern Turkey. Catena 116, 149–156. doi:10.1016/j.catena.2014.01.003
Fausett, L. (1994). Fundamentals of neural networks: architectures, algorithms, and applications. Prentice-Hall, 461.
Hendry, M. T., Martin, C. D., and Barbour, S. L. (2013). Measurement of cyclic response of railway embankments and underlying soft peat foundations to heavy axle loads. Canad. Geotech. J. 50 (5), 467–480. doi:10.1139/cgj-2012-0118
Huang, C. F., Li, Q., Wu, S. C., and Liu, Y. (2019). Subgrade stability evaluation in permafrost regions based on unascertained measurement model. Geotech. Geol. Eng. 37 (2), 707–719. doi:10.1007/s10706-018-0642-4
Jia, J., Yu, F., Tan, Y., and Gao, X. (2021). Experimental investigations on rheological properties of mudstone in kilometer-deep mine. Advances in Civil Eng. 2021, 1–12. doi:10.1155/2021/6615379
Jian, L. M., Zhao, X. Y., Wu, J., Yan, H. Y., Wan, Y. H., Wang, S., et al. (2022). Preparation, properties and grouting process simulation of cement-based grout for loose deposits. Construct. Build. Mater. 360, 129596. doi:10.1016/j.conbuildmat.2022.129596
Jiang, G., Chen, W., Liu, X., Yuan, S., Wu, L., and Zhang, C. (2018). Field study on swelling-shrinkage response of an expansive soil foundation under high-speed railway embankment loads. Soils and Foundations 58 (6), 1538–1552. doi:10.1016/j.sandf.2018.09.008
Jin, K., Cheng, Y. P., Wang, L., Dong, J., Guo, P. K., An, F. H., et al. (2015). The effect of sedimentary redbeds on coalbed methane occurrence in the Xutuan and Zhaoji Coal Mines, Huaibei Coalfield, China. Int. J. Coal Geol. 137, 111–123. doi:10.1016/j.coal.2014.11.009
Kavzoglu, T., Sahin, E. K., and Colkesen, I. (2014). Landslide susceptibility mapping using GIS-based multi-criteria decision analysis, support vector machines, and logistic regression. Landslides 11 (3), 425–439. doi:10.1007/s10346-013-0391-7
Kohonen, T., and Kohonen, T. (1995). Learning vector quantization: self-organizing maps. Springer, 175–189.
Kong, L. W., Zeng, Z. X., Bai, W., and Wang, M. (2018). Engineering geological properties of weathered swelling mudstones and their effects on the landslides occurrence in the Yanji section of the Jilin-Hunchun high-speed railway. Bullet. Eng. Geol. Environ. 77 (4), 1491–1503. doi:10.1007/s10064-017-1096-2
Kuo, Y. M., Liu, C. W., and Lin, K. H. (2004). Evaluation of the ability of an artificial neural network model to assess the variation of groundwater quality in an area of Blackfoot disease in Taiwan. Water Research 38 (1), 148–158. doi:10.1016/j.watres.2003.09.026
Lu, Y. L., Wang, L. G., Sun, X. K., and Wang, J. (2017). Experimental study of the influence of water and temperature on the mechanical behavior of mudstone and sandstone. Bullet. Eng. Geol. Environ. 76 (2), 645–660. doi:10.1007/s10064-016-0851-0
Murray, C. A., Take, W. A., and Hoult, N. A. (2015). Measurement of vertical and longitudinal rail displacements using digital image correlation. Canadian Geotechnical Journal 52 (2), 141–155. doi:10.1139/cgj-2013-0403
Naghibi, S. A., Pourghasemi, H. R., and Dixon, B. (2016). GIS-based groundwater potential mapping using boosted regression tree, classification and regression tree, and random forest machine learning models in Iran. Environ. Monitor. Assess. 188 (1), 44. doi:10.1007/s10661-015-5049-6
Pourghasemi, H. R., and Rahmati, O. (2018). Prediction of the landslide susceptibility: which algorithm, which precision? Catena 162, 177–192. doi:10.1016/j.catena.2017.11.022
Pradhan, B., and Lee, S. (2010). Landslide susceptibility assessment and factor effect analysis: backpropagation artificial neural networks and their comparison with frequency ratio and bivariate logistic regression modelling. Environ. Modelling Software 25 (6), 747–759. doi:10.1016/j.envsoft.2009.10.016
Rahmati, O., Haghizadeh, A., Pourghasemi, H. R., and Noormohamadi, F. (2016). Gully erosion susceptibility mapping: the role of GIS-based bivariate statistical models and their comparison. Natural Hazards 82 (2), 1231–1258. doi:10.1007/s11069-016-2239-7
Tan, X. D., Kodama, K. P., Chen, H. L., Fang, D. J., Sun, D. J., and Li, Y. A. (2003). Paleomagnetism and magnetic anisotropy of Cretaceous red beds from the Tarim basin, northwest China: evidence for a rock magnetic cause of anomalously shallow paleomagnetic inclinations from central Asia. J. Geophys. Res. Solid Earth 108 (B2). doi:10.1029/2001jb001608
Tang, A.-M., Cui, Y.-J., Trinh, V.-N., Szerman, Y., and Marchadier, G. (2009). Analysis of the railway heave induced by soil swelling at a site in southern France: engineering Geology. Eng. Geol. 106 (1-2), 68–77. doi:10.1016/j.enggeo.2009.03.002
Tarabalka, Y., Fauvel, M., Chanussot, J., and Benediktsson, J. A. (2010). SVM- and MRF-based method for accurate classification of hyperspectral images. IEEE Geoscience and Remote Sensing Letters 7 (4), 736–740. doi:10.1109/lgrs.2010.2047711
Wang, P. C., Ye, Y. S., Zhang, Q. L., Liu, J. Y., and Yao, J. K. (2020). Investigation on the sulfate attack-induced heave of a ballastless track railway subgrade. Trans. Geotech. 23, 100316. doi:10.1016/j.trgeo.2020.100316
Wang, R., Cheng, J. J., Gao, L., Li, Z. G., Qi, Y. L., Wang, M. T., et al. (2021). Research on the swelling mechanism of high-speed railway subgrade and the induced railway heave of ballastless tracks. Trans. Geotech. 27, 100470. doi:10.1016/j.trgeo.2020.100470
Xi, C. J., Han, M., Hu, X. W., Liu, B., He, K., Luo, G., et al. (2022). Effectiveness of Newmark-based sampling strategy for coseismic landslide susceptibility mapping using deep learning, support vector machine, and logistic regression. Bullet. Eng. Geol. Environ. 81 (5), 174. doi:10.1007/s10064-022-02664-5
Yan, H., Zhao, X., Wünnemann, B., Jian, L., Chen, M., and Xiao, D. (2023). A method for predicting the subgrade uplift intensity along a high-speed railway track in red-bed areas in China. Bullet. Eng. Geol. Environ. 82, 303. doi:10.1007/s10064-023-03301-5
Yi, Y. N., Zhang, Z. J., Zhang, W. C., Jia, H. H., and Zhang, J. Q. (2020). Landslide susceptibility mapping using multiscale sampling strategy and convolutional neural network: a case study in Jiuzhaigou region. Catena 195, 104851. doi:10.1016/j.catena.2020.104851
Zhong, Z., Li, A., Deng, R., Wu, P., and Xu, J. (2019). Experimental study on the time-dependent swelling characteristics of red-bed mudstone in Central Sichuan. J. Rock Mech. Eng. 38 (1), 76–86. doi:10.13722/j.cnki.jrme.2018.0861
Zhong, Z. B., Li, A. H., Deng, R. G., Wu, P. P., Wang, K., Cheng, M. H., et al. (2020). Study on time-dependent upheaval deformation mechanisms of red-bed soft rock subgrade of high-speed railways. J. Rock Mech. Eng. 39 (02), 327–340.
Keywords: subgrade uplift prediction, high speed railway, red-bed mudstone, artificial neural network, random forest, support vector machine
Citation: Yan H, Zhao X, Jian L, Long R, Xiao D and Chen M (2024) Subgrade uplift prediction along a high-speed railway using machine learning techniques in Sichuan, China. Front. Earth Sci. 12:1403965. doi: 10.3389/feart.2024.1403965
Received: 20 March 2024; Accepted: 13 June 2024;
Published: 04 July 2024.
Edited by:
Manoj Khandelwal, Federation University Australia, AustraliaReviewed by:
Zhongqiong Zhang, Chinese Academy of Sciences (CAS), ChinaDanial Jahed Armaghani, University of Technology Sydney, Australia
Copyright © 2024 Yan, Zhao, Jian, Long, Xiao and Chen. This is an open-access article distributed under the terms of the Creative Commons Attribution License (CC BY). The use, distribution or reproduction in other forums is permitted, provided the original author(s) and the copyright owner(s) are credited and that the original publication in this journal is cited, in accordance with accepted academic practice. No use, distribution or reproduction is permitted which does not comply with these terms.
*Correspondence: Xiaoyan Zhao, eHl6aGFvMkBzd2p0dS5lZHUuY24=