 Kuang-Tsung Chang
 Ya-Chu Chiu
94% of researchers rate our articles as excellent or good
Learn more about the work of our research integrity team to safeguard the quality of each article we publish.
Find out more
ORIGINAL RESEARCH article
Front. Earth Sci., 17 June 2024
Sec. Geohazards and Georisks
Volume 12 - 2024 | https://doi.org/10.3389/feart.2024.1402027
Some slopes experience multiple slides without collapse, while other slopes collapse once they are unstable. The early warning of slope collapse is a difficult but important subject. Considering the influence of weak planes on rock slope deformation and collapse is helpful for interpreting the behavior of deep-seated landslides and designing an early warning system. To investigate the deformation behavior of rock slopes with consideration on weak planes, artificial cemented sand plates were produced and stacked to form physical slope models with different weak plane orientations, where inclined loading was applied to induce the deformation and collapse of the slope. In addition, the deformation of real slopes was examined based on topographic features. The average strain at collapse is referred to as the critical strain, whose value changes for various slopes. Sorted by critical strain in descending order, the slope models include an anaclinal slope with 60° weak planes, an anaclinal slope with 30° weak planes, a cataclinal slope where the 30° weak planes coincide with the slope face, and a cataclinal slope with daylighting 20° weak planes. Similar to the experimental results, anaclinal slopes also present greater average strain values than cataclinal slopes for real slopes. A smaller critical strain implies a higher possibility for slope collapse when unstable. Local deformation does not always lead to collapse, but as the average velocity and the average strain rate of the sliding body increase, or the velocity ratio (VR) between the upper and lower parts of the sliding body approaches 1, a sliding surface inside the slope is likely developing and coalescing. Hence, such deformation features may contribute to a landslide warning system.
The sliding surface of a deep-seated gravitational deformation slope is usually located in the rock mass and is therefore affected by the presence of weak planes. In some large-scale collapses, the orientation of the weak plane aligns with the slope surface or daylight on the slope, leading to plane failures (Wang et al., 2003; Jaboyedoff et al., 2013; Wang et al., 2013; Singh et al., 2017). When the weak plane dips into the slope, the failure mode is often toppling failure (Nichol et al., 2002; Tu et al., 2020; Huang et al., 2022). These cases share the same key property, i.e., they do not collapse. The reason why a slope continues to slide but does not collapse may be explained by the progressive failure of the slope. In slope progressive failure, damage gradually accumulates before collapse. As the sliding surface develops progressively, partial sliding and deformation may occur intermittently before collapse of a slope (Petley et al., 2005; Chang et al., 2015). Hence, an unstable slope may yield either limited sliding or collapse. Among these two conditions, the collapse of a slope is of greater concern, and it is necessary to predict the occurrence of slope collapse.
In recent years, the Central Geological Survey, Taiwan, has been using light detection and ranging (LiDAR)-based digital terrain models to screen out potential large-scale landslides by using topographic features (Lin et al., 2013). For some potential cases, deformation mechanisms were clarified through intensive monitoring including core recognition, log Q values, and inclinometers (Lin et al., 2020). However, some cases do not present recognizable activity. Despite signs of sliding in some cases, it is difficult to determine whether if the potential of slope collapse is high for other cases. For example, according to Chang and Huang (2015), for tens of years, multiple sliding events involving a slaty slope have been reported, and roads and retaining walls have been damaged repeatedly. The sliding surface is over 100 m below the ground surface, and total collapse has not yet taken place. Cleavage in slate is well developed in this case, and bent or displaced cleavages are common in outcrops and rock cores, indicating that the slope has undergone deformation and sliding to some extent. A slope that has previously slid does not necessarily represent immediate danger, but the greater the accumulated slope deformation is, the greater the likelihood of slope collapse. The susceptibility level of slope collapse can be evaluated by critical displacement and critical strain (Moriwaki, 2001; Chigira, 2009) or by strain and strain rate (Jaboyedoff et al., 2012).
Methods for researching the failure mechanism of a slope include in situ investigation and tests, laboratory physical models and numerical methods. Large-scale in situ experiments can provide results that are closer to reality; however, they are costly, and it is difficult to control environmental factors during experiments. Alternatively, laboratory tests favor precise control of environmental factors and material properties and allow accurate measurement of variations in physical quantities. Therefore, scaled physical model experiments and their simulations are often used to study the failure behavior of slopes (Koizumi et al., 2018; Lin and Lo, 2018; Sun et al., 2019; Huang et al., 2021; Song and Tan, 2021; Zhu et al., 2021; Wang et al., 2022; Gong et al., 2023; Li et al., 2023; Sun et al., 2023). There are many types of slope model tests, including centrifuge modeling tests (Adhikary et al., 1997; Cheng et al., 2021), slope models that are soaked with water to weaken slope material (Weng et al., 2015), rotating slope models to make them steeper and cause failure (Roy et al., 2015), simulations of earthquakes using shaking table tests (Yang G. et al., 2018; Chen et al., 2020), and simulations of slope failures caused by rainfall (Lo and Weng, 2017; Yang Y. C. et al., 2018) and excavation (Zhu et al., 2020). In current physical model experiments, to investigate slope deformation and collapse mechanisms, the weak planes are mostly arranged based on known cases. Regarding how weak plane orientation affects the deformation and collapse of a slope, physical model experiment results are rare, and most discoveries are based on field observations (Aydan, 1989; Chigira, 1992; Margielewski, 2006).
Reports on landslides indicate that some slopes collapse without experiencing pronounced slides, whereas some slopes deform and slide several times but still do not collapse. The deformation and collapse of a slope are affected by many factors, including the distribution and strength of geological materials, depth and shape of the sliding surface, stress level at the sliding surface, and orientation of weak planes. These affecting factors correlate with each other in many ways. Stronger geological material strength commonly leads to a deeper sliding surface. The shape of sliding surfaces contributes to slope behavior in affecting the depth and the quantity of deformation area. The stress level at the sliding surface is a result of the geological material strength, depth and shape of the sliding surface, and orientation of weak planes. Generally, the process from instability to collapse along a shallow sliding surface occurs rapidly without many signs of movement. On the other hand, the process from instability to collapse along a deep sliding surface is likely to exhibit many signs of movement before collapse since the process may take a long time. In this study, artificial cemented sand plates comprised of a mixture of gypsum and sand were stacked to form small-scale physical models of anaclinal and cataclinal slopes with four weak plane orientations and two spacing values. Inclined loading was applied at the top of the slope until the slope collapsed. The purpose of the experiments was to relatively compare the features of slope deformation and collapse with various weak plane orientations rather than to simulate specific slopes. Deformation of real deep-seated gravitational deformation slopes were also investigated with topographic features. Experimental results and cases of real slopes both reveal that weak plane orientation influences deformation or average strain of rock slopes. The findings imply that an early warning system for a potential deep-seated landslide needs to take into account the orientation of weak planes.
The artificial cemented sand plates were piled to form slope models of various orientations and spacings. The Ottawa sand (ASTM C190/C778), gypsum and water were mixed and stirred uniformly in a weight proportion of 1:0.038:0.218. The mixture was poured into an acrylic mold of 200 mm × 150 mm with thickness 20 mm or 15 mm. After the mixture reached the initial set, it was cut into three plates of 200 mm × 50 mm with thickness 20 mm or 15 mm. Then the plates were placed in an oven and dried at 65°C for approximately 60 h (Indraratna, 1990) to expedite the dewatering process. The drying time controls the strength of the cemented sand. After drying for 48 h, the uniaxial compressive strength (UCS) of the cemented sand is 88 kPa; however, after drying for 60 h and a week, the UCSs are both approximately 93 kPa; hence, 60 h was chosen as the curing time. The density of the artificial cemented sand plates is 1.7 g/cm3. From the triaxial compressive tests, the peak cohesion is 22 kPa, and the peak friction angle equals 34°. The elastic modulus is 34 MPa.
The stresses in a real slope (the slope angle of 30° and the slope height of 400 m) are simulated using three-dimensional software Plaxis 3D under elastic behavior with a unit weight of 26 kN/m3, a Young’s modulus of 2 GPa, and a Poisson’s ratio of 0.3. The numerical results show that the major principal stress directions dip gently near the slope surface but are steeper in areas away from the surface (Figure 1A). Considering the depth within 100 m, the average major principal stress direction is approximately 30° to the vertical direction. Therefore, the physical slope models were deformed to failure by applying an inclined load of 30° to the vertical direction at the top of the slope model. The stresses in the small-scale slope model are also shown in the numerical results (Figure 1B), using the Mohr-Coulomb model and the aforementioned elastic and strength parameters of the cemented sand. Taking the load of 1000 N as an example, the influenced area in slope model has approximately similar major principal directions with the real slope.
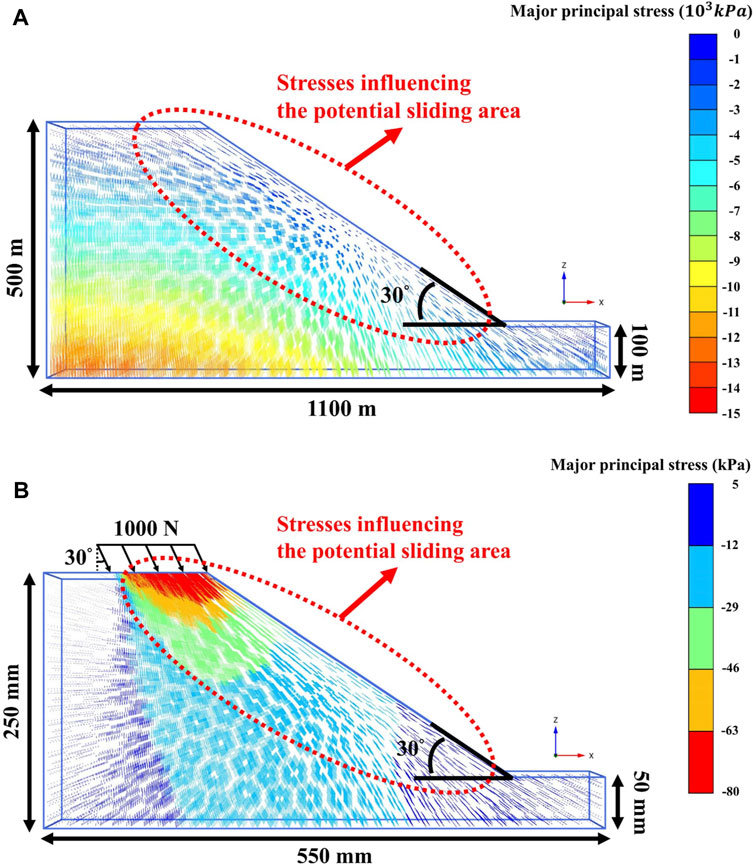
Figure 1. 3D numerical simulation to show directions of major principal stresses in a slope (A) full-size slope (B) physical slope model adopted in this case.
Figure 2A shows the configuration of the physical slope model with a fixed slope angle 30°. Weak planes with four dip angles were adopted, namely, there are anaclinal slopes with weak plane dip angles of 30° and 60° and cataclinal slopes with weak plane dip angles of 30° and 20°, which weak planes daylight at. Two spacing values for the weak plane, 20 mm and 15 mm, were used in this research. Jagged plates were fixed at the bottom of the acrylic model box to prevent sliding along the base. An inclined load was exerted at the top of the slope model until failure occurred. The loading direction transfers through the inclined surface between two acrylic blocks. By lubricating the interfaces of acrylic blocks, the shear component was reduced to approximately zero. The only component of the force for the lower acrylic block was inclined 30° to the vertical direction, as shown in Figure 2A. The inclined loading was applied by displacement control, through raising the slope model at a rate of 1.5 mm/min. The physical model in Figure 2B exhibits an anaclinal slope with weak plane that dips 30° into the slope. No fillings were added between the artificial cemented sand plates, and the strength of weak planes was provided mainly by the friction between blocks.
In Figure 9, the occurrence times of A. local failure, B. peak load, and C. the sliding surface cuts through the slope were determined according to Figures 7, 8A. The variation trends are approximately the same as the cases with 20 mm spacing (Figure 5). First, cracks appear, and then local failure takes place until the peak load. After the peak load, the average velocity and average strain increase with time, and the average velocity maintains approximately the loading rate (1.5 mm/min) after the sliding surface cuts through the slope (Figure 9). VRdecreases progressively with increasing loading, suggesting that cracks first appear in the upper part of the deformation area, then develop downward. Eventually, the upper and the lower parts of the deformation area detach together from the remaining slope and move along with loading (Figure 10).
In this study, a digital high-definition handy cam (SONY HDR CX-450) was used to film the deformation process of the slope. The images clipped from the film were analyzed with particle image velocimetry (PIV) to determine the influence of weak plane orientation and spacing on slope deformation. Every two of the 1-min-time-interval photos were analyzed in chronological order using open-sourced code, PIVlab. PIVlab calculates the displacements of points on the slope within a time interval and transforms them into velocities, producing vectors on the photos, as shown in Figure 2B. PIVlab allows users to describe a deformation area and generate the average velocity in this area. To quantify the progressive development of the sliding surface, this study defines the velocity ratio (VR) as the ratio of the average velocities of the upper part and the lower part of the sliding body:
where VTop is the average velocity of the upper one-third part of the sliding body and VBottom is the average velocity of the lower one-third part of the sliding body (Figure 2C). Changes in VR reflect the development of the sliding surface. As the sliding surface cuts through the entire slope, VR approaches 1, indicating that the upper one-third and the lower one-third of the sliding body move at a similar rate.
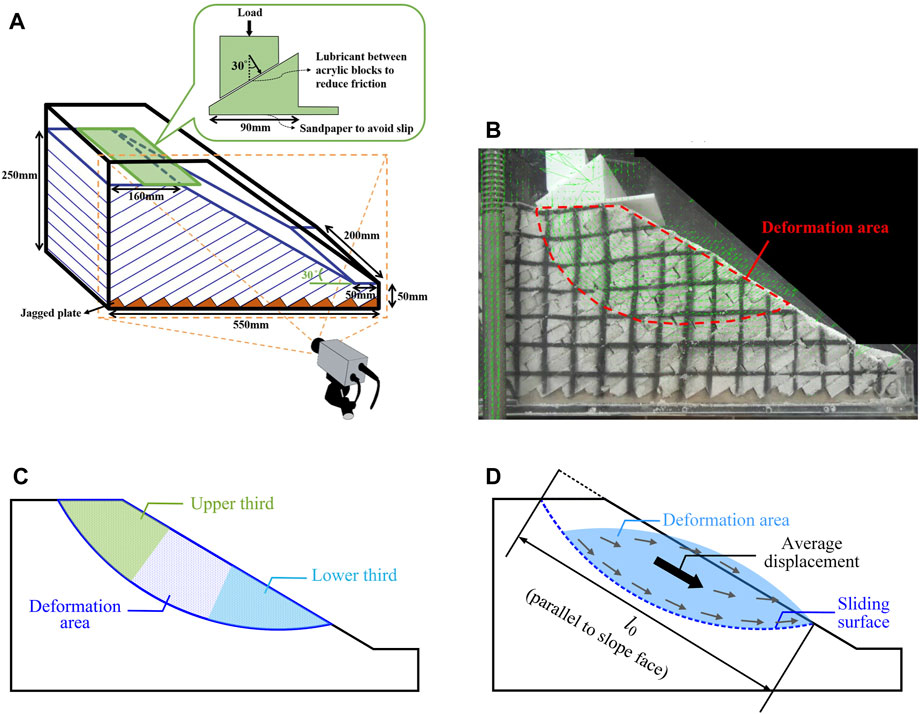
Figure 2. (A) Configuration of the physical slope model and deformation analysis of the physical slope model, (B) deformation area, (C) the upper third and lower third of the deformation area to calculate the velocity ratio (VR), and (D) average displacement in the deformation area.
In addition, by adding the average displacement increment of the slope deformation area every minute, its average accumulated displacement can be obtained. Considering that the accumulated displacement of the slope deformation area may be affected by the size and depth of the slope and the length and shape of the sliding surface, a nondimensional index modified from Chigira (2009) is used to represent the average strain
where d = the average (accumulated) displacement of the deformation area (sliding body) and l0 = the length from the top of the scarp to the toe of the deformation area along slope direction, as indicated in Figure 2D. Notably, PIV can estimate very small deformations if high-resolution images are collected. In this study, the resolution is approximately 0.14 mm/pixel, providing a firm base for determining l0, even at the early stage of sliding surface development.
Under an inclined load, the four types of experiments first show cracks in the local area, and then the cracks coalesce to form a sliding surface through the slope, which is considered slope collapse (Figure 3). Figure 3A exhibits the slope model of an anaclinal slope with 30° weak planes. Many short cracks appear at 14 min after loading, and as cracks grow toward the slope toe, a sliding surface forms in the 21st minute, when the sliding body starts to move massively. The anaclinal slope with a 60° weak plane (Figure 3B) initially presents cracks inside the slope at 14 min after loading, and the sliding surface cuts through the slope in the 27th minute. Large displacements follow, creating a sliding surface that is shallower than that of the anaclinal slope with 30° weak planes. In Figure 3C, the cataclinal slope with 30° weak planes displays distinct displacements and cracks in the first layer after loading for 9 min. Within the 13th minute, the sliding surface penetrates through the slope, and the sliding body moves along the surface. For the cataclinal slope with a 20° weak plane, sliding along weak planes appears at the slope top (Figure 3D) after loading for 1 min. During the second minute, the cracks extend to the slope surface, and the displacement of the sliding body rapidly accumulates afterward.
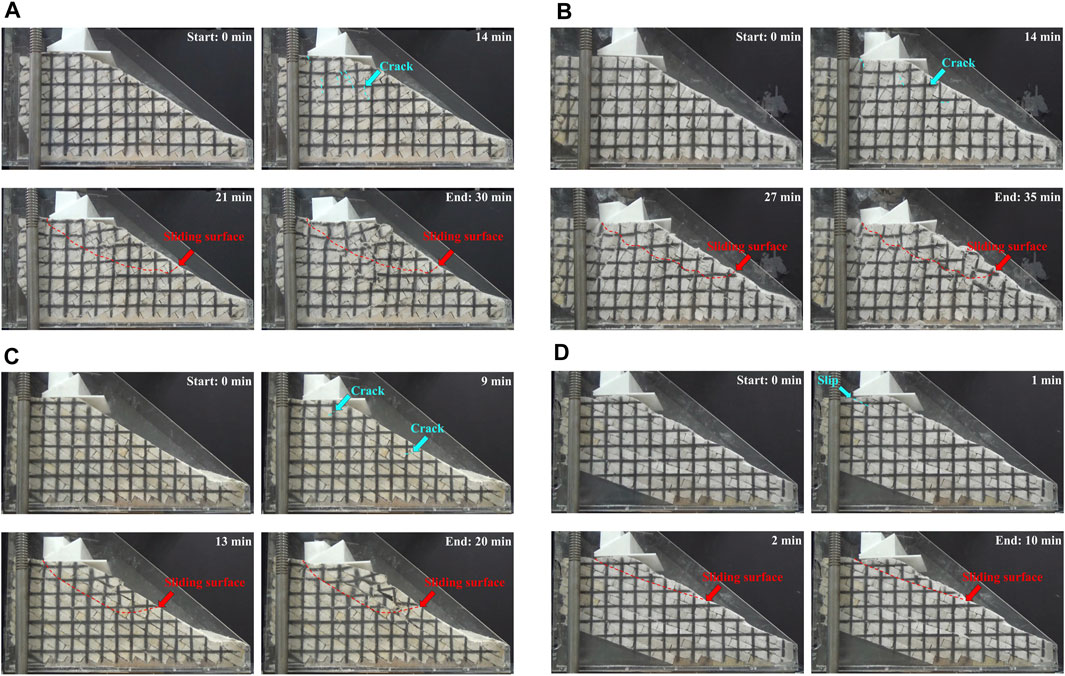
Figure 3. Deformation process of the physical model with 20 mm weak plane spacing, (A) anaclinal slope with weak plane dip angle 30°, (B) anaclinal slope with weak plane dip angle 60°, (C) cataclinal slope with weak plane dip angle 30° and (D) cataclinal slope with weak plane dip angle 20°.
The bearing capacities of the four types of slopes are different, as are the changes in average velocity, average strain of deformation area, and VR with time. Figure 4A shows the relationship between load and time. The load represents the vertical load exerted by the apparatus, which is greater than the inclined load on the top surface of the slope. The slopes considering the peak loads in descending order are as follows: the anaclinal slope with 30° weak planes, anaclinal slope with 60° weak planes, cataclinal slope with 30° weak planes, and cataclinal slope with 20° weak planes. Among them, the weak planes daylight in the cataclinal slope with 20° weak planes, and the sliding surfaces in such cases slide along the weak planes without cutting through the artificial cemented sand plates. Therefore, the peak load, which is much smaller than the other three types of slopes, mainly originates from the weak-plane friction angle. Figure 4B shows the load-average strain relationship. Hereafter, the average strain of the deformation area at collapse is referred to as the critical strain. The slopes showing the critical strain from the greatest to the least ones are the anaclinal slope with 60° weak planes, the anaclinal slope with 30° weak planes, the cataclinal slope with 30° weak planes, and the cataclinal slope with 20° weak planes. Notably, the anaclinal slope with 30° weak planes has a larger peak load than the anaclinal slope with 60° weak planes, but the former carries merely a slightly smaller critical strain than the latter. Additionally, the oscillation in anaclinal slopes reflects local failure inside the slopes, which is absent in cataclinal slopes (Figure 4). Every local failure induces an increase in displacement and strain, but as these phenomena lead to a dislocation between artificial plates and the loading acrylic block, the load decreases. As the loading continues, the loads increase again. The variations in the average velocity and average strain in the deformation area and load are shown in Figure 5. Throughout the experiments, there are three distinct points, namely, A. crack initiation (local failure initiation), B. peak load and C. sliding surface cuts through the slope. These points were determined based on the video images (Figure 4) and load-time and load-average strain curves (Figure 5). Local failure initiation always occurs before the peak load, and the sliding surface cuts through the slope after or at the peak load. The red dashed line in Figure 5A represents the loading velocity of the hydraulic machine, i.e., 1.5 mm/min. After point C, the deformation area detaches from the slope and forms the sliding body. The sliding body tends to move at rates close to the loading velocity; i.e., the sliding body moves the same amount as the hydraulic machine (Figure 5A). The increase in average velocities (Figure 5A) corresponds to the increase in average strain (Figure 5B). Approximately after the peak load, the average velocity and average strain increase drastically, and the sliding surface cuts through the slope.
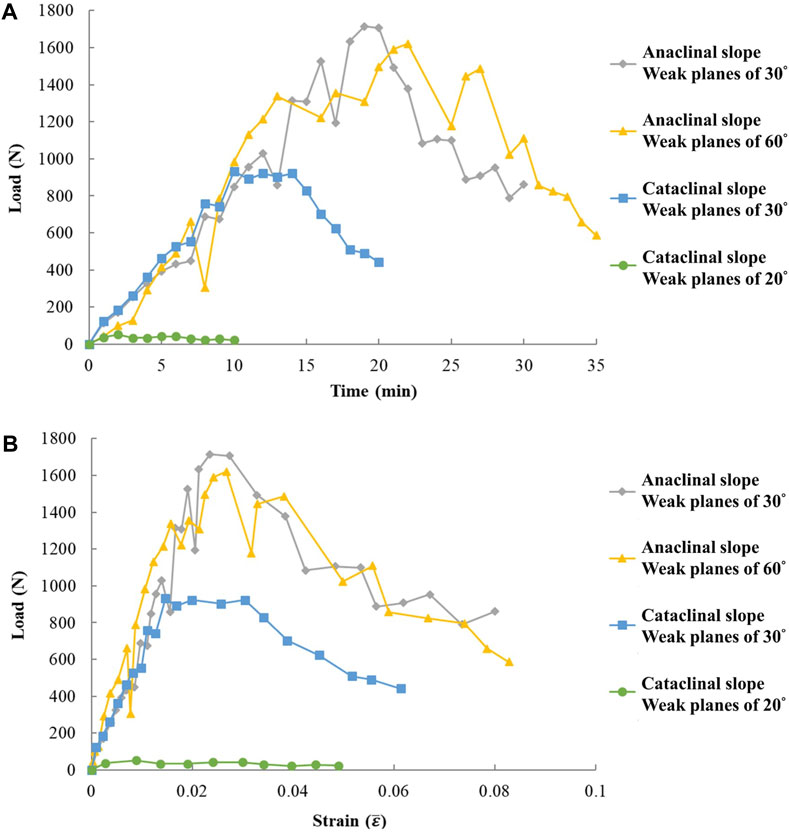
Figure 4. Experimental results of 20 mm weak plane spacing: relationship of (A) load and time, (B) load and average strain of the deformation area.
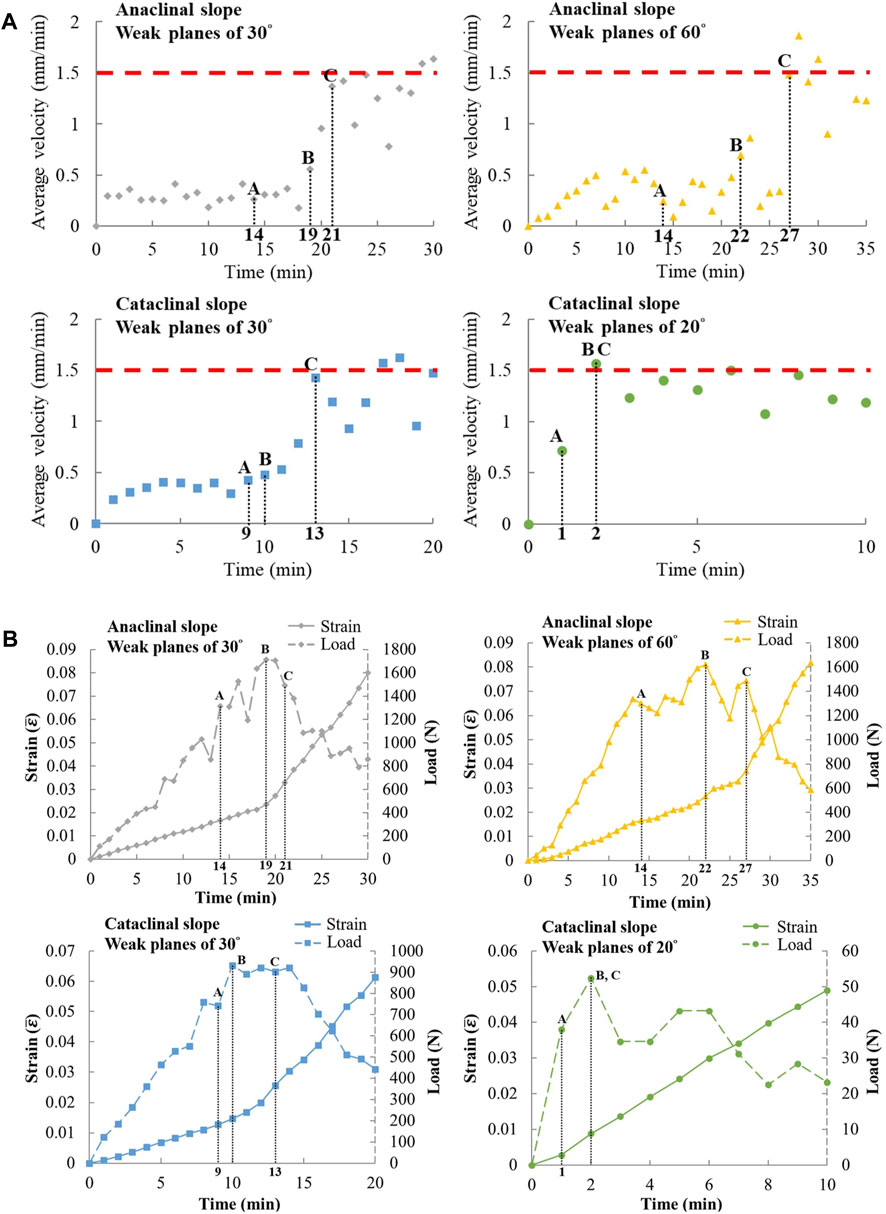
Figure 5. Experimental results of 20 mm weak plane spacing: (A) average velocity and time, (B) average strain and time [A: local failure initiation, B: peak load, C: sliding surface cuts through the slope).
The change in VR with time manifests the developing process of the sliding surface (Figure 6). VR approaches 1.0 as loading increases with time, signifying that the upper and the lower parts of the sliding body move at similar rates. The first time VR meets 1.0 is very close to the time when the sliding surface cuts through the slope (point C in Figure 5). In addition, cataclinal slopes with 20° weak planes can move easily along the weak plane. Therefore, such a case reaches peak load (point B in Figure 5) shortly after local failure (point A in Figure 5), and then the sliding surface cuts through the slope, making VR approximately 1.0.
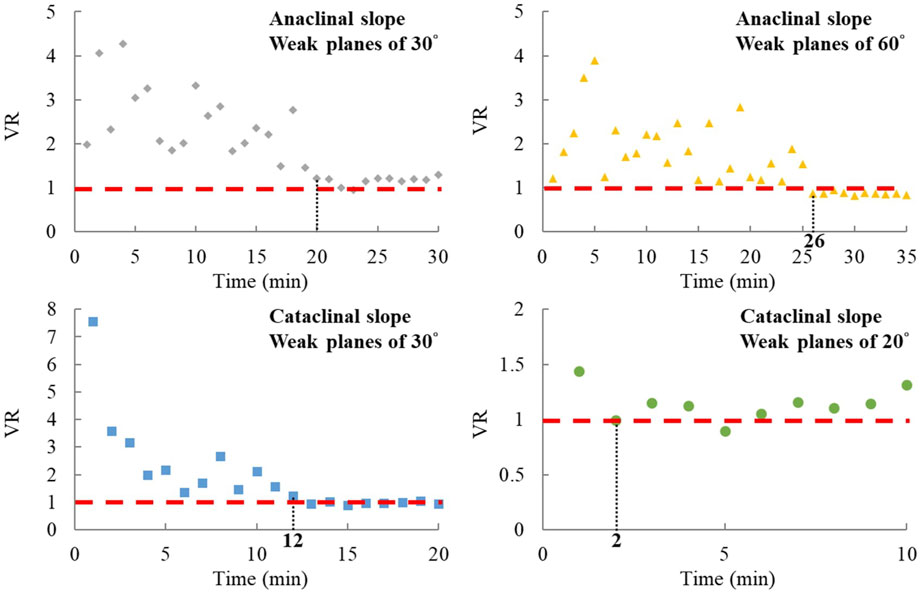
Figure 6. Experimental results of 20 mm weak plane spacing: change of velocity ratio (VR) with time, the vertical dashed line and its corresponding number indicates the time when VR approaches 1.
The test process of the 15 mm-spacing model is shown in Figure 7, which is similar to the slope model with spacing of 20 mm. In the process of loading, cracks appear first; i.e., local failure occurs, the sliding surface cuts through the slope, and then the sliding body moves substantially along the sliding surface. Notably, the load direction changes due to the slight inclination of the lower acrylic block after the sliding surface cuts through the slope and significant movement occurs (Figures 7A, B). In comparison of the shapes of the sliding surfaces, the tilt of the acrylic block may be attributed to the more curved shape of the sliding surface causing rotation of the sliding body after large displacement. For cases with 15 mm spacing, the peak loads of slopes in descending order are as follows: anaclinal slopes with 30° weak planes, anaclinal slopes with 60° weak planes, cataclinal slopes with 30° weak planes, and cataclinal slopes with 20° weak planes (Figure 8). This is identical to cases with 20 mm spacing. For the critical strain, anaclinal slopes with 60° weak planes provide the largest value, and cataclinal slopes with 20° weak planes provide the smallest value, but anaclinal and cataclinal slopes with 30° weak planes yield similar values.
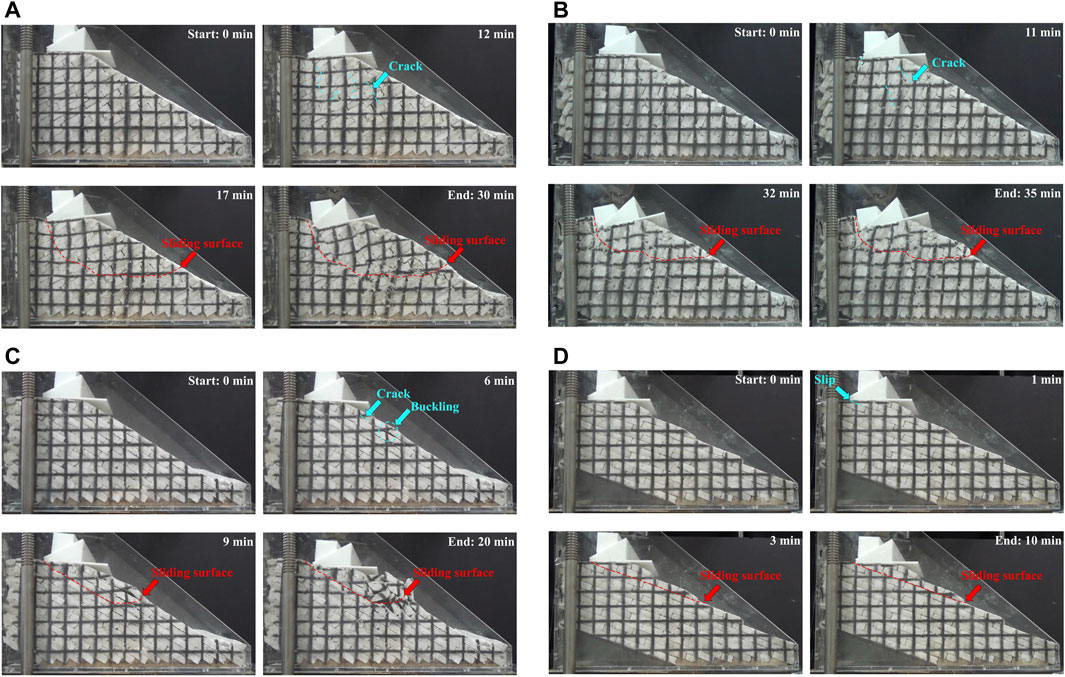
Figure 7. Deformation process of the physical model with 15 mm weak plane spacing, (A) anaclinal slope with weak plane dip angle 30°, (B) anaclinal slope with weak plane dip angle 60°, (C) cataclinal slope with weak plane dip angle 30° and (D) cataclinal slope with weak plane dip angle 20°.
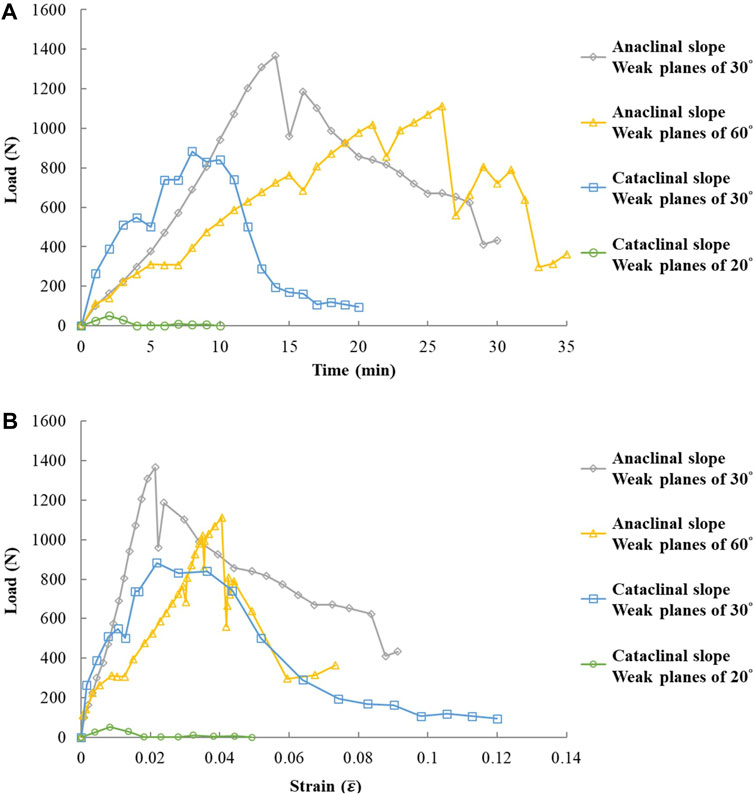
Figure 8. Experimental results of 15 mm weak plane spacing: relationship of (A) load and time, (B) load and average strain of the deformation area.
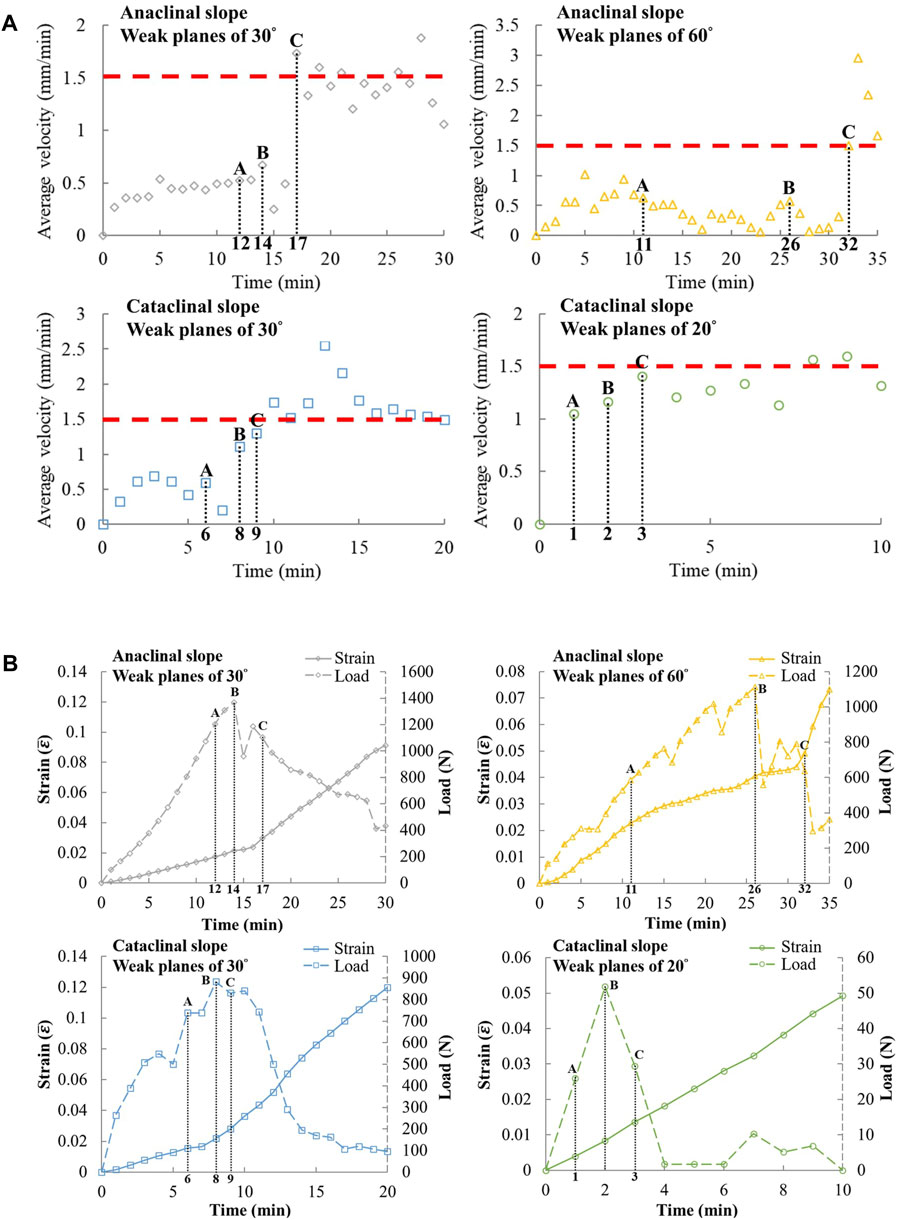
Figure 9. Experimental results of 15 mm weak plane spacing: (A) average velocity and time, (B) average strain and time (A: local failure initiation, B: peak load, C: sliding surface cuts through the slope).
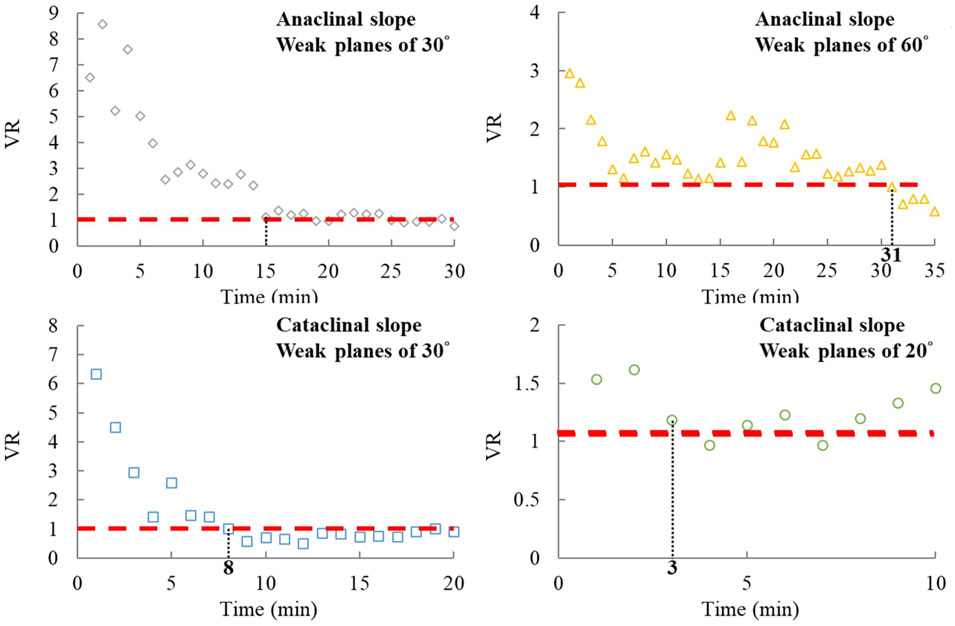
Figure 10. Experimental results of 15 mm weak plane spacing: change of VR with time, the vertical dashed line and its corresponding number indicates the time when VR approaches 1.
The Central Geological Survey of Taiwan has delineated many potential large-scale landslides (Lin et al., 2013), some of which has been investigated with field reconnaissance, borehole drilling, and monitoring. Based on the investigations, potential sliding surfaces may be predicted. Among 48 cases, 22 cases have clear features of scarp and sliding surface. Excluding the oblique slopes, we only take the cataclinal and anaclinal slopes into account. Herein, we estimate the average strain of a potential large-scale landslide according to Chigira (2009) as Eq. 3, which is slightly different from Eq. 2.
where do is the scarp length along the slope direction rather than average displacement of the deformation area in Eq. 2; lo has the same definition as in Equation 2; D is the scarp length in the aerial photo; L is the length from the top of the scarp to the toe of the deformation area in the aerial photo; β is the average slope angle. Figure 11A shows the topographic features of the Guanghua slope for estimating the average strain.
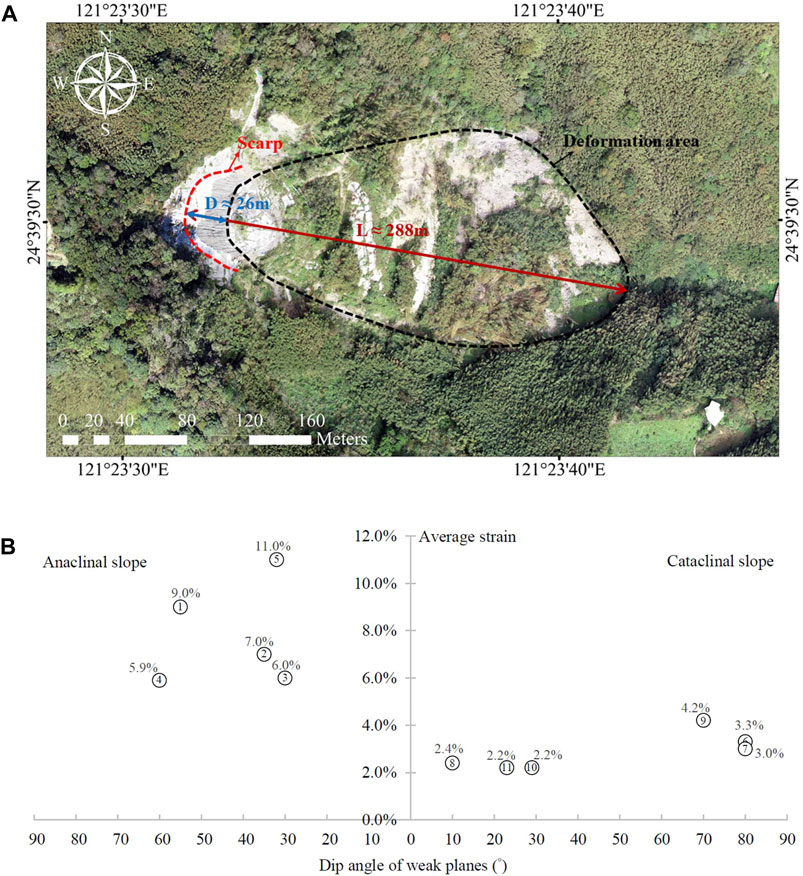
Figure 11. (A) The scarp length (D) and the length from the top of the scarp to the toe of the deformation area (L) in the aerial photo of the Guanghua slope, (B) average strain of real slopes.
In order to verify the trend of critical strain obtained from experiments, some potential large-scale landslide cases that have the topographic features to estimate their average strain are compared in Table 1 with respect to cataclinal and anaclinal slopes. These real slope cases are mostly comprised of argillite, slate and metasandstone, where six of them are cataclinal slopes and five are anaclinal slopes. Similar to experimental results, the real slopes show the trend that the anaclinal slopes exhibit greater average strain than the cataclinal slopes (Figure 11B).
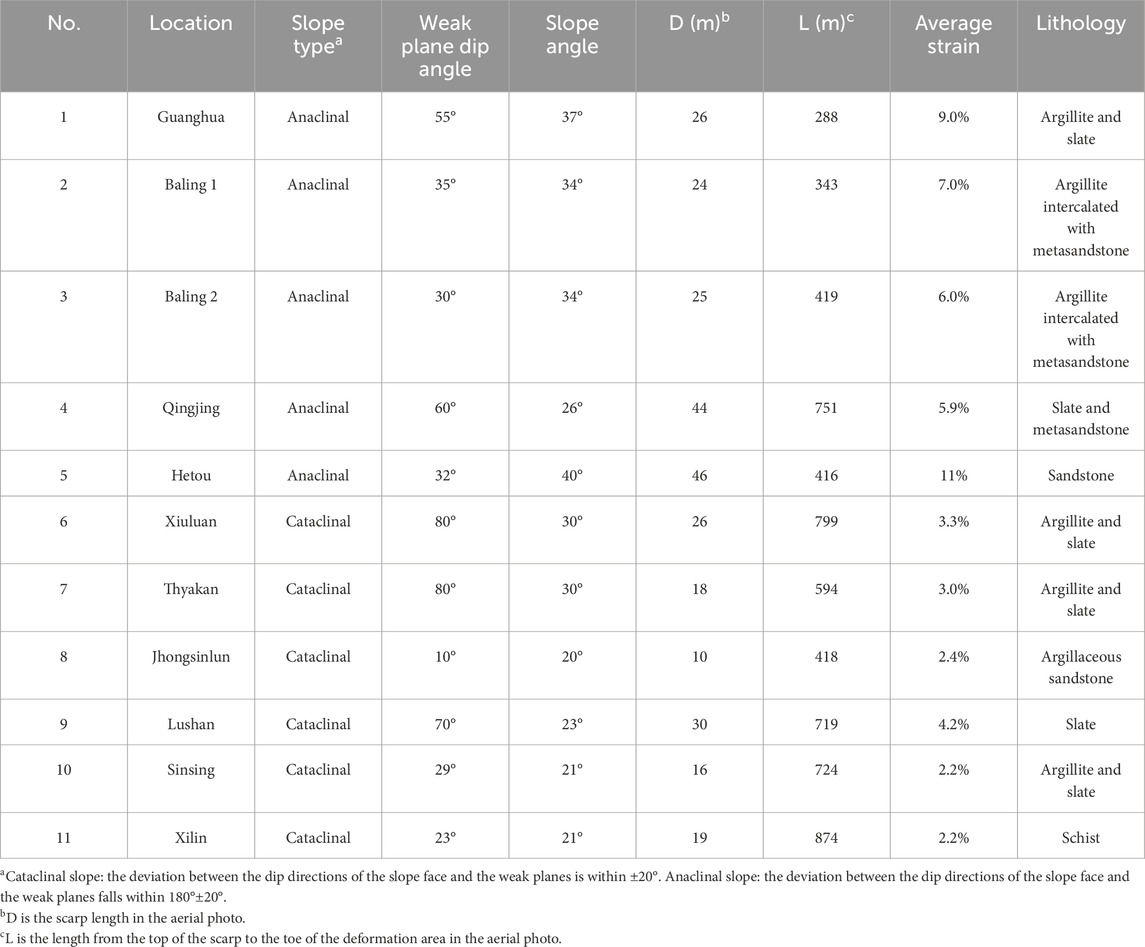
Table 1. Average strain of real slopes.
Deep-seated landslides involve multiple geological conditions and environmental factors. There are limitations to acquiring complete information on slope deformation and collapse in the field. Alternatively, a small-scale slope model test is a viable alternative. Considering the similitude criterion (Yang G. et al., 2018), the small-scaled slope model should adopt a material with downscaled properties. Although we could produce cemented sand of even smaller strength, ruptures occurred when piling the cemented sand plates. Moreover, the stresses in the slope model caused by inclined loading may not fully simulate those in a real slope. Even so, it is believed that the experimental results can be used to relatively compare the deformation and collapse behavior of slopes with various weak plane orientations.
The deformation processes of the four cases with different weak plane orientations are similar, either with 15 mm or 20 mm weak plane spacing (Figures 3, 7). Cataclinal slopes with daylighting weak planes (20° weak plane) sustain exceptionally small load values (Figure 12A) among these cases. The cases with a larger spacing present a higher bearing capacity. The average strain-time relation generally exhibits one turning point, which is close to point C, when the sliding body cuts through the slope (Figure 12B). Before point C, the average strain rates of cases with larger spacing are usually smaller, except for cataclinal slopes with daylighting weak planes. However, the results do not show a clear trend for the critical strains in comparison of two spacing values (Figure 12C). Table 2 lists deformation areas estimated through PIVlab. Regardless of the spacing, all slopes show that anaclinal slopes with 30° weak planes produce the largest sliding body and that cataclinal slopes with 20° weak planes develop the smallest sliding body.
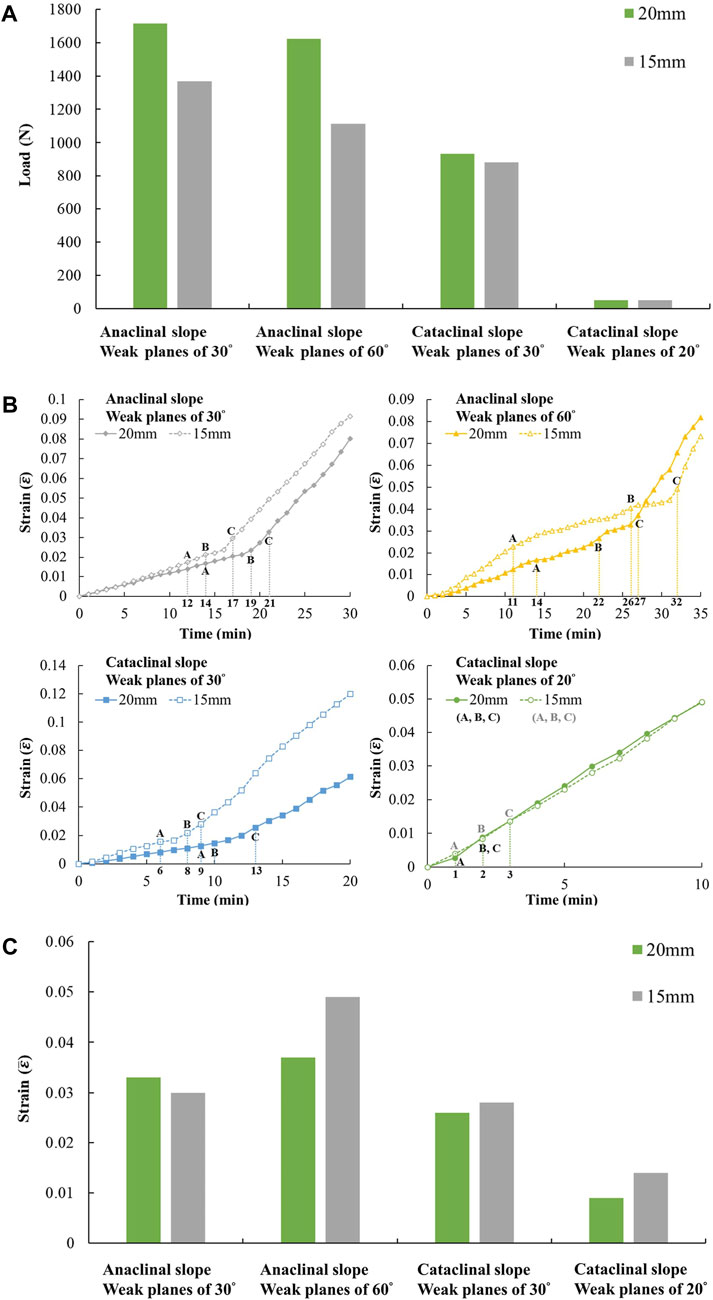
Figure 12. (A) Comparison of peak load between different values of weak plane spacing and comparison between different values of weak plane spacing, (B) average strain and time, (C) critical strain, the average strain as the sliding surface cuts through the slope.
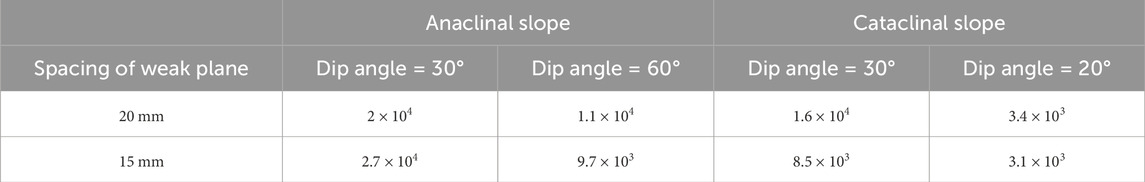
Table 2. Deformation area for each experimental model (unit: mm2).
Many cases in Taiwan show that slopes have experienced many slides in decades and not yet leaded to collapse. Limited sliding in a slope does not necessarily mean imminent danger of collapse. Figure 13 indicates that local failures arise at a smaller average strain, and as the average strain accumulates to a certain extent, the sliding surface may cut through slope, which facilitates a collapse. For cases with 20 mm or 15 mm spacing, the average strain corresponding to local failure and collapse of slopes in descending order are as follows: anaclinal slopes with 60° weak planes, anaclinal slopes with 30° weak planes, cataclinal slopes with 30° weak planes and cataclinal slopes with 20° weak planes. The critical strains for slopes with 20 mm spacing are between 0.01 and 0.04, and for slopes with 15 mm spacing, the critical strains are between 0.01 and 0.05. The critical strain values of real-scale slopes may vary with different factors such as weak plane orientation and spacing, depth of the sliding surface, strength of slope material, etc. The experimental results are used to compare the slopes with various weak plane orientations, and the critical strain values do not fully reflect those of slopes in the field.
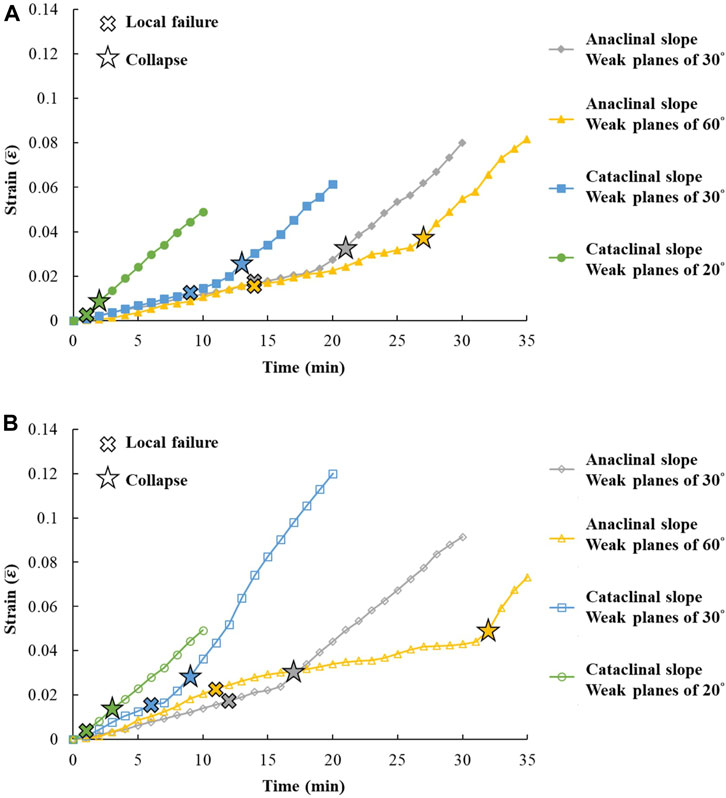
Figure 13. The average strain at local failure and collapse, (A) weak plane spacing of 20 mm and (B) weak plane spacing of 15 mm.
The deformation analysis in experiments enables us to quantify displacements everywhere in the slope. The average strain in the sliding body is considered after Eq. 2. For real slopes, extensive underground displacement data are unavailable, and the scarp length along the slope direction is considered as Eq. 3, which was proposed by Chigira (2009). In general, the strain of the upper slope is larger than that of the lower slope. Thus, the average strain calculated by Eq. 2 is smaller than that by Eq. 3. Moriwaki (2001) reported smaller critical strain values between 0.006 and 0.02 from shallow landslides and soil slope models. For rock slopes, Chigira (2009) reported critical strain values between 0.01 and 0.16. Unlike the critical strain, it should be noted that Table 1 shows the average strain of real cases of cataclinal and anaclinal slopes at their current state, and the slopes have not collapsed yet. The average strain values are between 0.02 and 0.11. For the real slopes, the anaclinal slopes show greater average stain than the cataclinal slopes, which is similar to the trend of the critical strain revealed by physical slope models.
Compared to the limited sliding of local failure, slope collapse is of paramount importance because it can cause enormous damage and casualties. In both unstable conditions, the factor of safety less than unity may be obtained in the traditional slope stability analysis. To assess whether a deforming slope is going to collapse or whether a warning is necessary requires further understanding of the deformation behavior of slopes. This study reveals that slope collapse occurs after the peak load; when the slope approaches collapse, the average velocity and average strain rate increase, and VR approaches one. In practice, the warning of slope collapse is usually based on the increase in monitored velocity (Federico et al., 2012; Xu et al., 2020), but after the increase, the velocity may drop and the slope may remain stable afterward. Hence, an additional consideration of the VR and the critical strain for issuing a warning of slope collapse is suggested. A possible way of building a warning system that include strain monitoring can be achieved by including borehole strainmeter (Langbein, 2015; Chen et al., 2021) in current intelligent real-time and early warning system (Xu et al., 2020; Fang et al., 2024).
Moreover, when a slope is unstable and intermittent deep-seated slides are measured, the possibility of imminent collapse differs among slopes with various orientations of weak planes. For example, the anaclinal slope with 60° weak planes may have a lower possibility of imminent collapse due to its greater critical strain. In contrast, the cataclinal slope with daylighting weak planes may have a higher possibility of imminent collapse due to its smaller critical strain.
Understanding the deformation and collapse behavior of slopes is crucial for assessing collapse potential and setting up a warning system. It is known that deep-seated landslides may be affected by weak planes. To clarify this effect, this study conducted topographic analysis for real slopes and physical slope models using artificial cemented sand plates with four weak plane orientations and two spacing values. In experiments, inclined load was applied at the top of the slope model, and the process was analyzed by PIV to acquire the average strain at collapse, which is termed critical strain. The results demonstrate that as loading increases, local failure takes place first. After the peak load, the average velocity and average strain rate increase; then, the sliding surface cuts through the slope, and the slope collapses. The deformation characteristics can be summarized as follows:
1. For the average strain at local failure and at collapse, the slopes showing the values ranging from greatest to least are the anaclinal slope with 60° weak planes, the anaclinal slope with 30° weak planes, the cataclinal slope with coinciding weak planes and the slope face, and the cataclinal slope with daylighting weak planes.
2. Slopes showing the peak load from greatest to least are anaclinal slopes with 30° weak planes, anaclinal slopes with 60° weak planes, cataclinal slopes with coinciding weak planes and the slope face, and the cataclinal slope with daylighting weak planes.
3. For the sliding body, the anaclinal slope with 30° weak planes is the largest, and the cataclinal slope with daylighting weak planes is the smallest.
4. The real slopes at the current state show a similar trend as experimental results. The anaclinal slopes exhibit greater average strain than cataclinal slopes.
5. Slope instability does not mean imminent danger of collapse. As the average velocity and average strain rate increase or the velocity ratio of the upper and lower parts of the slope is close to one, small cracks inside the slope are very likely to coalesce, and a sliding surface is forming. Such phenomena can therefore serve as a warning of slope collapse.
6. The slopes with daylighting weak planes and coinciding weak planes and the slope face show a relatively small critical strain compared to other slopes. Hence, instability or sliding may lead to a higher probability of collapse.
The original contributions presented in the study are included in the article/supplementary material, further inquiries can be directed to the corresponding author.
K-TC: Conceptualization, Funding acquisition, Methodology, Supervision, Writing–original draft. P-TY: Methodology, Software, Visualization, Writing–original draft. Y-SH: Conceptualization, Methodology, Validation, Writing–review and editing. C-YW: Methodology, Writing–original draft. Y-CC: Data curation, Supervision, Writing–review and editing.
The author(s) declare that financial support was received for the research, authorship, and/or publication of this article. This research is supported by the National Science and Technology Council, Taiwan (previously known as the Ministry of Science and Technology) through Grant No. MOST 109-2625-M-005-011.
The support of this research by the National Science and Technology Council, Taiwan through grant No. MOST 109-2625-M-005-011 is gratefully acknowledged.
The authors declare that the research was conducted in the absence of any commercial or financial relationships that could be construed as a potential conflict of interest.
All claims expressed in this article are solely those of the authors and do not necessarily represent those of their affiliated organizations, or those of the publisher, the editors and the reviewers. Any product that may be evaluated in this article, or claim that may be made by its manufacturer, is not guaranteed or endorsed by the publisher.
Adhikary, D. P., Dyskin, A. V., Jewell, R. J., and Stewart, D. P. (1997). A study of the mechanism of flexural toppling failure of rock slopes. Rock Mech. Rock Eng. 30, 75–93. doi:10.1007/BF01020126
Aydan, O. (1989). “The stabilization of rock engineering structures by rockbolts,”. [dissertation] (Nagoya, Aichi: Nagoya University).
Chang, K. T., Ge, L., and Lin, H. H. (2015). Slope creep behavior: observations and simulations. Environ. Earth Sci. 73, 275–287. doi:10.1007/s12665-014-3423-2
Chang, K. T., and Huang, H. C. (2015). Three-dimensional analysis of a deep-seated landslide in Central Taiwan. Environ. Earth Sci. 74, 1379–1390. doi:10.1007/s12665-015-4128-x
Chen, C. C., Li, H. H., Chiu, Y. C., and Tsai, Y. K. (2020). Dynamic response of a physical anti-dip rock slope model revealed by shaking table tests. Eng. Geol. 277, 105772. doi:10.1016/j.enggeo.2020.105772
Chen, C. Y., Hu, J. C., Liu, C. C., and Chiu, C. Y. (2021). Abnormal strain induced by heavy rainfall on borehole strainmeters observed in Taiwan. Appl. Sci. 11, 1301. doi:10.3390/app11031301
Cheng, Y., Huo, A., Zhao, Z., and Peng, J. (2021). Analysis of loess fracture on slope stability based on centrifugal model tests. Bull. Eng. Geol. Environ. 80, 3647–3657. doi:10.1007/s10064-021-02135-3
Chigira, M. (1992). Long-term gravitational deformation of rocks by mass rock creep. Eng. Geol. 32, 157–184. doi:10.1016/0013-7952(92)90043-X
Chigira, M. (2009). September 2005 rain-induced catastrophic rockslides on slopes affected by deep-seated gravitational deformations, Kyushu, southern Japan. Eng. Geol. 108, 1–15. doi:10.1016/j.enggeo.2009.03.005
Fang, K., Dong, A., Tang, H. M., An, P. J., Wang, Q. Y., Jia, S. X., et al. (2024). Development of an easy-assembly and low-cost multismartphone photogrammetric monitoring system for rock slope hazards. Int. J. Rock Mech. Rock Eng. 174 (2), 105655. doi:10.1016/j.ijrmms.2024.105655
Federico, A., Popescu, M., Elia, G., Fidelibus, C., Internò, G., and Murianni, A. (2012). Prediction of time to slope failure: a general framework. Environ. Earth Sci. 66, 245–256. doi:10.1007/s12665-011-1231-5
Gong, Y., Yao, A., Li, Y., Li, Y., Li, Y., and Sun, Y. (2023). Model test study on sliding-toppling composite deformation evolution of anti-dip layered rock slope. Bull. Eng. Geol. Environ. 82, 194. doi:10.1007/s10064-023-03213-4
Huang, D., Ma, H., and Huang, R. (2022). Deep-seated toppling deformations of rock slopes in western China. Landslides 19, 809–827. doi:10.1007/s10346-021-01829-9
Huang, X. W., Yao, Z. S., Wang, W., Zhou, A. Z., and Jiang, P. M. (2021). Stability analysis of soil-rock slope (SRS) with an improved stochastic method and physical models. Environ. Earth Sci. 80, 649. doi:10.1007/s12665-021-09939-2
Indraratna, B. (1990). Development and applications of a synthetic material to simulate soft sedimentary rocks. Géotechnique 40, 189–200. doi:10.1680/geot.1990.40.2.189
Jaboyedoff, M., Derron, M. H., Pedrazzini, A., Blikra, L., Crosta, G. B., Froese, C. R., et al. (2012). “Fast assessment of susceptibility of massive rock instabilities,” in Landslides and engineering slopes: protecting society through improved understanding, proceedings of the 11th international and 2nd north American symposium on landslides and engineered slopes (Canada: Banff), 3–8.
Jaboyedoff, M., Penna, I., Pedrazzini, A., Baroň, I., and Crosta, G. B. (2013). An introductory review on gravitational-deformation induced structures, fabrics and modeling. Tectonophysics 605, 1–12. doi:10.1016/j.tecto.2013.06.027
Koizumi, K., Sakuradani, K., Oda, K., Komatsu, M., and Ito, S. (2018). Relationship between initial quasi-saturated volumetric water content and rainfall-induced slope deformation based on a model slope experiment. J. GeoEng. 13 (4), 179–187. doi:10.6310/jog.201812_13(4).3
Langbein, J. (2015). Borehole strainmeter measurements spanning the 2014 Mw6.0 South Napa Earthquake, California: the effect from instrument calibration. J. Geophys. Res. Solid Earth 120, 7190–7202. doi:10.1002/2015JB012278
Li, X. S., Li, Q. H., Wang, Y. M., Liu, W., Hou, D., Zheng, W. B., et al. (2023). Experimental study on instability mechanism and critical intensity of rainfall of high-steep rock slopes under unsaturated conditions. Int. J. Rock Mech. Rock Eng. 33 (10), 1243–1260. doi:10.1016/j.ijmst.2023.07.009
Lin, C. C., and Lo, C. M. (2018). Investigation of rainfall-induced failure processes and characteristics of cataclinal and anaclinal slopes using physical models. Environ. Earth Sci. 77, 210. doi:10.1007/s12665-018-7387-5
Lin, C. W., Tseng, C. M., Tseng, Y. H., Fei, L. Y., Hsieh, Y. C., and Tarolli, P. (2013). Recognition of large scale deep-seated landslides in forest areas of Taiwan using high resolution topography. J. Asian Earth Sci. 62, 389–400. doi:10.1016/j.jseaes.2012.10.022
Lin, H. H., Lin, M. L., Lu, J. H., Chi, C. C., and Fei, L. Y. (2020). Deep-seated gravitational slope deformation in Lushan, Taiwan: transformation from cleavage-controlled to weakened rockmass-controlled deformation. Eng. Geol. 264, 105387. doi:10.1016/j.enggeo.2019.105387
Lo, C. M., and Weng, M. C. (2017). Identification of deformation and failure characteristics in cataclinal slopes using physical modeling. Landslides 14, 499–515. doi:10.1007/s10346-016-0735-1
Margielewski, W. (2006). Structural control and types of movements of rock mass in anisotropic rocks: case studies in the Polish Flysch Carpathians. Geomorphology 77, 47–68. doi:10.1016/j.geomorph.2006.01.003
Moriwaki, H. (2001). A risk evaluation of landslides in use of critical surface displacement. Landslides. J. Jpn. Landslide Soc. 38, 115–122. doi:10.3313/jls1964.38.2_115
Nichol, S. L., Hungr, O., and Evans, S. G. (2002). Large-scale brittle and ductile toppling of rock slopes. Can. Geotech. J. 39, 773–788. doi:10.1139/t02-027
Petley, D. N., Higuchi, T., Petley, D. J., Bulmer, M. H., and Carey, J. (2005). Development of progressive landslide failure in cohesive materials. Geol. 33, 201–204. doi:10.1130/G21147.1
Roy, S., Baruah, A., Misra, S., and Mandal, N. (2015). Effects of bedrock anisotropy on hillslope failure in the Darjeeling-Sikkim Himalaya: an insight from physical and numerical models. Landslides 12, 927–941. doi:10.1007/s10346-014-0513-x
Singh, P. K., Singh, K. K., and Singh, T. N. (2017). Slope failure in stratified rocks: a case from NE Himalaya, India. Landslides 14, 1319–1331. doi:10.1007/s10346-016-0785-4
Song, Z. H., and Tan, Y. (2021). Experimental investigation on the influences of rainfall patterns on instability of sandy slopes. Environ. Earth Sci. 80, 803. doi:10.1007/s12665-021-10118-6
Sun, P., Wang, G., Wu, L. Z., Igwe, O., and Zhu, E. (2019). Physical model experiments for shallow failure in rainfall-triggered loess slope, Northwest China. Bull. Eng. Geol. Environ. 78 (6), 4363–4382. doi:10.1007/s10064-018-1420-5
Sun, Q. Z., Zhao, L. H., Qin, Y. G., and Liu, B. Y. (2023). Experimental study on the failure of loose accumulation landslides under rainfall conditions. Front. Earth Sci. 28. doi:10.3389/feart.2023.1291592
Tu, G., Deng, H., Shang, Q., Zhang, Y., and Luo, X. (2020). Deep-seated large-scale toppling failure: a case study of the lancang slope in southwest China. Rock Mech. Rock Eng. 53, 3417–3432. doi:10.1007/s00603-020-02132-0
Wang, L., Hwang, J. H., Luo, Z., Juang, C. H., and Xiao, J. (2013). Probabilistic back analysis of slope failure – a case study in Taiwan. Comput. Geotech. 51, 12–23. doi:10.1016/j.compgeo.2013.01.008
Wang, W. N., Chigira, M., and Furuya, T. (2003). Geological and geomorphological precursors of the Chiu-fen-erh-Shan landslide triggered by the Chi-Chi earthquake in central Taiwan. Eng. Geol. 69, 1–13. doi:10.1016/S0013-7952(02)00244-2
Wang, Y. F., Cheng, Q. G., Lin, Q. W., Li, K., and Ji, Y. D. (2022). Insights into the differential fragmentation processes in rock avalanche emplacement from field investigation and experimental study. Front. Earth Sci. 10. doi:10.3389/feart.2022.980919
Weng, M. C., Lo, C. M., Wu, C. H., and Chuang, T. F. (2015). Gravitational deformation mechanisms of slate slopes revealed by model tests and discrete element analysis. Eng. Geol. 189, 116–132. doi:10.1016/j.enggeo.2015.01.024
Xu, Q., Penga, D., Zhang, S., Zhu, X., He, C., Qi, X., et al. (2020). Successful implementations of a real-time and intelligent early warning system for loess landslides on the Heifangtai terrace, China. Eng. Geol. 278, 105817. doi:10.1016/j.enggeo.2020.105817
Yang, G., Qi, S., Wu, F., and Zhan, Z. (2018a). Seismic amplification of the anti-dip rock slope and deformation characteristics: a large-scale shaking table test. Soil Dyn. Earthq. Eng. 115, 907–916. doi:10.1016/j.soildyn.2017.09.010
Yang, Y. C., Xing, H. G., Yang, X. G., Chen, M. L., and Zhou, J. W. (2018b). Experimental study on the dynamic response and stability of bedding rock slopes with weak interlayers under heavy rainfall. Environ. Earth Sci. 77, 433. doi:10.1007/s12665-018-7624-y
Zhu, C., He, M., Karakus, M., Cui, X., and Tao, Z. (2020). Investigating toppling failure mechanism of anti-dip layered slope due to excavation by physical modelling. Rock Mech. Rock Eng. 53 (11), 5029–5050. doi:10.1007/s00603-020-02207-y
Keywords: experiment, rock slope, deep-seated landslide, slope deformation, weak plane orientation
Citation: Chang K-T, Yeh P-T, Hsiao Y-S, Wang C-Y and Chiu Y-C (2024) Deformation and collapse of rock slopes considering weak plane orientation. Front. Earth Sci. 12:1402027. doi: 10.3389/feart.2024.1402027
Received: 16 March 2024; Accepted: 02 May 2024;
Published: 17 June 2024.
Edited by:
Hans-Balder Havenith, University of Liège, BelgiumReviewed by:
Chun Zhu, Hohai University, ChinaCopyright © 2024 Chang, Yeh, Hsiao, Wang and Chiu. This is an open-access article distributed under the terms of the Creative Commons Attribution License (CC BY). The use, distribution or reproduction in other forums is permitted, provided the original author(s) and the copyright owner(s) are credited and that the original publication in this journal is cited, in accordance with accepted academic practice. No use, distribution or reproduction is permitted which does not comply with these terms.
*Correspondence: Ya-Chu Chiu, Y2xhcmljZS5jaGlvdUBnbWFpbC5jb20=
Disclaimer: All claims expressed in this article are solely those of the authors and do not necessarily represent those of their affiliated organizations, or those of the publisher, the editors and the reviewers. Any product that may be evaluated in this article or claim that may be made by its manufacturer is not guaranteed or endorsed by the publisher.
Research integrity at Frontiers
Learn more about the work of our research integrity team to safeguard the quality of each article we publish.