 Wei Zhang1
 Jikai Liu
94% of researchers rate our articles as excellent or good
Learn more about the work of our research integrity team to safeguard the quality of each article we publish.
Find out more
ORIGINAL RESEARCH article
Front. Earth Sci. , 18 July 2024
Sec. Atmospheric Science
Volume 12 - 2024 | https://doi.org/10.3389/feart.2024.1398638
Wind plays a crucial role in shaping climatic and environmental conditions; however, its spatial and temporal variabilities over land remain poorly understood. This study utilizes combined datasets from multiple satellite platforms to examine the spatial patterns and temporal trends of wind speed over land during the past 30 years (1988–2017). The results demonstrate a significantly increasing trend in global wind speed, with variations on both annual and monthly scales. Spatially, wind speeds are lower in low-latitude regions, particularly in the tropics. High wind speeds primarily occur in mid- to high-latitude regions, with the highest speeds observed in the Arctic. Temporally, wind speed trends are characterized by an increase in low-speed winds and decrease in high-speed winds. Overall, wind speed shows a significant correlation with temperature in the Amazon, northern Europe, and central Asia. Negative wind–temperature correlation is confined to small regions in central North America and northern Africa. The findings of this study help clarify wind trends, providing valuable insights for future research on global climate and environmental change.
Wind is an important climate variable because it is one of the fundamental components of the Earth’s climate system. It is responsible for transferring heat and energy across the Earth’s surface and influencing climate patterns and weather events around the globe (Zhang et al., 2013). Changes in wind speed and direction can drive the development of and changes in weather systems, such as high and low pressure systems, which in turn influence precipitation patterns, temperatures, and storm formation (Yang et al., 2017). Furthermore, wind speed is a decisive factor in the potential of wind power generation, as higher wind speeds generally mean higher energy output and are critical to the growth of the wind industry (Wang et al., 2015). Understanding the wind and how it may be changing are important elements of projecting climatic adaptation and environmental management (Korhonen et al., 2010; Wang et al., 2015; Yang et al., 2017).
Several approaches have been developed to monitor wind speed which can be divided into in situ site methods, climate modeling, and satellite remote sensing. Weather stations usually measure wind speed through anemometers (Wilczak et al., 2001). Although accurate, the spatial representativeness of these stations is poor, leaving great spatial uncertainty for capturing wind speed over a large region (Hobby et al., 2013). Climate models simulate wind based on the physical connection with climatic variables and can estimate the wind over different spatial scales with strong physical mechanism (Giannaros et al., 2017). However, the performance of models depends greatly on their assumptions and structure, causing uncertainty and weakening their application (Wang et al., 2011; Torralba et al., 2017). Alternatively, satellite remote sensing retrieves wind speed by measuring the correlation with brightness and temperature based on the radiative transfer function which helps to capture the wind accurately over large regions and has been increasing applied in recent decades (Wentz, 1992; Clarizia and Ruf, 2016). The main limitation of satellite wind data is its lifetime. To overcome this limitation, the integration of multi-satellite platforms has been proposed to produce long-range data sets of wind speed, which is showing great application (Wentz, 2015; Carr and Wu, 2018).
With the aid of the various datasets, wind speed has been analyzed over various regions. Young and colleagues have analyzed the wind over the ocean (Young et al., 2011; Young and Ribal, 2019) but not over the land. Terrestrial wind exerts a closer and more direct effect on humans, which has attracted increasing recent attention. Dadaser-Celik and Cengiz (2014) have examined the spatial and temporal dynamics of wind speeds over Turkey by analyzing data from 206 weather stations from 1975 to 2006. Laapas and Venäläinen (2017) analyzed monthly wind speed in Finland with the aid of 144 weather stations. Analyses of large regions (i.e., global or continent-wide) are relative rare. Azorin-Molina et al. (2018) examined wind speed trends at the land–ocean interface. Yin (2000) analyzed the spatial pattern of surface land wind with the aid of 1506 weather stations, although not temporal trends. The latest study of Jung (Jung et al., 2019) analyzed the long-term trends and inter-annual variability of global wind energy at a national scale, although the spatial details of the trend were still unclear. Most studies have declared the “stilling” of wind speed. However, great uncertainty has been aroused from different wind products (Torralba et al., 2017), triggering much controversy. For example, Li et al. (2018) found the recovery of surface wind speed in northwest China after decades of decrease from the 1960s. A similar trend has also been observed in South Korea (Kim and Paik, 2015). There is a strong need for a more direct and effective way to capture wind-speed change.
Given this overview, details of wind-speed trends over land are rare, which creates uncertainty for the investigation of global climate and environment change. The present study collects global wind speed observation data—including from ground weather stations, satellite remote sensing data, and climate model output—analyzes the changes of wind speed on different time scales, studies the spatial distribution and changes of wind speed in different geographical locations around the world, and explores the potential drivers of wind speed changes. It uses a cross-calibrated multi-platform grid surface vector wind dataset to assess wind patterns and trends. These datasets combine cross-calibrated satellite microwave wind observations with instrument observations using variational analysis. The goal of this study is to capture spatial patterns and temporal trends in global land-wind speeds and identify their potential drivers. To achieve this goal, spatial pattern analysis, temporal trend analysis, and potential driver identification are used. The methods and corresponding data sets are described in Section 2. The results are presented in Section 3. The conclusions and discussions are provided in Section 4. This study should be valuable for understanding patterns of global wind speed and supporting further research on global climate change.
Several data sources, including the wind and relevantly correlated variables, are used for this investigation.
The data from the Cross-Calibrated Multi-Platform’s (CCMP) gridded surface vector winds (www.remss.com/measurements/ccmp) is used to evaluate the pattern and trend of wind in this study. These datasets combine cross-calibrated satellite microwave winds and instrument observations using a variational analysis method (VAM) to produce high-resolution (0.25°) gridded analyses at a height of 10 m from 1988 to 2017. Satellite wind retrieval derived by remote sensing systems from a number of satellite-borne passive and active microwave instruments are used (Wentz, 2015). The data is validated against ocean moored buoys, which confirm that the measurements are in agreement (to within 0.8 m/s).
Besides wind speed data, temperature and vegetation datasets are also used in this analysis. Air temperature (Ta) data was taken from the GHCN_CAMS Gridded 2 m Temperature (Land) from 1948 to near present (https://www.esrl.noaa.gov/psd/data/gridded/data.ghcncams.html) at a spatial solution of 0.5°. These data use a combination of two large individual datasets of station observations collected from the Global Historical Climatology Network version 2 and the Climate Anomaly Monitoring System (GHCN + CAMS) by some unique interpolation methods, such as anomaly interpolation with spatially-temporally varying temperature lapse rates derived from observation-based reanalysis for topographic adjustment (Fan and Dool, 2008).
Normalized Difference Vegetation Index (NDVI) data is used to represent vegetation cover in this study. For the vegetation evaluation, the MODIS/Terra Vegetation Indices Monthly L3 Global 0.05Deg CMG (MODIS MOD13C2) was obtained from http://doi.org/10.5067/MODIS/MOD13C2.006. The data are cloud-free spatial composites of the gridded 16-day 1-km MOD13C2A2 from the year 2000 and are provided as a level-3 product projected on a 0.05° (5600-m) geographic climate modeling grid (CMG). Cloud-free global coverage is achieved by replacing clouds with the historical MODIS time-series climatology record (Didan et al., 2015).
All datasets are resampled at 1° to match the spatial resolution and then analyzed on monthly or annual scales.
The core objective of this study is to understand and describe the spatial distribution characteristics of global-land wind speed and its changes over time and to further explore the potential factors influencing these changes. In order to achieve this goal, the following methods were adopted. Mathematical statistics were used to analyze wind-speed data, including calculating annual average wind speed, standard difference, and other statistical indicators. Correlation analysis is applied to explore the relationship between wind speed and other environmental variables such as temperature, air pressure, and vegetation conditions. Geographic information system (GIS) technology was used to visualize and analyze the spatial distribution of wind speed. GIS tools are used for spatial interpolation to estimate and plot wind speed in areas without direct observational data. Trend analysis using a linear regression model to determine the trend of wind speed over time analyzed its slope and intercept. Trends are evaluated on different time and spatial scales. We explored, identified, and assessed potential drivers of wind-speed change, such as land-cover change, land-use change, and climate change. The relationship between these factors and wind speed was quantified by mathematical statistics. Although simple, the methods have proved useful and effective in previous climatic and environmental studies (Jong et al., 2011; Young et al., 2011; McDonald et al., 2015; Young and Ribal, 2019).
(1) Spatial pattern analysis. The multiyear mean of wind speed is calculated at each pixel over land. GIS spatial analysis is used to describe the spatial pattern of the wind speed. Standard deviation is one of the most commonly used statistics to measure spatial variability, reflecting the dispersion of wind speed values around the mean. Furthermore, the indicator of “mean ± SD” (where
(2) Temporal trend analysis. The trend is represented by the slope of linear regression, which can be written as (Eq. 1):
where y and x are the dependent (wind speed) and independent (time) variables, and a is the regression slope, which suggests the temporal trend. b is the intercept. The trend is evaluated at various spatial and temporal scales. Spatially, the evaluation of global mean and pixel-wise are carried out. Temporally, the trend is capture on both annual and monthly scales. When using linear regression for wind trend analysis, it is important to ensure that the data satisfy the basic assumptions of the linear regression model, including linear relationships, independence, homoscedasticity, and normal distribution.
(3) Potential driving factor identification. Correlation analysis is used to identify the potential driving factors of the wind speed. Correlation analysis is an important method for this, and it can reveal statistical associations between different variables. Physically, wind originates from atmospheric pressure gradients and the earth’s rotation (Yin, 2000) and is slowed by friction from surface irregularities (Bichet et al., 2012). The atmospheric pressure is further determined by temperature change. Therefore, we further evaluate the correlations of wind with near surface temperature and terrain and vegetation conditions.
Global wind speed analysis is important for several fields for a number of reasons. In climate change research, wind speed is a key indicator of climate change. By analyzing changes in wind speed, scientists can better understand how the global climate system responds to changes in both natural and human factors. Wind energy is also one of the most important renewable energy sources. Understanding the distribution and trends of global wind speeds is essential for assessing wind energy resources and siting and designing wind farms. Furthermore, wind-speed data are critical for improving the accuracy of weather forecasts and the reliability of long-term climate predictions. Moreover, in environmental impact assessments, wind speed can affect air quality because it contributes to the dispersal of pollutants. Understanding wind speed patterns is important for assessing and managing environmental quality. Wind speed also has a direct impact on agricultural activities, such as the transpiration and irrigation needs of crops. Strong winds can also cause physical damage to crops. In transport, wind speed has a significant impact on modes of transport such as air, sea, and land transport, so understanding wind speed patterns can help optimize transport routes and improve safety. Lastly, for disaster prevention and mitigation, extreme wind speed events such as hurricanes and typhoons can lead to severe natural disasters. By analyzing wind speed trends, these events can be better predicted and prepared for.
In this section, the research methods of spatial pattern analysis, time trend analysis, and potential driving factor identification are used. We performed spatial pattern and temporal trend analysis of wind speed and potential driving analysis of the factors.
Statistics show that the average multi-year wind speed on land is 3.50 m per second globally. Wind speed shows significant spatial variation between regions, with a standard deviation (SD) of 1.26 m per second. Wind speeds are generally lower at lower latitudes, especially in the tropics. Conversely, they are higher in middle or high latitudes, with the highest in the Arctic (Figure 1A). Because of solar radiation and the Earth’s rotation, the theoretical pattern of wind direction (atmospheric circulation) is significantly dependent on latitude (Barnston and Livezey, 1987), which also affects the variability of wind speed (Klink, 2005).
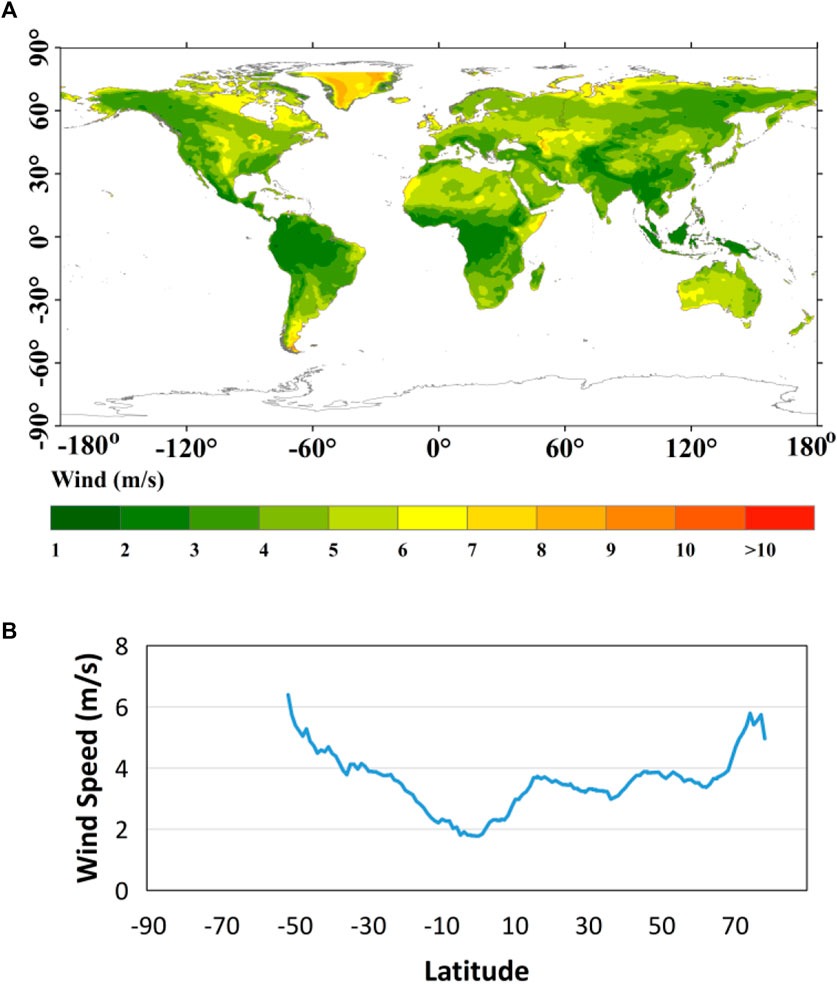
Figure 1. Spatial pattern of global wind speed (A) and spatial variability at latitude (B). Blank in the statistics indicates no data for a region.
There is significant latitude variability of wind speed (Figure 1B). The overall patterns of variabilities are similar with that of theoretical work by Lambeck and Cazenave (1973) and Lambeck and Cazenave (1974), with wind speed increasing from the equator to the poles. However, the magnitude of variability is quite complex, suggesting complex interactions with potential driving factors. Moreover, wind speed is lowest at −10 °C. Areas with cooler temperatures may develop areas of high pressure, which can lead to lower wind speeds. At the same time, uneven distribution of temperature also affects wind speed and direction. Topographic features such as mountains, valleys, and plains can significantly affect wind speed. For example, mountains can block airflow, causing wind speeds to slow on the lee side. Different weather patterns, such as polar, temperate, and tropical climates, affect the distribution of wind speeds. In some climate models, wind speeds may be lower even if vegetation is sparse. Seasonal variations in wind speed may also influence this phenomenon. In some areas, wind speeds may be generally low in winter, which is related to changes in temperature, barometric pressure, and seasonal winds. Local climate conditions, such as land, sea, and valley winds, may also lead to lower wind speeds in specific areas at specific temperatures. Human activities such as urbanization, deforestation, and land use change may also affect the distribution of wind speeds.
Besides spatial variability, global wind speed shows a significantly increasing trend over the land in the past 30 years (1988–2017), which can be written as y = 0.0015 x+ 3.48 (R2 = 0.37, p < 0.001) (Figure 2A). The trend is consistent with results based on satellite observation (Young et al., 2011; Young and Ribal, 2019), which is opposite to those from in situ datasets (Guo et al., 2011; McVicar et al., 2012; Dadaser-Celik and Cengiz, 2014). Since spatial representativeness is limited, in situ observation may cause unavoidable uncertainty on the investigation at the large scale. This therefore suggests strategies for improving estimates of global wind speed, for new remote sensing, and for quantifying and reducing uncertainty. With the aid of satellite observation, spatial details of the trend can also be presented (Figure 2B). Wind has profoundly increased in the Amazon, which corresponds to the lowest wind. On the other hand, the increasing trend is mainly in northern high latitudes, which correlates to the high speed in the spatial pattern. The wind trend can thus be characterized by “increase in slow speeds and decrease in high speeds.” This may suggest that the spatial difference might be reduced in future, resulting in a homogeneous pattern of wind speed. The paradigm can be confirmed by the decreasing trend of global wind speed SD, written as y = −0.001x + 1.28 (R2 = 0.25, p = 0.004). Another noteworthy issue refers to the significantly increasing trend around many coastal regions, suggesting the continuous enhancement of land–ocean surface temperature differences due to greater warning over land than over the ocean (Hansen et al., 2006).
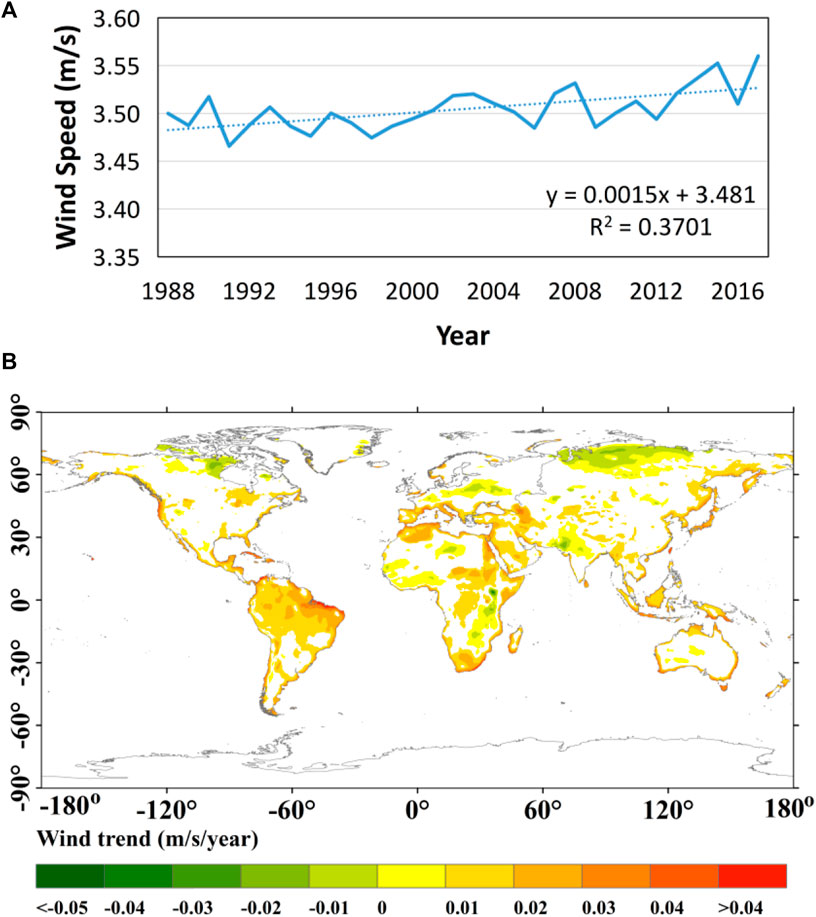
Figure 2. Annual trend (A) and spatial pattern of wind change (B) in recent 30 years. Only trends that are significant at p < 0.05 are presented in (B).
To examine monthly variation, we analyzed the multiyear mean and trend of the wind in each month (Figure 3). It is low in summer and high in other seasons, with the slowest winds in August (3.30 m/s).
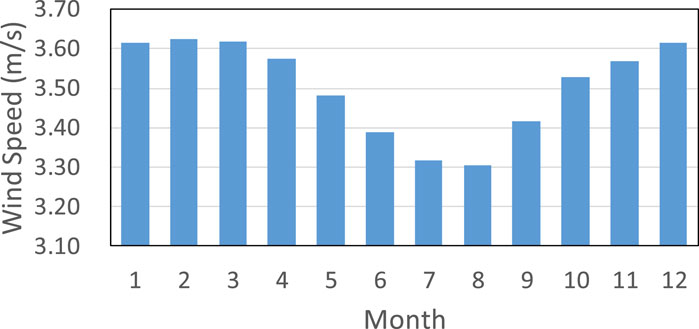
Figure 3. Monthly variation of global wind speed (m/s).
The spatial pattern of monthly wind speed is shown in Figures 4A–L. While there is significant variation between the global mean of wind speed at annual and monthly scales, the spatial patterns are highly similar. Wind speed is low in the Amazon and central Africa while it is high in northern and western Asia. Thus, the driving factors of the spatial pattern are similar on annual and monthly scales. The exception occurs in the Arctic: it is much higher in spring and winter, while the magnitude is relatively low in the summer and fall.
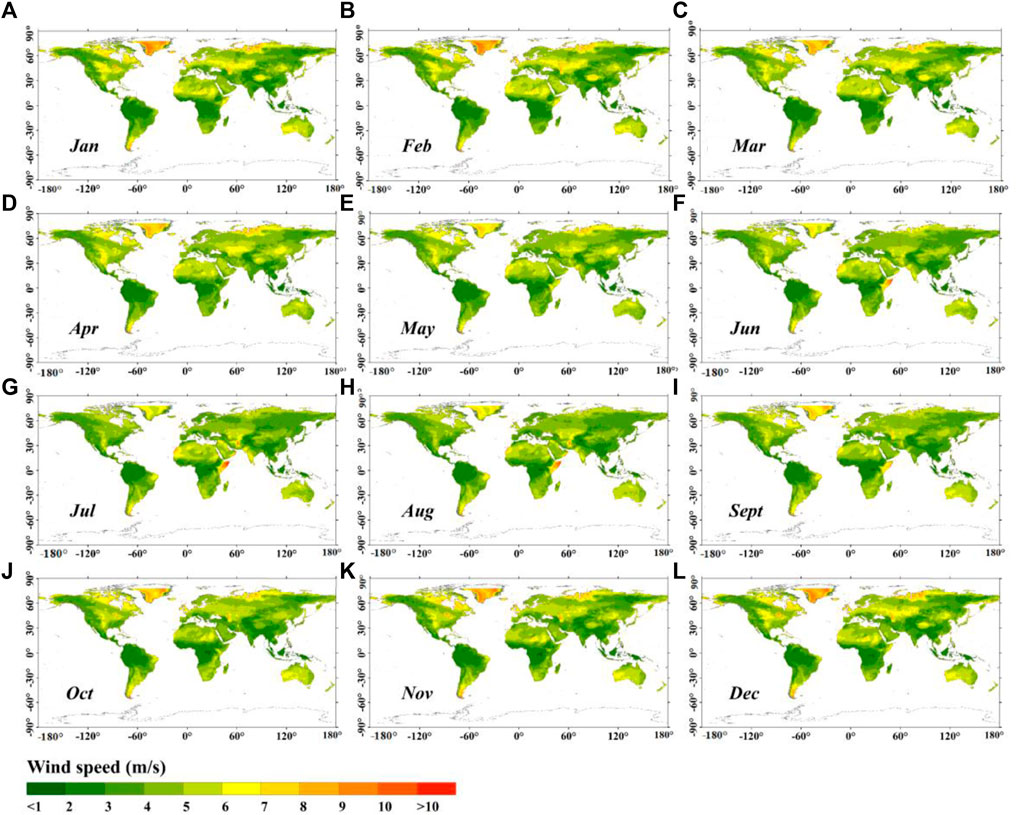
Figure 4. Global monthly wind speed patterns for (A) Jan (January), (B) Feb (February), (C) Mar (March), (D) Apr (April), (E) May (May), (F) Jun (June), (G) Jul (July), (H) Aug (August), (I) Sept (September), (J) Oct (October), (K) Nov (November) and (L) Dec (December).
Figures 5A–L shows the temporal trends for each month. Wind speed increases in most months, but the significances are relatively weak compared with the annual scale. The difference between annual and monthly trends suggests the hidden effect of temporal scale on wind speed. Generally, monthly wind can be captured as a sine function with the mean, amplitude, and peak of annual wind (Yin, 2000). The most significant increase occurs in August, which corresponds to the lowest speed at monthly scale. This indicates that the inner variability is expected to be reduced.
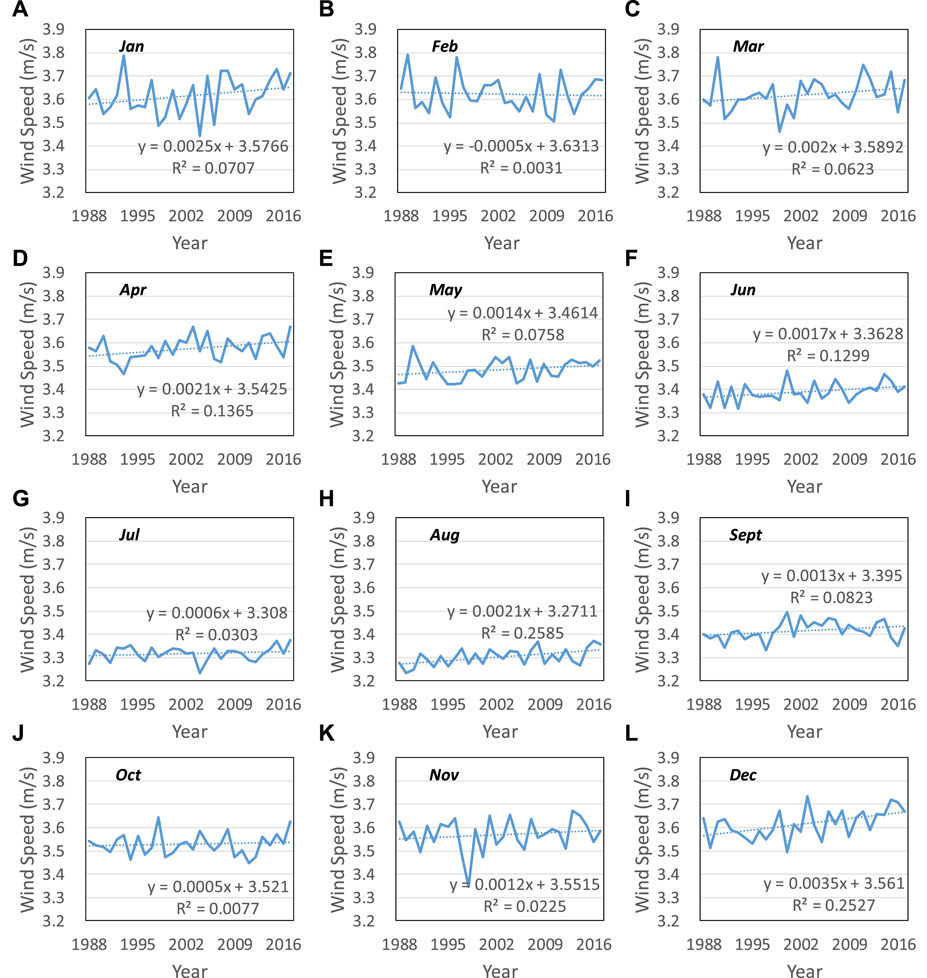
Figure 5. Nearly 30 years (1988–2017) from (A) Jan (January), (B) Feb (February), (C) Mar (March), (D) Apr (April), (E) May (May), (F) Jun (June), (G) Jul (July), (H) Aug (August), (I) Sept (September), (J) Oct (October), (K) Nov (November) and (L) Dec (December) time trend of monthly mean global wind speed.
Figures 6A–L shows the spatial trend of monthly wind. In general, the patterns are similar at different months. The hotspots of the increasing wind speed are mainly located in the Amazon and northern Africa. The greatest difference is in the decreasing trend, which mainly occurs in spring and winter. However, the spatial aspects of the decrease are quite different. In spring, the decreasing trend is mainly in northern North America. In winter, however, the decreasing trend is located in northern Asia, which is spatially consistent with the pattern on an annual scale (Figure 2B).
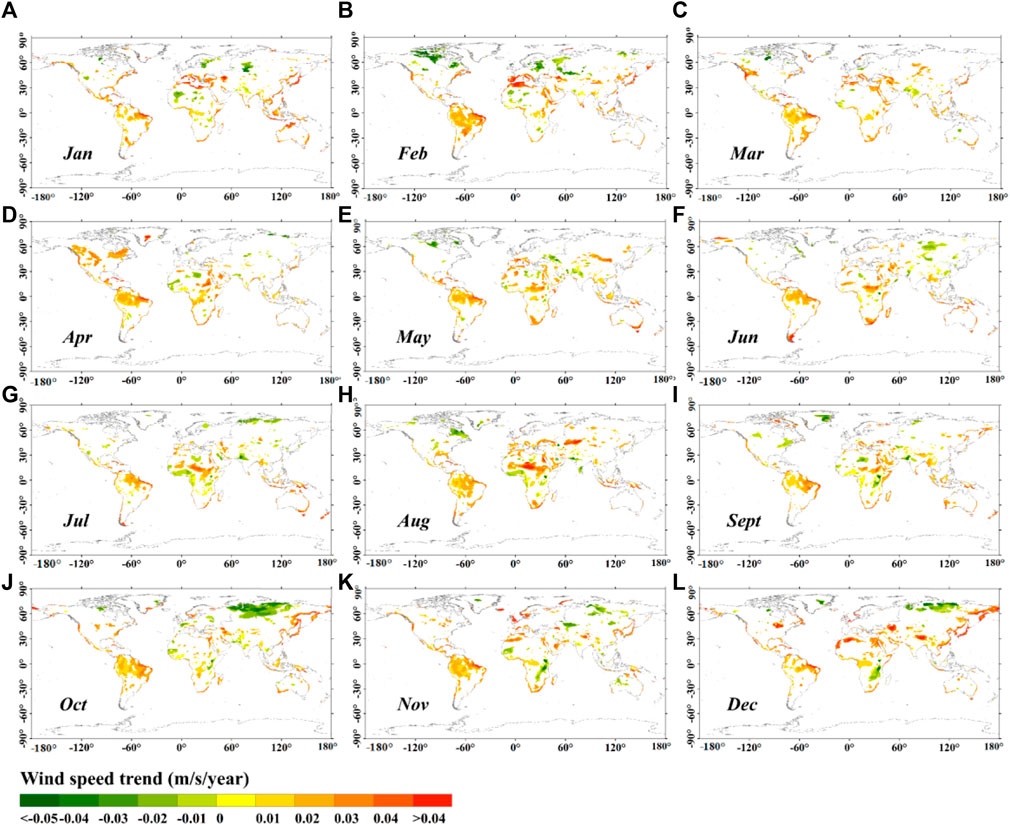
Figure 6. Spatial trend of global monthly wind speed for (A) Jan (January), (B) Feb (February), (C) Mar (March), (D) Apr (April), (E) May (May), (F) Jun (June), (G) Jul (July), (H) Aug (August), (I) Sept (September), (J) Oct (October), (K) Nov (November) and (L) Dec (December). Only trends that are significant at p < 0.05 are presented.
As demonstrated in the previous studies, wind is controlled by temperature, terrain, and vegetation, which provides the clue for identifying its driving factors (Yin, 2000; Bichet et al., 2012). Figures 7A–C shows the variation of wind speed over different intervals of temperature, DEM, and NDVI. The results show that wind speed negatively correlates with all the variables, indicating that temperature and vegetation negatively control the spatial pattern of wind speed for the same period. The negative wind–DEM correlation reflects friction against the earth’s surface (Yin, 2000; Vesala et al., 2008). This might be attributed to dense summer vegetation, which strengthens surface roughness (Wieringa, 1986). As estimated by Vautard et al. (2010), increases in biomass and land-use change could explain between 25% and 60% of atmospheric stilling in the Northern Hemisphere.
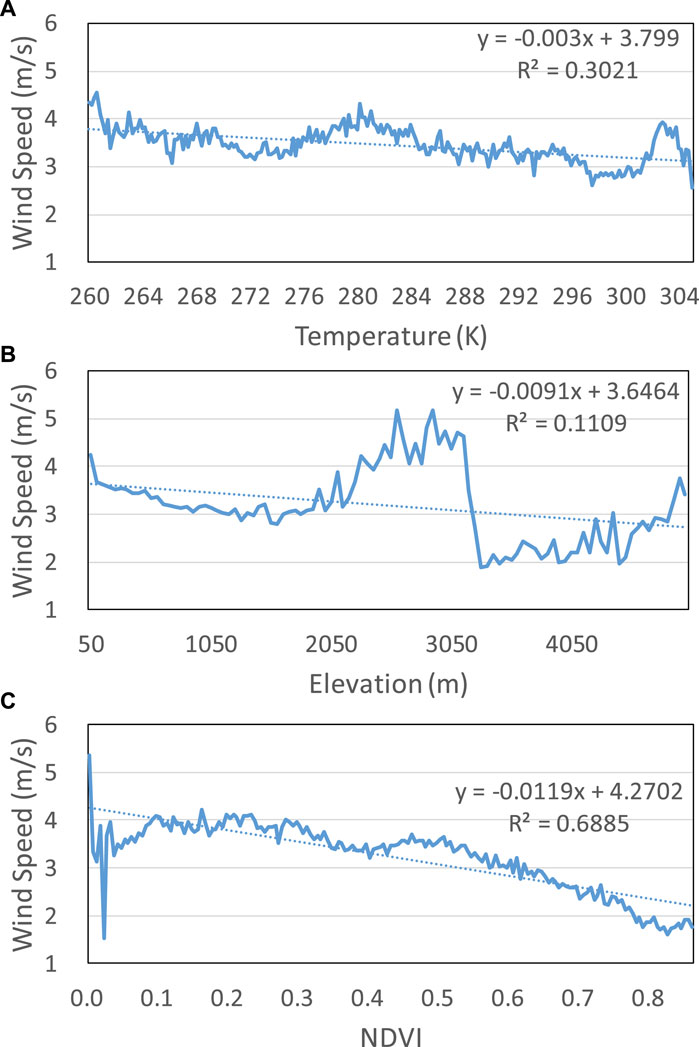
Figure 7. Correlation of wind speed with (A) near surface temperature, (B) elevation, and (C) vegetation.
As well as the impact of spatial patterns, the relationship between temperature and vegetation also exerts great influence on wind trends (Figures 8A, B). Generally, wind significantly correlates to temperature in the Amazon, northern Europe and central Asia. A negative wind–temperature correlation is only located in small areas of central North America and northern Africa. The warming climate weakens atmospheric stability, which tends to enhance the wind (Lee, 1979). By contrast, the wind presents weak and negative correlation in the eastern Amazon, southern Africa and southern India. A positive wind–vegetation correlation is rare and is mainly located in northern Europe. The combined effect of temperature and vegetation controls the sine and magnitude of wind trends. Considering the trend of increasing wind speed, it can be concluded that temperature may act as the predominant factor. Our previous studies have investigated the greening and warming world in the past decades (Feng et al., 2017; Feng and Zou, 2019). Consequently, increasing wind speeds are expected in the future.
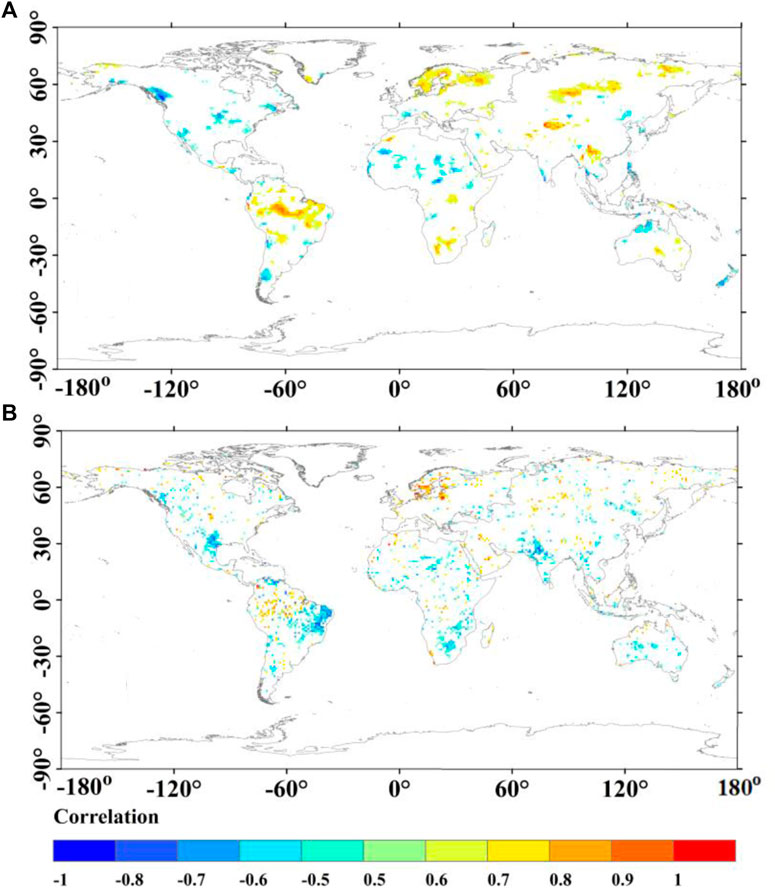
Figure 8. Spatial correlation of wind with (A) temperature and (B) NDVI.
In this study, the spatial pattern and temporal trend of global wind speed over land were re-examined with the aid of satellite observations in the last 30 years (1988–2017). Several conclusions can be drawn.
From 1988 to 2017, wind speeds showed a significant internal upward trend. The acceleration of wind speed has had a significant impact on the global environment and climate change. For example, wind enhances the dispersion of atmospheric pollutants and improves atmosphere quality. On the other hand, increasing wind speed might alter energy circulation, resulting in complex responses in global temperatures and precipitation (Long et al., 2023; Miao et al., 2023; Zhao et al., 2023). At the same time, wind speed also has shown a clear monthly variation, with a basin-like pattern between the months. Increased wind speed was most significant in August, when wind speeds are normally lowest. Spatially, global wind speed is low in low latitudes, particularly the tropics. High speeds mainly occur in mid or high latitudes, with the highest speed in the Arctic. Patterns of multiyear means were highly similar at annual and month scales.
Wind speed negatively correlates with all the variables, indicating that temperature and vegetation negatively control the spatial pattern of wind speed in the same period. A negative wind–temperature correlation is only present in small parts of central North America and northern Africa. The warming climate weakens atmospheric stability, which tends to enhance wind (Lee, 1979). By contrast, the wind presents a weak and negative correlation in the eastern Amazon, southern Africa, and southern India. Positive wind–vegetation correlation is rare and is mainly located in northern Europe. The combined effect of temperature and vegetation controls the sine and magnitude of the wind trend. Considering the trend of increasing wind speed, we can conclude that temperature may act as the predominant factor. Our previous studies depicted the greening and warming world in the past decades (Feng et al., 2017; Feng and Zou, 2019). Consequently, increasing wind speeds are expected in the future. However, unavoidable uncertainties remain due to the complexity of wind patterns and their corresponding driving factors. These uncertainties originate from the inherent complexity of wind speed, limitations in climate models, and the interactions between the driving factors. Furthermore, human activities (i.e., the urban development and land-use changes) would also generate uncertainties, aggravating the challenges in global wind investigation (Alsweiss et al., 2023; Li et al., 2024).
This study clarified the pattern and trend of global wind speed, which could provide background information for research on climate and environmental change. Several issues should be subject to future research. Firstly, this study examined the potential driving factors by analyzing the correlation of wind speed with temperature, terrain, and vegetation. The physical mechanism involved needs further clarification. Secondly, the impact of wind change on the climate and environment required full investigation regarding adaptation and management.
The raw data supporting the conclusions of this article will be made available by the authors, without undue reservation.
WZ: Conceptualization, Data curation, Formal Analysis, Funding acquisition, Investigation, Methodology, Validation, Visualization, Writing–original draft, Writing–review and editing. LZ: Data curation, Formal Analysis, Investigation, Methodology, Software, Writing–original draft. JL: Conceptualization, Funding acquisition, Project administration, Supervision, Writing–review and editing.
The authors declare that financial support was received for the research, authorship, and/or publication of this article. This research was funded by Huaiyuan County Territorial Space Master Plan (no. 881283), scientific research projects in higher education institutions of Anhui Province (nos 2022AH051623 and 2023AH051855) and Anhui Province Crop Intelligent Planting and Processing Technology Engineering Research Center Open Research Project (no. ZHKF03).
We are very grateful to Xiaofang Chen, Ying Nian, Yongkang Li, and Weiqiang Wang for their assistance in data collection.
The authors declare that the research was conducted in the absence of any commercial or financial relationships that could be construed as a potential conflict of interest.
All claims expressed in this article are solely those of the authors and do not necessarily represent those of their affiliated organizations, or those of the publisher, the editors and the reviewers. Any product that may be evaluated in this article, or claim that may be made by its manufacturer, is not guaranteed or endorsed by the publisher.
Alsweiss, S., Jelenak, Z., and Chang, P. S. (2023). Extending the us ability of radiometer ocean surface wind measurements to all-weather conditions for NOAA operations: application to AMSR2. IEEE Trans. Geosci. Remote Sens. 61, 1–12. doi:10.1109/tgrs.2023.3266772
Azorin-Molina, C., Menendez, M., McVicar, T. R., Acevedo, A., Vicente-Serrano, S. M., Cuevas, E., et al. (2018). Wind speed variability over the Canary Islands, 1948–2014: focusing on trend differences at the land–ocean interface and below–above the trade-wind inversion layer. Clim. Dyn. 50, 4061–4081. doi:10.1007/s00382-017-3861-0
Barnston, A. G., and Livezey, R. E. (1987). Classification, seasonality and persistence of low-frequency atmospheric circulation patterns. Mon. Weather Rev. 115, 1083–1126. doi:10.1175/1520-0493(1987)115<1083:csapol>2.0.co;2
Bichet, A., Wild, M., Folini, D., and Schär, C. (2012). Causes for decadal variations of wind speed over land: sensitivity studies with a global climate model. Geophys. Res. Lett. 39, L11701. doi:10.1029/2012gl051685
Carr, J. L., and Wu, D. L. (2018). Future 3D-wind measurements from multi-satellite observations: a demonstration with MISR and GOES-R. AGU Fall Meet. Abstr. Available at: https://ui.adsabs.harvard.edu/abs/2018AGUFM.A31L3069C/abstract (Accessed July 10, 2024).
Clarizia, M. P., and Ruf, C. S. (2016). Wind speed retrieval algorithm for the cyclone global navigation satellite system (CYGNSS) mission. IEEE Trans. Geoscience Remote Sens. 54, 4419–4432. doi:10.1109/tgrs.2016.2541343
Dadaser-Celik, F., and Cengiz, E. (2014). Wind speed trends over Turkey from 1975 to 2006. Int. J. Climatol. 34, 1913–1927. doi:10.1002/joc.3810
Didan, K., Solano, R., Munoz, A. B., and Huete, A. (2015) “MODIS vegetation index user's guide (MOD13 Series), Version 3.00, June 2015 (Collection 6),” in Vegetation index and phenology lab. Tucson, AZ, United States: The University of Arizona. Available at: https://lpdaac.usgs.gov/documents/103/MOD13_User_Guide_V6.pdf (Accessed July 10, 2024).
Fan, Y., and Dool, H. v.d. (2008). A global monthly land surface air temperature analysis for 1948–present. J. Geophys. Res. Atmos. 113, D01103. doi:10.1029/2007jd008470
Feng, H., and Zou, B. (2019). A greening world enhances the surface-air temperature difference. Sci. Total Environ. 658, 385–394. doi:10.1016/j.scitotenv.2018.12.210
Feng, H., Zou, B., and Luo, J. (2017). Coverage-dependent amplifiers of vegetation change on global water cycle dynamics. J. Hydrology 550, 220–229. doi:10.1016/j.jhydrol.2017.04.056
Giannaros, T. M., Melas, D., and Ziomas, I. (2017). Performance evaluation of the Weather Research and Forecasting (WRF) model for assessing wind resource in Greece. Renew. Energy 102, 190–198. doi:10.1016/j.renene.2016.10.033
Guo, H., Xu, M., and Hu, Q. (2011). Changes in near-surface wind speed in China: 1969–2005. Int. J. Climatol. 31, 349–358. doi:10.1002/joc.2091
Hansen, J., Sato, M., Ruedy, R., Lo, K., Lea, D. W., and Medina-Elizade, M. (2006). Global temperature change. Proc. Natl. Acad. Sci. U. S. A. 103, 14288–14293. doi:10.1073/pnas.0606291103
Hobby, M., Gascoyne, M., Marsham, J. H., Bart, M., Allen, C., Engelstaedter, S., et al. (2013). The fennec automatic weather station (AWS) Network: monitoring the saharan climate system. J. Atmos. Ocean. Technol. 30, 709–724. doi:10.1175/jtech-d-12-00037.1
Jong, R., Bruin, S., Wit, A., Schaepman, M. E., and Dent, D. L. (2011). Analysis of monotonic greening and browning trends from global NDVI time-series. Remote Sens. Environ. 115, 692–702. doi:10.1016/j.rse.2010.10.011
Jung, C., Taubert, D., and Schindler, D. (2019). The temporal variability of global wind energy – long-term trends and inter-annual variability. Energy Convers. Manag. 188, 462–472. doi:10.1016/j.enconman.2019.03.072
Kim, J., and Paik, K. (2015). Recent recovery of surface wind speed after decadal decrease: a focus on South Korea. Clim. Dyn. 45, 1699–1712. doi:10.1007/s00382-015-2546-9
Klink, K. (2005). Atmospheric circulation effects on wind speed variability at turbine height. J. Appl. Meteorology Climatol. 46, 445–456. doi:10.1175/jam2466.1
Korhonen, H., Carslaw, K. S., Forster, P. M., Mikkonen, S., Gordon, N. D., and Kokkola, H. (2010). Aerosol climate feedback due to decadal increases in Southern Hemisphere wind speeds. Geophys. Res. Lett. 37. doi:10.1029/2009gl041320
Laapas, M., and Venäläinen, A. (2017). Homogenization and trend analysis of monthly mean and maximum wind speed time series in Finland, 1959–2015. Int. J. Climatol. 37, 4803–4813. doi:10.1002/joc.5124
Lambeck, K., and Cazenave, A. (1973). The Earth's rotation and atmospheric circulation—I Seasonal variations. Geophys. J. Int. 32, 79–93. doi:10.1111/j.1365-246x.1973.tb06521.x
Lambeck, K., and Cazenave, A. (1974). The Earth's rotation and atmospheric circulation—II. The continuum. Geophys. J. Int. 38, 49–61. doi:10.1111/j.1365-246x.1974.tb04108.x
Lee, D. O. (1979). The influence of atmospheric stability and the urban heat island on urban-rural wind speed differences. Atmos. Environ. (1967) 13, 1175–1180. doi:10.1016/0004-6981(79)90042-8
Li, M. L., Hou, Y. H., Song, X. W., Hou, C., Wang, Z., Xiong, Z., et al. (2024). WSPTGAN for global ocean surface wind speed generation with high temporal resolution and spatial coverage. IEEE Trans. Geosci. Remote Sens. 62, 1–19. doi:10.1109/TGRS.2024.3369640
Li, Y., Chen, Y., Li, Z., and Fang, G. (2018). Recent recovery of surface wind speed in northwest China. Int. J. Climatol. 38, 4445–4458. doi:10.1002/joc.5679
Long, Y., Chen, Y., Xu, C., Li, Z., Liu, Y., and Wang, H. (2023). The role of global installed wind energy in mitigating CO2 emission and temperature rising. J. Clean. Prod. 423, 138778. doi:10.1016/j.jclepro.2023.138778
McDonald, B. C., Goldstein, A. H., and Harley, R. A. (2015). Long-term trends in California mobile source emissions and ambient concentrations of black carbon and organic aerosol. Environ. Sci. Technol. 49, 5178–5188. doi:10.1021/es505912b
McVicar, T. R., Roderick, M. L., Donohue, R. J., Li, L. T., Van Niel, T. G., Thomas, A., et al. (2012). Global review and synthesis of trends in observed terrestrial near-surface wind speeds: implications for evaporation. J. Hydrology 416-417, 182–205. doi:10.1016/j.jhydrol.2011.10.024
Miao, H. Z. Y., Xu, H. M., Huang, G., and Yang, K. (2023). Evaluation and future projections of wind energy resources over the Northern Hemisphere in CMIP5 and CMIP6 models. Renew. Energy 211, 809–821. doi:10.1016/j.renene.2023.05.007
Torralba, V., Doblas-Reyes, F. J., and Gonzalez-Reviriego, N. (2017). Uncertainty in recent near-surface wind speed trends: a global reanalysis intercomparison. Environ. Res. Lett. 12, 114019. doi:10.1088/1748-9326/aa8a58
Vautard, R., Cattiaux, J., Yiou, P., Thépaut, J. N., and Ciais, P. (2010). Northern Hemisphere atmospheric stilling partly attributed to an increase in surface roughness. Nat. Geosci. 3, 756–761. doi:10.1038/ngeo979
Vesala, T., Järvi, L., Launiainen, S., Sogachev, A., Rannik, Ü., Mammarella, I., et al. (2008). Surface–atmosphere interactions over complex urban terrain in Helsinki, Finland. TellusB 608, 188–199. doi:10.3402/tellusb.v60i2.16914
Wang, J., Botterud, A., Bessa, R., Keko, H., Carvalho, L., Issicaba, D., et al. (2011). Wind power forecasting uncertainty and unit commitment. Appl. Energy 88, 4014–4023. doi:10.1016/j.apenergy.2011.04.011
Wang, W., Evan, A. T., Flamant, C., and Lavaysse, C. (2015). On the decadal scale correlation between African dust and Sahel rainfall: the role of Saharan heat low–forced winds. Sci. Adv. 1, e1500646. doi:10.1126/sciadv.1500646
Wentz, F. J. (1992). Measurement of oceanic wind vector using satellite microwave radiometers. IEEE Trans. Geoscience Remote Sens. 30, 960–972. doi:10.1109/36.175331
Wentz, F. J. (2015). Cross-Calibrated Multi-Platform (CCMP) 6-hourly ocean vector wind analysis product on 0.25 deg grid, Version 2.0. Santa Rosa, CA: Remote Sensing Systems. Available at: www.remss.com/measurements/ccmp.
Wieringa, J. (1986). Roughness-dependent geographical interpolation of surface wind speed averages. Q. J. R. Meteorological Soc. 112, 867–889. doi:10.1256/smsqj.47315
Wilczak, J. M., Oncley, S. P., and Stage, S. A. (2001). Sonic anemometer tilt correction algorithms. Boundary-Layer Meteorol. 99, 127–150. doi:10.1023/a:1018966204465
Yang, Y., Russell, L. M., Lou, S., Liao, H., Guo, J., Liu, Y., et al. (2017). Dust-wind interactions can intensify aerosol pollution over eastern China. Nat. Commun. 8, 15333. doi:10.1038/ncomms15333
Yin, X. (2000). Surface wind speed over land: a global view. J. Appl. Meteorology 39, 1861–1865. doi:10.1175/1520-0450(2000)039<1861:swsola>2.0.co;2
Young, I. R., and Ribal, A. (2019). Multiplatform evaluation of global trends in wind speed and wave height. Science 364, 548–552. doi:10.1126/science.aav9527
Young, I. R., Zieger, S., and Babanin, A. V. (2011). Global trends in wind speed and wave height. Science 332, 451–455. doi:10.1126/science.1197219
Zhang, W., Markfort, C. D., and Port´e-Agel, F. (2013). Experimental study of the impact of large-scale wind farms on land–atmosphere exchanges. Environ. Res. Lett. 8, 015002. doi:10.1088/1748-9326/8/1/015002
Keywords: wind speed, climate change, environment, satellite, terrestrial
Citation: Zhang W, Zhang L and Liu J (2024) Satellite-based re-examination of changes in terrestrial near-surface wind speed in the last 30 years. Front. Earth Sci. 12:1398638. doi: 10.3389/feart.2024.1398638
Received: 10 March 2024; Accepted: 17 June 2024;
Published: 18 July 2024.
Edited by:
Andreas Franz Prein, National Center for Atmospheric Research (UCAR), United StatesReviewed by:
Zhongling Guo, Hebei Normal University, ChinaCopyright © 2024 Zhang, Zhang and Liu. This is an open-access article distributed under the terms of the Creative Commons Attribution License (CC BY). The use, distribution or reproduction in other forums is permitted, provided the original author(s) and the copyright owner(s) are credited and that the original publication in this journal is cited, in accordance with accepted academic practice. No use, distribution or reproduction is permitted which does not comply with these terms.
*Correspondence: Jikai Liu, bGl1amtAYWhzdHUuZWR1LmNu
Disclaimer: All claims expressed in this article are solely those of the authors and do not necessarily represent those of their affiliated organizations, or those of the publisher, the editors and the reviewers. Any product that may be evaluated in this article or claim that may be made by its manufacturer is not guaranteed or endorsed by the publisher.
Research integrity at Frontiers
Learn more about the work of our research integrity team to safeguard the quality of each article we publish.