 Kamal Abdelrahman*
 Abdullah B. Saadon
94% of researchers rate our articles as excellent or good
Learn more about the work of our research integrity team to safeguard the quality of each article we publish.
Find out more
ORIGINAL RESEARCH article
Front. Earth Sci., 30 May 2024
Sec. Geohazards and Georisks
Volume 12 - 2024 | https://doi.org/10.3389/feart.2024.1395431
This article is part of the Research TopicRisk Assessment, Stability Monitoring, and Safe Design for Deep Rock EngineeringView all 20 articles
The site characterization process is vital for the engineering structures and earthworks. In the current study, a Multi-Channel Analysis of Surface Waves (MASW) was carried out in western Riyadh City, Saudi Arabia. This aimed to determine subsurface geology, material stiffness, and potential weak zones approximately down to a depth of 30 m, and to propose the suitable seismic site characterization for precise foundation design. A total of 30 MASW lines were executed utilizing the Geode digital seismograph equipped with a 24-geophone array of 4.5 Hz. The data acquisition, processing, and inversion were meticulously calibrated to derive shear velocities representing subsurface geological conditions. The Vs30 map, based on estimated values ranging from 443.71 m/s to 639.78 m/s for soil, was prepared for the area. The results of the 1D and 2D Vs profiles tinted small Vs values at shallow depths. The resulting geological model is composed of sand, gravel, moderately weathered limestone, and hard limestone sequence. Analysis of shear wave velocities shows variations, indicating low shear velocity (representing sediments or rocks of low stiffness) juxtaposed with higher velocity layers (indicating rocks of higher stiffness) at depths greater than 10 m. This could imply the presence of a cavity or weak zone. The topmost shear wave velocity zone indicated materials with low Vs values (ranging from 180 m/s to 360 m/s), predominantly associated with stiff materials such as silty sand, gravel, and sandy deposits. The subsequent zone, with 3 to about 10 m depth, was characterized by medium to very dense soil with shear wave velocity values ranging from 360 m/s to 760 m/s, attributed to layers of silty clay and silty sand. At approximately 12 m, a high shear velocity layer (ranging from 760 m/s to 1,500 m/s) was identified, extending to a maximum depth of 22 m, potentially indicative of less weathered or fractured bedrock associated with limestone. While the deepest layer, with very high shear velocity (exceeding 1,500 m/s) beyond 22 m, indicated bedrock associated with hard limestone. The average Shear-wave velocity of soil for the whole study area (Vs30 = 551.2 m/s) suggests that the site can be classified as Class C (Very Dense Soil and Soft Rock) according to the National Earthquake Hazard Reeducation Program NEHRP (National earthquake hazards reduction program, 2001). These results will support, to a great extent, the design of engineering structures in the area of study.
The need for information regarding soil conditions, elastic moduli, bedrock depth, ground stiffness, and site classification has intensified due to population growth, rapid urbanization, and the expansion of city infrastructure. Providing this essential information is crucial for the safe design, construction, and long-term functionality of urban developments. Insufficient or inadequate soil assessment can lead to unsound design, potentially causing severe structural damage or failure. Therefore, comprehensive geophysical site characterization is pivotal in identifying suitable locations for proposed structures, ensuring the prevention of unexpected catastrophic consequences for engineering projects and human life (Rahimi et al., 2021; Stephenson et al., 2022).
A thorough comprehension of the soil type, attributes, and competent bedrock is highly significant for geotechnical and earthquake engineers. This knowledge aids in appropriately selecting sites, designing engineering structures, and recognizing potential adverse conditions within the study area, allowing for the implementation of suitable remedial actions (Oyeyemi et al., 2020; Ausilio et al., 2022). Analyzing the underground geological features to categorize site suitability and evaluate potential risks is a crucial method to safeguard both engineering structures and human life from unforeseen catastrophic events in the future.
Shear wave velocity (Vs) is a fundamental parameter in geological engineering due to its relation to the small-strain shear stiffness, as well as Vs distribution is essential for assessing the dynamic behavior of soil/rocks. There are several geophysical approaches for the evaluation of in-situ Vp and/or Vs and obtaining a 1D Vs profile or 2D Vs cross-sections versus depth (e.g., Al-Saigh and Al-Heety, 2013; AL-Saigh & AL-Heety, 2018; Abdelrahman et al., 2021a; 2021b). This important parameter can be precisely obtained using surface geophysical methods to evaluate the appropriateness of surface materials for roads, building constructions, and foundations like MASW methods (Socco and Strobbia, 2004; Fnais et al., 2015; Abd El-Aal et al., 2016; Al-Amri et al., 2016; Rehman et al., 2016; Aldahri et al., 2017; Abdelrahman et al., 2020; Alamri et al., 2020; Igwe and Umbugadu, 2020; Mogren et al., 2020; Naji et al., 2020; Al-Heety et al., 2021; Almadani et al., 2021; Alzahrani et al., 2021; Abdelrahman et al., 2021c; El-Raouf et al., 2021; Abdallatif et al., 2022; Al-Heety et al., 2022; Ayele et al., 2022; Ferguson and Gautreau, 2022; Jusoh et al., 2022). This method is dependable, non-invasive, and cost-effective in engineering practices. It aids in identifying potentially unsuitable geological conditions, evaluating the small-strain stiffness of soil and rock, conducting foundation instability analysis, and categorizing site suitability (Le Ngal et al., 2019; Rubaiyn et al., 2019; Ishola et al., 2022).
Rayleigh waves traveling from the surface to the subsurface are employed to assess the shear wave velocity (Vs) using the dispersion curve. Consequently, the average shear wave velocity (Vs30) is determined from the measured Vs to classify the site for analyzing site response, designing earthquake-resistant structures, and ensuring safe building construction (Cultrera et al., 2021; Wang et al., 2022). This parameter also serves as a crucial geotechnical factor for acquiring the dynamic properties of near-surface soil, essential for engineering designs of projects varying from small to large scales, such as roads, buildings, and highways.
The MASW method, a non-destructive seismic technique developed primarily for shallow geophysical inquiries, has been widely applied over the last two decades for soil characterization (Park et al., 1999; Park et al., 2004; Socco and Strobbia, 2004; Foti et al., 2011; Khalil et al., 2017; Geraldine C et al., 2018). Its popularity stems from its ease of generation, recording, and processing, as well as its effectiveness and reliability. This approach relies on the propagation of surface waves, primarily Rayleigh waves, operating on the principle of Rayleigh wave dispersion. This principle states that Rayleigh waves travel at various velocities across different frequencies through an inhomogeneous soil medium, forming a dispersion curve (phase velocity vs. frequency). By employing an efficient inversion technique, these dispersion curves can be transformed to acquire a 1-D (depth) shear wave velocity (Vs) profile of the surveyed site. Combining multiple 1-D profiles constructs the final pseudo 2-D cross-sections of the area (Miller et al., 1999).
Several methods have been suggested for interpreting surface-wave dispersion curves, encompassing local search approaches relying on the Jacobian matrix (Xia et al., 1999) and global search methods that probabilistically solve the optimization problem (Socco and Boiero, 2008). A layered soil/rock model is commonly used in resolving a 1-D problem. In this model, the phase velocity of the Rayleigh wave is contingent upon the frequency and four material properties: layer thickness, density, P-wave, and S-wave velocities. Notably, shear wave velocity significantly influences the dispersion curve in the high-frequency spectrum (Xia et al., 1999).
The multi-channel Analysis of Surface Waves (MASW) method has become a cornerstone technique in various scientific and engineering disciplines due to its wide array of practical applications. In geophysics, MASW is instrumental in subsurface imaging, enabling precise characterization of soil properties, geological structures, and bedrock depths. This capability finds extensive use in civil engineering for site characterization, foundation design, and seismic hazard assessment, ensuring the safety and stability of infrastructure projects. Moreover, MASW plays a crucial role in environmental studies, facilitating groundwater exploration, contaminant plume mapping, and land-use planning.
One of the key strengths of the MASW method is its non-invasive nature, which allows for the characterization of subsurface properties without the need for drilling or excavation. This not only reduces costs and environmental impact but also enables investigations in areas where traditional methods may be impractical or prohibitive. Its non-invasive nature and high-resolution imaging capabilities make MASW particularly valuable for geotechnical investigations, aiding in slope stability analysis, subsurface mapping, and infrastructure integrity assessments. Moreover, MASW is particularly useful in urban environments where access to the subsurface is limited. Its ability to collect data rapidly and over large areas makes it well-suited for assessing the geotechnical properties of urban infrastructure, such as roads, bridges, and pipelines. By providing detailed insights into the subsurface, MASW contributes to informed decision-making processes across various domains, ultimately enhancing our understanding of geological processes, and improving disaster resilience measures.
The research site holds significant importance, being part of one of the prominent national projects in the Kingdom of Saudi Arabia, aligned with the ambitious Vision 2030 plan. Situated close to Riyadh and Al-Muzahmiah, two major urban areas experiencing rapid urban expansion, the area requires essential infrastructure and roads to support the burgeoning residential developments nearby. Hence, it has become imperative to perform engineering geological assessments of this area to appraise its appropriateness for urban expansion, sustaining critical projects, scrutinizing near-surface structures, assessing bedrock conditions, determining soil dynamics, evaluating the stiffness and load-bearing capacity of surface soil, and identifying areas of vulnerability that should be circumvented during construction.
During data collection, various noise sources, such as electric poles, were identified in the study area. The primary aim of this research is to explore potentially risky subsurface geological aspects through MASW seismic surveys. This investigation seeks to determine if the study area is viable and appropriate for secure construction and resilient facilities. Achieving this involves estimating the average Vs30 and determining the necessary site classification for establishing a secure foundation. Ultimately, this research will provide construction engineers with preliminary insights into the subsurface layers’ structure and soil characteristics, potentially reducing both the time and costs associated with construction development in the study area.
The Qiddiya site is positioned to the southwest of Riyadh city, situated between 24°34′12″N latitude and 46°18′36″E longitude (Figure 1). It is approximately 40 km away from the center of Riyadh, running along the Mount Tuwaiq escarpment within the study area, covering an extensive 334 square kilometers. This location marks an ambitious project, distinguished by its distinctive mountainous landscape, encompassing various elevated terrains.
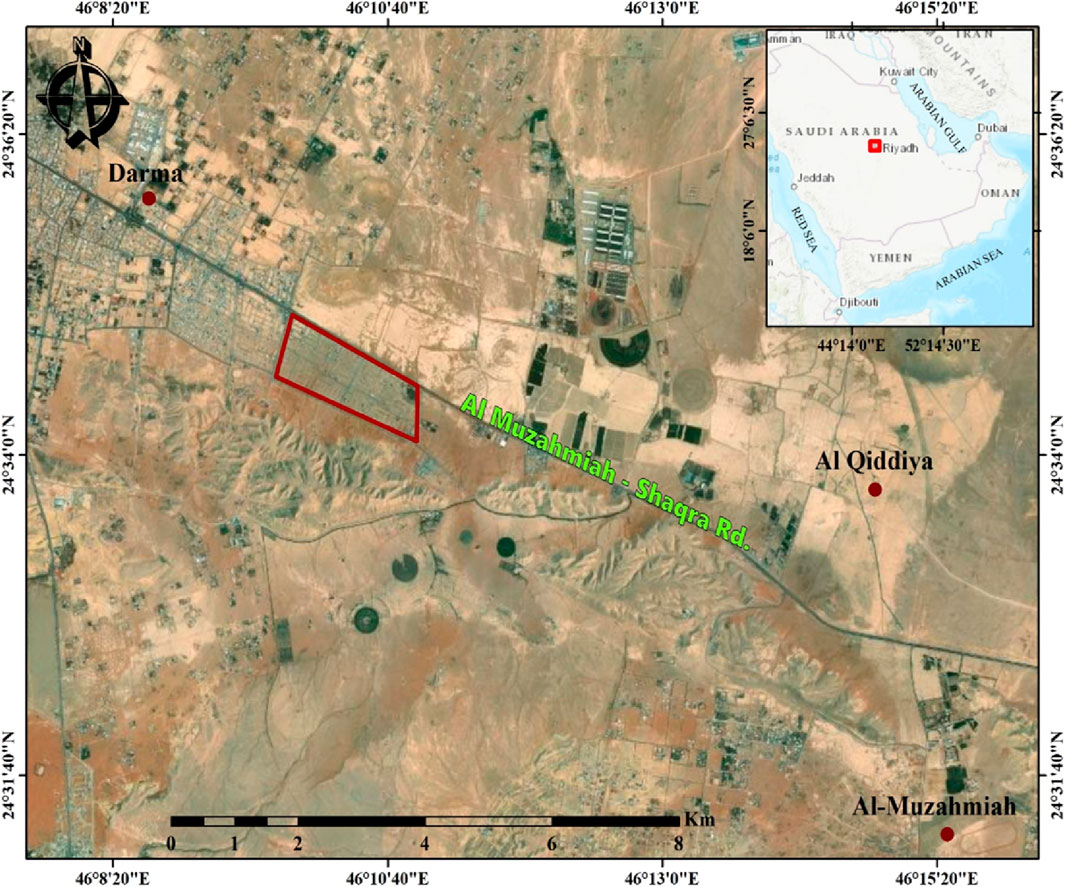
Figure 1. Location map of study area.
In Saudi Arabia, the Jurassic sequence is manifested through the Shaqra Group, consisting of seven formations, ordered from older to younger: Marrat, Dhruma, Tuwaiq Mountain Limestone, Hanifa, Jubaila, Arab, and Hith formations (El-Asa’ad, 1989). The sedimentary formations on the Arabian platform, located below Riyadh and spanning over 2 km in thickness, are primarily composed of shallow marine basin deposits, consisting mainly of carbonate and siliclastic materials with occasional evaporites (Le Nindre et al., 1990). In the Riyadh vicinity, these layers are predominantly constituted by Jurassic (145–200 million years ago) and Cretaceous (65–145 million years ago) sedimentary rocks, primarily characterized by marine limestones, claystones, and marls (calcareous mudstones). Some of these sedimentary rocks serve as aquifers, which are utilized by Riyadh. The Arabian platform, in general, has been carved by southward-flowing seasonal streams, shaping a series of channels and plateaus. These wadi channels are filled predominantly with loosely consolidated, weakly cemented alluvial deposits comprising silts and sands, potentially forming shallow unconfined aquifers ranging from fresh to brackish water sources.
The Qiddiya region lies adjacent to the Mount Tuwaiq escarpment, which is situated within the study area. Tuwaiq represents one of the sedimentary plateaus globally, positioned on the Arabian shelf and running parallel to the eastern edge of the Arabian Shield in Saudi Arabia. The geological formations in the study area consist of diverse sedimentary rocks, predominantly limestone interspersed with sandstone, gravel, clay, and shale (Figure 2). The Tuwaiq Mountain Limestone attains its maximum thickness, ranging between 200 and 250 m, from the Darb al-Hijaz (type locality) to the Wadi Nisah area (latitude 24°15N). Gradually, it diminishes uniformly as it extends away from this area towards both the north and south, where it reduces to a thickness of 45–60 m at its northern and southern extremities.
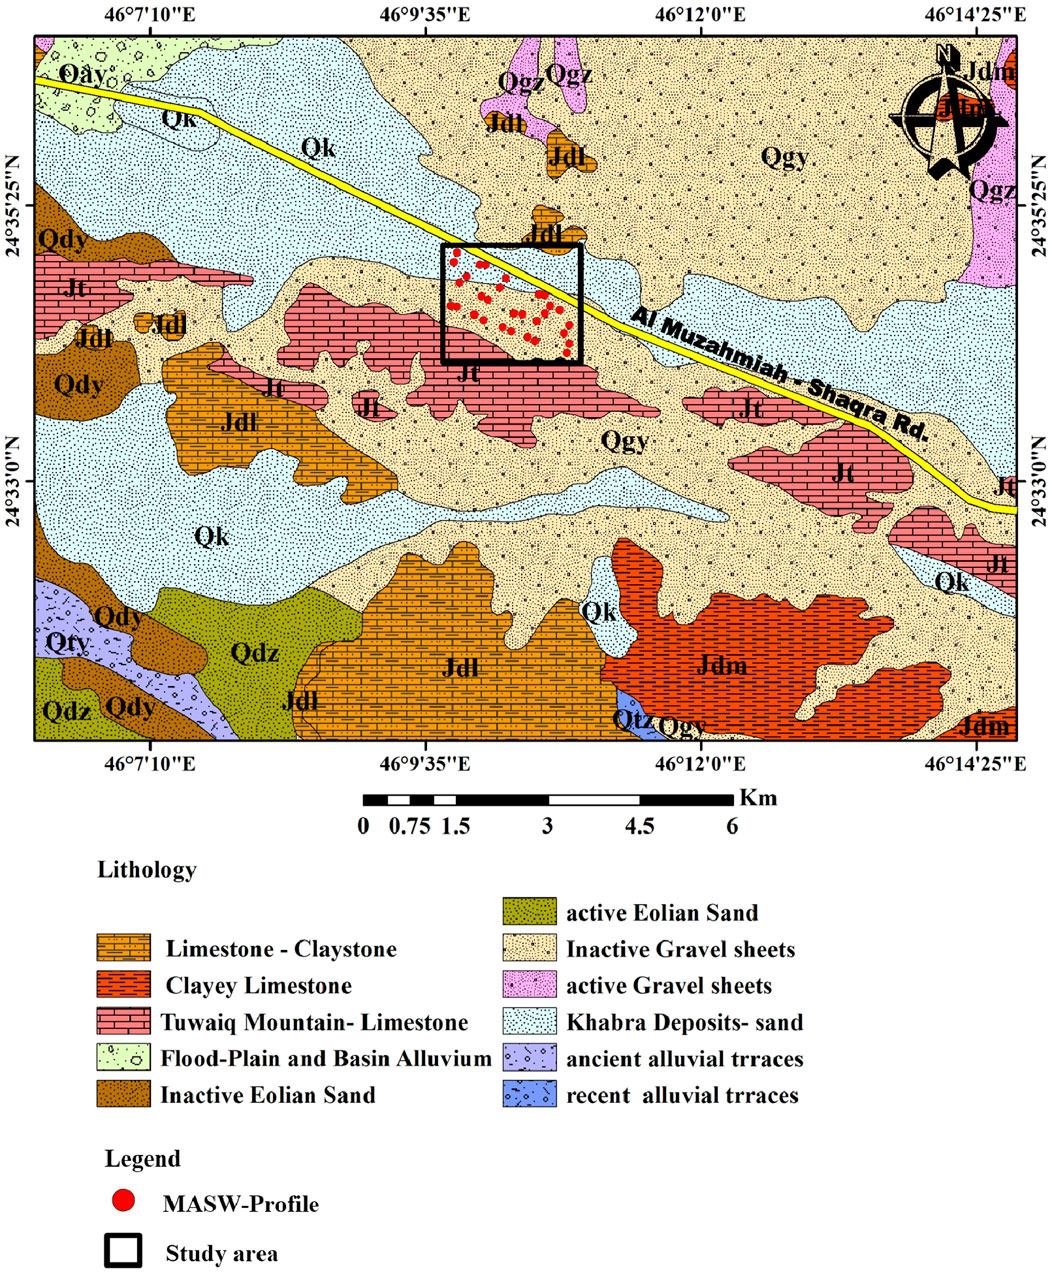
Figure 2. Geological map of study area (modified after Manivit et al., 1985).
The Tuwaiq Mountain Limestone Formation is one of the seven formations within the Shaqra group in Saudi Arabia (Manivit et al., 1990; El-Sorogy et al., 2016). Positioned above the Dhruma Formation with an unconformity, it primarily comprises carbonate deposits found in shallow-marine lagoon areas, rich in stromatoporoids. These deposits are from the Middle to Late Callovian age, totaling a thickness of approximately 295 m. It is disconformably overlain by the Hanifa Formation with apparent para-conformity in the outcrop (Al-Qahtani, 2013).
At Khashm Al-Qiddiyah section, the Tuwaiq Mountain Limestone reaches approximately 190 m in thickness, primarily consisting of shallow-marine lagoon carbonates. Its lower segment comprises yellowish-green marls containing gypsum veinlets, interspersed with thin fossiliferous limestone layers. The middle section exhibits a sequence of fine-grained or gravelly bioclastic limestones, topped by a conglomeratic limestone layer featuring numerous silicified corals. Towards the top of the section, there’s a massive bedded, chalky limestone with intermittent chert layers and lenses. The uppermost portion, around 25–40 m thick, is characterized by limestone-bearing corals, bioturbated limestone caps the Tuwaiq Mountain Limestone.
The Multichannel Analysis of Surface Waves method (MASW) (Park et al., 1999) is classified as an active surface method. MASW is a non-invasive seismic technique employed to assess the thickness and shear wave velocity of soil columns (Park et al., 1999). Surface wave techniques rely on determining shear wave velocity (Vs) profiles by utilizing the dispersive characteristics of Rayleigh waves as they travel through layered mediums. The MASW method captures wave images through a wave-field transformation process, resulting in a well-defined energy dispersion pattern. MASW is frequently utilized to outline and map the topographical boundary between soils and bedrock based on shear velocity (Table 1).
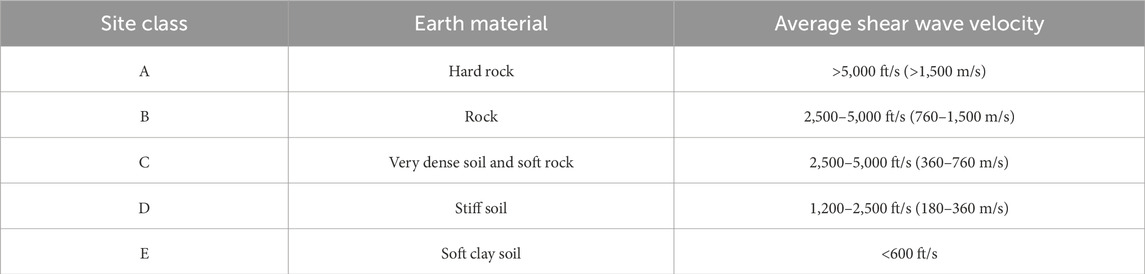
Table 1. Shear wave velocity (Vs) of some earth materials (NEHRP, 2001, National Earthquake Hazards Reduction Program).
MASW examines the dispersion properties of specific seismic surface waves, particularly fundamental-mode Rayleigh waves, which propagate directly along the measurement surface from the source point to the receivers. The Rayleigh wave is among the various surface waves that can be generated, being a prevalent type resulting from the interference of compressional (P) waves and vertically polarized shear waves (Sv) (Sauvin et al., 2016). By analyzing shear-wave velocity, one can ascertain the characteristics of Rayleigh waves and other elastic parameters. The calculation of in-situ shear wave velocity using MASW primarily relies on the features of surface wave propagation and velocity dispersion (Stokoe II et al., 1994a). Consequently, the stiffness of subsurface materials can be evaluated for geotechnical engineering purposes. A notable advantage of the MASW technique, in comparison to other seismic methods, is its capability to discern a low-velocity layer or zone beneath a high-velocity layer or zone in diverse geological settings.
Recent research and practical applications demonstrate the effectiveness of the method in accurately determining the distribution of shear wave velocity (Vs30) in both soil and rock (Ashraf et al., 2018). Additionally, it proves useful in estimating the site class of shallow subsurface geology, offering practical guidelines for implementation in real projects (Foti et al., 2018). The method has also been shown to be applicable in less accessible areas with alluvial deposits, using sparse MASW profiles with a fixed receiver and multi-source offset geometry (Faisal Rehman et al., 2018).
In this investigation, the Geode digital seismograph from Geometrics, Inc., United States, equipped with a set of 24 geophones, was utilized for data collection at 30 specific locations (Figure 3). Our primary objective involves determining the shear wave velocity of subsurface layers to a minimum depth of 30 m (see Table 2). To achieve this, the frequency content of the recorded data needed to be sufficiently low to obtain phase velocities at longer wavelengths. The lower frequency of signals means that a longer wavelength of surface waves is recorded which, in turn, results in a larger depth of investigation. To capture the lower frequency components effectively, 24 vertically polarized 4.5 Hz geophones were employed. The data acquisition for surface waves utilized a recording sampling interval of 0.125 ms and a recording length of 0.25 s.
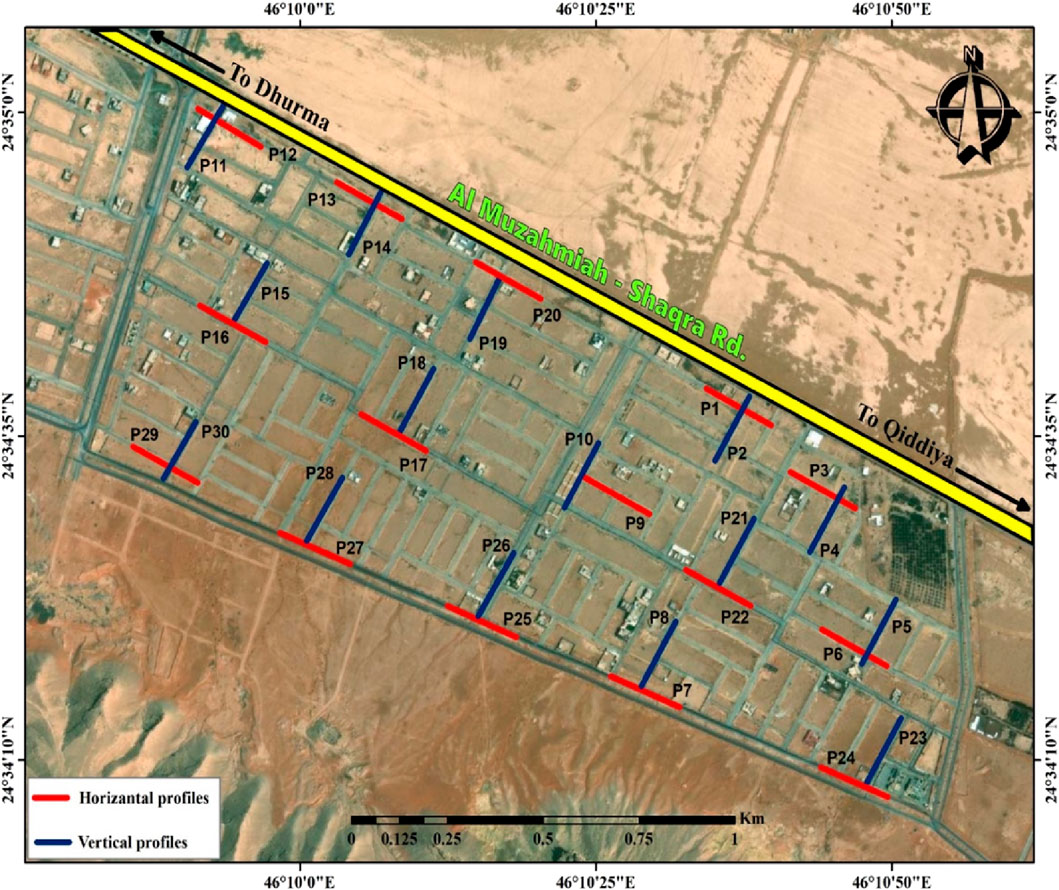
Figure 3. Location of MASW arrays in the study area.
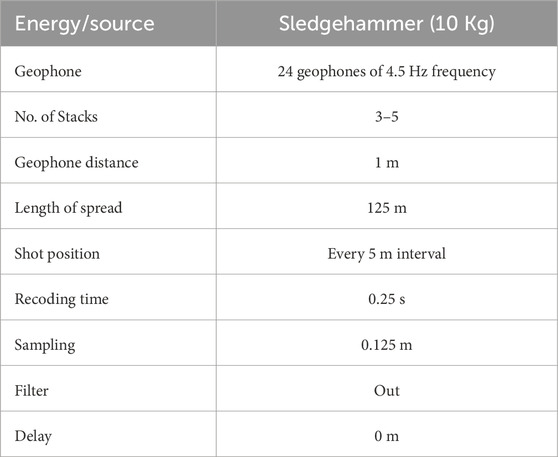
Table 2. MASW data acquisition parameters.
The main components of the field setup include the geophone spacing and the offset range. The planar characteristics of surface waves become evident only after a distance surpassing half of the maximum desired wavelength (Stokoe II. K. H. et al., 1994). For the MASW survey, the acquisition layout comprised a vertical sensor array with a 1 m geophone spacing and a 5 m shot interval. A land streamer was constructed with a 1 m geophone arrangement. Field observations led to fixing the source-to-nearest-receiver offset at 10 m for each shot, chosen to attain the required depth (Figure 4). The energy source for generating surface waves was a 10 kg sledgehammer and metal plate throughout the survey. The standard roll-along technique was employed to achieve a continuous shot gather along a line spread of 123 m. Additionally, 21 shot points were established for each 2D MASW profile. At each shot point, three to five shots were taken to enhance the signal-to-noise ratio and, consequently, improve data quality. This arrangement resulted in a 2D section spread over a distance of 123 m. Figure 5 displays two examples of seismic shot gathers along with the corresponding picked dispersion curves.
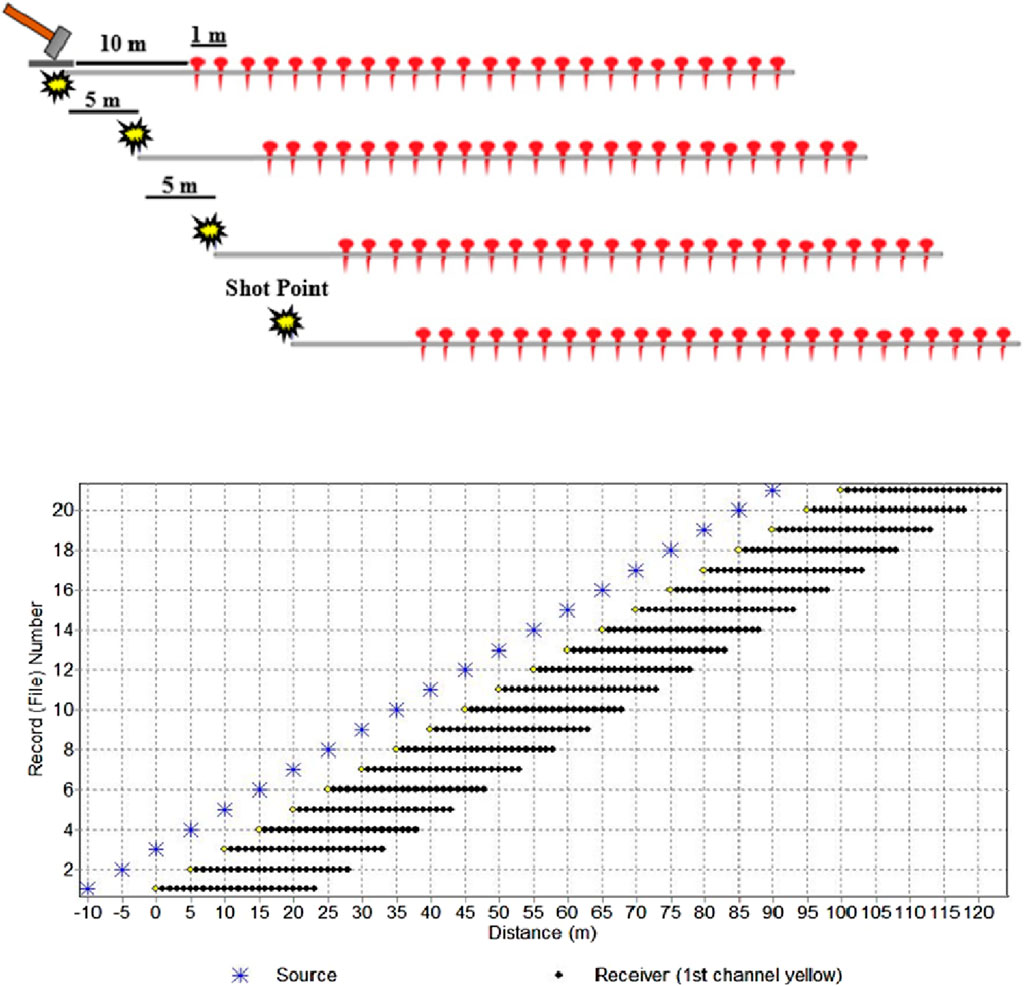
Figure 4. Layout for MASW survey at field and geometry of MASW profile for data processing.
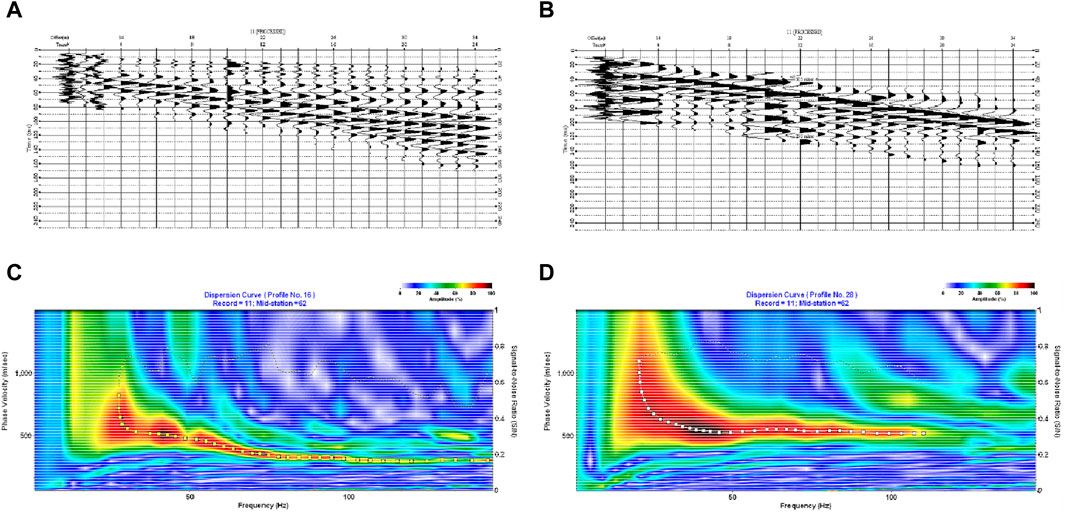
Figure 5. Top of the figure shows (A, B) two examples of shot gathers while the bottom part shows (C, D) the corresponding picked dispersion curves (black line) for lines #16 and 28. The white dot indicates picks made along the dispersion curve.
The details of acquisition parameters and the configuration of acquisition software for active MASW surveys were outlined by Park et al. (2002). Data acquisition was conducted using the Seismodule Controller Software (SCS) from Geometrics Inc., United States.
The processing of MASW data was executed using “SurfSeis 5.” Each shot gathered comprised 24-channel data, but some preprocessing was required for the shot to gather data. This involved: I) Converting the raw seismic data format (SEG-2) into the Kansas Geological Survey data processing format (KGS), consolidating all shot gathers for processing into a single file. Field geometry was assigned, and acquired data were compiled into the roll-along mode data set. II) Preprocessing data involves inspecting and removing bad records/traces. III) Examining the consistency of surface wave alignment with neighboring shot gather records. IV) Various factors, such as body waves and higher mode surface waves, interfere and disrupt the analysis. Although these noise sources can be partially controlled during data acquisition, complete elimination is not possible. The prevalence of such noise is typical with a greater offset distance between the source and receiver. Identification and elimination of the above noise were achieved through filtration and muting. V) Preliminary processing aimed to evaluate the optimal ranges of frequency and phase velocity.
The vital steps in analyzing the data to derive 2-D Vs pseudosections for the study site were as follows: 1) Identifying the surface (Rayleigh) wave from each shot gathered, 2) Generating the dispersion curve and estimating curves from each record, 3) Individually inverting each dispersion curve to obtain a variation of Vs with depth for each record, and 4) Creating 2-D Vs pseudosections by interpolating all obtained 1-D Vs models sequentially based on the receiver station. The 1-D Vs model was assigned to the center of the receiver spread. In Figure 6, the dispersion curve and 1D shear-wave velocity model resulting from the inversion technique of surface waves are depicted, along with the 2-D pseudosection formed through the interpolation of numerous 1-D Vs profiles and the Root Mean Square Error (RMSE) for each layer at line no. 28.
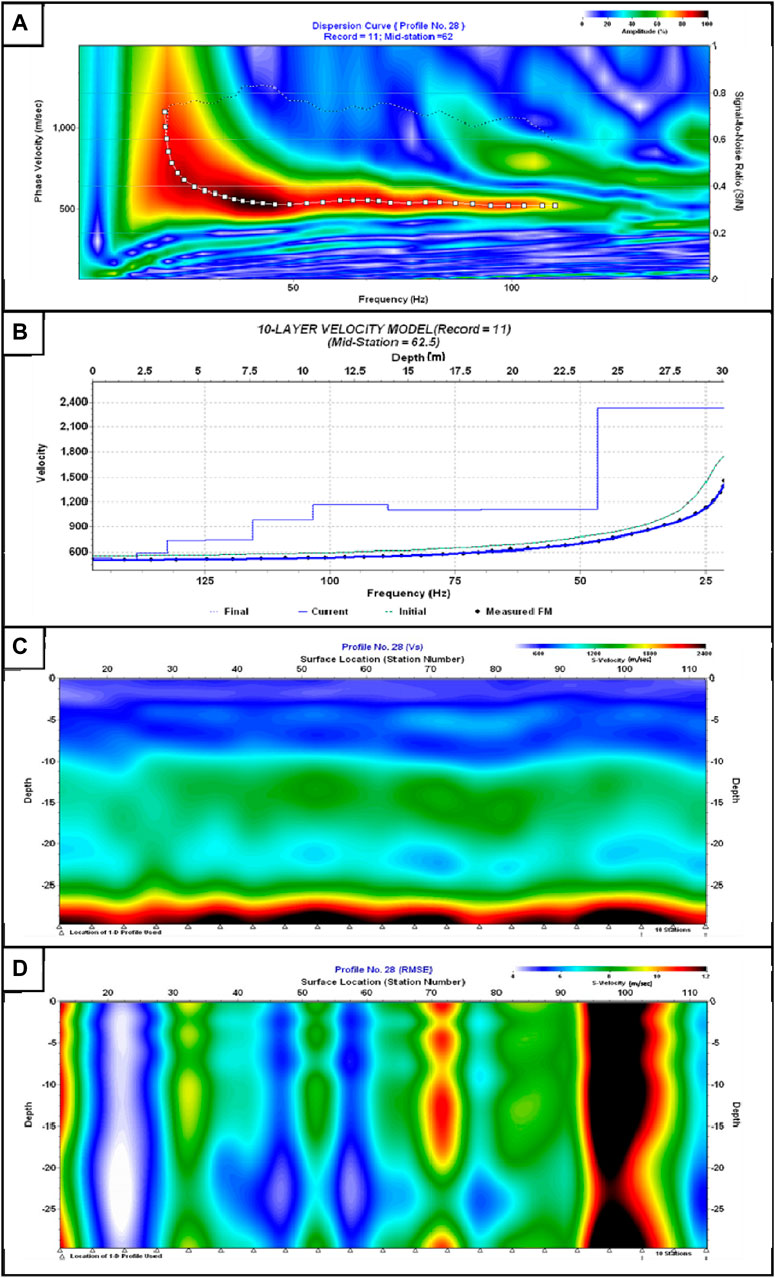
Figure 6. (A) Dispersion curve. (B) 1D shear-wave velocity model deduced from the inversion technique of surface waves. (C) The 2D Vs Pseudosection is composed of interpolation of several obtained 1D Vs profiles. (D) The RMSE measures the relative error for each layer in comparison to the theoretical criteria and can be used as a measure of confidence at line No. 28.
Subsequently, the data underwent analysis using MASW software. Following the examination of the overtone image for each shot gathered, depicting the phase frequency versus phase velocity, both phase velocity and phase frequency were assigned for dispersion analysis. The analysis focused on the fundamental mode of the surface wave as the input signal. The precision of the shear wave velocity (Vs) is contingent on generating a high-quality dispersion curve, a crucial step in surface wave data processing, given that the dispersion curve significantly influences confidence in the Vs profile. The dispersion program initiates by calculating phase velocities within the specified frequency range as determined by the input control parameters (either user-defined or automatically selected by the program). This calculation may be iterated multiple times using different values and sets of input parameters, assessing the output curves until an optimal solution is identified. Generally, the curve with the highest signal-to-noise ratio (S/N) is deemed the most favorable. The resulting Vs section exhibits a high S/N ratio, indicating a strong confidence in the obtained phase velocity-frequency curve.
Each dispersion curve undergoes individual inversion to generate a 1-D shear-wave velocity profile using the “SurfSeis 5”software. The inversion process employs the dispersion curve as the sole empirical data, without reference to the original seismic record. The inversion program commences by seeking a Vs profile whose theoretical dispersion curve aligns with the experimental dispersion curve obtained from dispersion analysis. The alignment is assessed based on the root-mean-square error (RMSE) between the two curves. The inversion algorithm initiates by calculating the theoretical curve using the initial Vs profile and then compares it with the experimental curve from an RMSE perspective. If the RMSE exceeds the specified minimum (Emin) in the control parameters, the inversion algorithm automatically adjusts the Vs profile and repeats the process by computing a new theoretical curve. Each cycle of this search is termed an iteration, and iterations continue until reaching either Emin or the maximum number of iterations (IMAX). These 1-D profiles are considered most representative of the material directly beneath the center of a geophone spread (Figure 6).
The resulting sets of 1-D plots representing shear-wave velocity profiles were interpolated to generate 2-D shear-wave velocity profiles at each site. Given that, a shot gather was recorded for each shot station, and a shear wave velocity trace was calculated for each station location, a unified 2-D contour plot of the shear wave velocity field could be created by organizing all velocity traces sequentially based on the receiver station. The low root mean square error (RMSE) in estimating Vs at most sites indicates a high level of confidence. RMSE is computed based on the Vs profile of a layer, with the theoretical dispersion curve that best matches the calculated dispersion curve, using RMSE as a guiding constraint. RMSE serves as a measure of relative error for each layer in comparison to theoretical criteria and can be utilized as an indicator of confidence (Xia et al., 1999). Figure 7 displays selected samples of the dispersion curve from various MASW lines.
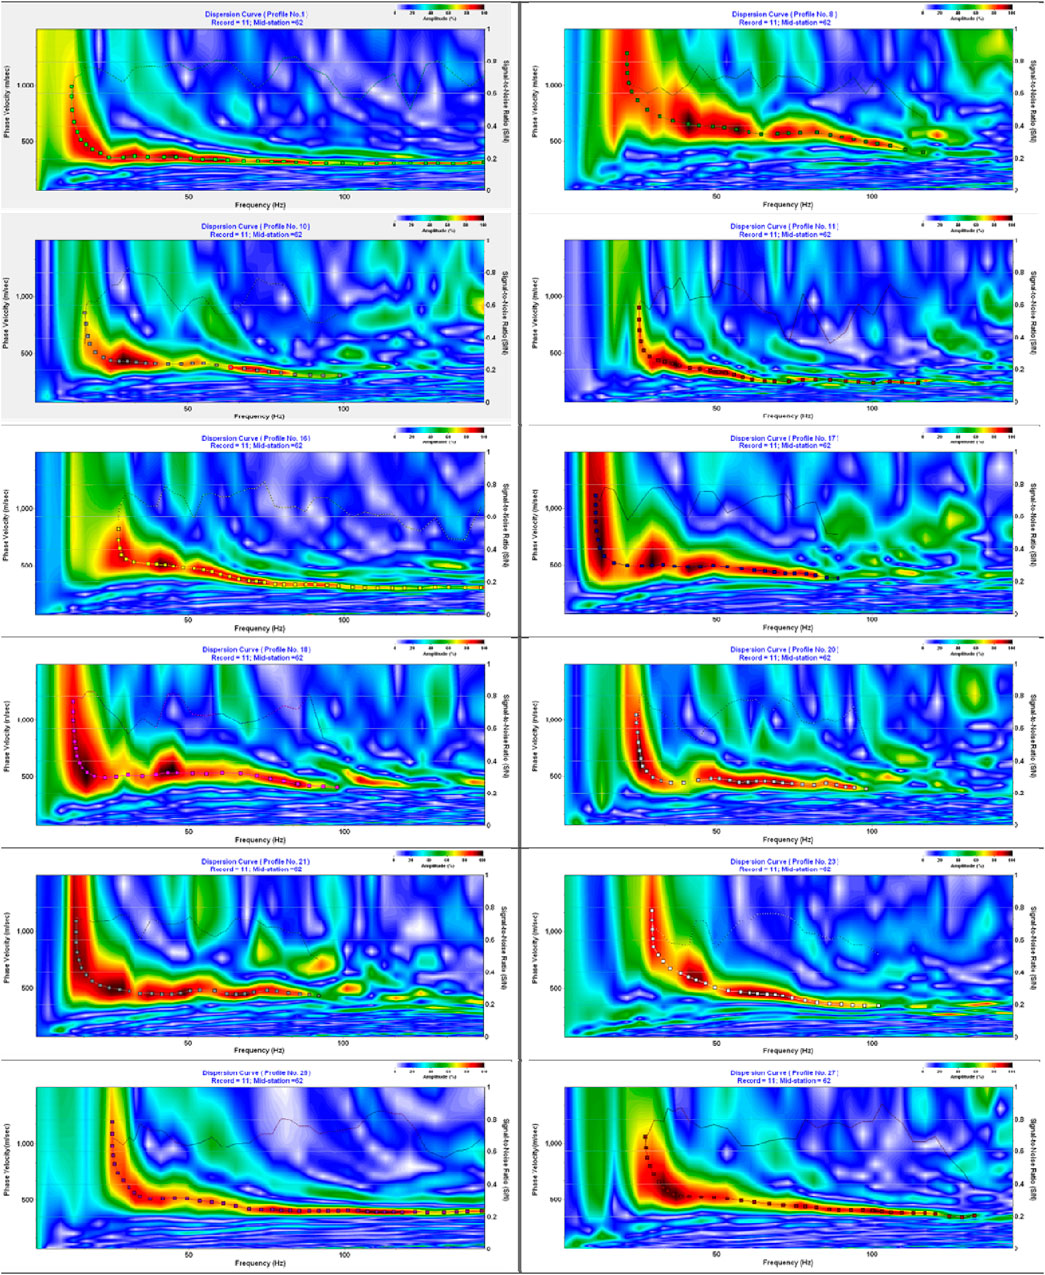
Figure 7. Selected examples of the dispersion curves (frequency-phase curves) for MASW arrays.
The ultimate outcomes of the MASW profiles for the study area were depicted as 2D shear wave sections (Figure 8). The shear-wave velocity exhibits a range from 210 m/s to 3,228 m/s, indicating variations in the composition of subsurface materials and rock qualities in the designated site. A rainbow color scale was employed to illustrate the relative changes in shear wave velocities. The weakness zones (sinkholes, cavities) have been identified through the study area based on MASW results as 2D and 3D shear wave sections (Figures 9, 10) and the locations of these profiles are illustrated in Figure 3. The high-resolution 3D slices obtained vividly reveal subsurface details down to approximately 30 m in depth, encompassing soft layers with varying degrees of compactness, along with rock materials exhibiting diverse elastic properties and stiffness.
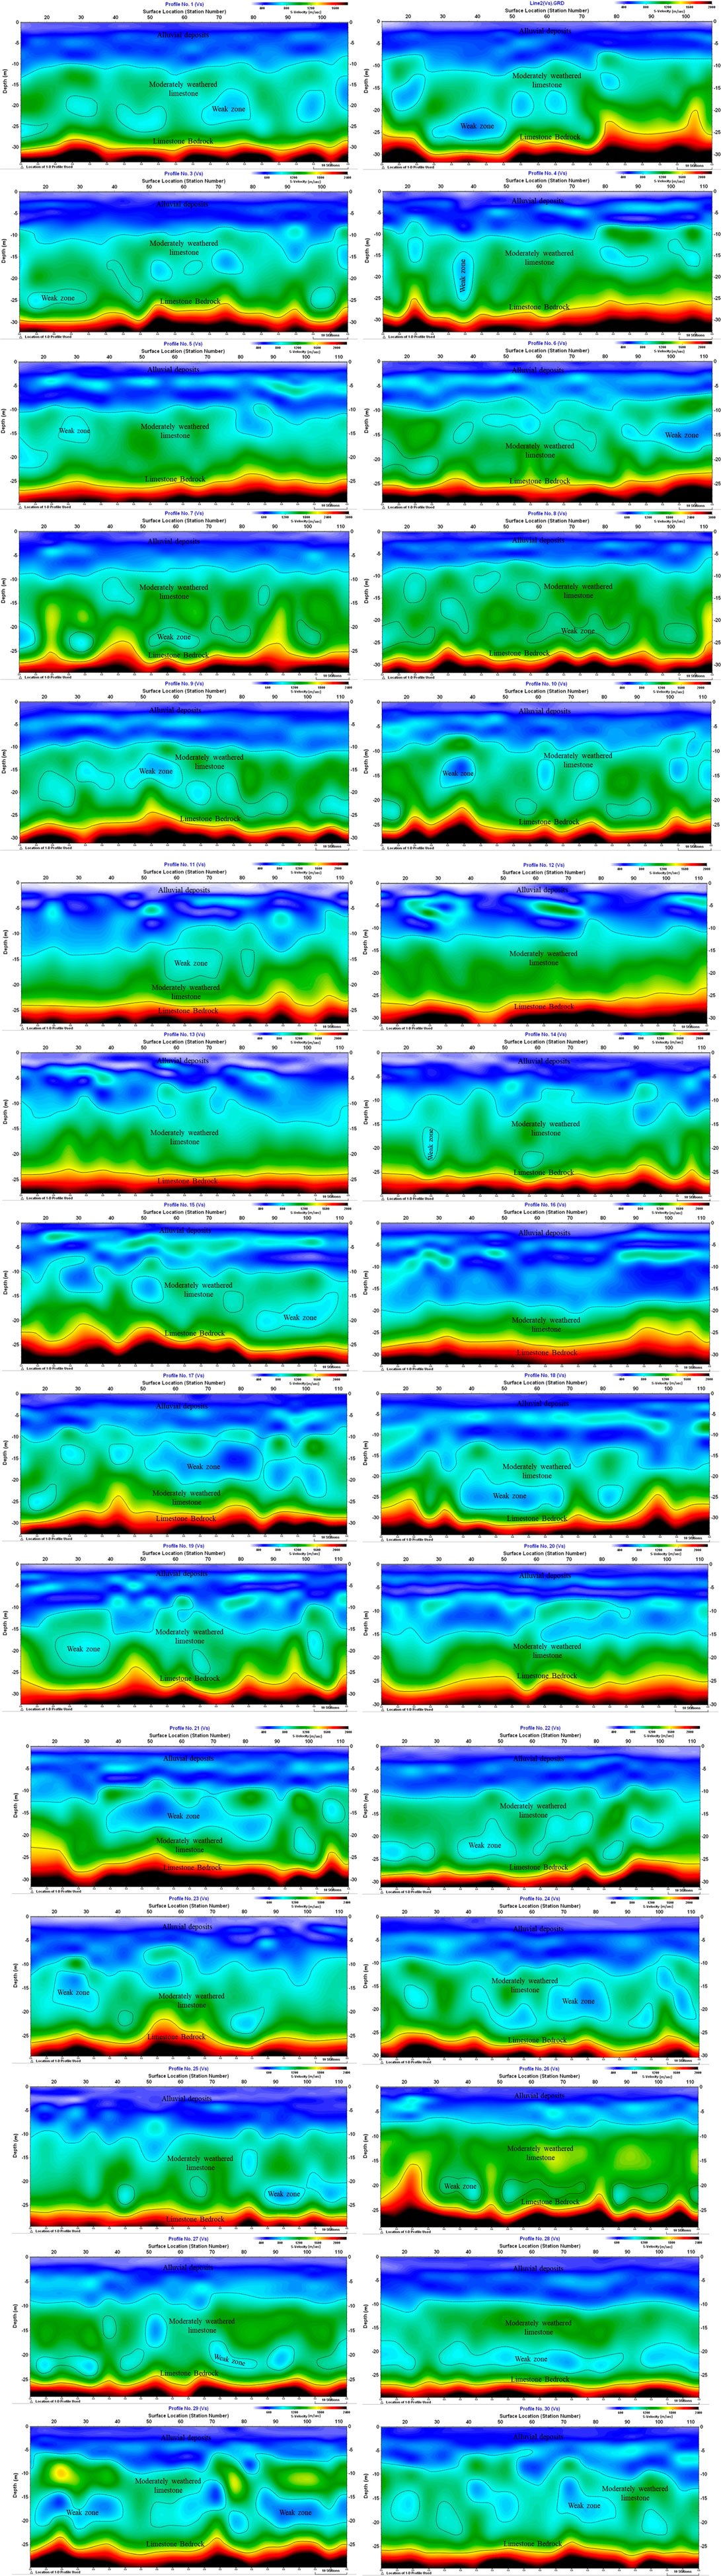
Figure 8. Selected 2D Shear wave velocity (Vs) pseudosections for all profiles in the study area. Fair stiff soil materials (blue color) and very dense soil/soft rock (light blue-green colors) correspond to different lithological units and rock qualities along the investigated area.
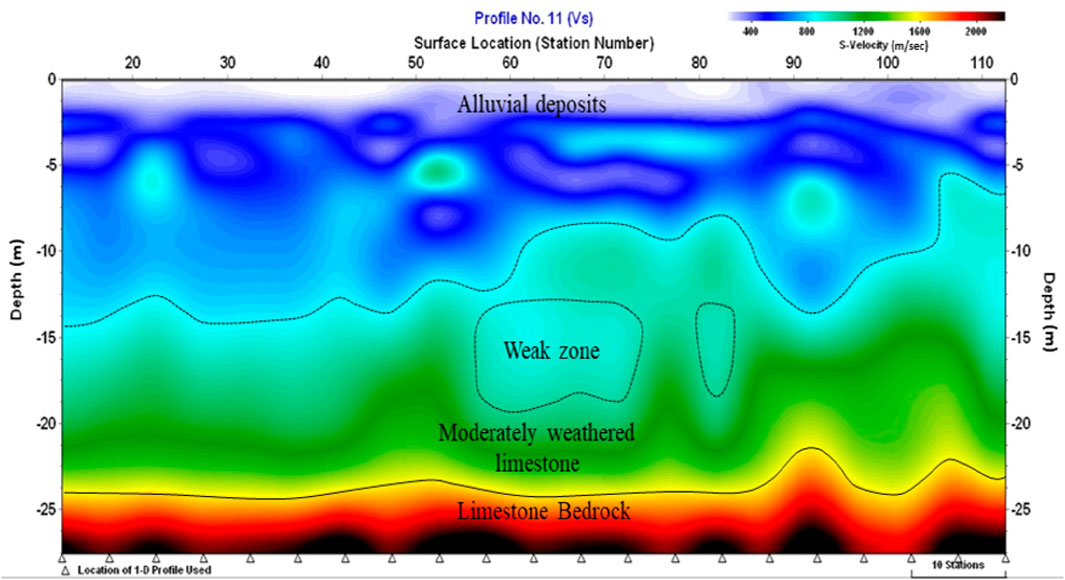
Figure 9. Example of 2D Shear wave velocity (Vs) model of MASW survey Line No. 11 with a total length of 123 m. The white triangles below refer to 1D vs. profile’s locations (21 locations).
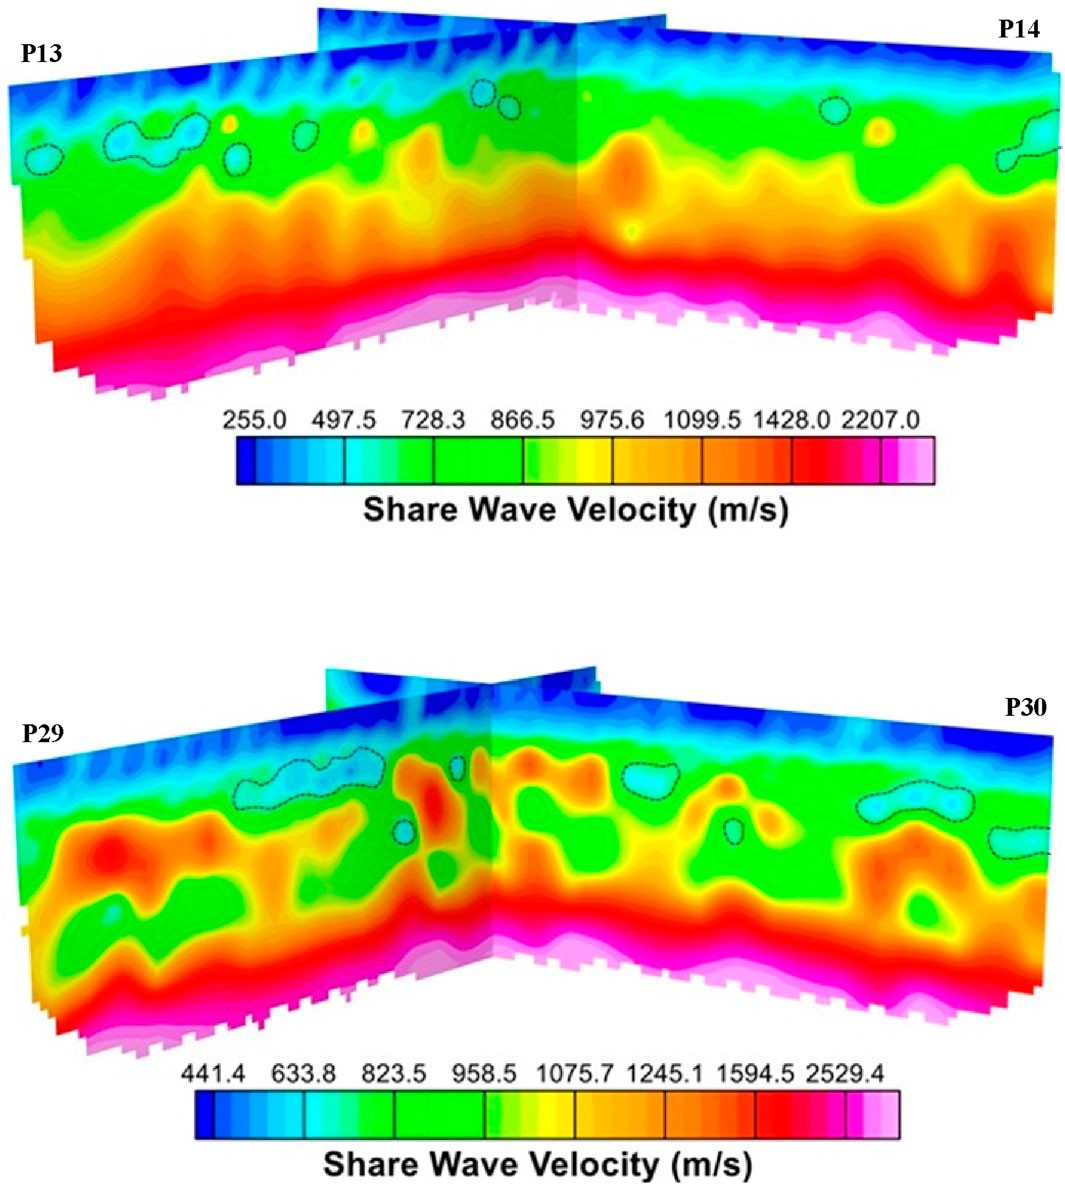
Figure 10. 3D Shear wave velocity (Vs) pseudosections of the study area.
The obtained MASW data provide cautious approximations of the average ground characteristics across the receiver spread, making shear-wave velocity and shear modulus reliable direct indicators of soil/rock stiffness. We observe in most of the sites studied there the low shear velocity values (i.e., sediments or rocks of low stiffness) within higher velocity values (i.e., sediments or rocks of higher stiffness) in some layers at a depth of more than 10 m one that can be interpreted as a cavity or weak zone as shown in Figures 8, 9.
Therefore, to characterize the study area and ascertain the stiffness of the subsurface geology, the calculated shear wave velocities along the conducted 30 lines were employed to estimate the average shear-wave velocity of the upper 30 m of the subsurface ground (average Vs30). The average Vs30 holds significant importance for civil and structural engineering design, seismic hazard assessment studies, and the estimation of soil/rock stiffness. Utilizing the average Vs30, a specific site class can be assigned for the study area following the classification outlined in the National Earthquake Hazards Reduction Program (NEHRP, 2001), as indicated in Table 1.
The shear wave velocity average for the upper 30 m was computed from 2D horizontally averaged profiles using the formula as outlined by (Wair et al., 2012):
In the given formula, di represents the thickness (measured in meters), and Vsi represents the shear-wave velocity in m/s (at a shear strain level of 10–5 or less) of the ith formation or layer within a total of n layers, existing in the top 30 m.
The Vs model derived from MASW line No. 11, as depicted in Figure 9, was chosen to provide a more detailed insight into the key features of the study site concerning geotechnical considerations. In the initial shear wave velocity (Vs) zone, the surface and very near-surface materials exhibit low Vs values ranging from 180 m/s to 360 m/s. This predominantly indicates a stiff material associated with silty sand, along with some gravel and sandy deposits. The subsequent zone represents medium to very dense soil, featuring shear wave velocity values ranging from 360 m/s to 760 m/s. This zone is attributed to a sequence of silty clay and silty sand layers extending from 3 m to approximately 10 m. At an approximate depth of 12 m, a high shear velocity layer (760 m/s to 1,500 m/s) was identified, extending to a maximum depth of 22 m. This deepest layer may indicate less weathered/fractured bedrock associated with limestone. The final layer exhibits very high shear velocity (more than 1,500 m/s) at a depth beyond 22 m, suggesting bedrock associated with hard limestone. The MASW data results indicate the presence of various soil and rock materials such as sand, clay, gravel, and limestone. Note there the low shear velocity values (i.e., sediments or rocks of low stiffness) within higher velocity values (i.e., sediments or rocks of higher stiffness) in some layers at a depth of more than 10 m one that can be interpreted as cavity or weak zone.
The engineering bedrock is defined as that rock with 760 m/s shear wave velocity in the 1D vertical shear wave velocity profile (Wair et al., 2012). Among the 30 locations of the MASW survey, bedrock depth varies from 2 m to 12 m depth. The majority of bedrock depth values in our study area are less than 11 m. The central part of the study area towards the east has deeper bedrock (more than 8 m). The bedrock map was prepared using bedrock depth distribution data of all these locations. Figure 11 shows the bedrock distribution map in the studied area. The variation in bedrock depth varies from approximately 2–12 m. In the northwestern part, the depth of bedrock is higher than southeastern area. In the central part of the study area, we have deep bedrock. The southeastern part has comparatively shallower bedrock. The depth of bedrock decreases from northwest to southeast along the study area.
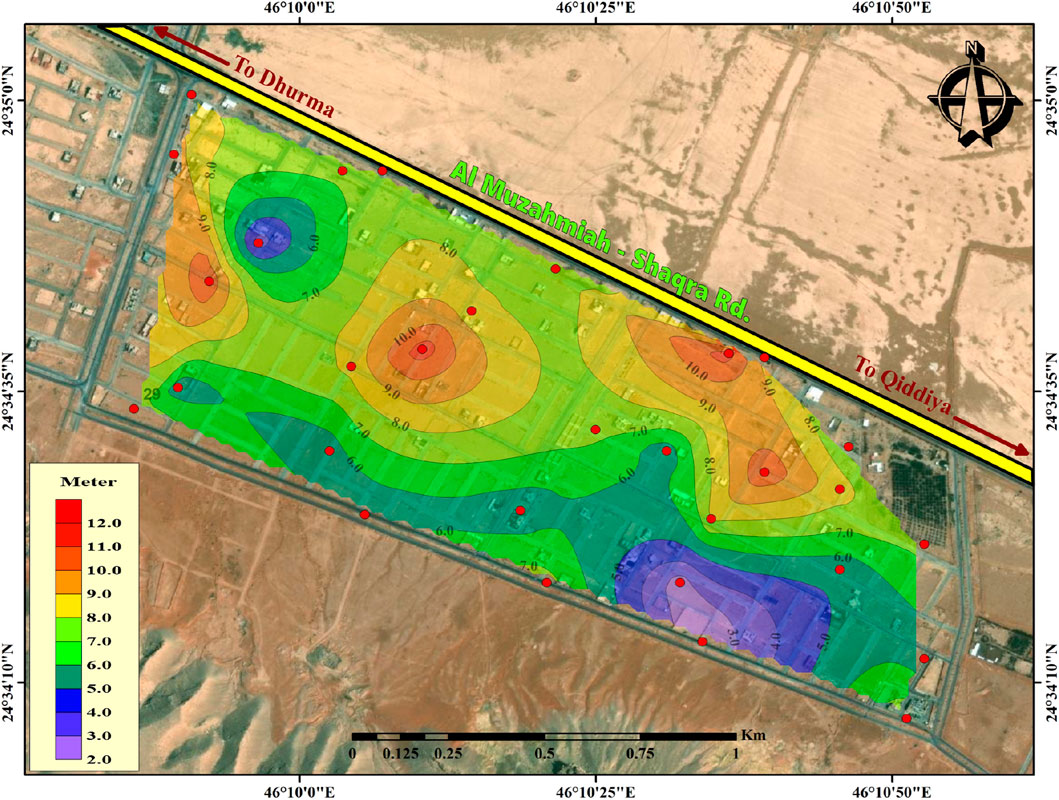
Figure 11. Depth variation of bedrock in the study area.
The area of study was classified based on Vs30 according to the National Earthquake Hazard Reeducation Program (NEHRP, 2001) as outlined in Table 1. Using the average shear-wave velocities calculated at each receiver along the conducted MASW lines (30 lines), a Vs30 map for the site was created to illustrate the general variation of Vs30 across the entire study area (Figure 12). The map reveals a Vs30 range from 443.71 m/s to 639.78 m/s for the soil, with an average value of 551.2 m/s for the entire study area. Although the average Vs30 map shows comparatively heterogeneous geology reflected by variable velocities over the study area, low Vs30 values (ranging from 443.71 m/s to 492.44 m/s) were observed in the northwestern part of the study area. Medium Vs30 values (ranging from 510.76 m/s to 556.17 m/s) were found in the southeastern and parts of the northwestern. High Vs30 values (ranging from 561.31 m/s to 597.24 m/s) were identified in the southeastern, western, and some central parts of the study area. In the western region of the study area, very high Vs30 values (ranging from 602.41 m/s to 639.78 m/s) were observed.
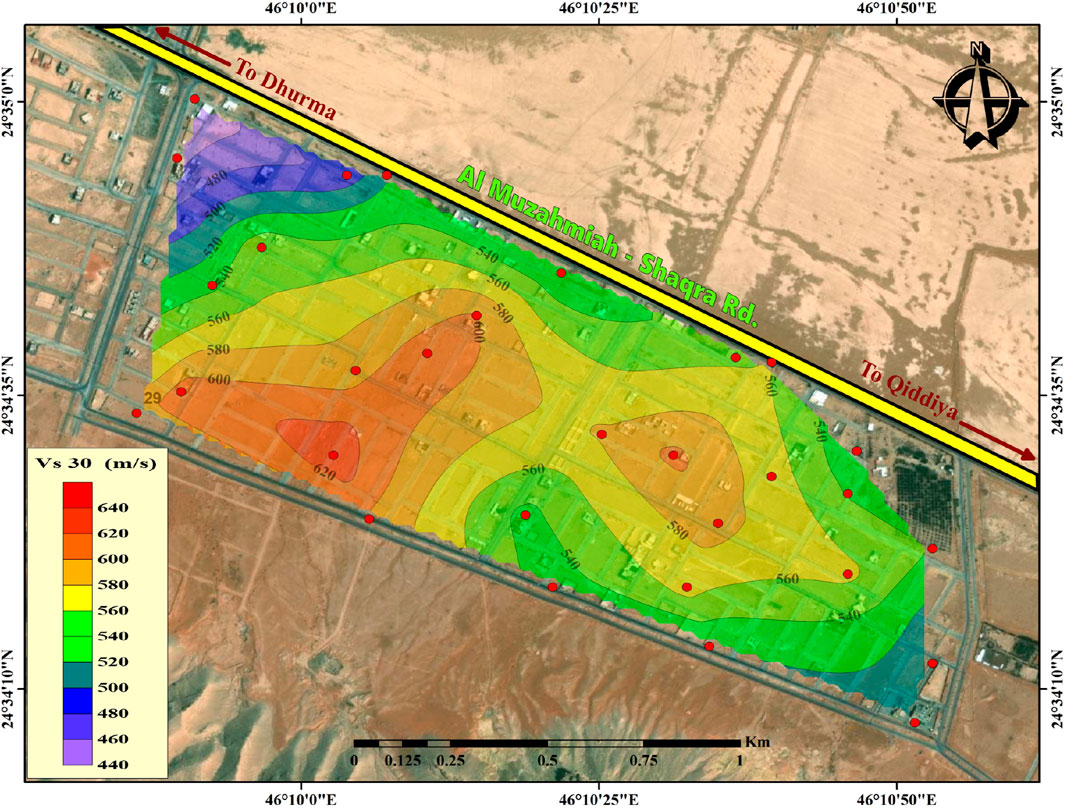
Figure 12. Average Vs30 map of the study area.
The average shear-wave velocity within the upper 30 m of the Earth, known as VS30, holds significant importance in the classification of sites according to recent building codes (Dobry et al., 2000; BSSC, 2001a) and plays a crucial role in loss estimation. The site classes derived from models of shallow shear-wave velocity are essential for developing strong-motion prediction equations, creating maps of National Earthquake Hazard Reduction Program (NEHRP) site classes, and applying building codes to specific locations.
The NEHRP soil classification originated from observations and theoretical analyses in the western United States, with a particular focus on California (Borcherd, 1994). The Building Seismic Safety Council (BSSC, 1998), in its NEHRP, recommended provisions for seismic regulations and endorsed this methodology. The NEHRP approach outlines six soil categories determined by factors such as Vs30, standard penetration test (SPT) value, or undrained shear strength within the top 30 m (100 feet) of the soil column. Table 1 displays the NEHRP classification code, defined about Vs. The Vs30 map has been converted into site classification following NEHRP (2001) guidelines (Figure 13) which is considered the most recommended and worldwide scale.
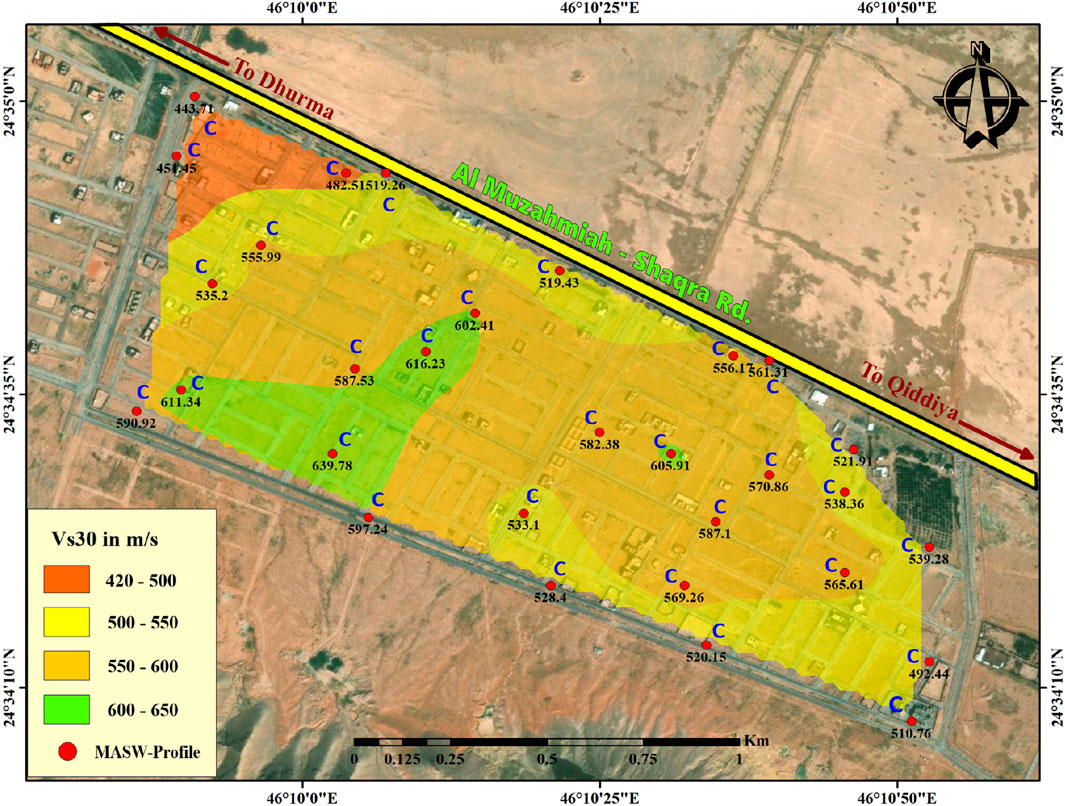
Figure 13. Soil classification map for the study area.
Figure 13 reveals that the entire study area falls under the C class but there are variations in the velocity values. When correlated with Vs30 values, the majority of soils are categorized as very dense soil (or soft rock). These sites exhibit relatively thick layers of silty sand, weathered bedrock, and gravel deposits. Most C-class sites have velocities within the middle to upper range of this category, aligning with the NEHRP (2001) standards of 443.71–639.78 m/s, with an average value of 551.2 m/s for the entire study area. The average Vs30 shows comparatively heterogeneous lithology reflected by variable velocities over the study area where low Vs30 values (ranging from 443.71 m/s to 492.44 m/s) were observed in the northwestern part of the study area. Medium Vs30 values (ranging from 510.76 m/s to 539.28 m/s) were found in the southeastern and parts of the northwestern. High Vs30 values (ranging from 555.99 m/s to 597.24 m/s) were identified in the central zone towards the east and west along the study area. While, in the western region of the study area, very high Vs30 values (ranging from 602.41 m/s to 639.78 m/s) were observed.
Moreover, contour map was created showing the changes in the thickness of soil class C only (Figure 14). The thickness varies from 2 to 11.7 m. The central part of the study area has a high thickness (more than 7 m). The northwestern and southeastern parts have comparatively shallower thicknesses.
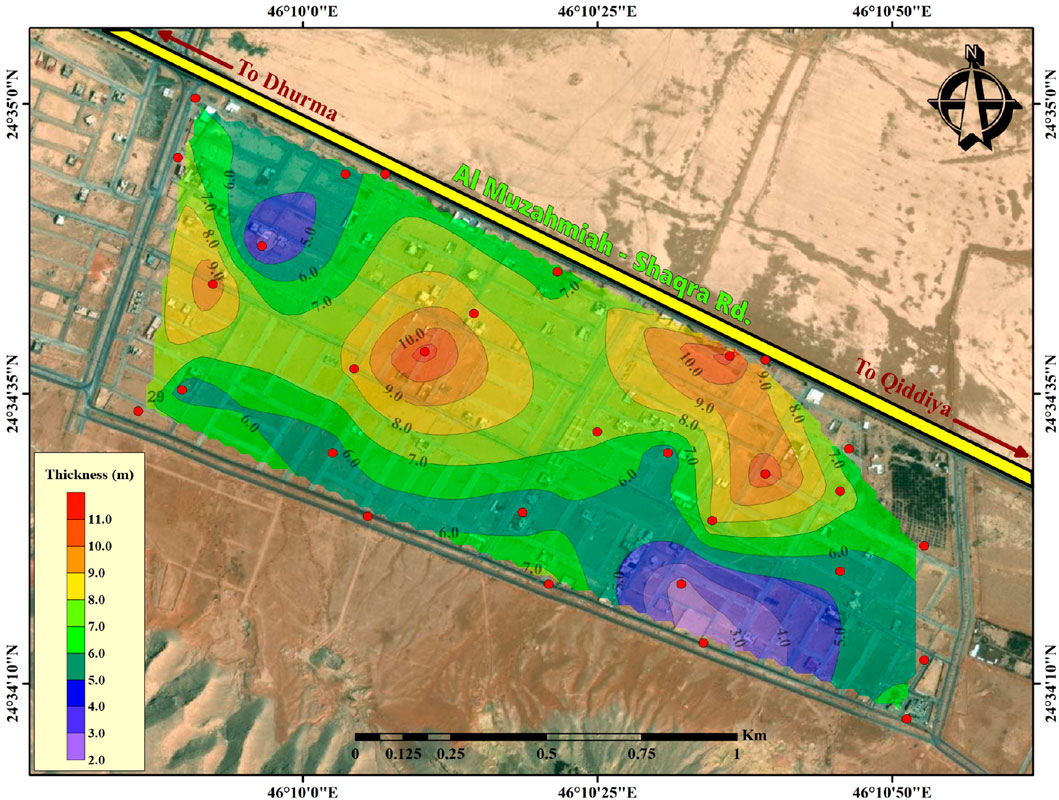
Figure 14. Thickness map of soil class C only for the study area.
Several researchers have delved into problems related to ground conditions showing subsurface cavities using boreholes (Figure 15). Abdeltawab (2013) explored Karst limestone foundation geotechnical problems and treatment in Riyadh City and it has been detected Karst limestone foundation bedrock (caves, sinkholes, and open fractures) by using geological studies including detailed geological and geomorphological mapping for the site and geophysical studies include 2D Electrical Resistivity imaging survey. Abd El Aal (2017) identified and characterized near-surface cavities in Tuwaiq Mountain Limestone, Riyadh, using borehole and ERT data for locating weak zones or subsurface cavities in karst regions. The electrical resistivity traverses and boreholes drilling technique effectively created the subsurface imaging at the study site and it has been revealed the karst features such as fill cavity, boulder, pinnacle, discontinuity, and overhang were detected in the survey lines. The drilling result validated the cavity location and existence delineated by the ER technique and lent credence to its applicability in karst terrain.
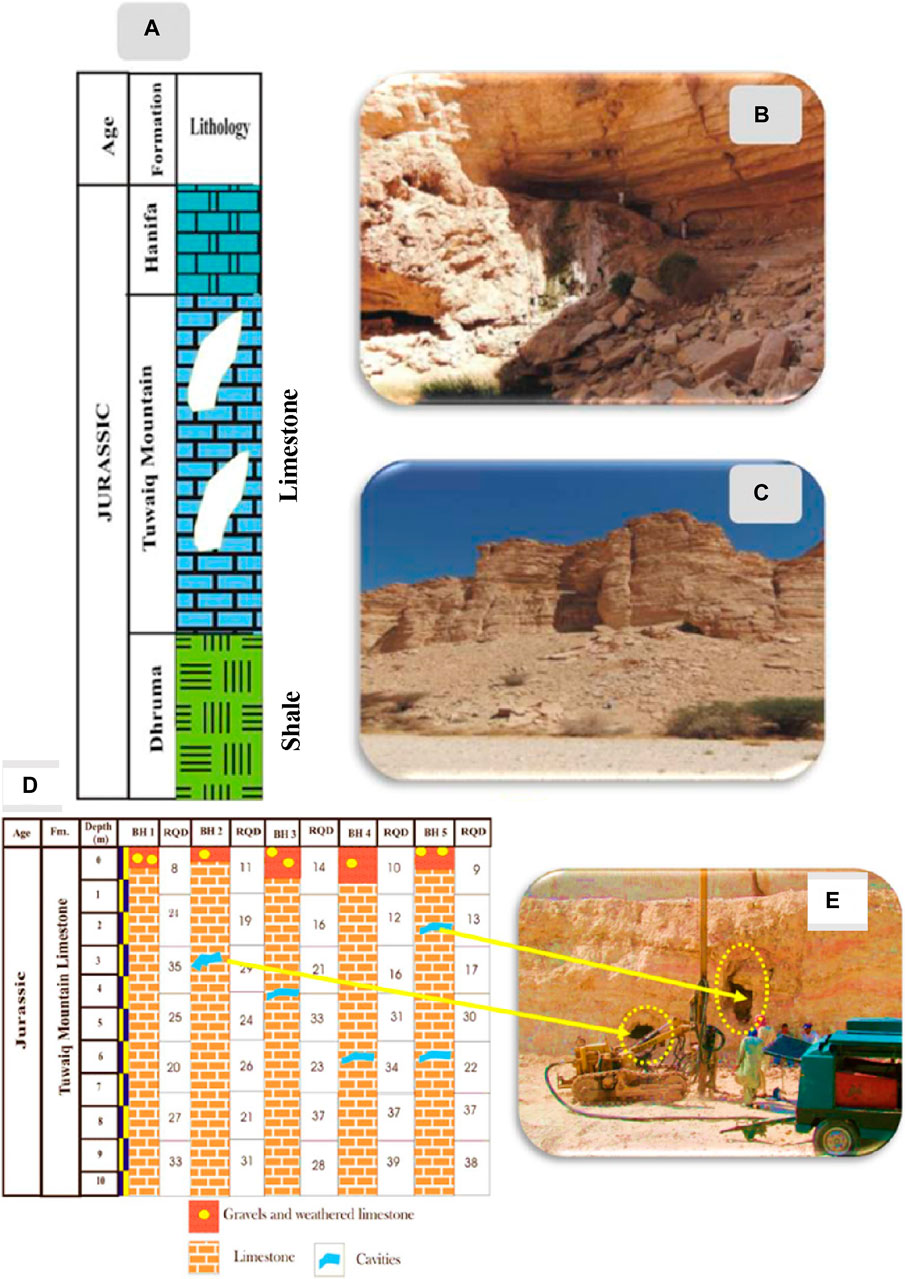
Figure 15. (A) Stratigraphic columnar section of Tuwaiq Mountain Formation and parts of the underlying Dhruma Formation and the overlying Hanifa Formation, (B, C) solution side wall developed caves, (D) Subsurface log of five 10 m deep boreholes with solution cavities in the Tuwaiq Mountain Limestone, (RQD rock quality designation). (E) A field photo revealing the presence of cavities after trenching (after Abd El Aal, 2017; Abd El-Aal et al., 2021).
Furthermore, Abd El-Aal and Masoud (2017) conducted a study to evaluate the impact of karst phenomena on the engineering properties of limestone foundation beds in Riyadh City. Their results from field and laboratory tests suggest that the Tuwaiq Mountain Limestone rock cores, caving, and karst create potential weakness and heterogeneity in the limestone rocks. Moreover, Abd El-Aal et al. (2021) conducted geophysical and borehole investigations to explore the sites of buried cavities and related subsidence in Riyadh City. The geophysical studies are represented by the interpretation of ground penetrating radar (GPR) images, while the borehole investigations were done through five drilled boreholes. Five cavities of 2.5–7 m depth were detected underneath the ground at four boreholes. Two layers are detected in the 10 m deep boreholes; the first of which is composed of crushed, highly weathered, limestone, gravel, sand, and boulders (with an average thickness of 0.7 m), while the second layer is composed of hard cavernous, pale yellow to creamy fractured limestone bedrock. This limestone layer contains some rock fragments and some cavities which are filled with yellowish-red-grinded particles.
The MASW technique has been employed for site characterization to obtain a subsurface shear wave velocity profile. The primary objective of this study was to characterize soil deposits and examine their dynamic properties. Soil classification maps, considering depth to bedrock and VS30 by NEHRP (2001) guidelines, were developed. The velocity data were utilized to estimate the depth to engineering bedrock, assuming Vs = 760 m/s for bedrock. Additionally, one-dimensional shear velocity profiles were generated through horizontal averaging at each MASW profile.
The outcomes of the one-dimensional surface wave inversion in our study area enabled the creation of maps depicting the depth to engineering bedrock and soil classification based on Vs30. The depth to bedrock exhibits variations ranging from 2 m to 12 m across the study area, predominantly influenced by the dynamic properties of the sediments. The northwestern region tends to have deeper bedrock compared to the southeastern area, while the central part displays deeper bedrock. Conversely, the southeastern part experiences relatively shallower bedrock. The depth of bedrock decreases from northwest to southeast along the study area.
The shear wave velocity (Vs) values within the study area, as obtained from a 1D profile, span from 238 m/s to 3,228 m/s. Meanwhile, the Vs30 values for soil range from 443.71 m/s to 639.78 m/s. The calculated average shear-wave velocity (Vs30) for the entire site is approximately 551.2 m/s, categorizing the investigated site as Class C (indicating very dense soil and soft rock) according to NEHRP (2001) standards. Sites classified as NEHRP site class C typically exhibit relatively thick layers of silty sand, along with angular to sub-angular gravel and cobble deposits.
The initial shear wave velocity (Vs) zone reveals low Vs values (180 m/s to 360 m/s) in surface and near-surface materials, predominantly indicating stiff materials associated with silty sand, along with some gravel and sandy deposits. The second zone, featuring shear wave velocity values ranging from 360 m/s to 760 m/s, signifies a medium to very dense soil characterized by layers of silty clay and silty sand extending from 3 m to about 10 m in depth. A higher shear velocity layer (760 m/s to 1,500 m/s) is identified at an approximate depth of 12 m, extending to a maximum depth of 22 m. This deeper layer suggests less weathered or fractured bedrock associated with limestone. The final layer exhibits very high shear velocity (more than 1,500 m/s) at a depth greater than 22 m, indicating bedrock associated with hard limestone. Note there the low shear velocity values (i.e., sediments or rocks of low stiffness) within higher velocity values (i.e., sediments or rocks of higher stiffness) in some layers at a depth of more than 10 m one that can be interpreted as cavity or weak zone. Based on the aforementioned findings, it is strongly advised to:
❖ Utilize these results for the enhancement of the Saudi Building Code (SBC), particularly for urban regions.
❖ Ensure that these results are considered by civil engineers and decision-makers before initiating the construction of new buildings in the study area.
The original contributions presented in the study are included in the article/supplementary material, further inquiries can be directed to the corresponding author.
KA: Writing–review and editing, Writing–original draft, Investigation, Formal Analysis, Data curation, Conceptualization. AS: Writing–review and editing, Writing–original draft, Investigation, Formal Analysis, Data curation, Conceptualization. SQ: Writing–review and editing, Supervision, Resources, Project administration, Funding acquisition.
The author(s) declare financial support was received for the research, authorship, publication of this article. This article was funded by Researchers Supporting Project number (RSP 2024R432), King Saud University, Riyadh, Saudi Arabia.
The authors declare that the research was conducted in the absence of any commercial or financial relationships that could be construed as a potential conflict of interest.
All claims expressed in this article are solely those of the authors and do not necessarily represent those of their affiliated organizations, or those of the publisher, the editors and the reviewers. Any product that may be evaluated in this article, or claim that may be made by its manufacturer, is not guaranteed or endorsed by the publisher.
Abdallatif, T. F., Khozym, A. A., and Ghandour, A. A. (2022). Determination of seismic site class and potential geologic hazards using multi-channel analysis of surface waves (MASW) at the Industrial City of Abu Dhabi, UAE. NRIAG J. Astronomy Geophys. 11 (1), 193–209. doi:10.1080/20909977.2022.2055829
Abd El Aal, A. (2017). Identification and characterization of near-surface cavities in Tuwaiq Mountain Limestone, Riyadh, KSA, “detection and treatment”. Egypt. J. Petroleum 26 (1), 215–223. doi:10.1016/j.ejpe.2016.04.004
Abd El-Aal, A. E. A. K., Yagi, Y., Kamal, H., and Abdelrahman, K. (2016). Implementation of integrated multi-channel analysis of surface waves and waveform inversion techniques for seismic hazard estimation. Arabian J. Geosciences 9 (4), 322. doi:10.1007/s12517-016-2329-6
Abd El-Aal, A. K., and Masoud, A. A. (2017). Impacts of karst phenomena on engineering properties of limestone foundation bed, Ar Riyadh, Saudi Arabia. Arabian J. Geosciences 10, 1–17. doi:10.1007/s12517-017-3089-7
Abd El-Aal, A. K., Salah, M. K., Ansari, M. K., Ahmad, M., and Singh, T. N. (2021). Geophysical and borehole investigations of subsurface hazardous karsts in Ar-Riyadh city, Kingdom of Saudi Arabia. Carbonates Evaporites 36, 1–13. doi:10.1007/s13146-021-00716-7
Abdelrahman, K., Alamri, A. M., Al-Otaibi, N., and Fnais, M. (2020). Geotechnical assessment for the ground conditions in Makah Al-Mukarramah city, Saudi Arabia. J. King Saud University-Science 32 (3), 2112–2121. doi:10.1016/j.jksus.2020.02.011
Abdelrahman, K., Al-Amri, A. M., Fnais, M. S., Qaysi, S., Abdelfattah, A. K., and Al-Otaibi, N. (2021d). Site effect and microzonation of the Jizan coastal area, southwestern Saudi Arabia, for earthquake hazard assessment based on the geotechnical borehole data. Arabian J. Geosciences 14 (8), 688. doi:10.1007/s12517-021-07049-8
Abdelrahman, K., Al-Otaibi, N., and Ibrahim, E. (2021a). Assessment of land subsidence as an environmental threat facing Dammam city, eastern Saudi Arabia based on soil geotechnical parameters using downhole seismic approach. J. King Saud Univ. - Sci. 33 (1), 101233. doi:10.1016/j.jksus.2020.101233
Abdelrahman, K., Al-Otaibi, N., and Ibrahim, E. (2021b). Environmental hazard assessment for ground failure in Jeddah city, western Saudi Arabia, through cross-hole seismic testing. J. King Saud University-Science 33 (1), 101274. doi:10.1016/j.jksus.2020.101274
Abdelrahman, K., Ibrahim, E., Qaysi, S., Mogren, S., Zaidi, F., and Ghrefat, H. (2021c). Evaluation of kinetic moduli and soil competence scale of soil profiles in Jizan area, southwestern Saudi Arabia. Arabian J. Geosciences 14 (3), 172. doi:10.1007/s12517-020-06376-6
Abdeltawab, S. (2013). Karst limestone foundation geotechnical problems, detection and treatment: case studies from Egypt and Saudi Arabia. Int. J. Sci. Eng. Res. 4 (5), 376–387.
Al-Amri, A., Fnais, M., Abdelrahman, K., Abdelmoneim, E., and Alqarni, H. (2016). New methods to improve the assessment of shear wave velocities and seismic hazard parameters in Jeddah city, western Saudi Arabia. Arabian J. Geosciences 9 (3), 220. doi:10.1007/s12517-015-2297-2
Alamri, A. M., Bankher, A., Abdelrahman, K., El-Hadidy, M., and Zahran, H. (2020). Soil site characterization of Rabigh city, western Saudi Arabia coastal plain, using HVSR and HVSR inversion techniques. Arabian J. Geosciences 13 (1), 29. doi:10.1007/s12517-019-5027-3
Aldahri, M., Mogren, S., Abdelrahman, K., Zahran, H., El Hady, S., and El-Hadidy, M. (2017). Surface soil assessment in the Ubhur area, north of Jeddah, western Saudi Arabia, using a multichannel analysis of surface waves method. J. Geol. Soc. India 89 (4), 435–443. doi:10.1007/s12594-017-0626-7
Al-Heety, A. J., Hassouneh, M., and Abdullah, F. M. (2021). Application of MASW and ERT methods for geotechnical site characterization: a case study for roads construction and infrastructure assessment in Abu Dhabi, UAE. J. Appl. Geophys. 193, 104408. doi:10.1016/j.jappgeo.2021.104408
Al-Heety, A. J., Shanshal, Z. M., and Al-Mashhadany, A. Y. (2022). Application of Multi-Channel Analysis surface waves and electrical resistivity tomography methods to identify weak zones at university of mosul, northern Iraq. Iraqi Geol. J. 55 (1D), 47–69. doi:10.46717/igj.55.1D.4Ms-2022-04-20
Almadani, S. A., Abdelrahman, K., and Qaysi, S. (2021). Integrated geoinvestigation for evaluation of an engineering site—a case study from the western Riyadh city, central Saudi Arabia. Arabian J. Geosciences 14 (5), 380. doi:10.1007/s12517-021-06767-3
Al-Qahtani, K. M. (2013). Stratigraphy, macrofaunal assemblages and paleoenvironments of the jurassic sequence (callovian - kimmeridgian) of Central Saudi Arabia. Cairo, Egypt: Al-Azhar University, 284. Unpublished Ph.D.
Al-Saigh, N. H., and Al-Heety, A. J. (2013). Seismic refraction tomography and MASW survey for geotechnical evaluation of soil for the teaching hospital project at mosul university. J. Zankoy Sulaimani - Part A 16 (1), 1–14. doi:10.17656/jzs.10279
Al-Saigh, N. H., and Al-Heety, A. J. (2018). 2-D seismic refraction tomography for site investigation of the teaching hospital project at mosul university. Iraqi Natl. J. Earth Sci. 18 (1), 77–86. doi:10.33899/earth.2018.159280
Alzahrani, H., Abdelrahman, K., Qaysi, S., and Al-Otaibi, N. (2021). Shear-wave velocity profiling of Jizan city, southwestern Saudi Arabia, using controlled-source spectral analysis of surface-wave measurements. J. King Saud University-Science 33 (7), 101592. doi:10.1016/j.jksus.2021.101592
Ashraf, M. A. M., Kumar, N. S., Yusoh, R., Hazreek, Z. A. M., and Aziman, M. (2018). Site classification using multichannel channel analysis of surface wave (MASW) method on soft and hard ground. J. Phys. 1, 995. Conf. Series. doi:10.1088/1742-6596/995/1/012108
Ausilio, E., Durante, M. G., and Zimmaro, P. (2022). Best practices for developing geotechnical models and seismic hazard procedures for critical infrastructure: the viadotto Italia case study in Southern Italy. Geosciences 12 (8), 295. doi:10.3390/geosciences12080295
Ayele, A., Woldearegay, K., and Meten, M. (2022). Multichannel analysis of surface waves (MASW) to estimate the shear wave velocity for engineering characterization of soils at hawassa town, southern Ethiopia. Int. J. Geophys. 2022., 1–22. doi:10.1155/2022/7588306
Borcherd, R. D. (1994). Estimation of site-dependant response spectra for design (methodology and justification). Earth Spectra 10, 617–653.
BSSC (1998). NEHRP recommended provision for seismic regulations for new buildings, 1997 edition, part I-provision. Fed. Emerg. Manag. Agency FEMA. 302/February 1998.
BSSC (2001a). NEHRP recommended provision for seismic regulations for new building and other structure part 1- provisions (FEMA 368). 2000. Washington, D. C.: Building Seismic Safety Council.
BSSC (2001b). NEHRP recommended provision for seismic regulations for new buildings and other structures, 2000 edition, part 2- Commentary (FEMA 369). Washington, D. C.: Building Seismic Safety Council.
Cultrera, G., Cornou, C., Di Giulio, G., and Bard, P. Y. (2021). Indicators for site characterization at seismic station: recommendation from a dedicated survey. Bull. Earthq. Eng. 19 (11), 4171–4195. doi:10.1007/s10518-021-01136-7
Dobry, R., Borcherdt, R. D., Crouse, C. B., Idriss, I. M., Joyner, W. B., Martin, G. R., et al. (2000). New site coefficients and site classification system used in recent building seismic code provisions. Earthq. Spectra 16, 41–67. doi:10.1193/1.1586082
El-Asa’ad, G. M. (1989). Callovian colonial corals from the Tuwaiq Mountain Limestone of Saudi Arabia. Palaeontol. Assoc. Lond. 32 (3), 675–684.
El-Raouf, A. A., Iqbal, I., Meister, J., Abdelrahman, K., Alzahrani, H., and Badran, O. M. (2021). Earthflow reactivation assessment by multichannel analysis of surface waves and electrical resistivity tomography: a case study. Open Geosci. 13 (1), 1328–1344. doi:10.1515/geo-2020-0310
Faisal, R., El-Hady, S. M., Faisal, S. M., Harbi, H. M., Fahad Ullah, H. M., Rehman, M., et al. (2018). MASW survey with fixed receiver geometry and cmp cross-correlation technique for data processing: a case study of Wadi Fatima, Western Saudi Arabia. Open J. Geol. 8, 463–473. doi:10.4236/ojg.2018.85027
Ferguson, N., and Gautreau, G. (2022). Feasibility study on geophysical methods to estimate geotechnical properties in Louisiana (No. FHWA/LA. 22/667). Louisiana: Department of Transportation and Development.
Fnais, M., Al-Amri, A., and Abdelrahman, K. (2015). “Soil characterization of jeddah city, Saudi Arabia,” in Near surface geoscience 2015-21st European meeting of environmental and engineering geophysics, vol. 2015, No. 1 (Turin, Italy: EAGE Publications BV), 1–5.
Foti, S., Hollender, F., Garofalo, F., Albarello, D., Asten, M., Bard, P. Y., et al. (2018). Guidelines for the good practice of surface wave analysis: a product of the InterPACIFIC project. Bull. Earthq. Eng. 16, 2367–2420. doi:10.1007/s10518-017-0206-7
Foti, S., Parolai, S., Albarello, D., and Picozzi, M. (2011). Application of surface-wave methods for seismic site characterization. Surv. Geophys. 32 (6), 777–825. doi:10.1007/s10712-011-9134-2
Geraldine, C. A., Amin, E., Khalil, M., NawawiKhiruddin, A., and Fathi, M. (2018). Multi-channel analysis of surface waves (MASW) using CMP analysis to identify soil problems threat on the heritage site at Georgetown, Malaysia. Seg. Glob. Meet. Abstr., 1640–1643. doi:10.1190/IGC2018-404
Igwe, O., and Umbugadu, A. A. (2020). Characterization of structural failures founded on soils in Panyam and some parts of Mangu, Central Nigeria. Geoenvironmental Disasters 7 (1), 7–26. doi:10.1186/s40677-020-0141-9
Ishola, K. S., Amu, B. D., and Adeoti, L. (2022). Evaluation of near-surface conditions for engineering site characterization using geophysical and geotechnical methods in Lagos, Southwestern Nigeria. NRIAG J. Astronomy Geophys. 11 (1), 237–256. doi:10.1080/20909977.2022.2075160
Jusoh, H., Osman, S. B. S., and Noh, K. A. M. (2022). Usability of the surface wave method in assessment for subsurface investigation. IOP Conf. Ser. Earth Environ. Sci. 1003 (1), 012039. article 012039. doi:10.1088/1755-1315/1003/1/012039
Kansas Geological Survey, (KGS) (2016). SurfSeis©5.0, Surface wave processing software for use with microsoft® windows™. Lawrence (Kansas), USA, 3726–66047.
Khalil, A. E., Nawawi, M., Arifin, M. H., Abdullah, F. M., Kayode, J. S., Usman, N., et al. (2017). Soil investigation at Wet World hot spring complex for future development using active multichannel analysis of surface waves. Sains Malays. 46 (4), 537–543. doi:10.17576/jsm-2017-4604-04
Le Ngal, N., Pramumijoyo, S., Satyarno, I., Brotopuspito, K. S., Kiyono, J., and Hartantyo, E. (2019). Multi-channel analysis of surface wave method for geotechnical site characterization in Yogyakarta, Indonesia. E3S Web Conf. 76, 03006. article 03006. doi:10.1051/e3sconf/20197603006
Le Nindre, Y. M., Manivit, J., Manivit, H., and Vaslet, D. (1990). Sequential stratigraphy of the central Saudi arabian platform in the jurassic and cretaceous. Ministry Petroleum Mineral Resour. Dir. General Mineral Resour. Jeddah, Saudi Arab. Technical Report BRGM-TR-11-4, 11.
Manivit, J., Le Nindre, Y. M., and Vaslet, D. (1990). Le Jurassique d’Arabie Centrale Histoire Geologique de la Bordure Occidentale de la Plate-forme Arabe, vol. 4. (Document du BRGM n8194. 559 p. 74 fig., 12 photo plates, 3 annexes, incl. 12 plates).
Manivit, J., Pellaton, C., Vaslet, D., Le Nindre, Y. M., Brosse, J. M., Breton, J. P., et al. (1985). Geologic map of the darma quadrangle, sheet 24H, kingdom of Saudi Arabia. Saudi arabian deputy ministry for mineral Resources geosciences map, GM-101, scale, 1(250,000). 133.
Miller, R. D., Xia, J., Park, C. B., and Ivanov, J. M. (1999). Multichannel analysis of surface waves to map bedrock. Lead. Edge 18 (12), 1392–1396. doi:10.1190/1.1438226
Mogren, S., Aldahri, M., Abdelrahman, K., and Zahran, H. (2020). Near-surface foundation level assessment from seismic measurements: a case study of north Jeddah City, Saudi Arabia. Arabian J. Geosciences 13, 213–333. doi:10.1007/s12517-020-5233-z
Naji, D. M., Akin, M. K., and Cabalar, A. F. (2020). A comparative study on the VS30 and N30 based seismic site classification in Kahramanmaras, Turkey. Adv. Civ. Eng. 2020, 1–15. Article ID 8862827. doi:10.1155/2020/8862827
Oyeyemi, K. D., Olofinnade, O. M., Aizebeokhai, A. P., Sanuade, O. A., Oladunjoye, M. A., Ede, A. N., et al. (2020). Geoengineering site characterization for foundation integrity assessment. Cogent Eng. 7 (1), 1711684. doi:10.1080/23311916.2020.1711684
Park, C., Miller, R., Laflen, D., Neb, C., Ivanov, J., Bennett, B., et al. (2004). “Imaging dispersion curves of passive surface waves,” in SEG technical program expanded abstracts 2004 (Denver, Colorado: Society of Exploration Geophysicists), 1357–1360.
Park, C. B., Miller, R. D., and Miura, H. (2002). Optimum field parameters of an MASW survey [Exp. Abs.]: SEG-J, Tokyo, May 22-23, (PAR-02-03).
Park, C. B., Miller, R. D., and Xia, J. (1999). Multichannel analysis of surface waves. Geophysics 64 (3), 800–808. doi:10.1190/1.1444590
Rahimi, S., Wood, C. M., Kokkali, P., and Rivers, B. (2021). Advantages of geophysics to improve site characterization and reliability for transportation projects. Transp. Res. Rec. 2675 (7), 540–554. doi:10.1177/0361198121996362
Rehman, F., El-Hady, S. M., Atef, A. H., and Harbi, H. M. (2016). Multichannel analysis of surface waves (MASW) for seismic site characterization using 2D genetic algorithm at Bahrah area, Wadi Fatima, Saudi Arabia. Arabian J. Geosciences 9, 519. doi:10.1007/s12517-016-2544-1
Rubaiyn, A., Priyono, A., and Yudistira, T. (2019). Near-surface S-wave estimation based on inversion of Rayleigh wave dispersion curve using genetic algorithm. IOP Conf. Ser. Earth Environ. Sci. 318 (1), 12–13.
Sauvin, G., Vanneste, M., L’Heureux, J. S., O’Connor, P., O’Rourke, S., O’Connell, Y., et al. (2016). “Chapter impact of data acquisition parameters and processing techniques on S-wave velocity profiles from MASW – examples from Trondheim, Norway,” in Proceedings of the 17th Nordic Geotechnical Meeting Challenges in Nordic Geotechnic 25th Reykjavik Iceland – 28th of May, NGM 2016 Reykjavik, Reykjavik, Iceland, 28th May 2016, 1297–1306.
Socco, L. V., and Boiero, D. (2008). Improved Monte Carlo inversion of surface wave data. Geophys. Prospect. 56 (3), 357–371. doi:10.1111/j.1365-2478.2007.00678.x
Socco, L. V., and Strobbia, C. (2004). Surface-wave method for near-surface characterization: a tutorial. Geophys 2 (4), 165–185. doi:10.3997/1873-0604.2004015
Stephenson, W. J., Yong, A., and Martin, A. (2022). Flexible multimethod approach for seismic site characterization. J. Seismol. 26 (4), 687–711. doi:10.1007/s10950-022-10102-y
Stokoe, I. I. K. H., Wright, G. W., James, A. B., and Jose, M. R. (1994b). “Characterization of geotechnical sites by SASW method, in geophysical characterization of sites,” in ISSMFE technical committee lo (Vol. 1). New Delhi. Geophys. Devel. Ser. Soc. Explor. Geophys Editor R. D. Woods (Oxford Publishers), 214–226.
Stokoe, K. H., Wright, S. G., Bay, J. A., and Roesset, J. A. (1994a). Characterization of geotechnical sites by SASW method, geophysical characterization of sites, technical committee for XIII ICSMFE. Rotterdam, Netherlands: A.A. Balkema Publisher, 785–816.
Wair, B., DeJong, J., and Shantz, T. (2012). Guidelines for estimation of shear wave velocity profiles. PEER Report 2012.
Wang, G., Wang, H., Li, H., Lu, Z., Li, W., and Xu, T. (2022). Application of active-source surface waves in urban underground space detection: a case study of Rongcheng County, Hebei, China. Earth Planet. Phys. 6, 0. doi:10.26464/epp2022039
Keywords: MASW, shear wave velocity, site characterization, Riyadh, Saudi Arabia
Citation: Abdelrahman K, Saadon AB and Qaysi S (2024) Estimating shear wave velocity and site characterization of western Riyadh City, Saudi Arabia based on multichannel analysis of surface waves. Front. Earth Sci. 12:1395431. doi: 10.3389/feart.2024.1395431
Received: 03 March 2024; Accepted: 07 May 2024;
Published: 30 May 2024.
Edited by:
Bin Gong, Brunel University London, United KingdomReviewed by:
Xiang Yu, Brunel University London, United KingdomCopyright © 2024 Abdelrahman, Saadon and Qaysi. This is an open-access article distributed under the terms of the Creative Commons Attribution License (CC BY). The use, distribution or reproduction in other forums is permitted, provided the original author(s) and the copyright owner(s) are credited and that the original publication in this journal is cited, in accordance with accepted academic practice. No use, distribution or reproduction is permitted which does not comply with these terms.
*Correspondence: Kamal Abdelrahman, a2hhc3NhbmVpbkBrc3UuZWR1LnNh
Disclaimer: All claims expressed in this article are solely those of the authors and do not necessarily represent those of their affiliated organizations, or those of the publisher, the editors and the reviewers. Any product that may be evaluated in this article or claim that may be made by its manufacturer is not guaranteed or endorsed by the publisher.
Research integrity at Frontiers
Learn more about the work of our research integrity team to safeguard the quality of each article we publish.