 Jianning Liu
94% of researchers rate our articles as excellent or good
Learn more about the work of our research integrity team to safeguard the quality of each article we publish.
Find out more
ORIGINAL RESEARCH article
Front. Earth Sci. , 13 May 2024
Sec. Georeservoirs
Volume 12 - 2024 | https://doi.org/10.3389/feart.2024.1395146
Wenchang A oilfield is a recently discovered low-permeability oilfield in the western South China Sea. The exploration target is the Zhuhai Formation, which reservoir lithology changes significantly, and the distribution of favorable reservoirs is unclear. In this study, the reservoir characteristics of the Zhuhai Formation in the Wenchang A oilfield, South China Sea, were analyzed through core identification, thin section identification, physical property testing, pre-stack geostatistical inversion, and frequency-based AVO inversion. Pre-stack geostatistical inversion is based on geostatistics and combines the seismic inversion algorithm with the stochastic sequential simulation algorithm. While the frequency-varying AVO inversion method is an extension of the conventional AVO inversion method, with its core technology being spectrum decomposition. After frequency division, multiple data sets directly participate in the calculation, which enhances the stability and accuracy of inversion.We also predict the favorable reservoir areas of six small layers in the Zhuhai Formation. The results show that 1) the reservoir lithology of the Zhuhai Formation mainly consists of feldspar quartz sandstone and feldspar quartz sandstone, indicating high compositional maturity. The porosity of the reservoir ranges from 14.0% to 19.0%, with an average value of 16.3%. The permeability of the reservoir ranges from 3.1 mD to 126.1 mD, with an average value of 22.4 mD, indicating a medium porosity and low permeability reservoir. The supporting structure of a sandstone reservoir is particle-supported, with the main contact being the “point-line” contact between particles. The main types of pores in sandstone are primary intergranular pores and secondary intergranular dissolved pores. Some pores are feldspar-dissolved pores, and occasionally there are hetero-based micropore. 2) The diagenesis of the Zhuhai Formation reservoir mainly includes compaction, cementation, and dissolution. Cementation and dissolution have minimal impact on the physical properties of reservoirs. The porosity loss of the reservoir after compaction ranges between 16.0% and 27.9%, and the compaction rate ranges between 40.0% and 69.8%, indicating a medium compaction diagenetic facies. 3) The favorable areas of each layer of the Zhuhai Formation are mainly concentrated in the southwest of the study area. The upper layer of ZH1I, the upper layer of ZH1II and the lower layer of ZH1II exhibit the best physical properties, the thickest favorable sand body, the strongest oil and gas display, the widest range of favorable areas, and the greatest exploration potential. The favorable exploration potential of layer 1 in the lower part of ZH1I and layer 2 in the upper part of ZH1II is moderate. The second layer in the lower part of ZH1II has the poorest properties and lower exploration potential. The main factors affecting the favorable area include physical properties, oil and gas display, sand body thickness, etc.
Seismic wave frequency-varying AVO is a new technique developed with the deepening of petrophysical research. The core of this technique lies in the petrophysical interpretation of the phenomenon of AVO response varying with frequency (Pang et al., 2018; Li et al., 2023; Li et al., 2024). The frequency-varying amplitude versus offset (AVO) inversion technique is used to quantitatively characterize the velocity dispersion of P-waves, construct fluid factors, and predict reservoir properties. Wilson. (2010) replaced the reflection coefficient in the AVO approximation formula with an amplitude spectrum of various frequencies (Wilson, 2010). Sun et al. (2012) used frequency-varying AVO inversion technology to identify the gas-bearing properties of carbonate reservoirs. The frequency-varying AVO inversion technology reduced the ambiguity of the prediction results and improved the prediction accuracy. Geostatistical inversion technique was proposed by Bortoli in 1992 and later improved by Hass, Dubrule et al. Geostatistical inversion, which integrates model-based inversion with Markov chain and Monte Carlo simulation algorithms, is a crucial tool for addressing reservoir complexity and heterogeneity (Hass and Dubrule, 1994; Dubrule et al., 1998; Qian et al., 2013).
Wenchang A oilfield is a recently discovered oilfield in the western South China Sea in recent years. At present, the field is in the early stage of exploration and the level of development is low (Jiang et al., 2021). In this region, the geological conditions for petroleum are favorable, with well-developed combinations of source reservoirs and caps. However, the distribution of oil and gas is not concentrated, and the physical properties of reservoirs vary (Wu et al., 2019; Yang et al., 2019). The Zhuhai Formation is a significant oil-bearing stratum in the study area and a crucial layer for exploration (Quan et al., 2015; Wu et al., 2019; Zhang et al., 2023). Thin interlayers of sand-mudstone are mainly developed in the Zhuhai Formation. The distribution of thin interlayers of sand-mudstone exhibits a specific structural regularity in space and random uncertainty in local areas (Chen, 2021). The reservoir of the Zhuhai Formation exhibits characteristics such as small thickness of individual sand bodies and rapid evolution of features. Conventional constrained sparse pulse inversion is limited by seismic frequency bands, making it difficult to accurately characterize thin reservoirs (Xu and Gui, 2006; Wu and Li, 2009).
Due to complex geological conditions, limited drilling data, and the low quality and processing level of seismic data in the study area, two main issues exist in the current research on the Zhuhai Formation in Wenchang A oilfield: 1) The description of reservoir characteristics lacks precision, and the primary controlling factors are unclear. 2) The distribution of favorable reservoirs in each layer of the Zhuhai Formation in the study area is unclear. To elucidate the reservoir characteristics of the Zhuhai Formation in the study area, an analysis and discussion of the reservoir characteristics and main controlling factors of the Zhuhai Formation are conducted using drilling, logging, and seismic data. This study combines geostatistical inversion with frequency-varying AVO inversion technology, which can fully utilize the characteristics of wide seismic lateral coverage, high resolution, and intensive logging longitudinal sampling (Zhang et al., 2015; Shen et al., 2017). By utilizing the above techniques, we can predict the physical properties of the reservoir, sand thickness, and oil and gas-bearing properties of six small layers in the Zhuhai Formation. This enables us to accurately forecast three types of favorable exploration areas.
1) Highlights: In this study, a thin sand reservoir prediction method has been developed for offshore environments with few wells, complex formation conditions, and a small range. 2) The results and methods of this study can provide theoretical and data support for the subsequent exploration and development of oil and gas reservoirs in the South China Sea. 3) It is of scientific significance and practical value to promote the exploration and development of low permeability oil field resources and to practice the sustainable development strategy of oil and gas industry.
Wenchang A oilfield is a Cenozoic sedimentary rock series, with the Enping Formation, Zhuhai Formation and Zhujiang Formation developing from bottom to top. The Zhuhai Formation (23–30 Ma) is a transitional marine facies formation that formed during the fault depression stage. The sedimentary environment shifted from a closed lake basin to a semi-closed coastal tidal flat. It is in unconformable contact with the underlying Enping Formation and overlain by the Neogene Zhujiang Formation (Wang et al., 2023). During the deposition period of the Zhuhai Formation, the study area underwent gradual seawater intrusion and multiple changes in seawater and elevation levels. During this period, the influence of tidal action on sedimentation in the depression intensified, the distribution of tidal flats expanded, and tidal flat mud was widely distributed, becoming a regional cover layer (Deng et al., 2020; Xu et al., 2023).
The Zhuhai Formation can be divided into 3 member, 2 member and 1 member from bottom to top (Figure 1). The Zhu3 Member is a semi-enclosed coastal deposit consisting of light gray fine sandstone and argillaceous sandstone sandwiched between thin layers of gray sandstone. The second Zhujiang member is dominated by mudstone with fine lithology and has a certain capacity for generating hydrocarbons. The Zhu1 member is a semi-enclosed shallow sea deposit, and the lithology mainly consists of sand-mudstone interlayers. In general, the sedimentary cycle consists of coarse sediment at the bottom and fine sediment at the top. The lower sandstone is well-developed, exhibiting good physical properties, and is in direct contact with the source rock. It is an important reservoir in the Wenchang A oilfield.
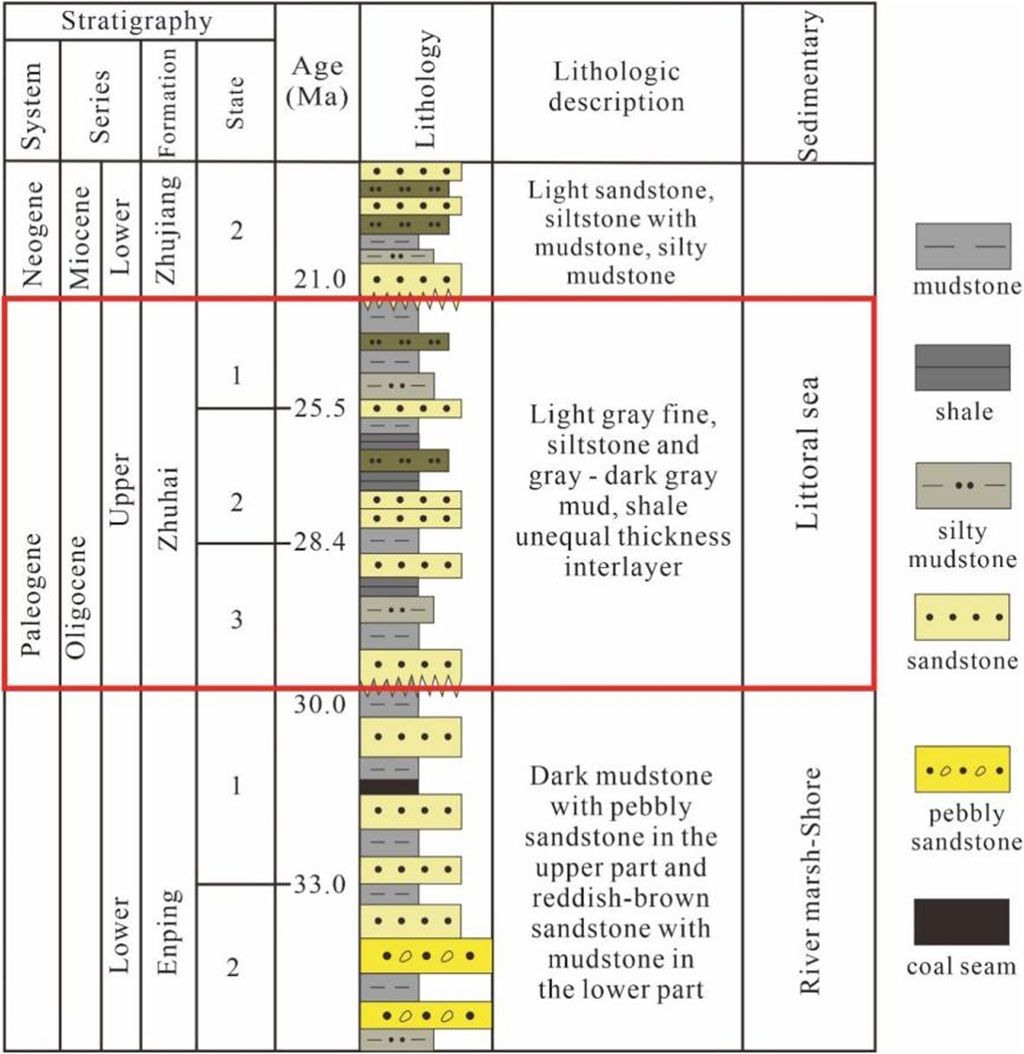
Figure 1. Lithologic column diagram of the study area.
In light of the characteristics of the tidal flat sedimentary environment in the study area, such as thin thickness, significant lateral overlap of sand bodies, unclear connectivity, rapid lateral changes, complex lithology, and small wave impedance differences, the conventional deterministic inversion method struggles to accurately depict these features due to the limitations of seismic time-frequency inversion. Post-stack inversion based on phased geostatistics can enhance resolution and accuracy in reservoir prediction. It can also effectively illustrate the overlapping relationships of sub-sand bodies at different intervals, thereby controlling the multi-solution of seismic data. Compared with other types of inversion, geostatistical poststack inversion offers at least five technical advantages: 1) it can generate lithologic data, such as sandstone and mudstone; 2) improves the resolution of conventional inversion results; 3) provides fine-scale interpolation between small well spacing; 4) combines high-resolution well data with low-resolution seismic data; 5) estimates porosity based on lithology and wave impedance.
Geostatistical inversion first establishes the geological model of the reservoir in the seismic time domain based on the geological conditions. In this process, the seismic horizon identifies the layer, the formation grid necessitates the original wave impedance curve at the well location, and then the inversion parameters are determined using the seismic data and the well. This allows for the calculation of geostatistical inversion. Random inversion technology is utilized in this reservoir inversion. Random inversion technology in the seismic inversion software Jason requires input of data following a normal distribution. Therefore, in addition to determining the parameters required for conventional seismic inversion, such as the variance function (also known as the variation function) of the longitudinal and transverse wave impedance, inversion parameters determined through statistical analysis, the correlation coefficient between density, and the parameter distribution histogram, it is also necessary to utilize a suitable transformation method to convert the non-normal actual data into normally distributed data. The variation function is typically characterized by the minimum range, the maximum range azimuth, the vertical range, and the maximum range. The variation function is then determined using statistical methods. According to the characteristics of actual drilling data, the histogram and intersection diagram of P-wave impedance, P-wave velocity ratio, and density elastic parameters are analyzed. On the basis of obtaining multiple groups of lithology bodies with equal probability, density, and S-wave velocity ratios through pre-stack geostatistical inversion, if reservoir attributes (such as porosity bodies, saturation bodies, etc.) are to be further obtained, the lithology bodies and various attributes obtained are to be utilized through co-simulation. Based on the relationship between different geophysical parameters and porosity in geostatistical analysis, reservoir attributes are calculated.
In this study, the frequency variable AVO oil and gas detection technology is utilized to predict the presence of oil and gas in each layer of the Zhuhai Formation in the study area. Fluid identification by AVO technology is primarily based on the distinct relationship between pre-stack amplitude and offset for various fluid types in different media. In other words, the variation in pre-stack amplitude is influenced by numerous factors. In conventional elastic medium reservoirs, natural factors such as reservoir thickness, water saturation, porosity, and the combined relationship of thin interlayers can influence the change in amplitude energy. For a reservoir with a dispersive medium, there are numerous influencing factors, including fracture density, porosity, fluid type, water saturation, viscosity coefficient, and other variables. These factors can cause velocity dispersion in the medium, which, in turn, leads to changes in amplitude energy. In addition to the formation factors, the amplitude is also affected by pre-stack migration precision, wavelet deconvolution, quality factor compensation, dynamic correction, and other processing factors. On the basis of the classification of reservoir AVO anomalies, the study focuses on frequency-variable AVO forward modeling, using the third type of common bright spots with AVO characteristics as an example. In order to study the effect of dispersive media on AVO response, three cases of saturated water, saturated air, and saturated oil can be examined. The variation in P-wave velocity with frequency can be analyzed. The phase velocity increases with the increase in frequency in three different fluid cases. When the pore medium contains different fluids, the shear wave (SV) velocity dispersion frequency of the pore medium varies between oil and water saturation due to the distinct viscosity of the fluids. The dispersion frequency is at a minimum because the viscosity of the oil is the highest, and the dispersion frequency of the pore medium is at its peak when the gas is saturated.
In this paper, a 30 Hz Ricker wavelet with a maximum angle of 45° was used to conduct forward simulation of the dispersion velocity model using the one-way wave equation numerical simulation method. By changing different fluid types, the elastic model and dispersion model were established using the porous elastic theory and Chapman’s dispersion medium theory. Two models of saturated water and saturated air media are simulated in advance.
The physical properties of sandstone reservoirs are often influenced by sedimentary, diagenetic, and tectonic factors (Nabawy et al., 2020; Xu et al., 2021; Li et al., 2022). Sedimentation controls the thickness, scale, and spatial distribution of sand bodies on a macro level. It directly affects the original porosity and permeability of reservoirs on a micro level by influencing the composition and structure of sandstone (Wang et al., 2022; Zhong et al., 2023). In the long process of reservoir formation, diagenesis will transform the reservoir’s performance (Jiang et al., 2023; Nisar et al., 2024). The late transformation during diagenesis alters the porosity and permeability of sandstone. Diagenetic evolution determines reservoir quality (Lv and Li, 2021; Wang et al., 2022).
During the depositional period of the Zhuhai Formation, the study area was a transitional marine facies deposit in the fault-depression transition stage as a whole. The lithology was influenced by the main provenance, source area structure, climate setting, sedimentary processes, and sedimentary environment (Ekwenye et al., 2015). The core data from the main oil and gas display wells A-1 and A-2 of the Zhuhai Formation in Wenchang A oilfield are analyzed in this study. The statistical results show that the quartz content of most samples from well A-1 of the Zhuhai Formation is more than 50%, with some samples reaching as high as 90%. The feldspar content ranges from 5% to 25%, while the cuttings content is typically between 10% and 25%. The quartz content of well A-2 in the Zhuhai Formation ranges from 50% to 75%, while the content of feldspar and debris ranges between 10% and 25%. This indicates that the lithology of the target reservoir in the study area is mainly composed of lithic feldspar quartz sandstone and feldspar quartz sandstone (Figure 2A). The clastic rock particles are characterized by a high quartz volume fraction and high compositional maturity, indicating greater sediment maturity, longer transport distance, and stronger hydrodynamic conditions (Mette et al., 2022; Zakir et al., 2024).
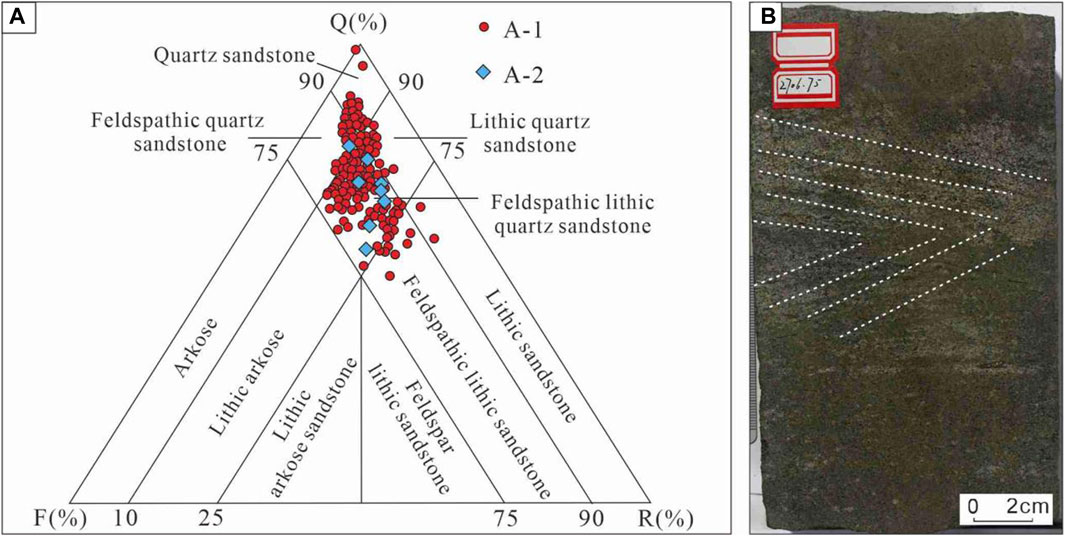
Figure 2. (A) Rock triangle diagram of the main oil-bearing interval of Zhuhai Formation, Wenchang A oilfield; (B) Feathery cross-bedding.
The sandstone in this study is mainly terrigenous clastic particles, including fine sandstone and medium sandstone. The clastic particles are rounded into sub-rounded shapes, with medium sorting. The predominant colors are gray and brown, and thin mudstone interlayers are common. These characteristics suggest that the sedimentary environment during the deposition period was primarily characterized by a weak oxidation environment. Typical tide-flat sedimentary structures, such as feathery cross-bedding, can be observed in the core (Figure 2B).
In this study, the physical characteristics of the core samples of Zhuhai Group were analyzed by the change of log curve data, and the log curve data of porosity and permeability were extracted into text format, so as to obtain the scatter plot of porosity and permeability (Figure 3A).it was found that the porosity of samples from the Zhuhai Formation in Wenchang A oilfield ranges from 14% to 19.0%, with an average value of 16.3% (Figure 3A). Among them, samples with a porosity of 16%–18% accounted for more than 90% (Figure 3B). The permeability values of the samples ranged from 3.1 mD to 126.1 mD, with an average of 22.4 mD (Figure 3A). Among them, samples with permeability values ranging from 16 mD to 32 mD accounted for more than 50% (Figure 3C). In general, the Zhuhai Formation in the study area is classified as a reservoir with medium porosity and low permeability.
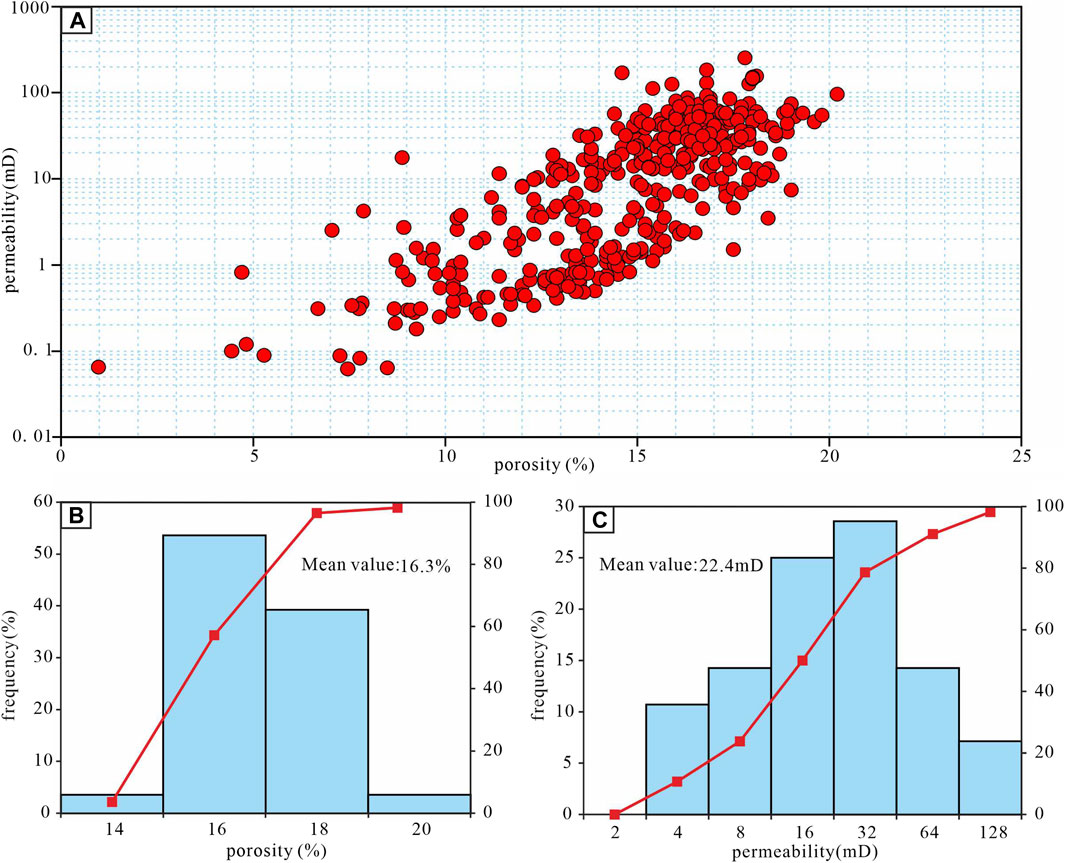
Figure 3. Reservoir porosity and permeability distribution of the first member of Zhuhai Formation (A) the scatter plot of porosity and permeability (B) Porosity distribution (C) permeability distribution.
Porosity and Permeability is also affected by diagenesis Compaction is the main diagenetic process. After the compaction transformation, the intergranular porosity of the reservoir sandstone is significantly reduced. The porosity lost due to compaction is greater overall compared to that lost due to cementation (Xia et al., 2020).The porosity loss after compaction ranges between 16.0% and 27.9%, while the compaction rate falls between 40.0% and 69.8%, indicating a medium compaction diagenetic facies. The carbonate cement in the main area of Wenchang A oil field mainly consists of iron calcite, along with iron dolomite, siderite, glauconite, pyrite, and other minerals. Ferrodolomite is powdery, and siderite is micrite rhomboid. The cement fills the pores, blocking the passageways and reducing the porosity of the reservoir. The porosity loss after cementation of each well in the Zhuhai Formation ranges from 1% to 10.5%. The cementation rate falls between 6.5% and 75.0%, with the degree of cementation primarily classified as medium.
According to the genesis, the pores of clastic rocks can be divided into primary pores and secondary pores (Dou et al., 2017; Ko, et al., 2018; Meng et al., 2020). By observing the core slices under a microscope, it was found that the reservoir support structure of the Zhuhai Formation in Wenchang A Oilfield is particle-supported. The main contact among particles is point-line contact, followed by line contact. The pore types of sandstone mainly consist of primary intergranular pores and secondary intergranular dissolved pores, with an average mass fraction of 30% (Figure 4A). A small amount of feldspar pore is present, with an average mass fraction of 17% (Figure 4B). Hetero-based micropore were found occasionally, with an average mass fraction of 12% (Figure 4C). The shale content of the sandstone reservoir is low, with an overall apparent porosity of 10.8%, and large pore throats.
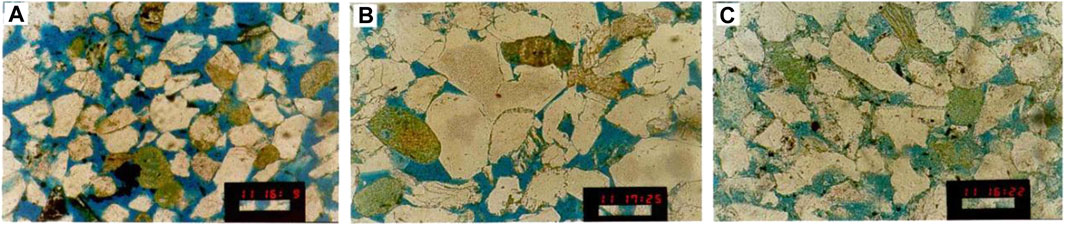
Figure 4. Core photo of Zhuhai Formation in Wenchang A oilfield (A) primary intergranular pores and intergranular solution pores (well A-2, 2738.88 m); (B) Feldspar solution hole (Well A-1, 2690.05 m); (C) Hybrid micropores (Well A-1, 2634.75 m).
The stochastic inversion technique is adopted in this reservoir inversion, which is based on geostatistics and combines the seismic inversion algorithm with the stochastic sequential simulation algorithm (Haas and Dubrule, 1994; Dubrule O, et al., 1998). The random inversion technique of seismic inversion software Jason requires the input of data following a normal distribution (Liao et al., 2002). Therefore, it is essential to establish the parameters needed for conventional seismic inversion. This includes determining the variance function of longitudinal and transverse wave impedance, as well as the inversion parameters identified through statistical analysis. Additionally, it involves examining the correlation coefficient between density and the histogram of parameter distribution. It is also necessary to use appropriate transformation methods to convert non-normally distributed actual data into normally distributed data (Shu et al., 2022). The variation function is typically characterized by the minimum range, the maximum range azimuth, the vertical range, and the maximum range. The variation function is then determined using statistical methods.
We calculated and predicted the porosity and lithology properties of the cross A-1 and A-2 well profiles using pre-stack geostatistical inversion techniques (Figure 5). The curve used for porosity inversion is a natural gamma curve. From the comparison between the verification well and the inversion profile, it is evident that the comparison effect is positive, and the reliability is high (Figure 5A). Fine rock analysis indicates that when the density value is less than or equal to 2.5 g/cc, the formation lithology is sandstone; when the density value exceeds 2.5 g/cc, the formation lithology is mudstone (Gao and Yuan, 2024). Taking the density value of 2.5 g/cc as the threshold value, the density attribute obtained by geostatistical inversion is converted into the sand and mudstone filling profile (Figure 5B). According to the comparison between the sandstone and mudstone profiles obtained through conversion and the lithology interpreted from actual drilling, the sandstone and mudstone profiles align well with the drilling results.
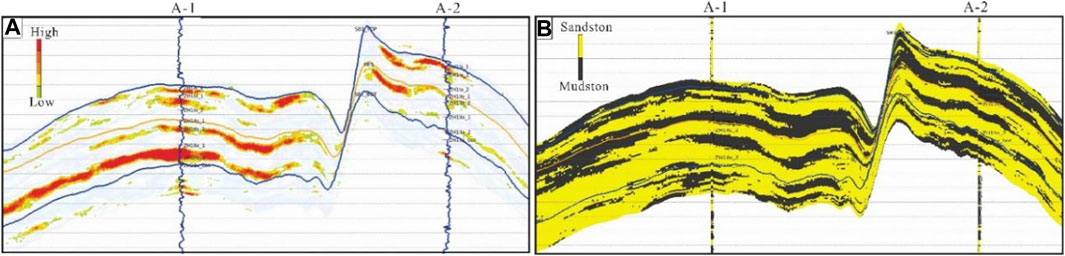
Figure 5. (A) Porosity attribute profile from pre-stack geostatistical inversion; (B) Lithology attribute profile from pre-stack geostatistical simulation.
On the basis of completing geostatistical inversion, the pre-stack geostatistical co-simulation technology is applied to obtain the effective porosity and thickness of each small layer through cloud transformation (Qian et al., 2013), combining the relationship between lithology and pre-stack elastic parameter data and each attribute (Dubrule et al., 1998; Yang et al., 2017). By analyzing the petrophysical parameters and combining them with the inversion results of the porosity attribute profile, the high porosity region in the study area is characterized. The map depicting the prediction of porosity planes in the sandstone reservoir attributes in this area can be depicted (Figure 7).
The upper layer of ZH1I of the Zhuhai Formation exhibits good overall physical properties, with the red area primarily concentrated in the northern and southern parts of the study area (in close proximity to well A-1 and well A-2). The central, western, and southeastern parts of the study area are predominantly blue, indicating poor physical properties (Figure 6A). The area with good physical properties in the lower part of layer 1 of ZH1I gradually dispersed to the four sides. The red areas decreased in the south and north of the study area, while they increased in the southeast, mainly concentrated in the vicinity of well A-2 (Figure 6B). The physical properties of the upper layer of ZH1II are inferior to those of the lower layer of ZH1I, and the physical properties of the sandstone reservoirs in the north of ZH1II are particularly prominent. The first layer of ZH1II with good physical properties mainly concentrated on both sides of the fault (Figure 6C). The physical properties of the second reservoir in the upper part of ZH1II do not change significantly compared to the upper one, and the area with better physical properties of the reservoir shifts to the west as a whole (Figure 6D). The physical properties of the initial reservoir in the lower section of ZH1II gradually improved, and the region with higher physical properties of the reservoir continued to shift westward (Figure 6E). The overall physical properties of layer 2 in the lower part of ZH1II suddenly deteriorated, with only sporadic red spots near small faults (areas of higher physical properties) (Figure 6F).
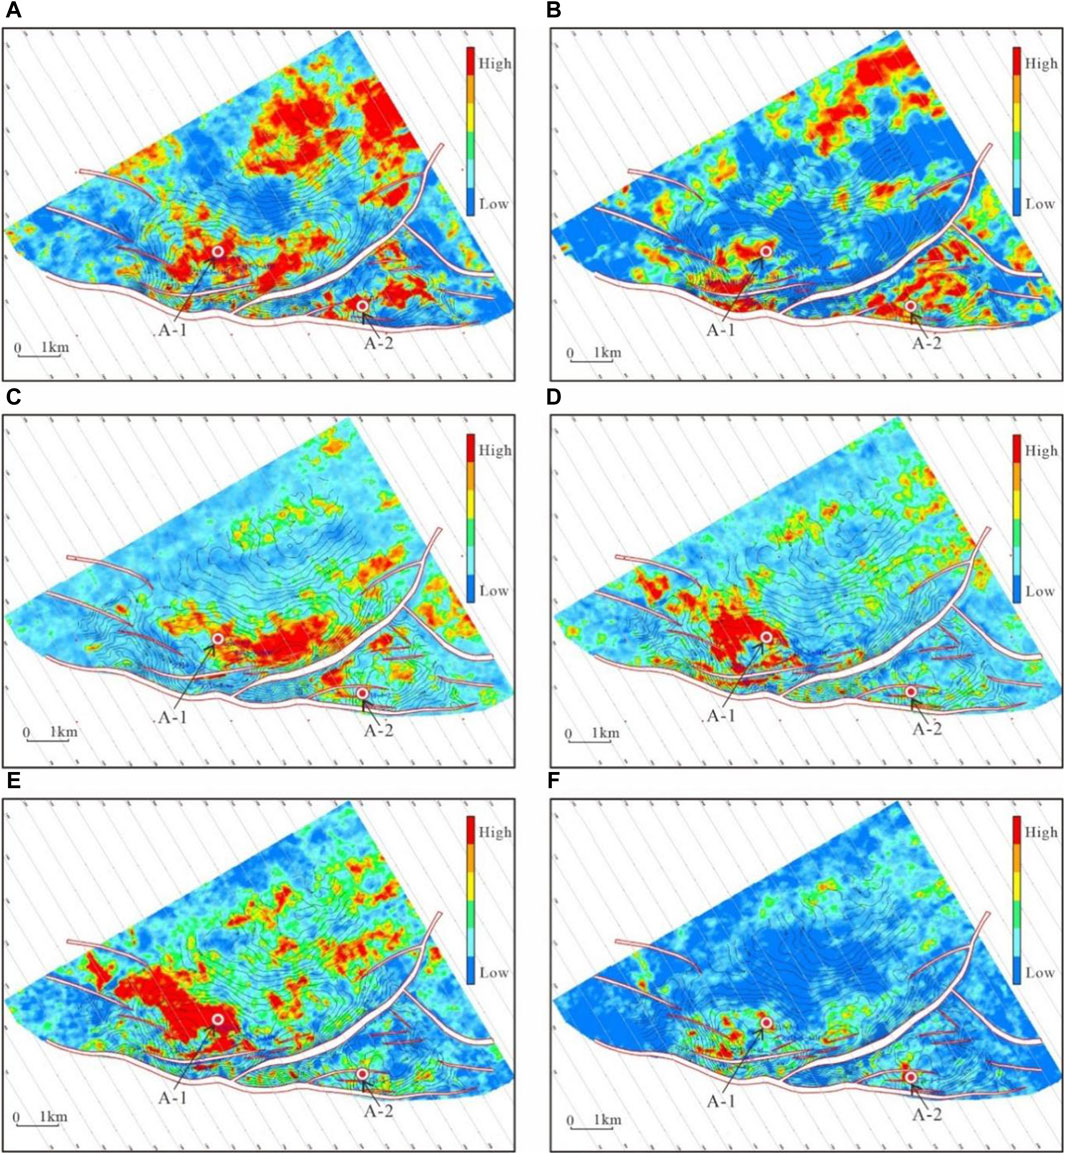
Figure 6. Physical property prediction plan of each layer sandstone of Zhuhai Formation in Wenchang A Oilfield (A) ZH1I upper layer; (B) layer 1 in the lower part of ZH1I; (C) layer 1 in the upper part of ZH1II; (D) layer 2 in the upper part of ZH1II; (E) layer 1 in the lower part of ZH1II; (F) layer 2 in the lower part of ZH1II.
In order to improve the alignment of quantitative evaluation results with actual drilling data in the working area, sandstone thickness prediction in each layer of the Zhuhai Formation can be enhanced by utilizing co-simulation technology. This involves pre-stack geological statistics based on lithology body and pre-stack elastic parameter data (Figure 7) (Dubrule et al., 1998; Yang et al., 2017).
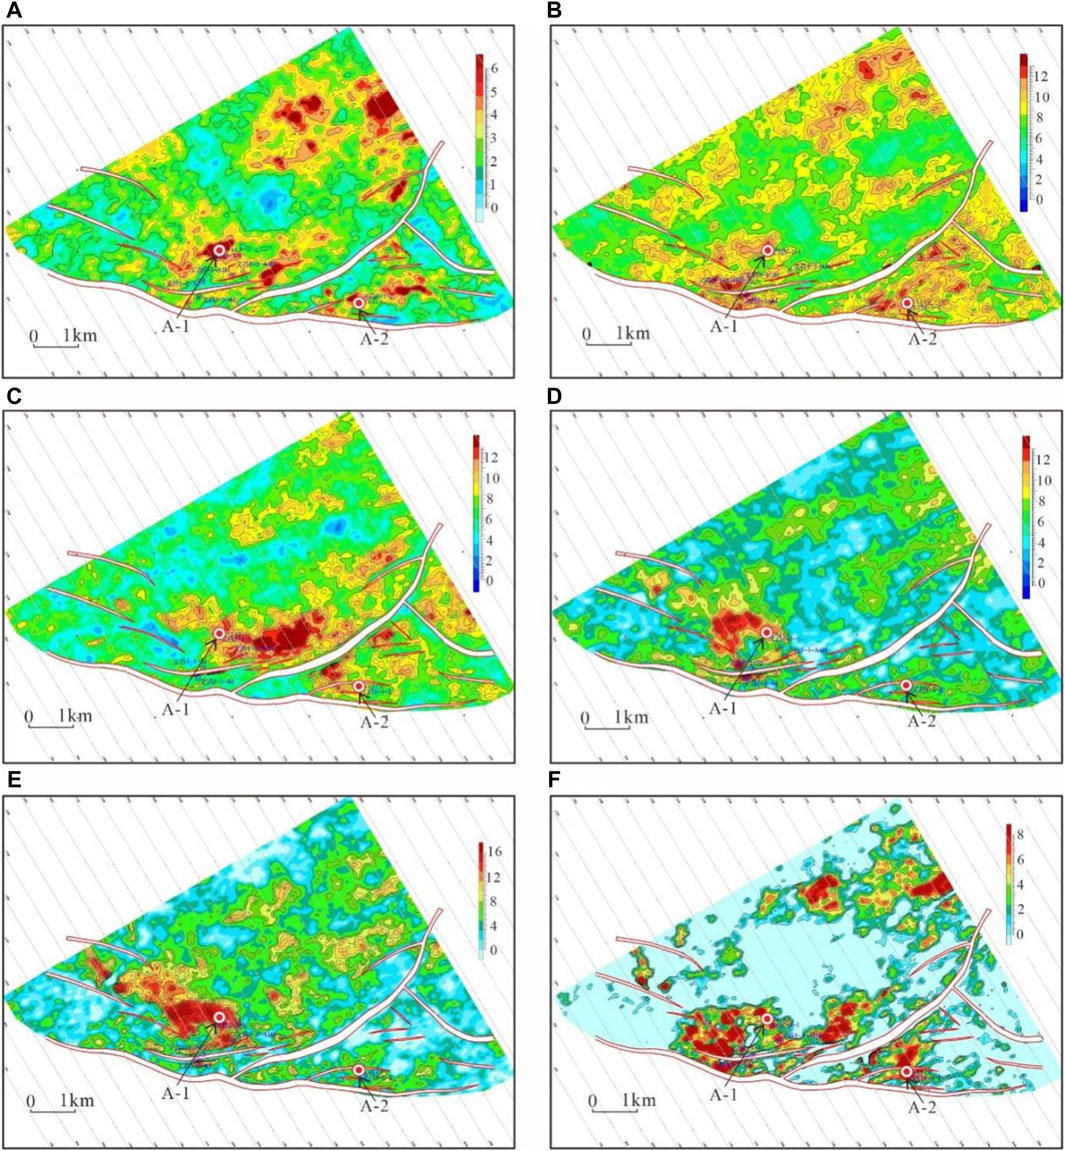
Figure 7. Prediction plan of sandstone thickness of each layer of Zhuhai Formation in Wenchang A Oilfield. (A) ZH1I upper layer; (B) layer 1 in the lower part of ZH1I; (C) layer 1 in the upper part of ZH1II; (D) layer 2 in the upper part of ZH1II; (E) layer 1 in the lower part of ZH1II; (F) layer 2 in the lower part of ZH1II.
The upper layer of ZH1I sandstone has a wide distribution range, and the sandstone is relatively thin, with thickness mostly concentrated between 3 and 5 m (Figure 7A). The sandstone in the lower part of ZH1I is more widely distributed compared to the upper part, with a greater thickness concentrated between 8 and 11 m (Figure 7B). The second layer in the lower part of ZH1I is dominated by silty mudstone and mudstone deposits. No significant sand bodies have been identified, thus the thickness distribution of sand bodies has not been estimated. The sand body thickness of the first layer in the upper part of ZH1II is relatively thick overall, but its distribution range is small, mainly concentrated near the fault. The sand body thickness on the descending wall of the fault is larger than that on the ascending wall (Figure 7C). The sandstone deposition thickness of the second layer in the upper part of ZH1II is thin, and the thick layer area is small, mainly concentrated in the fault downslope (Figure 7D). The first layer at the lower part of ZH1II is the main oil-producing stratum in the current working area. The thick sandstone is distributed over A wide area, primarily in the vicinity of well A-1. The thickness of the sand body is greater than 12 m, and the sand body plane exhibits a continuous distribution trend. The sand body has a high probability of forming a reservoir (Figure 7E). The second layer of sandstones in the lower part of ZH1II has a wide distribution range, but most of them consist of thin layers with a thickness of 3–6 m. Sand bodies with relatively large thickness are small in scale and scattered throughout the working area (Figure 7F).
In general, the prestack geostatistical inversion of prior geological information shows good consistency with the prestack joint inversion in the lateral trend. The inversion results align with the sedimentary law on a macro level, respect the actual drilling data at the well point, and reflect the sedimentary characteristics of the reservoir more objectively and accurately. Pre-stack geostatistical inversion effectively integrates high-frequency logging information, greatly improves the vertical identification ability, and the inversion results can accurately depict the spatial distribution of oil-bearing sand bodies. From the actual inversion effect, the lateral contrast of the profile, the transition between wells is more natural, and the spatial distribution characteristics of sand bodies conform to the sedimentary law.
The frequency-varying AVO inversion method is an extension of the conventional AVO inversion method, with its core technology being spectrum decomposition. After frequency division, multiple data sets directly participate in the calculation, which enhances the stability and accuracy of inversion (Zhong, 2018). The main principle of fluid identification using AVO technology is that the relationship between pre-stack amplitude and offset of different fluid types in different media varies. In other words, the change in pre-stack amplitude is influenced by various factors (Ren et al., 2009; Wilson, 2010). In conventional elastic medium reservoirs, natural factors such as reservoir thickness, water saturation, porosity, and the combination relationship of thin interlayers can influence the change in amplitude energy. The frequency-varying AVO inversion method can quantitatively characterize the velocity dispersion of P-waves and construct fluid factors to predict reservoirs (Wilson, 2010; Sun et al., 2012).
The inversion of the frequency spectrum is performed with 30 Hz as the reference frequency, and the results are shown in Figure 8. Different media due to its different water content (gas) lead to the degree of frequency dispersion is different by Figure 8, full gas is 2 times the degree of frequency dispersion of water dispersion (Figure 8A), and can be seen from Figure 8B transverse wave frequency dispersion degree, order of magnitude is obviously one over ten of the degree of longitudinal wave dispersion, the transverse wave attribute is insensitive to fluid (Luo et al., 2022; Fang et al., 2023), in the actual operation and application can ignore transverse wave dispersion properties, only calculate longitudinal wave frequency dispersion properties.According to the frequency-varying AVO inversion principle, the P-wave dispersion attribute is calculated on the optimized pre-stack CRP channel set. The results indicate that the probability of oil and gas bearing in the fault’s hanging wall is higher than that in the footwall (Figure 8C).
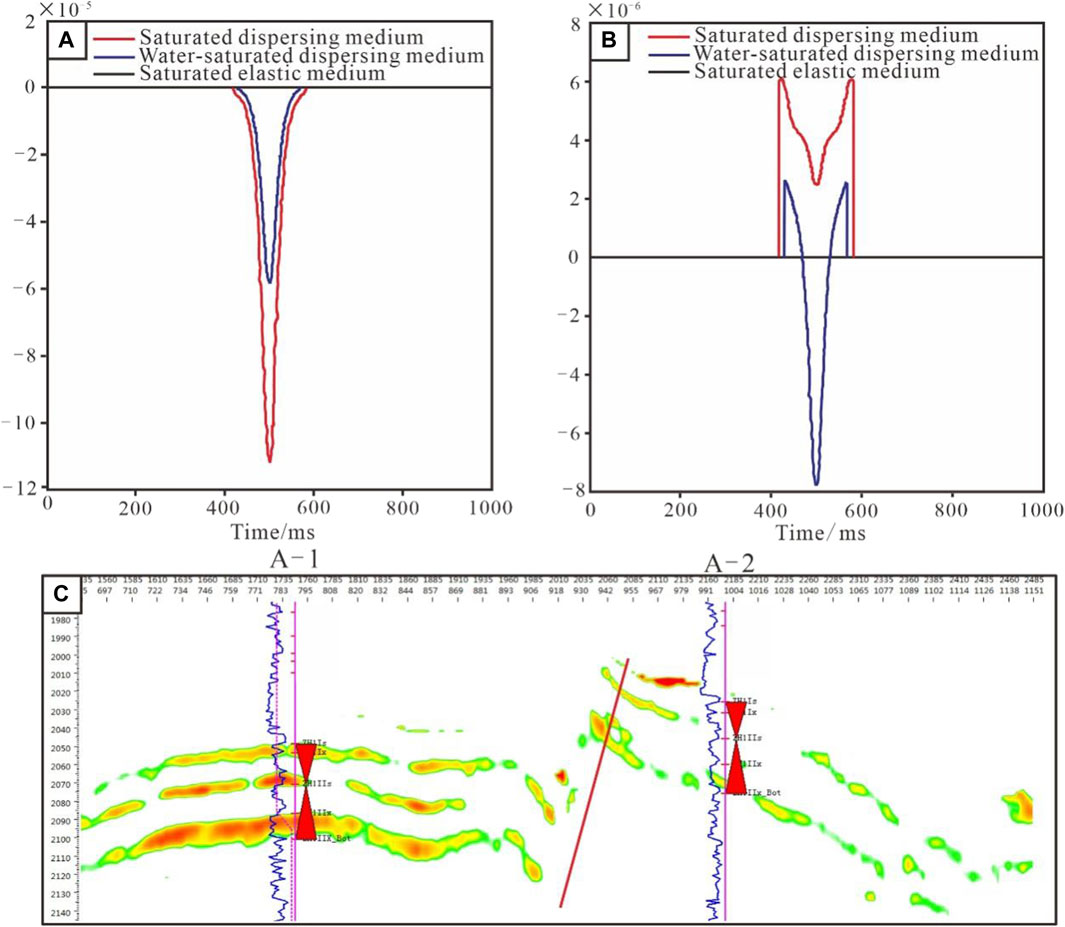
Figure 8. P wave dispersion attribute and S wave dispersion attribute obtained by frequency inversion of (20–60 Hz) (A) p-wave dispersion attribute; (B) Shear wave dispersion attribute; (C) P-wave dispersion attribute (over A-1, A-2).
Based on the P-wave dispersion attribute (Figure 8C) and an isochronous stratigraphic framework, the oil-bearing prediction plane for each layer of the Zhuhai Formation is determined by creating stratum slices (Figure 9). It is found that the oil and gas reservoirs in each thin layer of the Zhuhai Formation in the study area are primarily concentrated in the southern region. The upper ZH1I layer, the lower ZH1I layer, the upper ZH1II layer, and the lower ZH1II layer of the Zhuhai Formation have a high probability of containing oil and gas, and the reservoir has a certain scale (Figures 9A–C, E). However, the upper ZH1II layer 2 and lower ZH1II layer 2 of the Zhuhai Formation show less hydrocarbon content (Figures 9D, F).
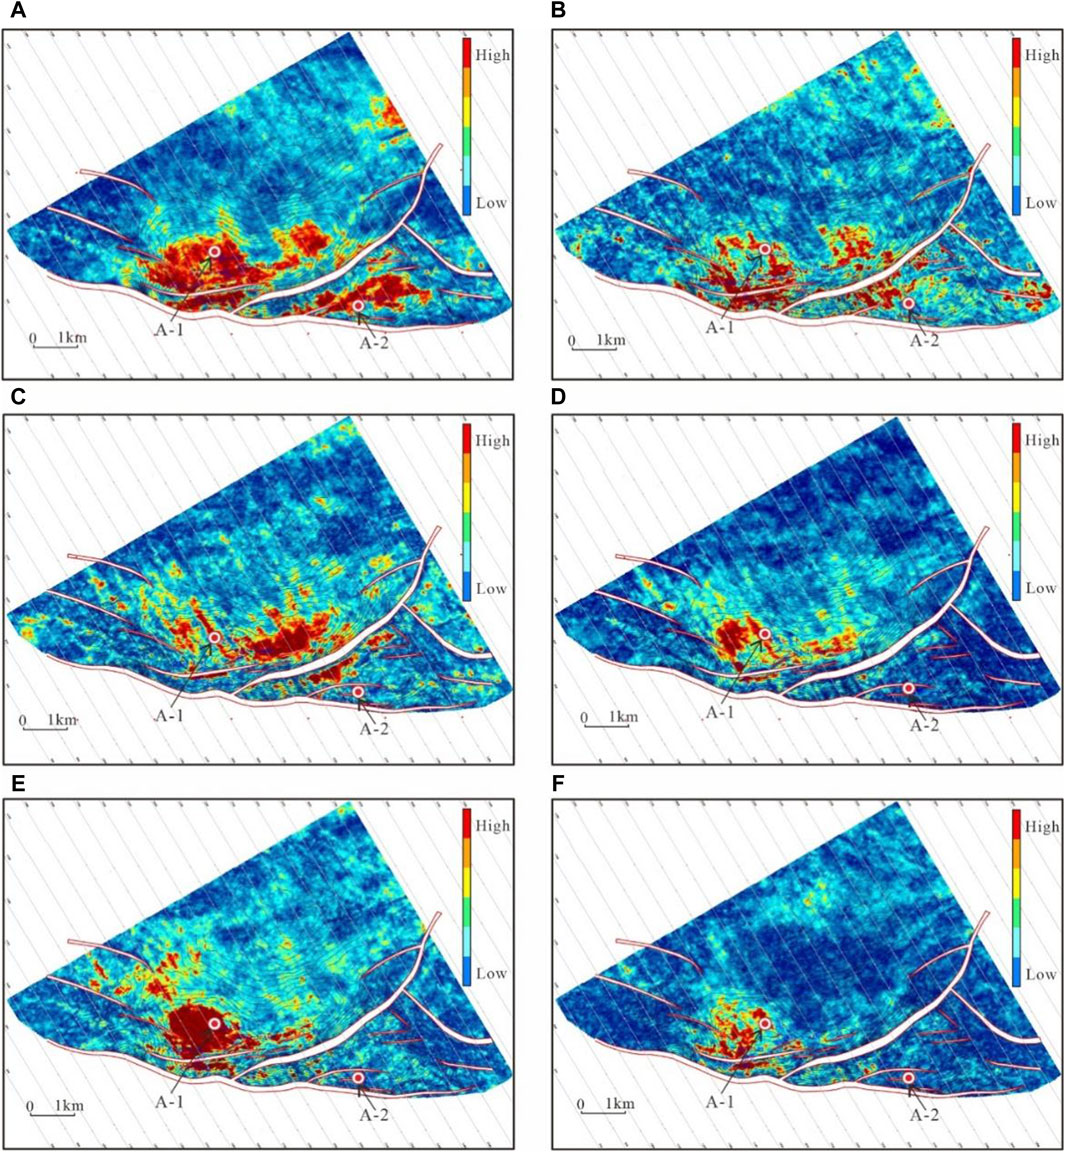
Figure 9. AVO attributes of each layer of Zhuhai Formation in Wenchang A oilfield. (A) ZH1I upper layer; (B) layer 1 in the lower part of ZH1I; (C) layer 1 in the upper part of ZH1II; (D) layer 2 in the upper part of ZH1II; (E) layer 1 in the lower part of ZH1II; (F) layer 2 in the lower part of ZH1II.
In order to verify the accuracy of prediction results using the frequency-varying AVO technique, the planar distribution map of sedimentary facies for each small layer was compared with the frequency-varying AVO attribute map for each small layer (Figure 10). The results indicate that the areas exhibiting a good oil and gas display in the frequency-varying AVO attribute map are highly correlated with the tidal channel microfacies in the sedimentary facies map. The microfacies of mud flat and mixed flat in the sedimentary facies map show a higher coincidence with the areas of low oil content in the AVO attribute map. This result corresponds to the conventional law of more oil in sand reservoirs and less oil in mud reservoirs. It can be shown that the results of frequency-varying AVO technique can be effectively validated by sedimentary facies maps.
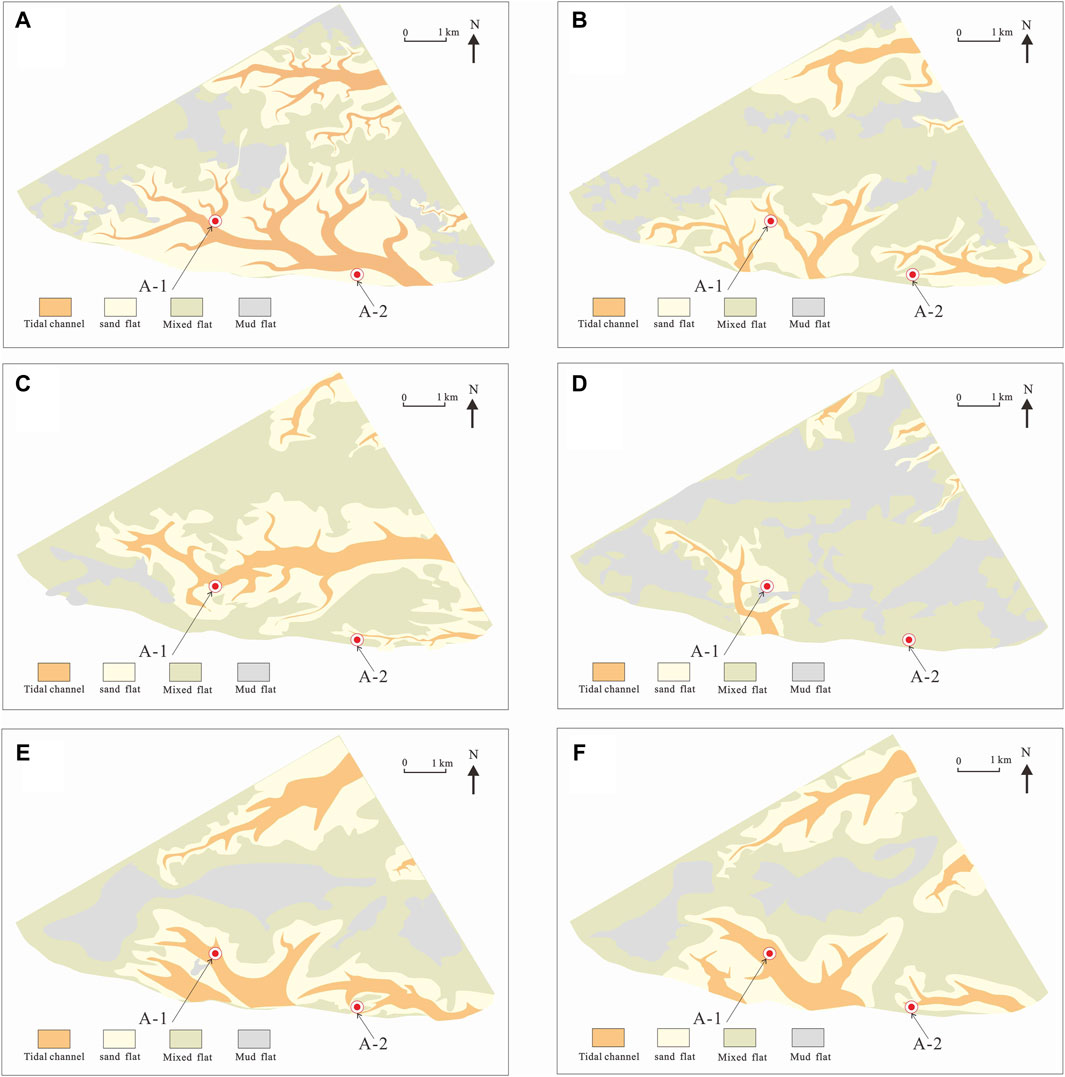
Figure 10. Planar distribution of sedimentary facies of each small layer in the first member of Zhuhai Formation (A) ZH1I upper layer; (B) layer 1 in the lower part of ZH1I; (C) layer 1 in the upper part of ZH1II; (D) layer 2 in the upper part of ZH1II; (E) layer 1 in the lower part of ZH1II; (F) layer 2 in the lower part of ZH1II.
Based on the study of experimental data, such as thin sections of rock casts, it is concluded that three diagenetic processes have significant effects on the clastic rock reservoir in Wenchang A oilfield: compaction, cementation, and dissolution.
1) The reservoir compaction in the study area is primarily due to mechanical forces. When the compaction strength is average, the particles are in point contact with each other, indicating mica cleavage bending (Figure 11A). When compaction is intense, rigid particles develop cracks and micropores, leading to linear contact between particles (Figures 11B–D). When compaction is very intense, the porosity of the rock decreases significantly, and the contact between the particles becomes concave and convex (Figures 11E, F).
2) Cementation: The cementation content influences the development of pores, which in turn affects the petrophysical properties of reservoirs (Heald and Anderegg, 1960; Janssen et al., 2023). According to the relative importance evaluation diagram of the effects of compaction and cementation on porosity (Figure 12), compaction is identified as a more significant factor than cementation in reducing porosity in the Zhuhai Formation.
3) Calcite dissolution and feldspar dissolution pores are leading to the formation of numerous secondary pores, such as hybrid micropores, intergranular pores (Figures 13A, B), and cleavage fractures (Figure 13C). Dissolution can enhance the pore space within the reservoir to a certain extent, thereby improving connectivity and the physical properties of the reservoir (Zhu et al., 2012; Wen et al., 2022).
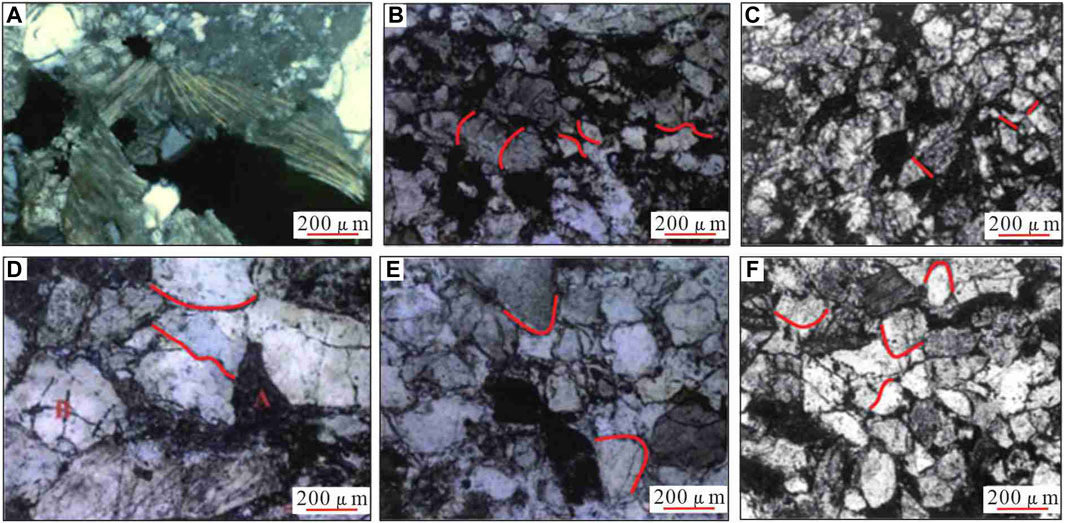
Figure 11. Compaction characteristics of the Zhuhai Formation in the Zhusan Depression (Zhong et al., 2023) (A)containing glauconitic (medium) coarse-grained feldspar quartz sandstone, point contact; (B)feldspar lithic quartz fine-coarse sandstone, line contact; (C)quartz medium sandstone, line contact; (D)feldspar lithic quartz coarse sandstone, line contact; (E)feldspar lithic quartz medium sandstone, convex and convex contact; (F)glauconite-feldspar quartz medium-fine sandstone, convex contact.
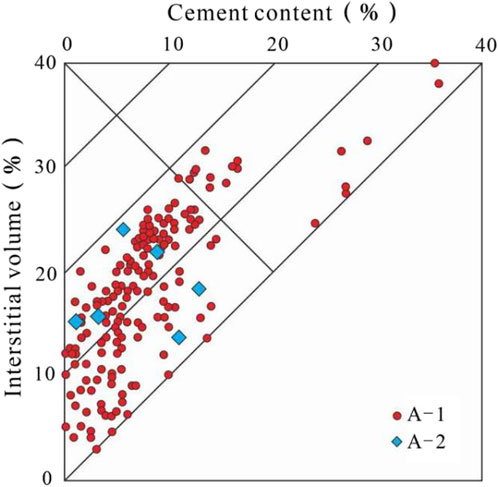
Figure 12. Evaluation of the relative importance of the influence of cementation on porosity.
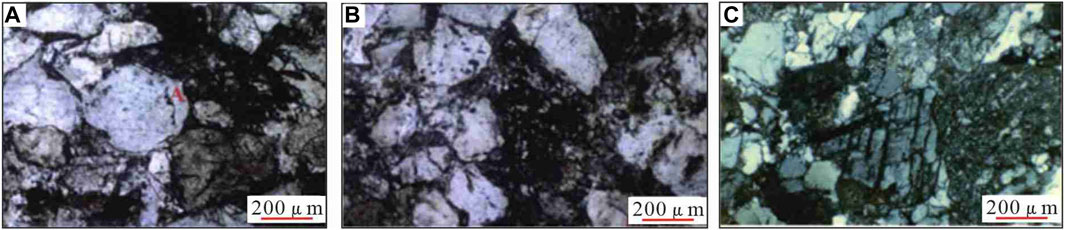
Figure 13. Cementation and dissolution characteristics of Zhuhai Formation in Zhusan Depression (Zhong et al., 2023). (A) feldspar lithic quartz medium sandstone, dissolution; (B) feldspar lithic quartz coarse medium sandstone, dissolution; (C). Medium coarse-grained sandstone, corrosion.
In this study, sandstone thickness prediction maps (Figure 14A), reservoir physical property prediction maps (Figure 14B) and sandstone oil and gas display prediction maps (Figure 14C) of each small layer of the Zhuhai Formation in the study area were used to conduct a comprehensive evaluation of favorable exploration areas (Figure 14D). The prediction maps of favorable exploration areas in each layer of the Zhuhai Formation are obtained (Figure 15). No favorable sand body was found in the second small layer at the lower part of ZH1I, hence no research has been conducted. Comprehensive physical characteristics, sandstone thickness, and oil and gas display divide favorable divisions into three categories.Class I favorable areas are characterized by superior physical properties, significant sand thickness, and the presence of both oil and gas displays. Type II favorable areas are: 1) areas with good physical properties that coincide with thicker sand; 2) areas where good physical properties overlap with oil and gas displays; 3) areas where oil and gas displays coincide with the thickness of the sand. Type III favorable areas are: 1) areas with good physical properties, but not coexisting with oil and gas display areas or thicker sand body areas; 2) areas with thick sand bodies, but not coinciding with good physical properties or oil and gas display areas; 3) oil and gas display areas, but not with good physical properties or thicker sandstone areas.
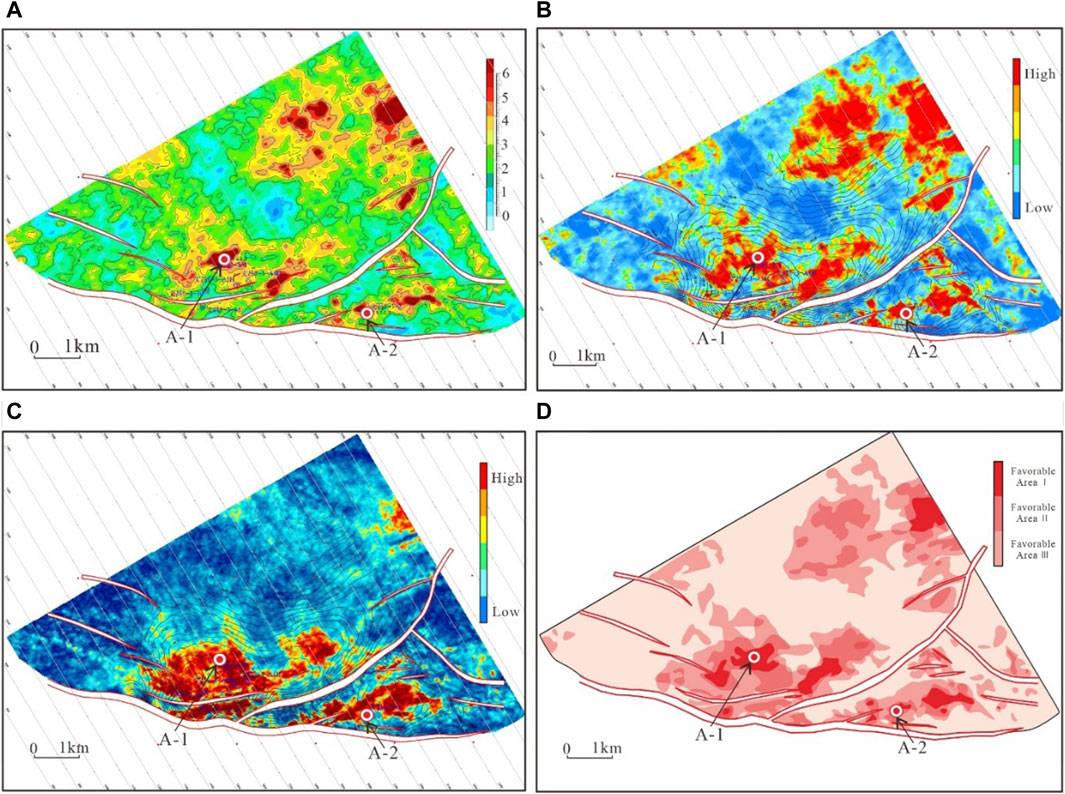
Figure 14. Prediction method of favorable area of Zhuhai Formation in Wenchang A oilfield (A) Prediction map of sandstone thickness of Zhuhai Formation; (B) Reservoir physical property prediction map of Zhuhai Formation; (C) Hydrocarbon display and prediction map of Zhuhai Formation; (D) Forecast map of favorable area distribution in Zhuhai Formation.
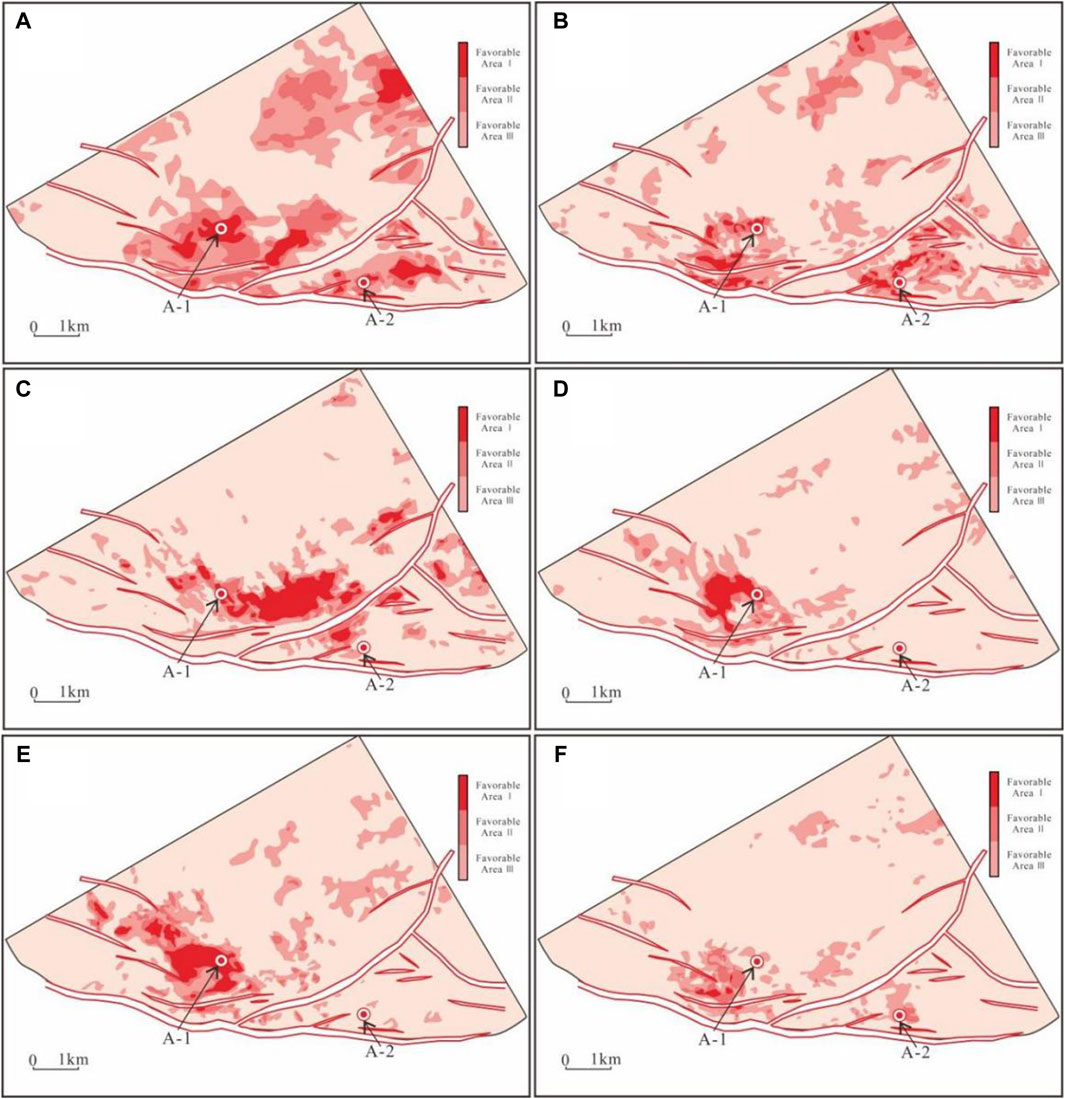
Figure 15. Prediction of favorable exploration areas of each layer of Zhuhai Formation in Wenchang A oilfield (A) ZH1I upper reservoir favorable area; (B) Favorable reservoir area of the first formation in lower ZH1I; (C) ZH1II upper reservoir favorable area; (D) Favorable area of upper 2 reservoirs of ZH1II; (E) Favorable reservoir area of the first formation in the lower part of ZH1II; (F) Favorable reservoir area of the second layer in lower ZH1II.
The favorable exploration area of the upper layer of the Zhuhai Formation (ZH1I) is concentrated, widely distributed in the study area, and covers a large area. The favorable areas of Class I were mainly distributed in the northeast and south of the study area (Figure 15A). The favorable exploration areas of layer 1 in the lower part of ZH1I are mainly distributed in the north and south of the study area. Among these, the favorable areas of typeⅠare predominantly located around well A-1 and well A-2 (Figure 15B). The favorable exploration areas of the first layer in the upper part of ZH1II are mainly concentrated in the central and southern parts of the study area. Among these areas, the favorable Class I areas are large and concentrated between well A-1 and well A-2 (Figure 15C). The favorable exploration area of the second layer in the upper part of ZH1II is small and mainly distributed in the northeast and southwest of the study area. Among these, the favorable area of class I is primarily located on the west side of well A-1 (Figure 15D). The favorable exploration area of layer 1 in the lower part of ZH1II is similar to that of layer 2 in the upper part of ZH1II. It is mainly distributed in the southwest part of the study area but also scattered in the middle and northeast parts of the study area, with an expanded scope. Among them, Type I favorable areas are mainly distributed around Well A-1 (Figure 15E). The second favorable exploration area in the lower part of ZH1II has the smallest area and the poorest physical properties, including sand thickness and oil and gas presence. Favorable areas are mainly concentrated in the southern and northern parts of the country. Among these, Class I favorable areas are only scattered on the southern side of well A-1 (Figure 15F).
According to the prediction maps of favorable exploration areas in the six sub-formations of the Zhuhai Formation, the upper layer of ZH1I, the upper layer of ZH1II, and the lower layer of ZH1II exhibit the best physical properties, the thickest favorable sand body, the strongest oil and gas display, the widest range of favorable areas, and the greatest exploration potential. The exploration potential of the lower 1 layer of ZH1I and the upper 2 layers of ZH1II is slightly weaker. The second layer in the lower part of ZH1II has the worst properties and the smallest exploration potential.
(1) The Zhuhai Formation in the study area is dominated by lithic feldspar quartz sandstone and feldspar quartz sandstone, exhibiting high compositional maturity. The porosity ranges from 14.0% to 19.0%, with an average of 16.3%. The permeability ranges from 3.1 mD to 126.1 mD, with an average of 22.4 mD, and belongs to the medium-porosity, low-permeability reservoir. The reservoir support structure consists of particle support, with the main contact being the “point-line” contact between particles. The main pore types of sandstone are primary intergranular pores and secondary intergranular dissolved pores. A few are feldspar dissolved pores, and occasionally there are hetero-based micropore micropores.
(2) The diagenesis of the Zhuhai Formation reservoir in the study area mainly includes three types: compaction, cementation and dissolution. The degree of cementation is medium, mainly iron calcite cementation. The main dissolution processes are calcite dissolution and feldspar pore dissolution. The effect of cementation and dissolution on the physical properties of the reservoir is small, and the porosity loss of the target reservoir after compaction is between 16.0% and 27.9%, and the compaction rate is between 40.0% and 69.8%, which is a medium compaction diagenetic facies.
(3) The favorable areas of each layer in the study area are mainly concentrated around Well A-1 and Well A-2, with a higher concentration of favorable areas in the southwest. The upper layer of ZH1I, the upper layer of ZH1II, and the lower layer of ZH1II exhibit the best physical properties, the thickest favorable sand body, the strongest oil and gas display, the widest range of favorable areas, and the greatest exploration potential. The exploration potential of the lower 1 layer of ZH1I and the upper 2 layers of ZH1II is slightly weaker. The second layer in the lower part of ZH1II exhibits the poorest properties and the lowest exploration potential.
The original contributions presented in the study are included in the article/Supplementary material, further inquiries can be directed to the corresponding author.
JL: Conceptualization, Data curation, Formal Analysis, Funding acquisition, Investigation, Methodology, Project administration, Resources, Software, Supervision, Validation, Visualization, Writing–original draft, Writing–review and editing.
The author(s) declare that financial support was received for the research, authorship, and/or publication of this article. Guizhou Provincial Science and Technology Innovation Talent Team for Intelligent Testing and Maintenance of Mountainous areas Bridges; CXTD[2021]008. Study on risk zoning and early warning of geological hazards of highway slopes in mountainous areas of Guizhou under the action of rainfall; 2023-122-035.
The author declares that the research was conducted in the absence of any commercial or financial relationships that could be construed as a potential conflict of interest.
All claims expressed in this article are solely those of the authors and do not necessarily represent those of their affiliated organizations, or those of the publisher, the editors and the reviewers. Any product that may be evaluated in this article, or claim that may be made by its manufacturer, is not guaranteed or endorsed by the publisher.
Chen, H. Q., Wu, B., Lu, H., Zhang, C., et al. (2021). Recombinant human bone morphogenetic protein-4 enhances tendon-to-bone attachment healing in a murine model of rotator cuff tear. Prog. Geophys. 9 (2), 565–575. doi:10.21037/atm-20-6761
Deng, X. L., Zhang, Y. C., Lu, J., Gan, J., Zhan, Y. P., and Liu, K. (2020). Tidal sedimentary characteristics and evolution of Zhuhai Formation, beipo, Wenchang B depression. J. deposition (6), 1313–1326. doi:10.14027/j.iSSN.1000-0550.2020.007
Dou, W. C., Liu, L. F., Wu, K. J., Xu, Z., and J Xu, F. (2017). Origin and significance of secondary porosity: a case study of upper Triassic tight sandstones of Yanchang Formation in Ordos basin, China. J. Petroleum Sci. Eng. 149, 485–496. doi:10.1016/j.petrol.2016.10.057
Dubrule, O., Thibaut, M., Lamy, P., and Haas, A. (1998). Geostatistical reservoir characterization constrained by 3D seismic data. Pet. Geosci. 4 (2), 121–128. doi:10.1144/petgeo.4.2.121
Ekwenye, O. C., Nichols, G., and Mode, A. W. (2015). Sedimentary petrology and provenance interpretation of the sandstone lithofacies of the Paleogene strata, south-eastern Nigeria. J. Afr. Earth Sci. 109, 239–262. doi:10.1016/j.jafrearsci.2015.05.024
Fang, Q. Y., Liu, X. Z., Wang, B., Hu, Z. D., Zhao, J. G., Yan, X. Y., et al. (2023). The applicability and underlying factors of frequency-dependent amplitude-versus-offset (AVO) inversion. Petroleum Sci. 20 (4), 2075–2091. doi:10.1016/J.PETSCI.2023.02.011
Gao, C. Q., and Yuan, F. (2024). Variation of petrophysical parameters of deep water sedimentary mudstone in Pearl River Estuary Basin. J. Yangtze Univ. Nat. Sci. Ed., 1–7. doi:10.16772/j.cnki.1673-1409.20230310.001
Haas, A., and Dubrule, O. (1994). Geostatistical inversion-a sequential method of stochastic reservoir modelling constrained by seismic data. First break 12 (11). doi:10.3997/1365-2397.1994034
Heald, M. T., and Anderegg, R. C. (1960). Differential cementation in the Tuscarora sandstone [Virginia-West Virginia]. J. Sediment. Res. 30 (4), 568–577. doi:10.1306/74D70AA1-2B21-11D7-8648000102C1865D
Janssen, M., Caracciolo, L., Bonnell, L. M., Lander, R. H., Munnecke, A., Beltrán-Triviño, A., et al. (2023). Climatic, depositional and environmental controls on early carbonate cementation in fluvial and shallow marine sandstones. Mar. Petroleum Geol. 156, 106433. doi:10.1016/j.marpetgeo.2023.106433
Jiang, L., Hu, A. P., Ou, Y. L., Liu, D. W., Hu, Y. J., Tang, Y. J., et al. (2023). Diagenetic evolution and effects on reservoir development of the dengying and longwangmiao formations, central sichuan basin, southwestern China. Petroleum Sci. 20 (6), 3379–3393. doi:10.1016/j.petsci.2023.09.025
Jiang, P. W. Z. Z., Zou, M. S., Chen, X. J., Lu, J., and You, L. (2021). Development characteristics of sandstone carbonate cements of Zhuhai Formation in Wenchang A Depression and its influence on reservoir quality. Earth Sci. (2), 600–620. doi:10.3799/dqkx.2020.075
Ko, L. T., Ruppel, S. C., Loucks, R. G., Hackley, P. C., Zhang, T. W., and Shao, D. Y. (2018). Pore-types and pore-network evolution in Upper Devonian-Lower Mississippian Woodford and Mississippian Barnett mudstones: insights from laboratory thermal maturation and organic petrology. Int. J. Coal Geol. 190, 3–28. doi:10.1016/j.coal.2017.10.001
Li, Y., Fan, A. P., Yang, R. C., Sun, Y. P., and Nils, L. (2022). Braided deltas and diagenetic control on tight sandstone reservoirs: a case study on the Permian Lower Shihezi Formation in the southern Ordos Basin (central China). Sediment. Geol. 435, 106156. doi:10.1016/j.sedgeo.2022.106156
Liao, X., Ma, B., Shen, H., and Zou, J. (2002). Prediction of sand body and gas content by using Jason software. Nat. Gas Explor. Dev. (3), 34–43. doi:10.3969/j.issn.1673-3177.2002.03.006
Luo, X., Chen, X. H., Duan, Y. H., Chen, S. Z., Qi, Y. K., and Huo, F. (2022). A new fluid mobility calculation method based on frequency-dependent AVO inversion. Front. Earth Sci. 10. doi:10.3389/feart.2022.829846
Lv, T., and Li, Z. (2021). Quantitative characterization method for microscopic heterogeneity in tight sandstone. Energy Explor. Exploitation 39 (4), 1076–1096. doi:10.1177/0144598721993937
Meng, W., Niu, Z. C., Hu, Y., An, T. X., Liu, K., and Gao, Q. (2020). Genesis of authigenic kaolinite and its indicative significance to secondary pores in petroliferous basins: a case study in the Dongying Sag, Bohai Bay Basin, Eastern China. J. Petroleum Sci. Eng. 186, 106698. doi:10.1016/j.petrol.2019.106698
Mette, O., Henrik, V., Henrik, N. L., Rikke, W., Sebastian, M. N., Benjamin, H. D., et al. (2022). Maturity matters in provenance analysis: mineralogical differences explained by sediment transport from fennoscandian and variscan sources. Geosciences 12 (8), 308. doi:10.3390/GEOSCIENCES12080308
Nabawy, B. S., Mansour, A. S., Rashed, M. A., and Afify, W. S. (2020). Implementation of sedimentary facies and diagenesis on the reservoir quality of the Aquitanian-Burdigalian Rudeis Formation in the Gulf of Suez, Egypt: a comparative surface and subsurface study. Geol. J. 55 (6), 4543–4563. doi:10.1002/gj.3683
Nisar, U. B., Mughal, M. R., Shahzad, A., Akhter, G., Khan, S., Wahid, A., et al. (2024). Evaluating the paleo-depositional environment of productive reservoir sand of Lower Goru Formation: an integrated stratigraphic and diagenetic study. Environ. Earth Sci. 83 (1), 5. doi:10.1007/s12665-023-11309-z
Pang, S., Liu, C., Guo, Z. Q., Liu, X. W., and Liu, Y. W. (2018). Gas bearing seismic recognition technique of shale reservoir based on frequency-varying AVO inversion. Chin. J. Geophys. (11), 4613–4624. doi:10.6038/cjg2018L0529
Qian, Y. G., Ye, T. R., Zhang, S. H., Wang, Y., Zhan, X., and Ying, Y. Z. (2013). Application of pre-stack geostatistical inversion technique in quantitative prediction of complex reservoirs. Oil Gas Geol. (6), 834–840. doi:10.11743/ogg20130618
Quan, Y. B., Liu, J. Z., Zhao, D. J., Hao, F., Wang, Z. F., and Tian, J. Q. (2015). The origin and distribution of crude oil in Zhu III sub-basin, Pearl River Mouth Basin, China. Mar. Petroleum Geol. 66, 732–747. doi:10.1016/j.marpetgeo.2015.07.015
Ren, H., Goloshubin, G., and Hilterman, F. J. (2009). Poroelastic analysis of amplitude-versus-frequency variations. Geophysics 74 (6), N41–N48. doi:10.1190/1.3207863
Shen, H. T., Guo, N. C., Qin, T., Yu, Q., and Wang, W. (2017). Application of geostatistical inversion technology in ultra-thin reservoir prediction. Prog. Geophys. (1), 248–253. doi:10.6038/pg20170135
Shu, L. F., Zhang, L. L., Lei, S. L., Gao, Z. L., Han, X., and Yu, S. (2022). Reservoir development characteristics and main controlling factors and favorable reservoir prediction in the continental shelf edge delta of Zhuhai Formation, Baiyunwa, Pearl River Estuary Basin. Petroleum Sci. Bull. (3), 309–320. doi:10.3969/j.issn.2096-1693.2021.03.028
Sun, S. Z., Jiang, S., Sun, X., Yang, H., Han, J., and Li, Y. (2012). “Fluid identification using frequency-dependent AVO inversion in dissolution caved carbonate reservoir,” in SEG international exposition and annual meeting (USA: SEG). SEG-2012).
Wang, P. C., Suo, Y. H., Peng, G. R., Li, S. Z., Du, X. D., Cao, X. Z., et al. (2023). Three-stage extension in the cenozoic pearl river mouth basin triggering onset of the South China sea spreading. Gondwana Res. 120, 31–46. doi:10.1016/J.GR.2022.05.023
Wang, Z., Tang, H. M., Yang, J., and Huang, L. (2022). Reservoir pore characteristics based on depositional microfacies control in the Neogene guantao formation, bohai bay basin, China. Energies 15 (8), 2870. doi:10.3390/en15082870
Wen, J., Zhao, J. Z., Li, J., and Er, C. (2022). Characteristics of middle-deep Paleogene sandstone reservoirs in Baiyun Depression and the control effect of dissolution on high-quality reservoirs. Special Oil Gas Reservoirs 29 (6), 47–55. doi:10.3969/j.issn.1006-6535.2022.06.006
Wilson, A. (2010). Theory and methods of frequency-dependent AVO inversion. Available at: http://hdl.handle.net/1842/4740.
Wu, D., Li, H., Jiang, L., Hu, S., Wang, Y., Zhang, Y., et al. (2019). Diagenesis and reservoir quality in tight gas bearing sandstones of a tidally influenced fan delta deposit: the Oligocene Zhuhai Formation, western Pearl River Mouth Basin, South China Sea. Mar. Petroleum Geol. 107, 278–300. doi:10.1016/j.marpetgeo.2019.05.028
Wu, J., and Li, F. H. (2009). Prediction of oil-bearing single sandbody by 3D geological modeling combined with seismic inversion. Petroleum Explor. Dev. 36 (5), 623–627. doi:10.1016/s1876-3804(09)60150-6
Xia, L., Liu, Z., Cao, Y., Zhang, W., Liu, J., Yu, C., et al. (2020). Postaccumulation sandstone porosity evolution by mechanical compaction and the effect on gas saturation: case study of the Lower Shihezi Formation in the Bayan'aobao area, Ordos Basin, China. Mar. Petroleum Geol. 115, 104253. doi:10.1016/j.marpetgeo.2020.104253
Xu, H. Q., and Gui, Z. X. (2006). Prediction of sand body distribution by logging constrained seismic inversion: a case study of sand body of Sansha Formation in Sha4 Member of YX Region. Nat. Gas. Geosci. (4), 547–551. doi:10.3969/j.issn.1672-1926.2006.04.025
Xu, W. X., He, W. J., Chen, K., Liu, F., and L, W. (2023). Paleogene provenance system and sedimentary filling evolution of zhusan depression in western pearl river estuary basin. Mar. Geol. Quat. Geol. (2), 145–159. doi:10.16562/j.carolcarrollnki.0256-1492.2022060901
Xu, X., Liu, L. Y., Li, X. J., Yang, W. J., Cao, Y. G., Ma, H., et al. (2021). Sequence stratigraphy, sedimentary characteristics of barrier coastal sedimentary system of the Benxi Formation (Gaoqiao area, Ordos basin) and favorable reservoir distribution. Energy Rep. 7, 5316–5329. doi:10.1016/j.egyr.2021.08.173
Yang, J. H., Yang, X. B., You, J. J., Jiang, R. F., Xu, T., Hu, G. W., et al. (2019). Hydrocarbon accumulation rules and exploration directions of zhusan depression, pearl river mouth basin. Acta Pet. Sin. (A1), 11–25. doi:10.7623/syxb2019s1002
Yang, Y., Zhang, H. M., Luo, X., Wang, W. J., Chen, M., Zhou, H., et al. (2017). Application of geostatistical inversion and co-simulation techniques to the prediction of “sweet dessert” of thin shale gas in Ning 209, in Proceedings of the 2017 National Natural Gas Annual Conference, Brazil, 24-26 May 2017 (Sichuan Changning Natural Gas Development Co., LTD), 329–337.
Zakir, H. H. M., Armstrong, A., J, S., Ramos, V., and Mayla, A. (2024). Microtextures on quartz grain surfaces in the Bay of Bengal shoreline sediments, Bangladesh: implications for sediment transport process and depositional environment. Catena1, 07770. doi:10.1016/J.CATENA.2023.107770
Zhang, Y., Yin, Y. S., and Qin, Z. Y. (2015). Application of geostatistical inversion in thin sand reservoir prediction. Fault-block Oil Gas Field (5), 565–569. doi:10.6056/dkyqt201505005
Zhong, H. (2018). Master's thesis on the application of seismic attributes to reservoir prediction. China: China University of Petroleum Beijing. doi:10.27643/d.cnki.gsybu.2018.000730
Zhong, Y. T., Dong, Y. L., Li, S. L., Sun L, P., Lv, W., and Qi, X. (2023). Sedimentary characteristics and reservoir control factors of transition facies of Zhuhai Formation in Zhusan Depression. J. Northeast Petroleum Univ. 4, 39–56+106+7-8. doi:10.3969/j.issn.2095-4107.2023.04.004
Keywords: reservoir characteristics, Zhuhai Formation, prestack geostatistical inversion, frequency-varying AVO inversion, favorable reservoir area
Citation: Liu J (2024) Reservoir characteristics analysis and favorable area prediction of Zhuhai Formation, Wenchang A oilfield, South China Sea. Front. Earth Sci. 12:1395146. doi: 10.3389/feart.2024.1395146
Received: 03 March 2024; Accepted: 09 April 2024;
Published: 13 May 2024.
Edited by:
Qingchao Li, Henan Polytechnic University, ChinaReviewed by:
Qiang Li, China University of Petroleum Beijing, ChinaCopyright © 2024 Liu. This is an open-access article distributed under the terms of the Creative Commons Attribution License (CC BY). The use, distribution or reproduction in other forums is permitted, provided the original author(s) and the copyright owner(s) are credited and that the original publication in this journal is cited, in accordance with accepted academic practice. No use, distribution or reproduction is permitted which does not comply with these terms.
*Correspondence: Jianning Liu, NzY3OTgzMTU5QHFxLmNvbQ==
Disclaimer: All claims expressed in this article are solely those of the authors and do not necessarily represent those of their affiliated organizations, or those of the publisher, the editors and the reviewers. Any product that may be evaluated in this article or claim that may be made by its manufacturer is not guaranteed or endorsed by the publisher.
Research integrity at Frontiers
Learn more about the work of our research integrity team to safeguard the quality of each article we publish.