 Wencheng Cai1
 Peng Feng
 Huajin Li
- 1Sichuan Lexi Expressway Co., Ltd., Chengdu, Sichuan, China
- 2Sichuan Intelligent Expressway Technology Co., Ltd., Chengdu, Sichuan, China
- 3School of Architecture and Civil Engineering, Chengdu University, Chengdu, Sichuan, China
Landslides, prevalent in mountainous areas, are typically triggered by tectonic movements, climatic changes, and human activities. They pose catastrophic risks, especially when occurring near settlements and infrastructure. Therefore, detecting, monitoring, and predicting landslide deformations is essential for geo-risk mitigation. The mainstream of the previous studies have often focused on deterministic models for immediate landslide prediction. However, in most of them, the aspect of prediction uncertainties are not sufficiently addressed. This paper introduces an innovative probabilistic prediction method using a Variational Autoencoder (VAE) combined with Gated Recurrent Unit (GRU) to forecast landslide deformations from a generative standpoint. Our approach consists of two main elements: firstly, training the VAE-GRU model to maximize the variational lower bound on the likelihood of historical precipitation data; secondly, using the learned approximated posterior distribution to predict imminent deformations from a generative angle. To assess the prediction quality, we use four widely-used metrics: Prediction Interval Coverage Probability (PICP), Prediction Interval Normalized Average Width (PINAW), Coverage Width-Based Criterion (CWC), and Prediction Interval Normalized Root Mean Square Width (PINRW). The results demonstrate that our proposed VAE-GRU framework surpasses traditional state-of-the-art (SOTA) probabilistic deformation prediction algorithms in terms of accuracy and reliability.
1 Introduction
Landslides are commonly observed in mountainous area in China especially in the southeast regions that causes an enormous amount of economic damage and casualties (Jibson, 2007; Huang et al., 2022). When occurrences are close to villages, settlements and infrastructures (e.g., interstate highways, roads, energy supply facilities, etc.), the potential damage can be devastating (Li et al., 2022). To reduce the risks, early warning and preventative actions are commonly applied (Romeo, 2000; Feng et al., 2021). Efficient early warning mechanisms that precisely measure future deformation process in landslides are crucial for experts in assessing impending landslide risks. Consequently, prediction of incoming landslide movements is key in mitigating geological hazards (Xu et al., 2016).
Publications related to landslide deformation prediction could be classified into deterministic methods and probabilistic methods based on the methodological perspective. In scholarly research, considerable effort has been dedicated to exploring a range of deterministic models for predicting landslide deformations (Feng et al., 2022a; Li et al., 2023). Wang H. et al. (2023a) performed landslide displacement prediction using on-site data based on ARIMA model. Zhang et al. (2022) applied Bayesian approach to optimize the hyper-parameters of Random Forest algorithm to predict the deformation in reservoir landslides. Cemiloglu et al. (2023) applied logistic regression algorithm to assess the probability of landslide occurrences. Mao et al. (2024) explored several machine learning algorithms to map the susceptibility of landslides in the drainage basin. Nanehkaran et al. (2021) adopted a fuzzy-logic based model to assess landslide susceptibility and discovered five major factors including climate factors, geomorphology conditions, tectonic structure, geological conditions, and human activities are highly associated with the probability of having landslide occurrence. Zhou et al. (2022) proposed a novel coupling method to predict landslide deformation using extreme gradient boosting integrated with Hodrick-Prescott filtering approach. Jiang and Chen (2016) developed a generalized regression neural network with k-fold cross validation to predict landslide deformation process in the temporal domain. Zhang et al. (2019) used piecewise time function to improve the regularization function of Elman Neural Network (ENN) in sequential landslide displacement forecasting. Jiang et al. (2020) chose support vector regression (SVR) algorithm with optimal weight selection to forecast short-term landslide deformation in Three Gorges Reservoir. Yang et al. (2022) proposed using variational mode decomposition integrated with variational autoencoder to perform short-term time series forecasting. Wang et al. (2023b) applied a novel approach, namely, Autoformer handling time-series prediction tasks which demonstrated advanced capability in extracting sequence correlation in the temporal domain. Nevertheless, deterministic prediction methodologies typically yield forecasts of future landslide deformations in the form of specific spot values or mean values. This approach, while useful, falls short in comprehensively capturing the inherent uncertainties associated with landslide deformation, failing to provide a full spectrum analysis of potential variability and risk (Feng et al., 2022b).
In contrast, the exploration of probabilistic prediction methods offers significant advantages, particularly in their ability to furnish a more comprehensive statistical analysis. This enriched data scope is immensely beneficial in addressing uncertainties within the decision-making process, offering a more nuanced and informed approach to evaluating potential outcomes and risks (Long et al., 2021). Wang et al. (2019) used particle-swarm optimization (PSO) algorithm to optimize the hyper-parameters of extreme learning machine (ELM) in landslide probabilistic prediction tasks. Lian et al. (2020) adopted a novel method, namely, lower upper bound estimation (LUBE) to construct the probabilistic interval of predicted landslide instant deformation. Gong et al. (2022) obtained more realistic and reliable probabilistic landslide displacement prediction outcome using least squares support vector machine (LSSVM) to compute point prediction results. Then, the interval prediction of the landslide displacement is made based on the dual-outputs obtained from the LSSVM model. In the above discussed literature, statistical characteristics including prediction intervals (PIs) and quantiles are readily derivable from the probabilistic outputs, typically presented in the form of a probability density function (PDF). Meanwhile, predicting the probability density function (PDF) of landslide deformation holds greater academic value and warrants further research investment.
Recently, deep learning algorithms have contributed to the unprecedented success of various engineering applications in sectors including computer vision (CV), natural language processing (NLP), and data generation. The most popular deep learning algorithms include convolutional neural networks (CNNs) and recurrent neural networks (RNNs) when handling sequential dataset. Pei et al. (2021) proposed using 1D CNN to extract temporal time-varying factors in landslide deformation sequential dataset and use them in future displacement prediction. Li et al. (2020) adopted deep belief network to predict instant landslide deformation and constructed exponentially weighted moving average control charts to capture the step-like behavior in precipitation seasons. Azarafza et al. (2021) applied CNN to predict the landslide susceptibility in the case study area in Isfahan province, Iran. Nikoobakht et al. (2022) discovered that CNN can produce outperformance in landslide susceptibility mapping on GIS data in comparison with conventional machine learning algorithms. Lin et al. (2022) explored long short-term memory (LSTM) network architecture to be an effective approach to extract temporal characteristics for landslide deformation time-series data. Yang et al. (2023a) constructed a novel robust adaptive rescaled neural network, which uses Incosh loss function, to perform interval prediction of time-series data and demonstrated outperformance in comparison with other approaches. Nava et al. (2023) integrated LSTM with 1D convolution layer to predict landslide deformation in multiple locations. The methodologies described above are grounded in autoregression for predicting landslide deformation.
In some recent literature, they also incorporated the deep-learning algorithms with uncertainty quantification frameworks that achieved promising results in future landslide deformation prediction. A summary of the most recent probabilistic forecasting of landslide deformation has been presented in Table 1 below. Nevertheless, a commonly ignored important aspect is the sufficient acknowledgement of the existence of additional triggering factors—such as precipitation, seismic activity, and anthropogenic interventions—that exhibit significant temporal correlations with the deformation process. Incorporating these factors into the predictive models could potentially enhance their performance (Yang et al., 2023b).
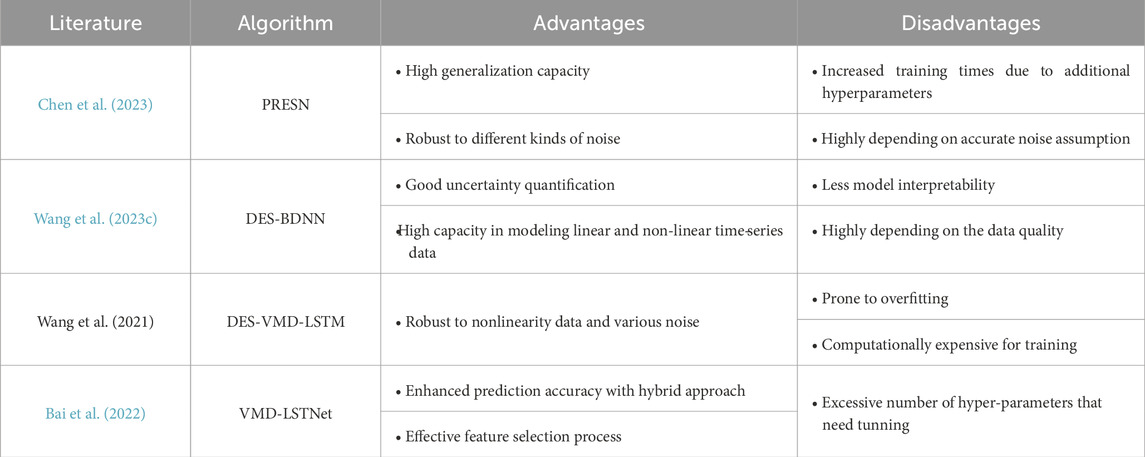
Table 1. Discussion of most recent literature of probabilistic landslide deformation prediction.
In current model development efforts, a significant focus is on understanding the temporal correlations within historical landslide deformation data as well as the major triggering factors. By grasping this temporal structure, the models aim to forecast incoming instant deformation with precision, either in the immediate next step or over several future steps. Applying deep learning to landslide deformation prediction typically involves two main components: temporal information extraction and forward prediction. The first component often utilizes an encoder network (such as CNN or LSTM) or a symmetric encoder-decoder network (like an Autoencoder) to condense complex precipitation sequence data into low-dimensional latent vectors. These vectors act as a ‘DNA’ for the sequence data, capturing its essential characteristics. The second component, forward prediction, leverages these latent vectors as inputs in a neural network algorithm to forecast imminent landslide deformations. Previous studies suggest that these latent vectors, containing compressed information, often yield enhanced predictive performance and greater generalizability. Therefore, effectively and accurately compressing temporal landslide deformation information is crucial and warrants further research.
Thus, in this paper, we introduce a new generative method for forecasting future landslide deformations. Our proposed architecture comprises two primary components: 1. Variational Autoencoder with Gated Recurrent Units (VAE-GRU): This symmetric network acts as a variational encoder-decoder. The encoder, denoted as
This study’s key advancements and contributions are as follows:
(1) Contrasting with conventional probabilistic prediction methods, this study introduces a unique generative model for probabilistic forecasting of immediate landslide deformations with quantified uncertainties.
(2) This research shifts from traditional point estimation to a novel objective function, aimed at maximizing the variational lower bound of the conditional likelihood for the predicted target.
(3) Compared to current SOTA probabilistic prediction techniques, our approach demonstrates enhanced predictive accuracy across various measurement metrics.
This article is organized as follows: Section 2 presents the geo-environmental context of our study area, along with details on data collection. Section 3 elaborates on the methods employed in this research, including a discussion on SOTA probabilistic prediction algorithms. In Section 4, we conduct case studies and analyze computational results using field datasets. Finally, Section 5 concludes the research findings.
2 Field investigation
This section introduces our case study region in terms of the regional geologic setting, topography and geomorphology details, as well as the triggering factors.
2.1 Regional geologic setting
Our case study region is located within the territory of Lebu Village, Bagu Township, Meigu County, Liangshan Prefecture, in Sichuan Province, China. Multiple shallow landslides are observed and monitored in this region. Field engineers have performed drilling on the landslide body for on-site investigation and data collection.
According to the on-site investigation, the landslides in this study region has an average thickness of 26 m which the majority of the thickness varies between 11 and 35.25 m. In the trailing edge, the average width is 30 m and the elevation is 1,930 m. In the leading edge, the average width is 360 m and the average elevation is 1,740 m. Meanwhile, the average slide body is 3.2 million cubic meters and the majority of them are classified as huge landslide. The pictures of drilled samples from on-site investigation by drilling into the landslide body has been illustrated in Figure 1 respectively.
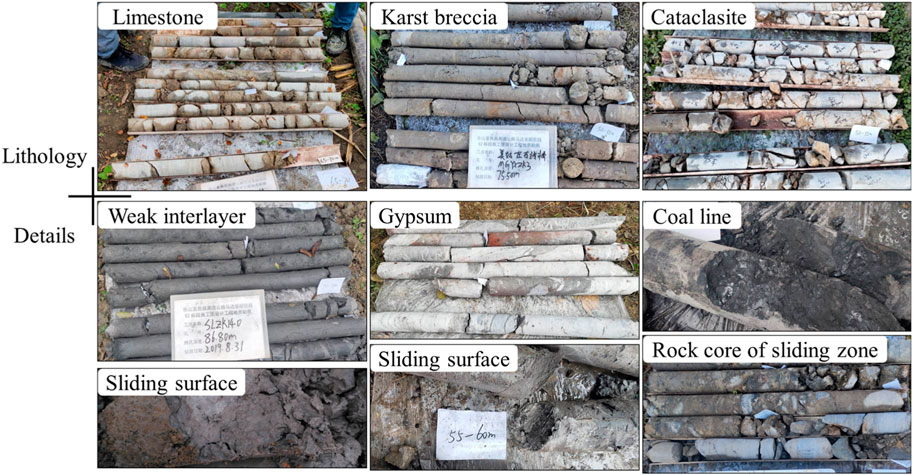
Figure 1. Drilled samples collected from on-site investigation.
2.2 Topography and geomorphology
The landslides in this study region are all shallow landslides as the slide surfaces are all within the top-soil layer along the boundary of soil-bedrock boundary. The exposed bedrock is consisted of sandstone formation, cataclastic fault rocks, and breccias. Thus, it can be classified as Triassic Upper Xujiahe Formation and is relatively stable.
The slide surface soil layer is 20–30 mm thick and includes multiple fractured weathered silty mudstones. It has high moisture content and upper plastic limit. The breccias all have the same orientation. Scratches are formed and shiny mirror-like planes can be observed. The slide body mainly contains siltstone with little clay, as well as gravel mixed with sandstone. The majority of the rocks in the slide body are sandstones with few bedrocks longer than 10 m. Thus, 70%–80% of the slide body is gravel and the remaining portion is gravel–silty clay.
All landslide slops are facing the river and are fan-shaped with relatively flat body. The trailing edge is attached with the steep slope of the mountains. The slide body in the leading edge is sank within the Meigu River. The average slide body is lower than the surroundings by 1–3 m on average. Human activities are heavily integrated with the slide body at current stage. Many local residents chose relative flat spot to build their homes over the slide body. Besides, the village community center and the community daycare center are both constructed on the slide body slop. Except these infrastructures, the rest of the slide slops are converted into terraced farm fields planted with fruit trees including apple trees, peach trees, and cherry trees.
2.3 Triggering factors
There are three major factors that triggered the landslide occurrences in this region: the seasonal heavy precipitation, the fragile geological structure of interbedded sandstone and mudstone, and the fault activity.
To begin with, the seasonal heavy precipitation is the leading triggering factor for the shallow landslides in the study region. The landslide mass above the slip zone has good permeability, allowing substantial rainfall to infiltrate through the surface into the landslide body. On one hand, the rise in river water levels reduces the hydraulic gradient inside the landslide mass, significantly decreasing the discharge of groundwater within it and causing prolonged water retention, which increases the landslide mass’s weight and downslope force. On the other hand, the relatively impermeable nature of the mudstone layers causes water accumulation, increasing the water content of the mudstone and inevitably reducing the strength of potential sliding surfaces, thereby decreasing the resisting force. Therefore, under the influence of rainfall, the equilibrium within the landslide mass is disturbed, triggering the landslide. Hence, concentrated rainfall is identified as the primary inducing factor for the occurrence of the landslide.
Second, the landslide area’s geological structure is fragile, consisting of interbedded sandstone and mudstone layers, which include carbonaceous shale. Due to the mudstone and shale acting as relatively impermeable layers and sandstone as a relatively permeable layer, significant rainfall penetrates through the overburden and sandstone, discharging along the mudstone layers. However, limited discharge points cause some groundwater to stagnate within the mudstone layers. Under the significant overburden pressure, intense hydro-rock interactions occur, leading to mudstone becoming muddy, greatly reducing rock strength and forming potential slip surfaces. The geological characteristics of alternating sandstone and mudstone layers (hard-soft-hard) make it a typical landslide-prone stratum. Additionally, the area’s fragile geological structure, combined with its mid-mountain terrain, allows rivers to easily erode and widen valleys, providing free faces and space for landslides. The landslides have formed a relative height difference of about 190 m and an average slope of 16.5°, providing sufficient gravitational potential energy for movement.
In addition, the fault activity is a controlling factor in landslides. It explains that fault movement influences the evolution of the slope structure. The intense vertical seismic acceleration caused by fault activity leads to separation along the relatively weak interlayer fault zones in the slope, creating a vertical tamping effect. This tamping effect further fractures the landslide rock mass and is accompanied by an expansion effect of the slip zone, resulting in a high degree of rock fragmentation and poor geo-mechanical properties. In the slope where the landslide occurred, the lower and middle parts are parallel to the valley and have a fault with a developed powdered rock zone, acting as a water barrier. The barrier effect of the fault causes the groundwater level in the bedrock of the slope to rise, softening the slope body and potentially playing a significant role in the formation and development of the landslide. Current drilling reveals that the bedrock groundwater is abundant, with some boreholes showing artesian water, further illustrating this point.
3 The proposed method
In the context of forecasting deformations, historical precipitation data emerges as a pivotal input due to its significant role as a primary trigger for landslide occurrences. In this research, the proposed VAE-GRU model capitalizes on the sequential nature of precipitation data, facilitating the extraction of temporal dependencies between rainfall patterns and landslide movements. This approach not only enhances the predictive accuracy of landslide forecasting models but also contributes to the advancement of early warning systems by providing a probabilistic understanding of landslide deformations in response to varying precipitation scenarios. Consequently, leveraging historical precipitation data within a VAE-GRU framework represents a critical methodological advancement in geotechnical risk management and mitigation efforts.
This section presents an innovative probabilistic prediction method using a Variational Autoencoder combined with Gated Recurrent Unit (VAE-GRU) to forecast landslide deformations from a generative standpoint. Our methodology involves a dual-component strategy: initially, we focus on enhancing the VAE-GRU model to optimize the variational lower bound concerning the likelihood of historical precipitation. Subsequently, we use the approximated posterior distribution, as derived from this model, to foresee impending deformations through a generative perspective. The main aim of this implementation is to extract accurate temporal dependency structure between the historic precipitation and the incoming instant deformation. A flow chart that illustrates the computational flow of the proposed approach has been shown in Figure 2 below.

Figure 2. Computational flow of the proposed VAE-GRU model.
3.1 Gated recurrent unit
The Gated Recurrent Unit (GRU) is a popular algorithm for sequential data modeling. It has been widely applied in many sectors including traffic prediction, renewable energy systems, meteorology, and financial market (Niu et al., 2023). The architecture of a GRU unit has been illustrated in Figure 3 as follows.
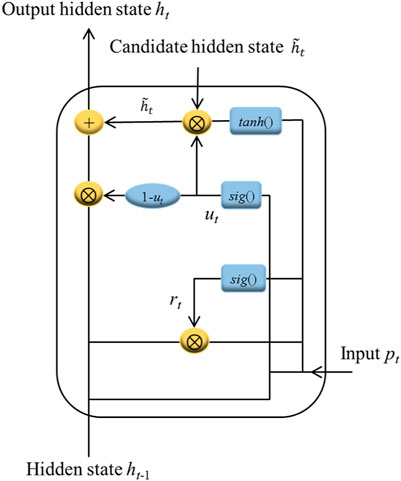
Figure 3. The architecture of a GRU unit.
According to Figure 2, there are two gates included in the GRU unit: the update gate
Where
Based on computed
Where
Where
3.2 VAE-GRU
Variational autoencoder (VAE) is a powerful deep-learning generative architecture that has been widely used to compress high-dimensional complex data into lower-dimensional latent space. It is considered as an expansion of the conventional autoencoder (AE) architecture (Park et al., 2018; Li, 2022a; 2022b) which also learns patterns in an unsupervised manner.
In a conventional AE, the encoder network compresses the high-dimensional data into a latent vector within reduced dimensionality. Subsequently, the decoder network uses the latent vector to generate the reconstructed output that has the same dimensionality as the input high-dimensional data. This process performed within the conventional AE is deterministic which means the mapping between input and output is certain and unique (Papadopoulos and Karalis, 2023). In comparison, the VAE construct a probability distribution across all dimensions of the encoded latent vector each represented by the mean and standard deviation of a Gaussian distribution. This probabilistic nature permits random sampling within the latent space, a critical feature that enables the decoder to generate novel data from the sampled outputs, thus enhancing the model’s utility for various generative tasks.
In this research, we introduce a novel architecture Variational Autoencoder (VAE) combined with Gated Recurrent Unit (GRU) namely, VAE-GRU to learn the temporal dependency structure of the precipitation–the leading triggering factor of landslide deformation. As displayed in Figure 4 (a), it adopts a similar encoder-decoder symmetric structure by replacing the feed-forward network in a VAE with GRU units. In other words, the GRU units assume the role of traditional neurons (or perceptrons) within both the encoder and decoder networks, processing the input information. The encoder uses GRUs to process the input sequence in order to learn its temporal dependencies and encoding it into a latent vector in the center, which, in a standard VAE, would be a fixed vector. This latent vector is then sampled using the reparameterization trick typical of VAEs, ensuring that the model can be trained end-to-end with defined loss function by approximating the posterior distribution. The decoder takes this sampled latent vector to reconstruct the original sequence by predicting the next element in the sequence at each time step. Therefore, it generates sequences that retain the temporal dynamics of the input data.
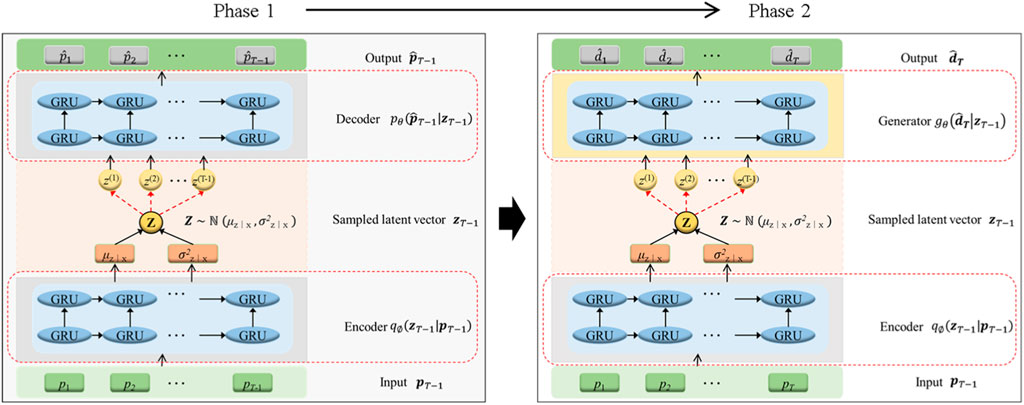
Figure 4. Overview of the proposed generative probabilistic deformation prediction framework.
In detail, In the encoder network, given a historic precipitation sequence
Where the posterior distribution
In the decoder network, the latent variable is updated following Eqs 9–12 below:
Where
Where
In sum, the VAE-GRU architecture introduces an approximate posterior
Where
3.3 Generative probabilistic displacement prediction framework
Given the constructed VAE-GRU framework, in this research, it proposes a displacement prediction framework to forecast the incoming instant landslide deformation. The graphical representation of this framework is illustrated in Figure 4 below.
According to Figure 4, this framework contains two elements. In the first elements, a VAE-GRU has been trained to learn the latent representations of the historic precipitation sequence. The trained VAE-GRU has sufficiently learned the temporal dependency structure within the precipitation sequence and compressed a rich set of information within the central latent vector
3.4 Improved optimization objective
This study encompasses two primary training components, as illustrated in Figure 4. Therefore, the formulation of a comprehensive optimization objective is essential to achieving adequate prediction performance. Traditionally, most research employs a straightforward addition of the reconstruction loss (Eq. 14) and the prediction loss (Eq. 15) to constitute the overall objective function for optimization. However, this method of simple summation encounters several limitations: Firstly, in the absence of a hyperparameter to mediate between the two terms, the model risks disproportionately emphasizing one aspect—either reconstruction or prediction—to the detriment of the other. Secondly, the lack of a hyperparameter diminishes the model’s ability to tailor its learning focus to the specific demands of the task at hand. Furthermore, a model calibrated without an appropriate equilibrium between reconstruction and prediction may exhibit poor generalization to new data. Additionally, varying datasets or distinct segments within a dataset may necessitate different equilibriums between reconstruction and prediction for optimal performance. Lastly, the absence of a hyperparameter to adjust this balance renders the training process less flexible and may prevent convergence to the most optimal solutions.
Here, in order to allow for a more controlled and potentially more effective training process, it proposes an improved version of the objective function as Eq. 16:
Where
3.5 SOTA methods
To showcase the superior predictive capabilities of the proposed VAE-GRU probabilistic prediction framework, this study conducts a comparative analysis against three widely recognized state-of-the-art (SOTA) methods: Extreme Learning Machine with Lower Upper Bound Estimation (ELM-LUBE), Conditional Kernel Density Estimation with Nonparametric Regression Calibration (CKDE-NRC), and Variational Autoencoder integrated with Long Short-Term Memory (VAE-LSTM) units.
ELM-LUBE (Long et al., 2022): The ELM-LUBE is a popular interval-based probabilistic prediction framework that has been widely applied in time-series prediction tasks. This framework is a sophisticated predictive modeling technique that combines the rapid training capabilities of Extreme Learning Machines (ELM) with the robust interval prediction framework of Lower Upper Bound Estimation (LUBE). ELM’s rapid training is achieved through fixed input weights and analytically determined output weights, making it suitable for large-scale problems. LUBE adds value by generating prediction intervals that quantify uncertainty, estimating bounds to encapsulate the true value with a specific probability. This integration offers a fast and accurate tool for predictive modeling, balancing speed with uncertainty quantification.
CKDE-NRC (Jiang et al., 2019): The CKDE-NRC embodies a sophisticated statistical framework designed for enhanced predictive modeling, particularly in capturing the nuanced conditional distributions of target variables. Given a set of historic discrete precipitation series
Where the collections of
Where
For the prediction target, the conditional distribution of target variable
Where
VAE-LSTM (Han et al., 2021): The VAE-LSTM model merges the generative capabilities of Variational Autoencoders (VAEs) with the sequential data proficiency of Long Short-Term Memory (LSTM) networks. VAEs encode data into a latent space, allowing for the generation of new, similar data through decoding, guided by a loss function that combines reconstruction accuracy and latent space regularization. LSTMs enhance this model by effectively capturing temporal dependencies in data, overcoming the limitations of traditional recurrent neural networks through their specialized architecture. This integration makes VAE-LSTM highly effective for tasks like time-series forecasting and natural language processing, providing a sophisticated approach for analyzing and generating sequential data. The VAE-LSTM framework stands out for its ability to handle complex sequences, offering advanced insights and predictions with improved accuracy.
3.6 Performance evaluation metrices
In the context of probabilistic prediction, key metrics such as Prediction Interval Coverage Probability (PICP) (Eq. 23), Prediction Interval Normalized Average Width (PINAW) (Eq. 24), Coverage Width-based Criterion (CWC) (Eq. 25), and Prediction Interval Normalized Root Mean Square Width (PINRW) (Eq. 26) play a pivotal role in assessing the quality and reliability of prediction intervals (PIs):
where N is the number of observations;
In sum, PICP measures the proportion of actual outcomes that fall within the predicted intervals, evaluating the interval’s coverage accuracy directly. PINAW evaluates the normalized average width of the prediction intervals, providing insight into the precision and usefulness of the intervals in practical applications. Meanwhile, PINRW offers a normalized measure of the root mean square width of the prediction intervals, serving as an indicator of the intervals’ consistency and reliability across different scales of data. In sum, both PINAW and PINRW provides assessment of the interval width in a normalized manner, ensuring that the intervals are neither too wide nor too narrow. Lastly, CWC combines both the coverage probability and the interval width into a single metric, offering a balanced evaluation of prediction interval quality. The metrics PICP, PINAW, CWC, and PINRW are pivotal in evaluating probabilistic prediction tasks, offering a comprehensive evaluation of both the accuracy and reliability of prediction intervals through measures of coverage, efficiency, and a balanced assessment of interval quality. The selection of these metrices also ensures that the prediction intervals are both accurate in coverage and optimally sized for decision-making purposes.
4 Experiments and analyses
4.1 Data collection
In order to authenticate the efficacy of the proposed VAE-GRU probabilistic deformation prediction framework, experimental verification is carried out utilizing the monitored deformation series collected from our case study area in Lebu Village, Bagu Township, Meigu County, Liangshan Prefecture, in Sichuan Province, China. A typical case study location with 5 GNSS (Global Navigation Satellite System) monitoring points is selected in this study as it is very close to the roads. Deformation data as well as precipitation are collected on daily basis between May 2010 and February 2023.
According to Figure 5, it presents the geographical layout of the GNSS monitoring array superimposed on the topography of the landslide-prone region. The monitoring system comprises five strategically positioned GNSS stations, labeled GNSS6-4 through GNSS6-8, delineating the boundaries of the observed landslide. The red outline encapsulates the unstable land mass, highlighting the area under scrutiny. The GNSS stations are distributed to cover the breadth of the landslide, offering a comprehensive network for real-time tracking of surface displacements. This configuration facilitates a multi-point data collection approach that ensures spatial variability within the landslide body is captured, thereby enhancing the predictive modeling of the landslide’s behavior. The surrounding terrain, visibly dissected by transportation routes and interspersed with vegetation, underscores the landslide’s potential impact on the infrastructure and local ecosystems. The scale provided in the upper right corner of the image asserts the spatial dimensions of the monitoring setup, essential for interpreting the GNSS data in the context of the site’s geospatial attributes.
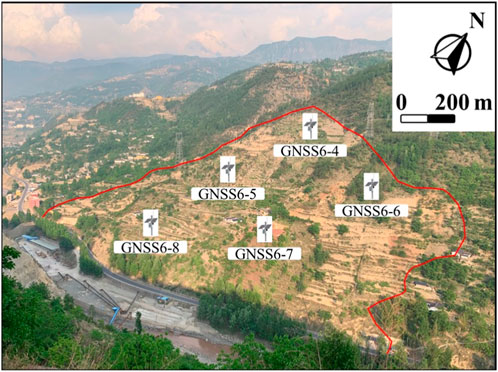
Figure 5. Configuration of GNSS monitoring stations over the case study location.
4.2 Training the framework
In the exploration of predictive accuracy for landslide deformation time-series, the Forward Chaining method, also known as Walk-Forward Validation, emerges as a pivotal strategy for temporal data analysis. This approach is particularly advantageous in scenarios where the objective is to forecast future events based on historical data, as it meticulously simulates a real-world operational environment for model training and evaluation. In the context of landslide deformation prediction, Forward Chaining begins by segmenting the time-series data into multiple sequential training-validation sets, ensuring that each set respects the chronological integrity of the data.
Initially, the dataset is divided into three distinct segments: a training/validation dataset (70%), and a testing dataset (30%). The training dataset comprises the earliest observations, serving as the foundation upon which the initial model is built. Subsequently, the validation dataset, which immediately follows the training dataset in time, is utilized to evaluate the model’s predictive performance and to fine-tune model parameters. This process iterates, with the training set expanding to include the data points immediately preceding the current validation set, thereby incorporating more recent observations into the model training process. The final model is then assessed on a separate testing dataset, which has been held back from the training and validation phases to serve as an unbiased benchmark for the model’s predictive capability on future, unseen data.
In the training procedures, selecting the appropriate regularization parameter significantly impacts the overall quality of the framework’s training. Table 2 provides a summary of the average loss values in relation to the selection of λ as defined in Eq. 16, which represents the regularization hyperparameter that balances the reconstruction loss and the prediction loss. The evaluation spans a range of regularization parameter values from 0.1 to 0.9. The loss function values, serving as indicators of the model’s predictive accuracy and generalization capability, are detailed for each combination of monitoring station and λ setting. According to Table 1, for all monitoring stations, it shows a decreasing trend in loss as λ increases from 0.1 to 0.7. With a slight increase observed at higher λ values (e.g., λ>0.7), suggesting a potential over-regularization effect. Overall, setting λ = 0.7 yields the lowest loss values for sequence data from all monitoring stations, hence optimizing the trade-off between model complexity and performance.
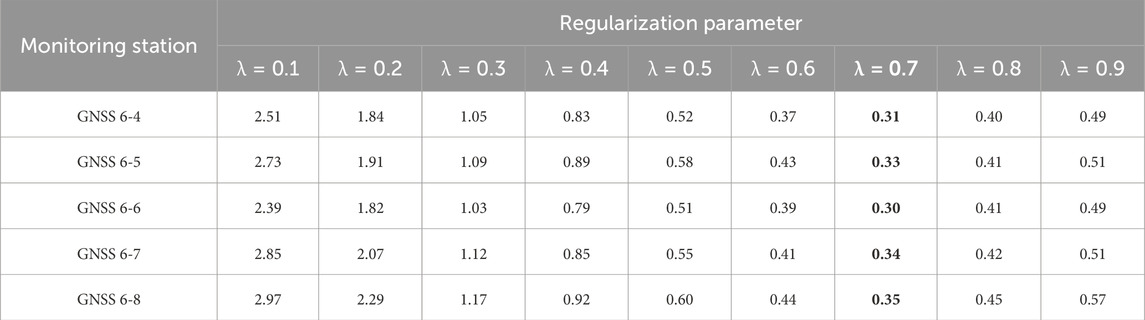
Table 2. Impact of regularization parameter on loss functions across all monitoring stations.
In Figure 6 below, it presents the training dynamics of the entire framework over 2000 epochs, as evidenced by the improved loss function (see Eq. 16) for both training and validation datasets. In each subplot, the black line represents the loss on the training set, while the red line indicates the loss on the test set. Initially, both training and test losses exhibit a sharp decline, suggesting rapid learning of the model. This steep descent in the early epochs indicates that the proposed framework is effectively minimizing the difference between the learned distribution and the target distribution. As the epochs progress, the rate of decline in loss tapers, entering a phase of more gradual reduction which points to the stabilization of the learning process.
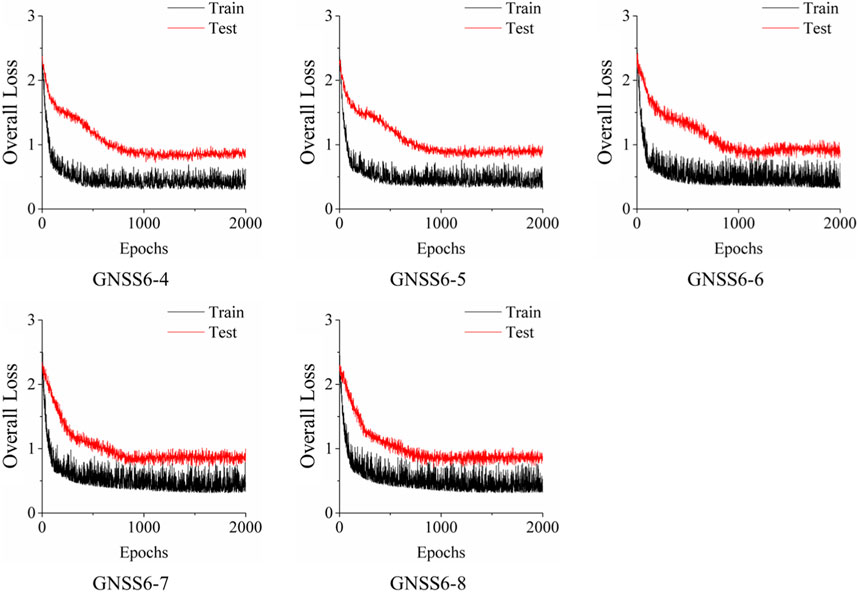
Figure 6. Training dynamics of the proposed framework for landslide deformation prediction.
In each subplot, the VAE-GRU’s training loss fluctuates more than the test loss, likely due to the training data’s varied nature. The test loss’s steadier decline suggests good model generalization to new data. Importantly, the close tracking of test loss to training loss without a notable divergence indicates an absence of overfitting, underscoring the model’s consistent and stable performance across both training and validation sets—a key feature for landslide deformation prediction tasks. This uniformity across plots demonstrates the VAE-GRU’s capacity to learn a generalizable model applicable to various data scenarios.
4.3 Model validation and optimal PI construction
Constructing the prediction interval with appropriate bandwidth is critical for the probabilistic prediction performance, as it strikes a balance between precision and reliability. Figure 7 below shows the concepts of constructing a prediction interval based on different percentiles from a predicted PDF. This graphical representation underscores the significance of selecting an appropriate prediction interval bandwidth to ensure reliable and accurate predictions. The shaded areas represent the bounds within which future observations are expected to fall, with varying degrees of confidence. A narrower interval, corresponding to a higher peak in the PDF, indicates greater confidence in a smaller range of outcomes, while a wider interval suggests less certainty and accommodates a broader range of possible observations.
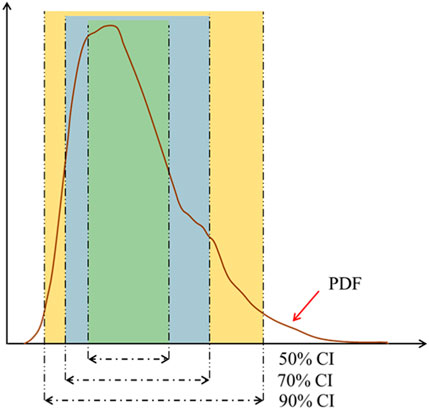
Figure 7. Selection of prediction interval bandwidth based on predictive distribution percentiles.
To obtain the optimal selection of prediction interval bandwidth, numerical experiments are conducted for evaluation. Table 3 succinctly summarizes the optimization of bandwidth selection using the criterion of PINAW. The PINAW metric provides a quantitative measure to determine the most suitable bandwidth that balances the precision and the reliability of the prediction intervals. In the context of the GNSS monitoring stations evaluated, the table lists the PINAW values for various confidence intervals (CI), specifically 50%, 70%, and 90%. The lower the PINAW value, the more optimal the bandwidth selection for that particular confidence interval.
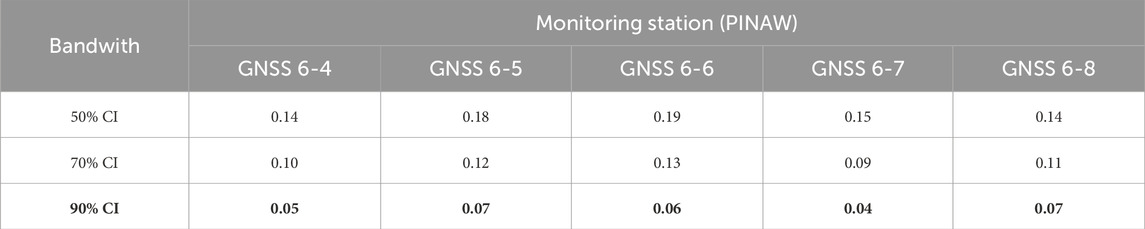
Table 3. Determination of optimal bandwidth via PINAW for all monitoring stations.
The data presented in Table 3 elucidates the inverse relationship between the PINAW and the corresponding confidence interval. As the confidence level escalates, the PINAW concomitantly diminishes, indicating a more concise and precise prediction interval. This correlation underscores the criticality of optimal bandwidth selection, which is contingent on balancing the precision of the interval against the confidence level. Smaller PINAWs are deemed superior for applications necessitating high precision. The 90% confidence interval, which registers the smallest PINAW, is thus identified as the optimal solution for the construction of bandwidth. This methodical strategy for selecting bandwidth is imperative for augmenting the robustness and precision of predictive models utilized in GNSS monitoring data analysis. A summary of the validation performance using the constructed PI has been presented in Table 4 respectively. The parameter setting of the proposed VAE-GRU and other SOTA methods has been presented in Table A1 in the Appendix A Section.

Table 4. Validation performance summary of the proposed VAE-GRU method.
4.4 Deformation prediction performance analysis
Using the 90% confidence interval, we computed PICP (see Table 5), PINAW (see Table 6), CWC (see Table 7) and PINRW (see Table 8) as prediction performance measurement metrices for performance evaluation. Also, we computed these metrices for the SOTA methods including ELM-LUBE, CKDE-NRC, and VAE-LSTM for comparative analysis. In addition, Table 9 presents the statistical tests results demonstrating the significance of the computational results.
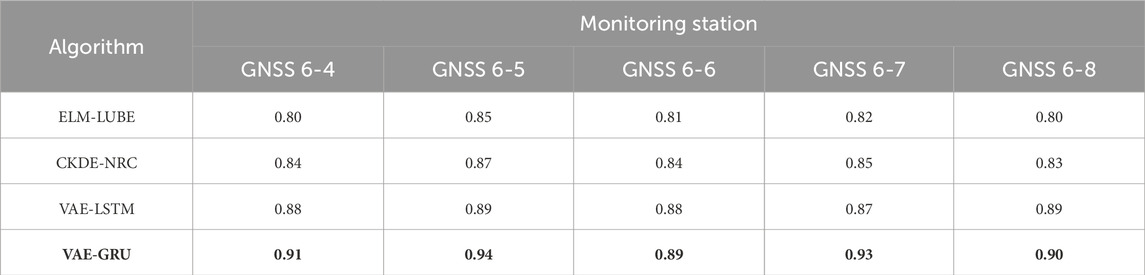
Table 5. Performance comparison of all tested algorithms on PICP.
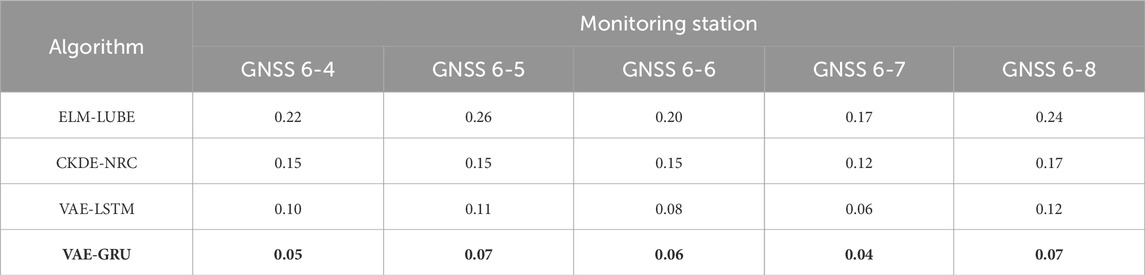
Table 6. Performance comparison of all tested algorithms on PINAW.
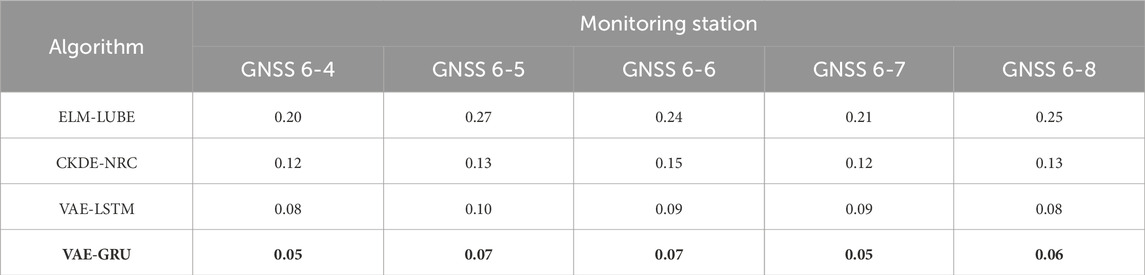
Table 7. Performance comparison of all tested algorithms on CWC.
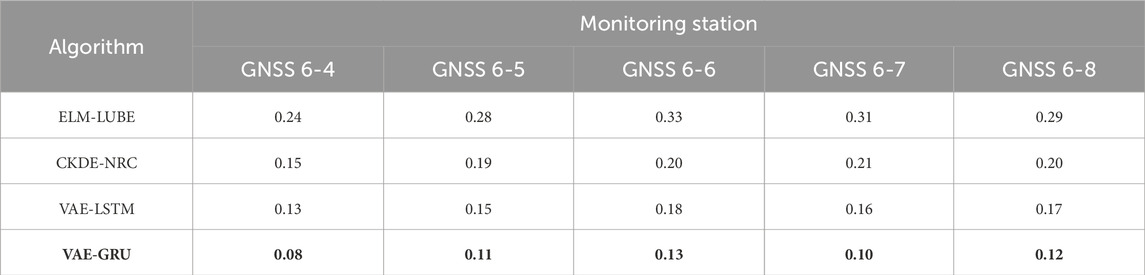
Table 8. Performance comparison of all tested algorithms on PINRW.
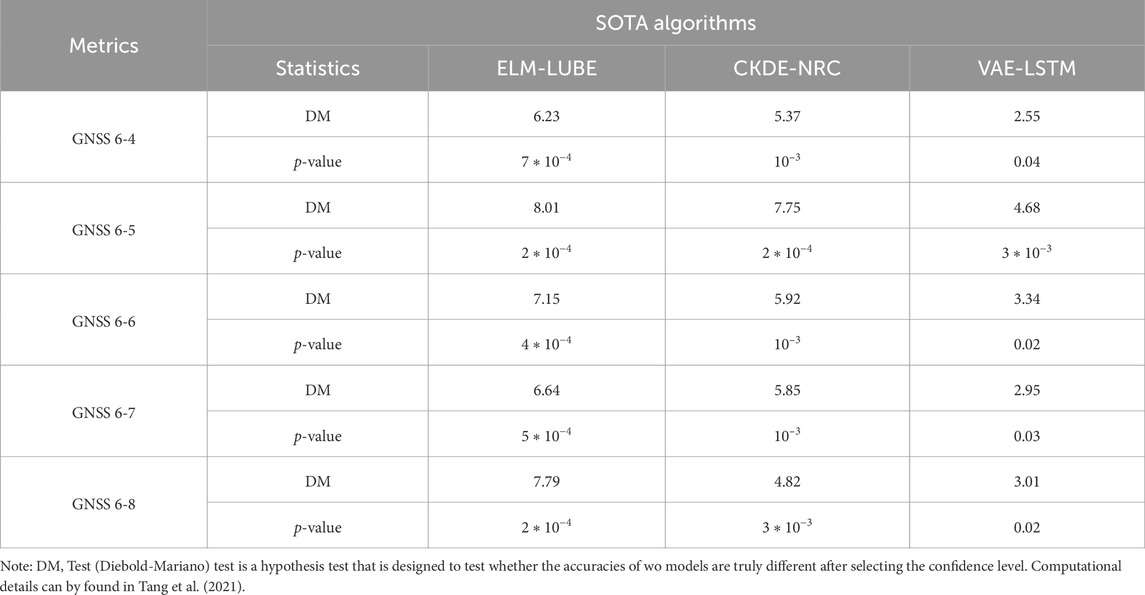
Table 9. DM Test results of VAE-GRU compared with SOTA algorithms.
Table 5 presents the PICP for all tested algorithms applied to time-series landslide deformation data from GNSS monitoring stations. Notably, the proposed VAE-GRU algorithm demonstrated the highest PICP across all stations, indicating superior performance in capturing the uncertainty of landslide deformation predictions. Table 6 summarizes the PINAW for several algorithms analyzing time-series landslide deformation data from GNSS monitoring stations. The VAE-GRU algorithm achieved the lowest PINAW values across all stations, signifying its efficiency in generating narrower, yet accurate, prediction intervals, which is crucial for precise uncertainty quantification in landslide deformation predictions. Moreover, Table 7 provides a comparison of the CWC for different algorithms applied to time-series landslide deformation data across various GNSS monitoring stations. The VAE-GRU algorithm exhibits the lowest CWC values across the board, highlighting its effectiveness in balancing interval width and coverage probability, thus offering the most efficient probabilistic predictions for landslide deformations. In addition, Table 8 illustrates the PINRW for various algorithms on time-series landslide deformation data from GNSS monitoring stations, with the VAE-GRU algorithm showing the lowest PINRW values, indicating its superior performance in generating precise and narrow prediction intervals. Table 9 presents the DM test results of the proposed VAE-GRU compared with the SOTA algorithms tested. According to the DM test statistic and p-value, it can be inferred that for the 5 GNSS monitoring stations’ dataset, the proposed VAE-GRU significantly outperforms the other SOTA models. Overall, computational results demonstrated the superior prediction performance of the proposed VAE-GRU framework with respect to all metrices. The probabilistically forecasted instant landslide deformation series produced by VAE-GRU framework are converted into cumulative series and illustrated in Figure 8 below.
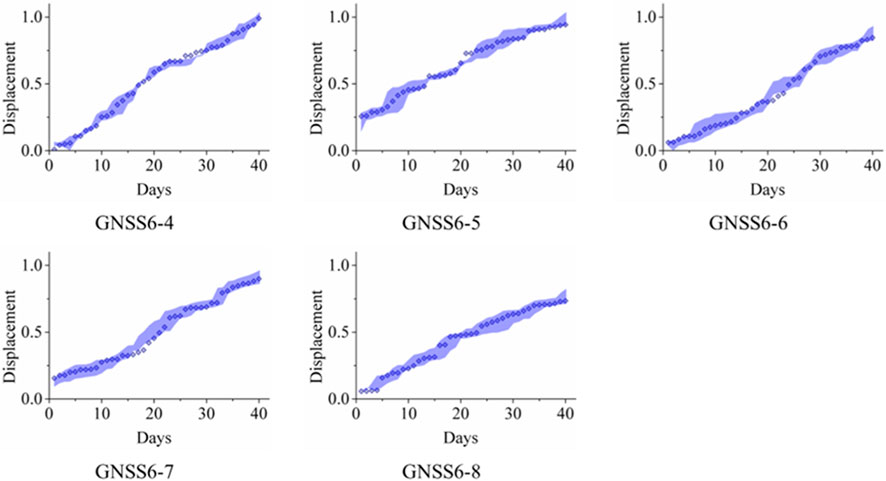
Figure 8. Probabilistic forecasting of cumulative landslide deformation with prediction intervals over a 40-day period.
Figure 8 above presents the probabilistic predictions of instantaneous landslide deformation over a period of 40 days, subsequently transformed into cumulative deformation series with accompanying prediction intervals. The shaded areas represent the prediction intervals, which encapsulate the range of expected deformations, while the discrete dots plot the actual measured cumulative deformation data. The close alignment between the predicted intervals and the empirical data points suggests that the probabilistic model is reasonably well-calibrated and captures the underlying trend of the landslide deformation with a degree of uncertainty.
4.5 Deformation prediction on different horizons
To evaluate the resilience and predictive accuracy of the proposed VAE-GRU framework for forthcoming landslide deformations, experiments were undertaken across various prediction horizons from t+1 to t+6. A comparative analysis was executed juxtaposing this model with SOTA algorithms, with the synthesized outcomes presented in Figure 9.
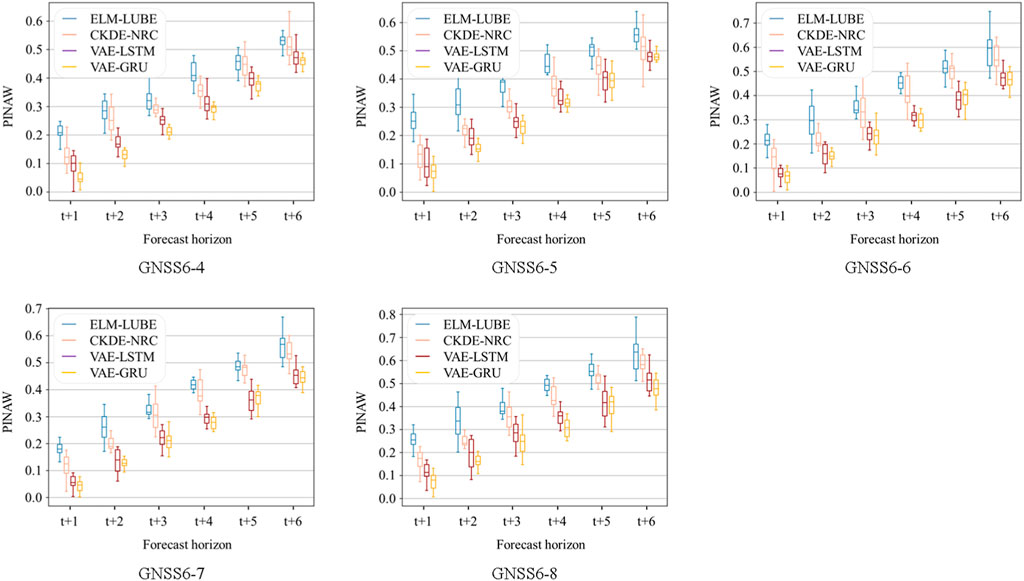
Figure 9. Comparative analysis of algorithmic performance on probabilistic landslide deformation forecasting across various prediction horizons.
Figure 9 above delineates the performance of various algorithms in predicting landslide deformation across different forecast horizons, ranging from t+1 to t+6, as measured by the PINAW. Across all GNSS stations (GNSS 6-4 to 6–8), the VAE-GRU algorithm consistently outperforms the others. It demonstrates the narrowest prediction intervals at each forecast horizon and thus indicates its precise predictive capability. Comparatively, the ELM-LUBE algorithm exhibits the widest prediction intervals which suggests a less precise forecasting ability. The performance of CKDE-NRC and VAE-LSTM reveal moderate variability in their prediction intervals. Overall, it highlights the clear superiority of VAE-GRU in probabilistic forecasting of landslide deformation compared with other SOTA algorithms.
4.6 Comparison with recent probabilistic prediction algorithms
To further demonstrate the efficacy and resilience of the proposed VAE-GRU framework in predicting imminent landslide deformations, comparative analyses were conducted against the recent published algorithms dedicated to probabilistic forecasting of landslide displacements. The outcomes of these computational evaluations are succinctly aggregated and delineated in Table 10, as displayed below.
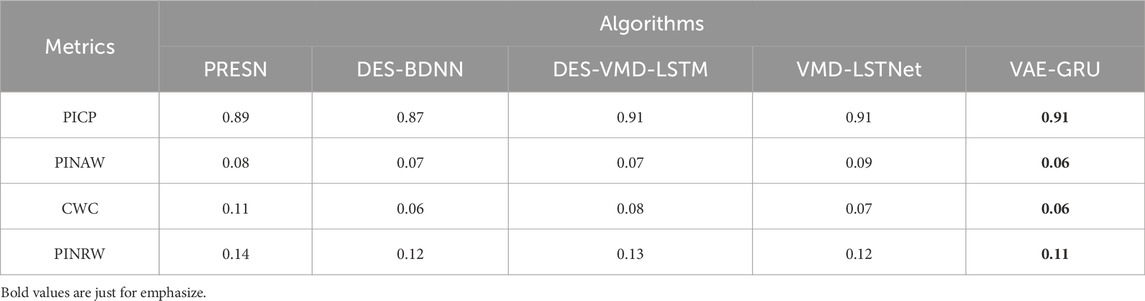
Table 10. Performance comparison of VAE-GRU against recent published probabilistic prediction methods.
In the comparative evaluation of probabilistic landslide deformation prediction models, the VAE-GRU framework demonstrated notable robustness. According to Table 10, the VAE-GRU model matched the best PICP and surpassed other models with the lowest PINAW. It also showed competitive performance in the CWC and PINRW, underscoring its effectiveness in forecasting landslide deformations with high accuracy and reliability.
4.7 Discussion
The proposed VAE-GRU model offered a novel architecture for probabilistic forecasting of landslide deformations. It showcases significant strengths such as its capacity to encapsulate temporal correlations within historical landslide data efficiently. This proficiency enables the model to predict imminent deformations with precision, leveraging a generative perspective for robust performance across various prediction horizons.
Nonetheless, it is highly dependent on high-quality dataset for effective training and the potential for increased computational complexity due to its sophisticated deep learning structure may pose limitations. These factors necessitate careful consideration in operational settings where rapid predictions are crucial and where data availability and computational resources may be constrained.
5 Conclusion
This study proposed a novel framework using Variational Autoencoder with Gated Recurrent Unit (VAE-GRU) for the probabilistic prediction of precipitation-induced landslide deformation. The proposed framework included two components, training a VAE-GRU model to obtain the latent representation of historical precipitation data and generating the probabilistic distribution of imminent landslide deformations. A case study is performed over a shallow landslide using field-investigation collected data from Lebu Village, Bagu Township, Meigu County, Liangshan Prefecture, in Sichuan Province, China. Field investigated data collected from multiple GNSS monitoring stations are utilized in this research to design the numerical experiments. Through meticulous experimentation and comparative analysis, the research demonstrates the VAE-GRU framework’s adeptness at forecasting, with a particular focus on its robust performance across various prediction horizons. It reveals the VAE-GRU’s superior ability to generate narrow prediction intervals and maintain high coverage probabilities, marking a substantial improvement over state-of-the-art methodologies in probabilistic landslide forecasting.
In conclusion, the proposed framework introduced in this study marks a significant advancement in the probabilistic prediction of landslide deformations, particularly in regions susceptible to precipitation-induced landslides. Our findings underscore the framework’s robustness across different prediction horizons, outperforming state-of-the-art algorithms with consistently narrower prediction intervals and higher prediction interval coverage probabilities. The VAE-GRU model’s superior performance reaffirms the potential of deep learning techniques in enhancing probabilistic landslide forecasting models, providing a valuable tool for geotechnical monitoring and disaster risk management. Furthermore, this study’s comparative analysis reveals critical insights into the operational strengths of various predictive algorithms, highlighting the importance of incorporating generative models for a more nuanced and dynamic understanding of landslide behavior.
Future research will be aimed to focus on expanding the adaptability and accuracy of our predictive models to encompass a wider array of geotechnical phenomena, enhancing their utility for more comprehensive risk assessment and mitigation strategies. Additionally, efforts will be directed towards the integration of these models into advanced early warning systems. Hence, it will enable to offer more effective means of protecting vulnerable communities and infrastructures against the imminent threat of landslides and related geological hazards.
Data availability statement
The original contributions presented in the study are included in the article/Supplementary Material, further inquiries can be directed to the corresponding author.
Author contributions
WC: Writing–original draft, Investigation. FL: Writing–original draft, Methodology. XH: Methodology, Writing–original draft. JH: Data curation, Writing–review and editing. WX: Conceptualization, Writing–review and editing. RT: Project administration, Writing–original draft. PF: Supervision, Visualization, Writing–review and editing. HL: Funding acquisition, Project administration, Writing–review and editing.
Funding
The author(s) declare that financial support was received for the research, authorship, and/or publication of this article. This research is supported by the Sichuan Transportation technology project (Grant: No. 2021-ZL-15), Natural Science Foundation of Sichuan Province, China (Grant: No. 2023NSFSC0789) and Opening Fund of Key Laboratory of Landslide Risk Early-warning and Control, Ministry of Emergency Management, Chengdu University of Technology, (Grant No. KLLREC 2022K003).
Conflict of interest
Authors WC and FL were employed by Sichuan Lexi Expressway Co., Ltd. Authors XH, JH, and WX were employed by Sichuan Intelligent Expressway Technology Co., Ltd.
The remaining authors declare that the research was conducted in the absence of any commercial or financial relationships that could be construed as a potential conflict of interest.
Publisher’s note
All claims expressed in this article are solely those of the authors and do not necessarily represent those of their affiliated organizations, or those of the publisher, the editors and the reviewers. Any product that may be evaluated in this article, or claim that may be made by its manufacturer, is not guaranteed or endorsed by the publisher.
References
Azarafza, M., Azarafza, M., Akgün, H., Atkinson, P. M., and Derakhshani, R. (2021). Deep learning-based landslide susceptibility mapping. Sci. Rep. 11 (1), 24112. doi:10.1038/s41598-021-03585-1
Bai, D., Lu, G., Zhu, Z., Zhu, X., Tao, C., Fang, J., et al. (2022). Prediction interval estimation of landslide displacement using bootstrap, variational mode decomposition, and long and short-term time-series network. Remote Sens. 14, 5808. doi:10.3390/rs14225808
Cemiloglu, A., Zhu, L., Mohammednour, A. B., Azarafza, M., and Nanehkaran, Y. A. (2023). Landslide susceptibility assessment for Maragheh County, Iran, using the logistic regression algorithm. Land 12 (7), 1397. doi:10.3390/land12071397
Chen, X., Liu, M., and Li, S. (2023). Echo state network with probabilistic regularization for time series prediction. IEEE/CAA J. Automatica Sinica 10 (8), 1743–1753. doi:10.1109/jas.2023.123489
Feng, P., Liu, B., Tang, R., Wei, M. D., Zhang, Y., and Li, H. J. (2022b). Dynamic fracture behaviors and fragment characteristics of pre-compressed flawed sandstones. Int. J. Mech. Sci. 220 (5), 107162. doi:10.1016/j.ijmecsci.2022.107162
Feng, P., Xu, Y., and Dai, F. (2021). Effects of dynamic strain rate on the energy dissipation and fragment characteristics of cross-fissured rocks. Int. J. Rock Mech. Min. Sci. 138, 104600. doi:10.1016/j.ijrmms.2020.104600
Feng, P., Zhao, J. C., Dai, F., Wei, M. D., and Liu, B. (2022a). Mechanical behaviors of conjugate-flawed rocks subjected to coupled static–dynamic compression. Acta Geotech. 17, 176s5–1784. doi:10.1007/s11440-021-01322-6
Gong, W., Tian, S., Wang, L., Li, Z., Tang, H., Li, T., et al. (2022). Interval prediction of landslide displacement with dual-output least squares support vector machine and particle swarm optimization algorithms. Acta Geotech. 17, 4013–4031. doi:10.1007/s11440-022-01455-2
Han, P., Ellefsen, A. L., Li, G., Holmeset, F. T., and Zhang, H. (2021). Fault detection with LSTM-based variational autoencoder for maritime components. IEEE Sensors J. 21 (19), 21903–21912. doi:10.1109/jsen.2021.3105226
Huang, W., Lv, Y., Pierce, I. K., Su, S., and Peng, J. (2022). Cosmogenic age constraints on rock avalanches in the Qinling Range associated with paleoearthquake activity, central China. Geomorphology 413, 108347–108352. doi:10.1016/j.geomorph.2022.108347
Jiang, H., Li, Y., Zhou, C., Hong, H., Glade, T., and Yin, K. (2020). Landslide displacement prediction combining LSTM and SVR algorithms: a case study of shengjibao landslide from the three Gorges reservoir area. Appl. Sci. 10 (21), 7830. doi:10.3390/app10217830
Jiang, P., and Chen, J. (2016). Displacement prediction of landslide based on generalized regression neural networks with K-fold cross-validation. Neurocomputing 198, 40–47. doi:10.1016/j.neucom.2015.08.118
Jiang, Y., Huang, G., Yang, Q., Yan, Z., and Zhang, C. (2019). A novel probabilistic wind speed prediction approach using real time refined variational model decomposition and conditional kernel density estimation. Energy Convers. Manag. 185, 758–773. doi:10.1016/j.enconman.2019.02.028
Jibson, R. W. (2007). Regression models for estimating coseismic landslide displacement. Eng. Geol. 91 (2-4), 209–218. doi:10.1016/j.enggeo.2007.01.013
Li, H. (2022a). SCADA data based wind power interval prediction using LUBE-based deep residual networks. Front. Energy Res. 10, 920837. doi:10.3389/fenrg.2022.920837
Li, H. (2022b). Short-term wind power prediction via spatial temporal analysis and deep residual networks. Front. Energy Res. 10, 920407. doi:10.3389/fenrg.2022.920407
Li, H., He, Y., Xu, Q., Deng, j., Li, W., and Wei, Y. (2022). Detection and segmentation of loess landslides via satellite images: a two-phase framework. Landslides 19, 673–686. doi:10.1007/s10346-021-01789-0
Li, H., He, Y., Xu, Q., Deng, J., Li, W., Wei, Y., et al. (2023). Sematic segmentation of loess landslides with STAPLE mask and fully connected conditional random field. Landslides 20, 367–380. doi:10.1007/s10346-022-01983-8
Li, H., Xu, Q., He, Y., Fan, X., and Li, S. (2020). Modeling and predicting reservoir landslide displacement with deep belief network and EWMA control charts: a case study in Three Gorges Reservoir. Landslides 17 (3), 693–707. doi:10.1007/s10346-019-01312-6
Lian, C., Zeng, Z., Wang, X., Yao, W., Su, Y., and Tang, H. (2020). Landslide displacement interval prediction using lower upper bound estimation method with pre-trained random vector functional link network initialization. Neural Netw. 130, 286–296. doi:10.1016/j.neunet.2020.07.020
Lin, Z., Sun, X., and Ji, Y. (2022). Landslide displacement prediction model using time series analysis method and modified LSTM model. Electronics 11 (10), 1519. doi:10.3390/electronics11101519
Long, H., Geng, R., and Zhang, C. (2022). Wind speed interval prediction based on the hybrid ensemble model with biased convex cost function. Front. Energy Res. 10, 954274. doi:10.3389/fenrg.2022.954274
Long, H., Zhang, C., Geng, R., Wu, Z., and Gu, W. (2021). A combination interval prediction model based on biased convex cost function and auto-encoder in solar power prediction. IEEE Trans. Sustain. Energy 12 (3), 1561–1570. doi:10.1109/tste.2021.3054125
Mao, Y., Li, Y., Teng, F., Sabonchi, A. K., Azarafza, M., and Zhang, M. (2024). Utilizing hybrid machine learning and soft computing techniques for landslide susceptibility mapping in a drainage basin. Water 16 (3), 380. doi:10.3390/w16030380
Nanehkaran, Y. A., Mao, Y., Azarafza, M., Kockar, M. K., and Zhu, H. H. (2021). Fuzzy-based multiple decision method for landslide susceptibility and hazard assessment: a case study of Tabriz, Iran. Geomechanics Eng. 24 (5), 407–418. doi:10.12989/gae.2021.24.5.407
Nava, L., Carraro, E., Reyes-Carmona, C., Puliero, S., Bhuyan, K., Rosi, A., et al. (2023). Landslide displacement forecasting using deep learning and monitoring data across selected sites. Landslides 20 (10), 2111–2129. doi:10.1007/s10346-023-02104-9
Nikoobakht, S., Azarafza, M., Akgün, H., and Derakhshani, R. (2022). Landslide susceptibility assessment by using convolutional neural network. Appl. Sci. 12 (12), 5992. doi:10.3390/app12125992
Niu, Z., Zhong, G., Yue, G., Wang, L. N., Yu, H., Ling, X., et al. (2023). Recurrent attention unit: a new gated recurrent unit for long-term memory of important parts in sequential data. Neurocomputing 517, 1–9. doi:10.1016/j.neucom.2022.10.050
Papadopoulos, D., and Karalis, V. D. (2023). Variational autoencoders for data augmentation in clinical studies. Appl. Sci. 13 (15), 8793. doi:10.3390/app13158793
Park, D., Hoshi, Y., and Kemp, C. C. (2018). A multimodal anomaly detector for robot-assisted feeding using an LSTM-based variational autoencoder. IEEE Robotics Automation Lett. 3 (3), 1544–1551. doi:10.1109/lra.2018.2801475
Pei, H., Meng, F., and Zhu, H. (2021). Landslide displacement prediction based on a novel hybrid model and convolutional neural network considering time-varying factors. Bull. Eng. Geol. Environ. 80 (10), 7403–7422. doi:10.1007/s10064-021-02424-x
Romeo, R. (2000). Seismically induced landslide displacements: a predictive model. Eng. Geol. 58 (3-4), 337–351. doi:10.1016/s0013-7952(00)00042-9
Wang, H., Long, G., Liao, J., Xu, Y., and Lv, Y. (2022). A new hybrid method for establishing point forecasting, interval forecasting, and probabilistic forecasting of landslide displacement. Nat. Hazards 111, 1479–1505. doi:10.1007/s11069-021-05104-x
Wang, H., Long, G., Shao, P., Lv, Y., Gan, F., and Liao, J. (2023a). A DES-BDNN based probabilistic forecasting approach for step-like landslide displacement. J. Clean. Prod. 394, 136281. doi:10.1016/j.jclepro.2023.136281
Wang, Y., Tang, H., Wen, T., and Ma, J. (2019). A hybrid intelligent approach for constructing landslide displacement prediction intervals. Appl. Soft Comput. 81, 105506. doi:10.1016/j.asoc.2019.105506
Wang, Z., Chen, Z., Yang, Y., Liu, C., Li, X. A., and Wu, J. (2023b). A hybrid autoformer framework for electricity demand forecasting. Energy Rep. 9, 3800–3812. doi:10.1016/j.egyr.2023.02.083
Wang, Z., Tang, J., Hou, S., Wang, Y., Zhang, A., Wang, J., et al. (2023c). Landslide displacement prediction from on-site deformation data based on time series ARIMA model. Front. Environ. Sci. 11, 1249743. doi:10.3389/fenvs.2023.1249743
Xu, C., Xu, X., Shen, L., Yao, Q., Tan, X., Kang, W., et al. (2016). Optimized volume models of earthquake-triggered landslides. Sci. Rep. 6 (1), 29797. doi:10.1038/srep29797
Yang, Y., Wang, Z., Gao, Y., Wu, J., Zhao, S., and Ding, Z. (2022). An effective dimensionality reduction approach for short-term load forecasting. Electr. Power Syst. Res. 210, 108150. doi:10.1016/j.epsr.2022.108150
Yang, Y., Wang, Z., Zhao, S., and Wu, J. (2023b). An integrated federated learning algorithm for short-term load forecasting. Electr. Power Syst. Res. 214, 108830. doi:10.1016/j.epsr.2022.108830
Yang, Y., Zhou, H., Wu, J., Ding, Z., Tian, Y. C., Yue, D., et al. (2023a). Robust adaptive rescaled lncosh neural network regression toward time-series forecasting. IEEE Trans. Syst. Man, Cybern. Syst. 53, 5658–5669. doi:10.1109/tsmc.2023.3272880
Zhang, N., Zhang, W., Liao, K., Zhu, H. H., Li, Q., and Wang, J. (2022). Deformation prediction of reservoir landslides based on a Bayesian optimized random forest-combined Kalman filter. Environ. Earth Sci. 81 (7), 197. doi:10.1007/s12665-022-10317-9
Zhang, Y., Wang, X., and Tang, H. (2019). An improved Elman neural network with piecewise weighted gradient for time series prediction. Neurocomputing 359, 199–208. doi:10.1016/j.neucom.2019.06.001
Zhou, L. S., Fu, Y. H., and Berto, F. (2022). Prediction of landslide displacement by the novel coupling method of HP filtering method and extreme gradient boosting. Strength Mater. 54 (5), 942–958. doi:10.1007/s11223-022-00470-8
Appendix A The hyperparameter settings for the SOTA algorithms and the proposed VAE-GRU
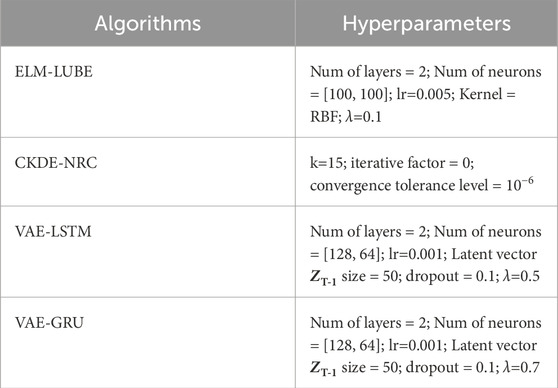
TABLE A1. Hyperparameter setting for the proposed VAE-GRU and the SOTA algortihms.
Keywords: landslide deformation, probabilistic prediction, gated recurrent unit, VAE-GRU, variational autoencoder
Citation: Cai W, Lan F, Huang X, Hao J, Xia W, Tang R, Feng P and Li H (2024) Generative probabilistic prediction of precipitation induced landslide deformation with variational autoencoder and gated recurrent unit. Front. Earth Sci. 12:1394129. doi: 10.3389/feart.2024.1394129
Received: 01 March 2024; Accepted: 03 April 2024;
Published: 24 April 2024.
Edited by:
Manoj Khandelwal, Federation University Australia, AustraliaReviewed by:
Jinran Wu, Australian Catholic University, AustraliaMohammad Azarafza, University of Tabriz, Iran
Copyright © 2024 Cai, Lan, Huang, Hao, Xia, Tang, Feng and Li. This is an open-access article distributed under the terms of the Creative Commons Attribution License (CC BY). The use, distribution or reproduction in other forums is permitted, provided the original author(s) and the copyright owner(s) are credited and that the original publication in this journal is cited, in accordance with accepted academic practice. No use, distribution or reproduction is permitted which does not comply with these terms.
*Correspondence: Peng Feng, ZmVuZ3BlbmdmeEAxNjMuY29t