 Pei-Ding Zhang1Yong-Jiang Wu2
 Zheng-Zheng Cao2,3,4*Zhen-Hua Li3,4,5Feng Du3,4,5Wen-Qiang Wang5Ming-Lei Zhai5
- 1Shanghai Datun Energy Resources Co., Ltd., Xuzhou, Jiangsu, China
- 2International Joint Research Laboratory of Henan Province for Underground Space Development and Disaster Prevention, School of Civil Engineering, Henan Polytechnic University, Jiaozuo, Henan, China
- 3Henan Mine Water Disaster Prevention and Control and Water Resources Utilization Engineering Technology Research Center, Henan Polytechnic University, Jiaozuo, Henan, China
- 4Collaborative Innovation Center of Coal Work Safety and Clean High Efficiency Utilization, Jiaozuo, Henan, China
- 5School of Energy Science and Engineering, Henan Polytechnic University, Jiaozuo, Henan, China
Deep faults significantly impact the structural stabilities and deformation behaviors of their overburden rocks, which are key factors in underground engineering and geological hazard research. Considering the problem of deep-fault-overburdened breaking during mining of super-thick coal seams and taking the Yaoqiao Coal Mine as the research object, the mining fracture evolution characteristics and overburden displacement law of the non-structured and fault-bearing overburden corresponding to fully mechanized caving mining are compared and analyzed using numerical simulations and physical similarity simulations. The results of this study show the following: 1) The fracture height of the overlying rock presents a specific change law with advancement of the working face; the initial rapid increase to a maximum height of 74 m is achieved when the working face advances to 90 m; with the development of the plastic zone indicating past yield, the fracture height decreases to 54 m and becomes stable, and the final caving angle of the fracture stabilizes at 70°. 2) In coal mining under normal fault conditions, when the working face advances from the upper to lower walls, the roof forms a masonry beam structure that slows down fault activation and crack development. When moving away from the fault, the overburden movements and water-conducting cracks are fewer, and the crack height is lower than that without faults. When approaching the fault, the influence of the faults in the fracture zone increases, and the height of fracture development reaches the maximum value after crossing the fault, highlighting the significant influence of the fault on fracture development. 3) Through a similarity simulation test, it is shown that the overburden caving zone is further compacted by the overburden rock and that the roof collapses in a large range, resulting in rapid upward development of the overburden rock cracks and separation of the central overburden rock cracks that are gradually compacted and closed. These findings are expected to have important theoretical and practical significance for deep underground engineering design, geological disaster prevention, and fault activity monitoring.
1 Introduction
With the exploitation of large quantities of coal resources, shallow coal resources seem to have been exhausted gradually, such that the current coal mining situation in China has shifted from shallow to deep mining (Wang et al., 2023a; Zheng et al., 2024a; Yongjiang et al., 2024). During actual coal mining, the balance of the space material environment of the underground system is destroyed, which may lead to various geological disasters (Wei et al., 2023; Zheng et al., 2024b; Pengshuai et al., 2024). The overall safety of coal mine production is also greatly threatened by water damage (Wang et al., 2023b; Wang et al., 2023c; Xue et al., 2024). In modern coal mine engineering, the stability of the working face is key to ensuring safe and efficient mining (Li et al., 2023; Zheng et al., 2023; Jun et al., 2024). The Yaoqiao Coal Mine is located in a complex geological environment, and its unique water-rich faults pose significant challenges to mine safety. In particular, under the influence of faults, the evolution law of the water-conducting fissures in the overlying rock of the working face has become an urgent problem to be solved.
Water conductivity is one of the most concerning features of overburden fractures. Zhang et al. (2022) considered the boundary faults of the mining area and concluded through comprehensive analyses that fault spacing and positive sectional pressure are the main factors affecting the sealing property. Wang and Wang (2021) studied crack development in the protected layer using field measurements, analyzed the crack evolution and permeability characteristics of the protected layer during mining, and concluded that the pressure relief amplitude and expansion rate of the protected layer would increase after mining. The height and shape of the water-conducting fracture zone, various factors affecting its development, and various models for predicting such factors have also been the focus of research for many scholars. Some scholars (Cai et al., 2024; Zheng et al., 2024c; Teng et al., 2024) have determined through research that the final shape of the water-conducting fissure belt is “saddle shaped.” Guobiao et al. (2021) used numerical simulation, theoretical analysis, and engineering analogy to study the water-guiding fracture zone of the rock overlying the working face of large mining height and proposed that the shape of the water-guiding fracture zone was of the “ladder” type, with the mining height and advancing speed being the main factors affecting the height of the water-guiding fracture zone. Shao and Yu (2018), Chen et al. (2021), and Zhang et al., 2013 established a prediction model for the height of the water-conduction fracture zone to provide a research reference for other water-conduction fracture zones under similar conditions. Compared to theoretical analyses and numerical simulations, actual measurements may be the most direct and accurate method of studying overburden fractures.
In recent years, scholars have mainly used theoretical analyses, numerical simulations, and similarity simulation tests to analyze the evolution law of mining overlay fractures and reported many phased achievements (Cheng et al., 2016; Kong et al., 2018; Zhang et al., 2020). Xingliang and Qingxiang (2022) studied the development characteristics of water-conducting fractures in underwater coal mining bodies by combining deformation analysis with numerical simulations; they reported that soft rock in the overlying rock layer with a certain thickness could inhibit the upward development of water-conducting fracture zones. Jialin and Minggao (2004) revealed the two-stage development law of mining fracture development in overburden rock and the distribution characteristics of the “O” ring. Zhiliang et al. (2017) discussed the roles of the key layers in the distribution of the fracture network and reported that open fractures and separation fractures will eventually penetrate each other in the mining process, forming an elliptical scattering zone distribution in the overlying rock. Zhao et al. (2021) established the relationship between the fractal dimension of the overburden fractures and energy dissipated using experimental and numerical simulations. Based on the complexity and disorder of the cracks, Heping et al. (1999) used geometric fractal theory to study mining-induced fractures in the overlying rocks, and their results show that mining-induced fractures have self-similarity and fractal characteristics. Zhang et al. (2001) used discrete element software and noted that the fractal dimension is an important parameter for describing the fractal law of mining-induced rock fracture network. Wang et al. (2012) studied the fracture evolution process of a mining-induced rock mass with initial fractures and found that the larger the initial damage, the larger are the fractal dimensions of the fracture distribution in the mining-induced rock mass. Zhao (2022) analyzed the influences of fault sizes, numbers, and different distributions on overburden fracture development using similarity simulations and rock failure process analysis (RFPA) numerical simulations; they found that the faults located near the incision holes had greater impacts on overburden fracture failures, and for larger faults, the water-conducting fracture zone extent is deeper along the fault face with the higher degree of development.
At present, many scholars have conducted studies on the overlying rock failure characteristics under the influence of the fault activation mechanism, which has very important significance for this study; however, there is a lack of research on the overlying rock failure characteristics and fracture-zone development characteristics under the influence of deep faults in the Yaoqiao Coal Mine. Therefore, based on the hydrogeological conditions of the Yaoqiao Coal Mine, the exploitation fissure evolution characteristics and overburden displacement laws of the non-tectonic overburden and fault-bearing overburden corresponding to fully mechanized caving mining are compared and analyzed through numerical simulation and physical similarity simulation. These research results are expected to have important theoretical and practical significance for deep underground engineering design, geological disaster prevention, and fault activity monitoring.
2 Project overview
The Yaoqiao Coal Mine is one of the large mines in the Datun Mining area that is located approximately 82 km northwest of Xuzhou City, Jiangsu Province, and approximately 17 km south of Peixian County. At present, the Yaoqiao Coal Mine is being mined at the deep working face of the XiVI mining area, and the 7,620 working face has already been mined. It is expected that the next step would involve mining the 7,618 working face, which is adjacent to the 7,620 working face in the north and 7,616 working face in the south; the position of the 7,618 working face is shown in Figure 1. The DF25 normal fault having a fault drop of 6 m is shown in Figure 1 for the positions of the working face, fault, and its column.
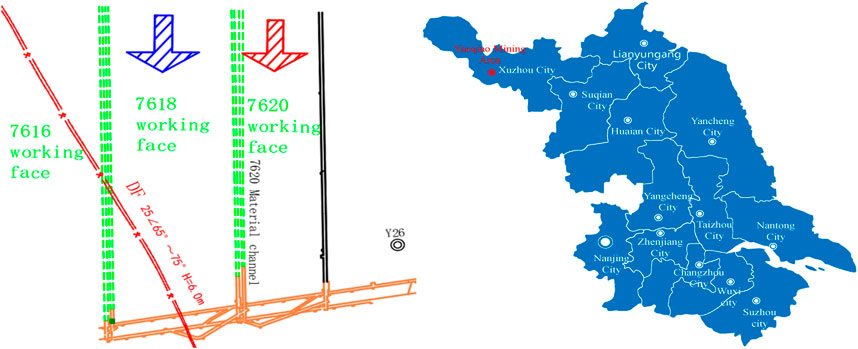
Figure 1. Schematic diagram showing the position of the working face.
3 Numerical simulation
3.1 Analysis of the mining fracture evolution law of unstructured overburden rock
3.1.1 Numerical model
The numerical model is based on the 7,618 working face of the west wing of the Yaoqiao Coal Mine. The geometric size of the model is 300 m × 100 m, thickness of the coal seam is 4.71 m, and mining depth is 650 m. Considering the boundary effects caused by mining, 50-m boundary protection coal pillars are set on both sides of the model, and 10 m is excavated each time for a total of 200 m of excavation. The overlying strata are placed at the top of the model with equivalent uniform loads. The vertical displacement constraint is applied to the bottom of the model, and the horizontal displacement constraint is applied to the left and right sides of the model. The numerical model is thus established according to the stress and structural characteristics of the overlying strata of the coal seam.
3.1.2 Development law of the overburden water channel in fully mechanized caving mining
Figure 2 shows the plastic zone diagram, mining-induced fracture development law diagram, and caving form diagram corresponding to fully mechanized caving mining. The mining-induced fracture development law diagram is considered in accordance with the principle that the rock mass opening is a medium opening between 1 and 5 mm; Table 1 and Figure 3 show the development law of the fracture zone height with advancement of the working face. To facilitate comparative analyses, the model selects the calculated results for every 40 m of advancement.
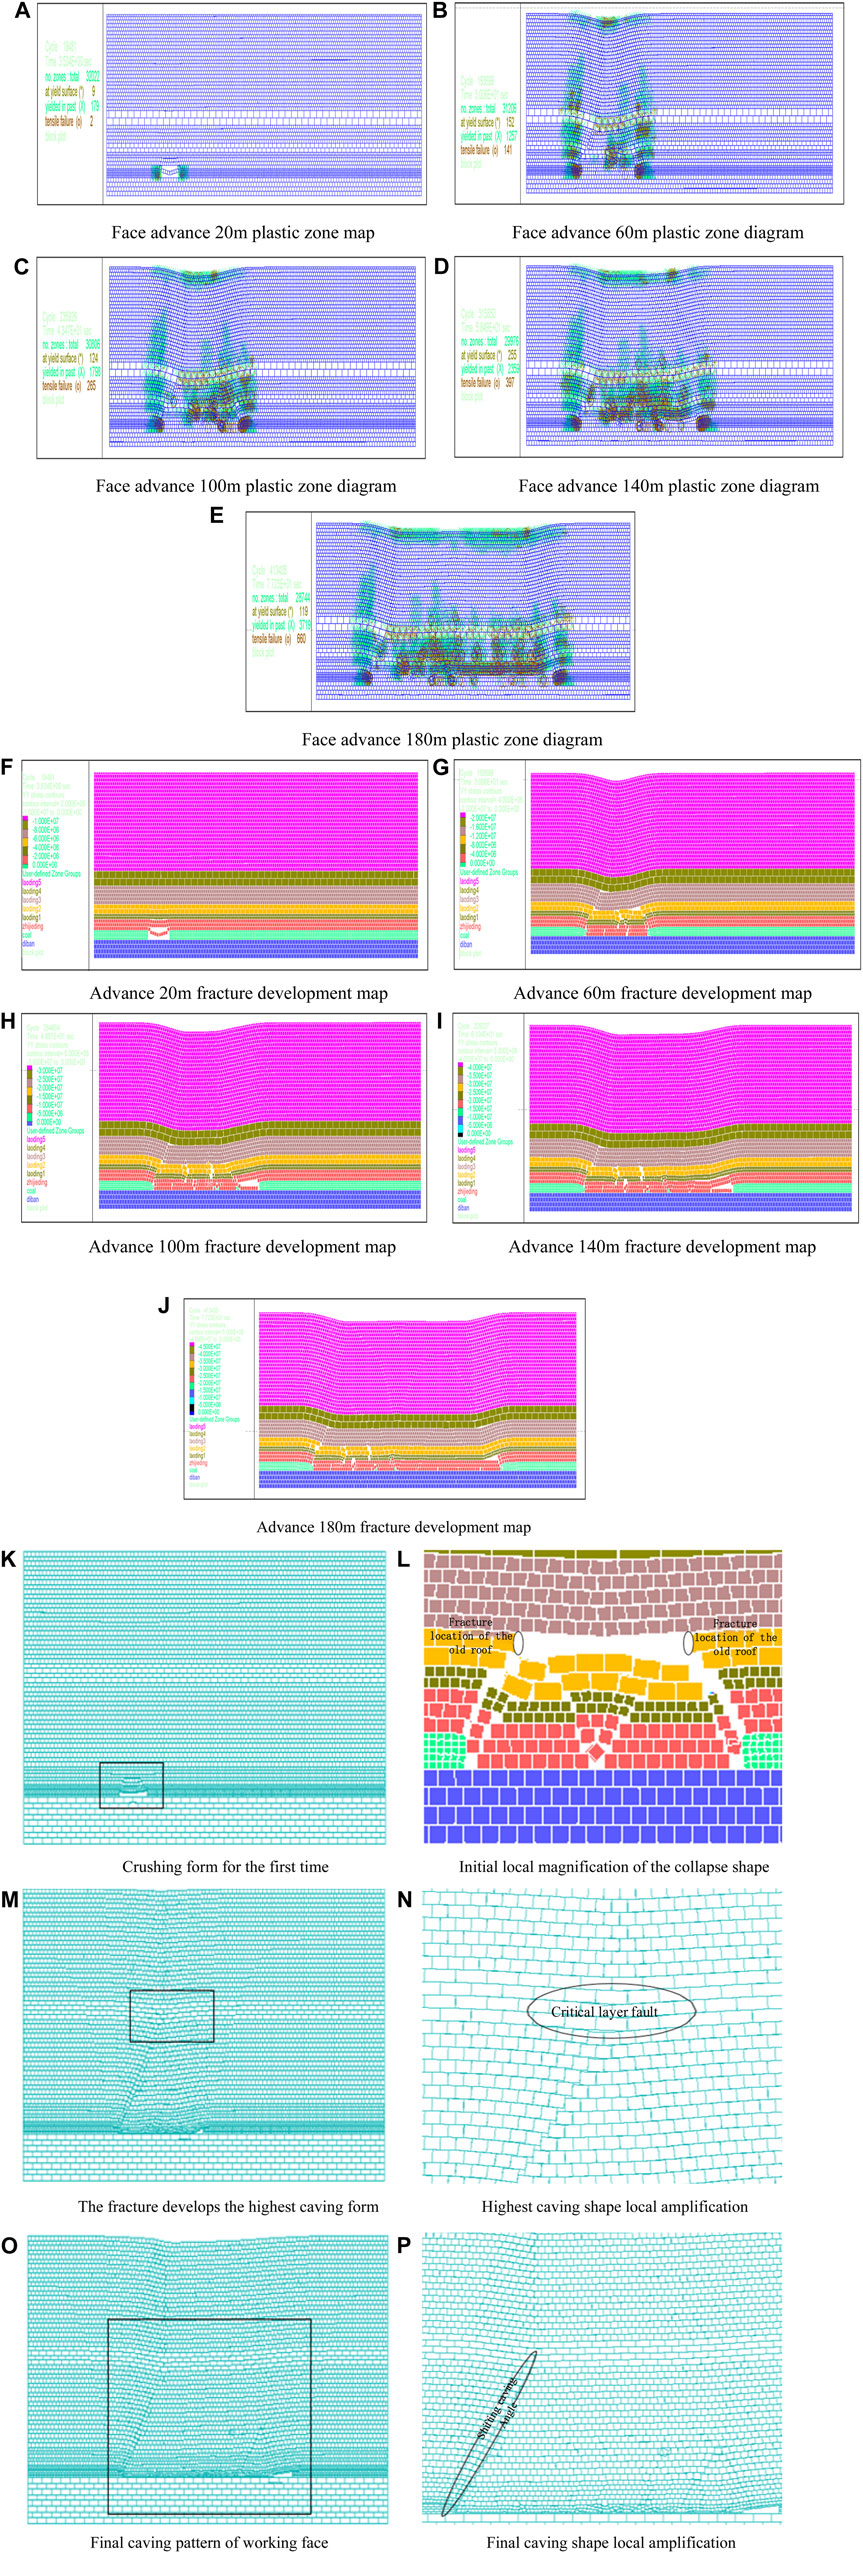
Figure 2. Plastic zone diagram, mining-induced fracture development law diagram, and caving form diagram corresponding to fully mechanized caving mining. (A) Face advance 20 m plastic zone map. (B) Face advance 60 m plastic zone diagram. (C) Face advance 100 m plastic zone diagram. (D) Face advance 140 m plastic zone diagram. (E) Face advance 180 m plastic zone diagram. (F) Advance 20 m fracture development map. (G) Advance 60 m fracture development map. (H) Advance 100 m fracture development map. (I) Advance 140 m fracture development map. (J) Advance 180 m fracture development map. (K) Crushing form for the first time. (L) Initial local magnification of the collapse shape. (M) The fracture develops the highest caving form. (N) Highest caving shape local amplification. (O) Final caving pattern of working face. (P) Final caving shape local amplification.
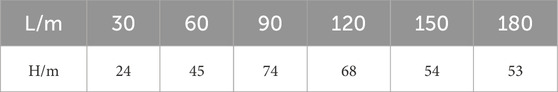
Table 1. Changes in the fracture development height with advancement of the working face.
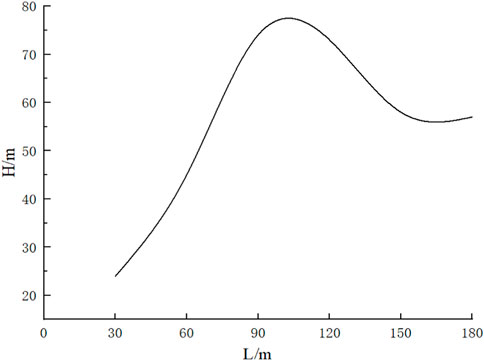
Figure 3. Variation in the fracture development height with advancement of the working face.
As seen from the plastic zone diagram in Figure 2, when the working face advances, the composite rock is in the past yield state in the plastic zone diagram, indicating that the fracture is healed gradually. From the fracture development diagram, it is seen that small cracks develop in the mudstone, but these have lost the ability to conduct water, and the height of the fracture zone decreases gradually to become stable at approximately 54 m. As seen from the fracture development diagram in Figure 2 and Table 1, with the advancement of the working face, the development height of the overlying rock fracture increases. When the working face advances by 30 m, the old roof fractures, and the overlying mudstone collapses. The initial pressing step of the working face is approximately 30 m. When the working face advances to approximately 90 m, the height of the fracture zone is highest at approximately 74 m. With continuous advancement of the working face, the caving angle of the rock stratum movement changes constantly and finally stabilizes at about 70°, and the caving angle at the cutting hole is more obvious than that at the stop-mining line. The cracks near the cutting eye and stop-mining line change minimally with the advancement of the working face and form permanent cracks with the largest final height value.
3.2 Analysis of the mining fracture evolution law of fault-bearing overburden
3.2.1 Numerical model
When mining coal under water, it is of great theoretical and practical significance to study the development law of water conduction under the influence of faults because the maximum height and failure characteristics of the mining fracture zone in the area with faults and other geological structures will change greatly compared with the area without geological structures, which often leads to water inrush or flooding accidents. Therefore, a numerical model of the fault-bearing overburden is established to analyze the evolution law of the water channel. To facilitate comparative analyses, the numerical model used is the prototype of the 7,618 working face as mentioned above, and the model size, loading mode, constraint conditions, and rock physical and mechanical parameters remain unchanged. The physical and mechanical parameters of the fractured rock mass in the fault zone are as shown in Table 2.

Table 2. Physical and mechanical parameters of the fractured rock mass.
3.2.2 Developmental regularity of the mining water channel in fault-bearing overburden rock
Figure 4 shows the caving plastic zone and fracture development diagrams of the mining overburden fracture process under fully mechanized caving with fault overburden. Table 3 and Figure 5 show the development law of the fracture zone height with advancement of the working face, and Figure 6 shows the fracture zone development morphology diagram under the influence of faults. To facilitate comparative analyses, the model selects the calculated results for every 30 m of advancement.
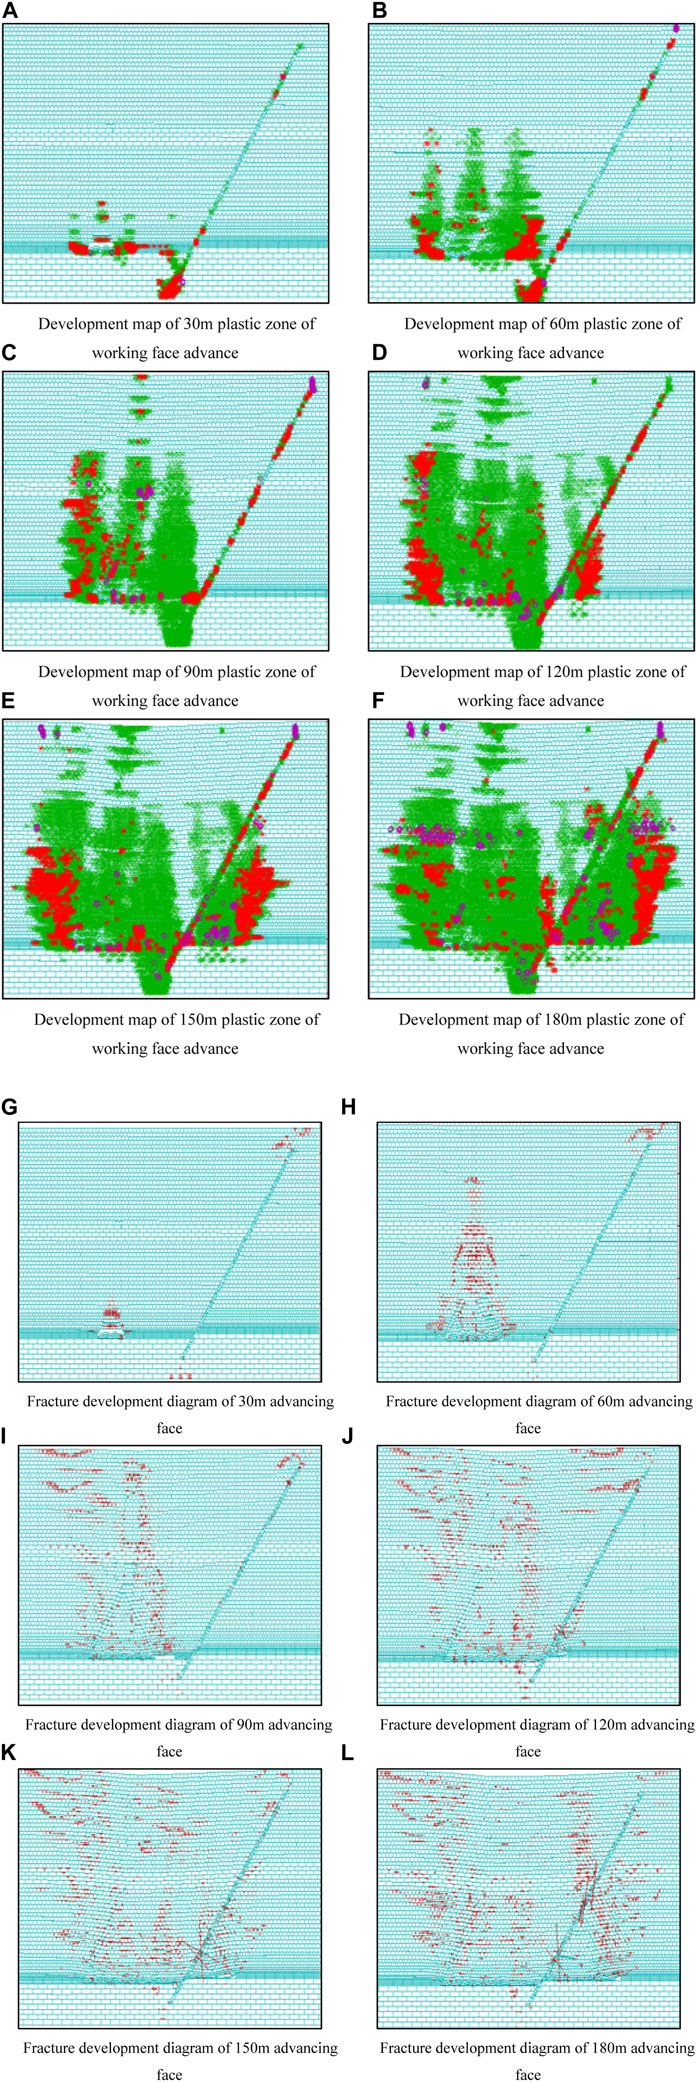
Figure 4. Plastic zone and fracture development diagram. (A) Development map of 30 m plastic zone of working face advance. (B) Development map of 60 m plastic zone of working face advance. (C) Development map of 90 m plastic zone of working face advance. (D) Development map of 120 m plastic zone of working face advance. (E) Development map of 150 m plastic zone of working face advance. (F) Development map of 180 m plastic zone of working face advance. (G) Fracture development diagram of 30 m advancing face. (H) Fracture development diagram of 60 m advancing face. (I) Fracture development diagram of 90 m advancing face. (J) Fracture development diagram of 120 m advancing face. (K) Fracture development diagram of 150 m advancing face. (L) Fracture development diagram of 180 m advancing face.
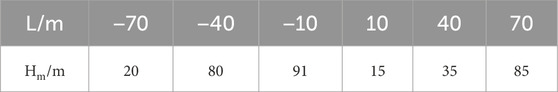
Table 3. Variation in the height of fissure development for different relative distances from the fault.
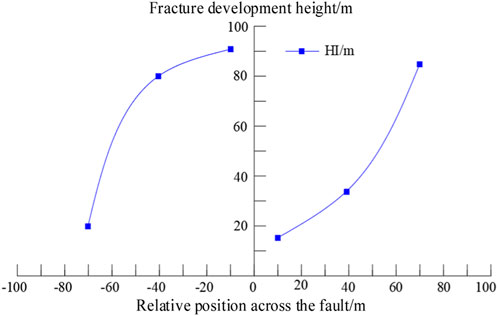
Figure 5. Variation in the fracture development height for different relative positions away from the fault.
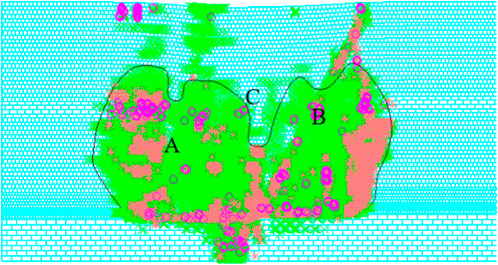
Figure 6. Developmental morphology of the fracture zone under the influence of faults.
Here, L is the relative position from the fault, the negative sign indicates that the working face is located in the upper wall of the fault, and the positive sign indicates that the working face is located in the lower wall of the fault; HⅢ is the height of fracture development.
(1) When the working face advances from the upper to lower walls of the normal fault, the roof is easily formed by a balanced structure of masonry beams, and the fault is not easily activated. When the distance from the fault is greater, the overburden movement is slower than that when mining without faults, the development of water-conducting cracks is smaller, and the development height of the cracks is slightly lower than that when mining without faults.
(2) As the working face advances to the vicinity of the fault plane, the fault begins impacting the development of the fracture zone, and the working face has the greatest impact on the height of fracture development when it pushes past the fault for a certain distance.
(3) From the distribution of the plastic zone in Table 3, it is seen that when a large-dip normal fault enters the fault from the upper wall, it greatly influences the development height of the mining-induced fissure, which may be up to 91 m.
(4) Owing to the role of the faults, the mining fracture has a “double-saddle shape” development pattern, whose boundary region C is near the fault and the peak value of zone B is near the fault under the condition of large fault inclination.
(5) The highest position of fracture development is when the working face enters the footer and is farther away from the fault. At a distance of 70 m from the fault, the crack development is highest.
4 Study on similarity simulation of overburden failure characteristics in deep mining
Taking the 7,620 working face of the Yaoqiao Coal Mine as the prototype, a physical similarity simulation was established to study the deformation and failure characteristics of the overlying rock in the goaf and evolution of the water-conducting fracture zone.
4.1 Similarity simulation parameter determination
4.1.1 Similarity conditions
Based on the purpose of the similarity simulation, considering the operability and reliability of the test as well as the similarity criterion, the similarity simulation parameters are as follows:
1) Geometric similarity ratio
2) Poisson’s ratio similarity ratio
3) Density similarity ratio
4) Stiffness similarity ratio
5) Time similarity ratio
6) Stress similarity ratio
Because of the large depth of the coal seam, the model cannot be built directly up to the surface, so the stress similarity ratio is considered. According to the principle of similarity simulation, the pressure at the top of the model should be the weight of the rock layer that cannot be simulated. Then, as per the original model, this should be a loaded value:
where qp is the prototype that does not simulate rock pressure, kPa; H is the mining depth, m; H1 is the simulated height of the roof strata, m.
The value qm loaded on the model is given by
The thickness of the unsimulated overlying rock stratum is 700 m, and the average volume reweighting of the overlying rock stratum is 2560 kN/m3. From the above formula, it is noted that the load qm that should be applied to the model is 1,075.2 kPa and that this load is compensated by the pressurization of the hydraulic column on the test bench.
4.1.2 Calculation of the ratio of similar materials
Based on the actual coal seam condition of the working face, sand was used as the aggregate, calcium carbonate and gypsum were used as the cementing materials, and borax was used as the retarding agent. From calculations of the simulated strength values of similar materials and references to relevant literature, the reasonable ratio of each layer of similar material is obtained by repeated adjustments. According to the cross-sectional area, rock (coal) thickness, and geometric similarity ratio of the model frame, the volume of similar materials required can be calculated; then, the weights of similar materials in each of the rock (coal) layers can be calculated from the bulk density and ratio number of similar materials (considering the affluence coefficient of 1.2). The total weight of the materials in each layer can be calculated using the following formula:
where Mi is the total weight of the layered material, kg; L is the frame length, m; b is the frame width, m; Hi is the model layer thickness, m; and γi is the bulk weight of the material, kg/m3.
4.2 Model creation
4.2.1 Model design
According to the test conditions, evaluations were carried out on a test bench of 2500 mm × 1300 mm × 200 mm (length × height × width), where the design model height is 1300 mm, coal thickness is 56 mm, and floor thickness is 130 mm.
4.2.2 Model loading
First, according to the ratio number and rock layer distribution, the mixture is modulated layerwise. Then, the mold is loaded, ingredients are loaded in the mold, flat surface is spread to the corresponding height, and a mica sheet is spread on it so that the rock layer can be relatively distinct for the simulation; the above steps are then repeated until the simulated height. During molding, the thickness of the rock layer is generally 1.0–3.5 cm each time, and a layer that is too thick cannot be easily rammed, which results in the layer becoming dense and loose, with unevenly laid material. When the rock layer is less than 1.0 cm, rock formation difficulties are caused. Before loading the model, the total volume and total mass of each layer must be calculated according to the ratio number of strength, and the filling must be applied within 5–10 min after mixing evenly to prevent the gypsum from solidifying before loading and affecting the properties of similar materials. Finally the mold is removed one week after production completion; if the template is difficult to remove, it is properly relaxed and maintained at an appropriate distance from the coal rock until dry. The physical model of the loading is shown in Figure 7.
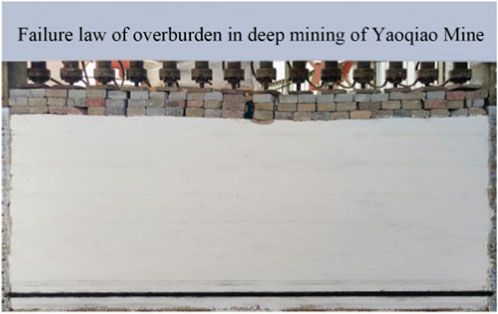
Figure 7. Physical model.
4.3 Excavation and survey-line layout of the model
4.3.1 Model excavation scheme
To fully study the overburden fracture migration characteristics and development height of the water-conducting fracture zone during the excavation of the Yaoqiao 7# coal seam, a model is established for excavation along the coal seam, which is equivalent to advancing the simulated working face. The model is excavated stepwise, with a 30-cm protective coal pillar left on both sides and 190 cm of total excavation that is equivalent to advancing the working face by 190 m.
4.3.2 Line arrangement
To observe the changes in the overlying rock displacement during advancement of the working face, five survey lines were laid in the rock layer along the coal seam roof from bottom to top. Survey line 5 is 40 cm away from the coal-seam roof, survey line 4 is 60 cm away from the coal-seam roof, survey line 3 is 80 cm away from the coal-seam roof, survey line 2 is 100 cm away from the coal-seam roof, and survey line 1 is 120 cm away from the coal-seam roof. Each survey line is arranged along the mining direction of the coal seam with 13 measurement points, and the spacing between adjacent measurement points is 20 cm. A total of 65 displacement measurement points are thus arranged in the entire model. The arrangement of the displacement measurement points and working faces is shown in Figure 8.
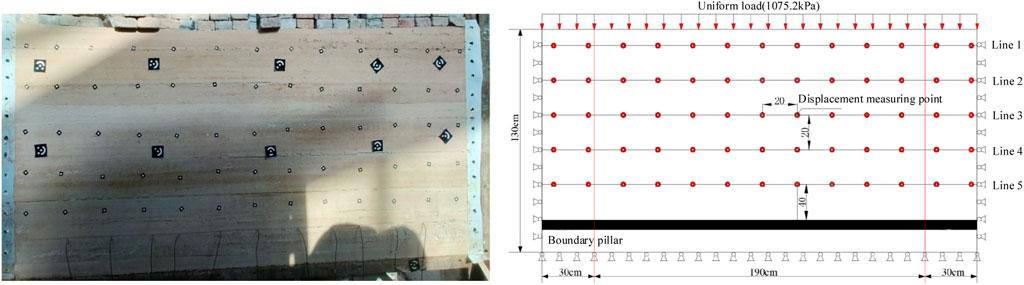
Figure 8. Layouts of the model survey lines and displacement measurement points.
During the process from opening the hole to mining 190 cm, the model was excavated in steps of 4 cm each time, which is equal to advancing the working face by 4 m; the total excavation of 190 cm was mined directly in a single attempt, which is equal to 190 m along the actual working face. During excavation, the fracture characteristics and fracture development of the overlying rock were observed and recorded. At the same time, a digital camera was used to monitor the movements of the overlying strata. Then, the digital images were processed via computer image processing technology to analyze the changes to the overlying rock displacements with the mining face. A final measurement was obtained after the strata movement stabilized at the end of the simulated mining.
4.4 Overburden fracture characteristics and evolution law of the water-conducting fracture zone
When the working face advances from the cutting hole to 20 m, the overburden fracture characteristics are as shown in Figure 9A. Owing to the influence of mining, the immediate top starts to develop separation fractures. When the working face advances to 25 m (see Figure 9B), the as separation fractures of the direct roof become more obvious, and the initial overall collapse of the direct roof occurs along the coal wall, and the fractures do not appear obviously in the overburden of the direct roof.
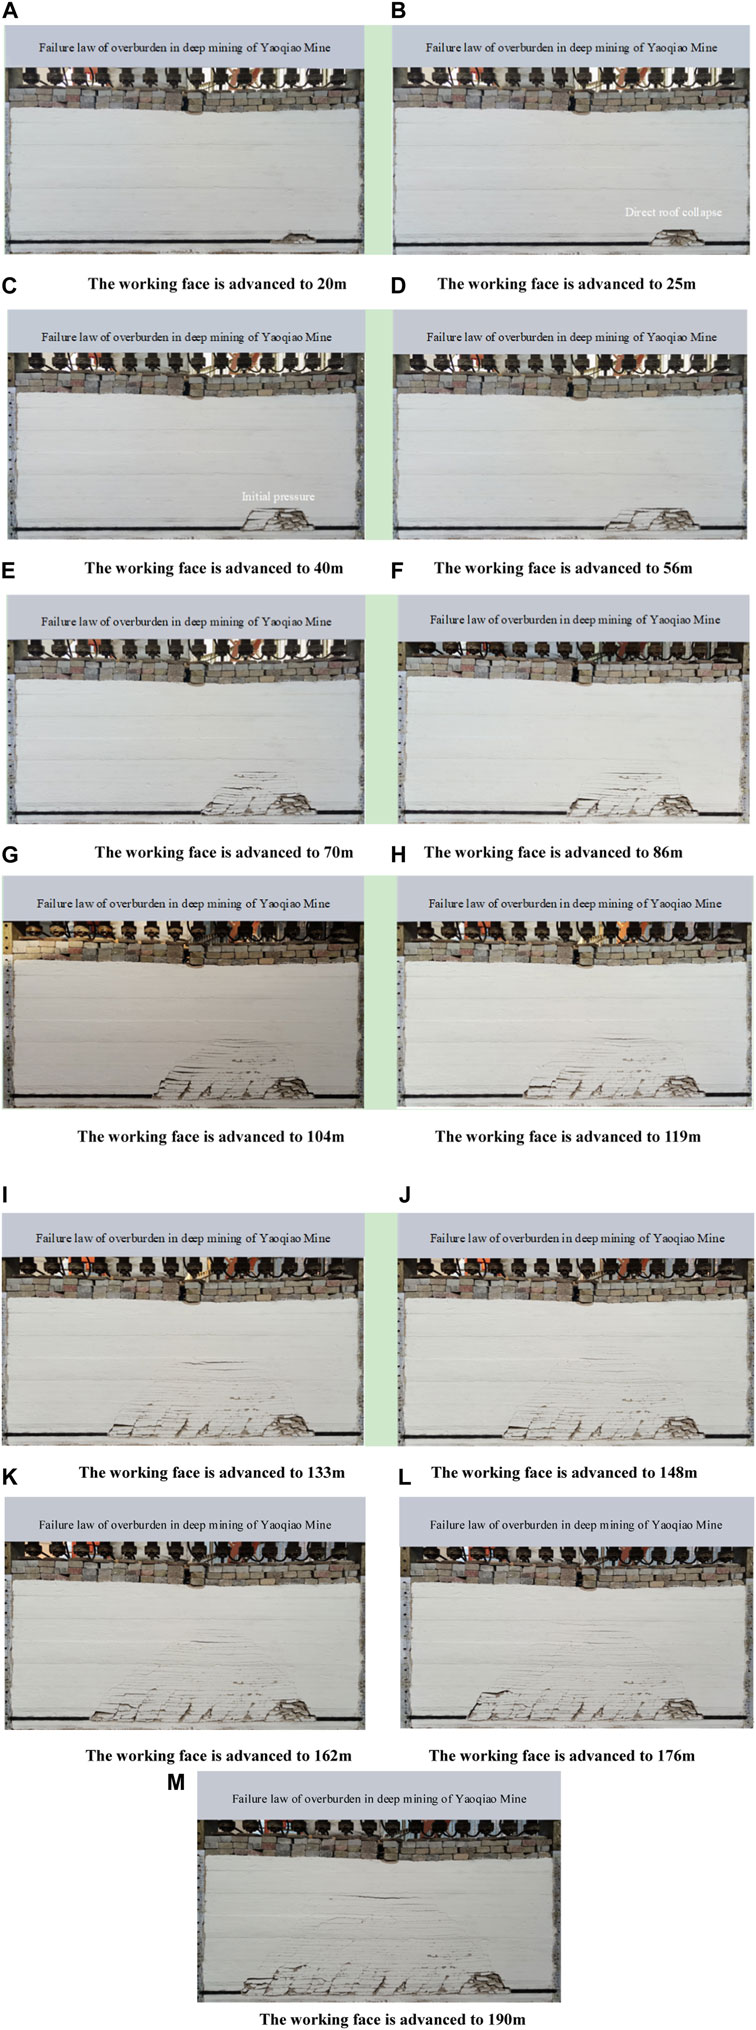
Figure 9. Overburden fracture characteristics at different advancements. (A) The working face is advanced to 20 m. (B) The working face is advanced to 25 m. (C) The working face is advanced to 40 m. (D) The working face is advanced to 56 m. (E) The working face is advanced to 70 m. (F) The working face is advanced to 86 m. (G) The working face is advanced to 104 m. (H) The working face is advanced to 119 m. (I) The working face is advanced to 133 m. (J) The working face is advanced to 148 m. (K) The working face is advanced to 162 m. (L) The working face is advanced to 176 m. (M) The working face is advanced to 190 m.
When the working face advances from 25 to 40 m, the first pressure occurs at the working face, and the overburden fracture characteristics are as shown in Figure 9C. The stratification cracks and longitudinal cracks develop rapidly upward, and the old roof caves successively. The caving of the old top rock strata in the coal wall overhangs by approximately 2 m, and the goaf is not sufficiently compacted. When the working face advances from 40 to 56 m, the first cycle of pressure occurs with the step distance of 16 m, and the fracture characteristics of the overlying rock are as shown in Figure 9D. At this time, the caving block of the overlying rock is relatively broken, while a new obvious separation layer appears in the overlying rock 26 m above the coal seam and longitudinal cracks develop upward slowly at the cutting hole and working face.
When advancing from 56 to 70 m, the second pressure cycle occurs with the step distance of 14 m, and the fracture characteristics of the overlying rock are shown in Figure 9E. At this time, the original goaf is filled with caving blocks and begins to be compressed by the subsidence of the overlying rock. At the same time, a new obvious separation of the overlying rock appears 38.5 m above the coal seam, and the development height of the water-conducting fracture zone is approximately 42.2 m. When the working face advances from 70 to 86 m, a third cycle of pressure occurs with the step distance of 16 m, and the fracture characteristics of the overlying rock are as shown in Figure 9F. The overlying rock separation is more obvious 38.5 m above the coal seam, and the roof separation of the overlying rock is more obvious. Moreover, there are obvious longitudinal cracks at the cutting hole and working face, and the development height of the water-conducting fracture zone is approximately 46 m.
When advancing from 86 to 104 m, the fourth pressure cycle occurs with the step distance of 18 m, and the fracture characteristics of the overlying rock are as shown in Figure 9G. At this time, the goaf is further compacted by the sinking of the overlying rock, and the development height of the water-conducting fracture zone is approximately 52.4 m. When the working face advances from 104 to 119 m, the fifth cycle of pressure occurs with the step distance of 15 m, and the overburden fracture characteristics are as shown in Figure 9H. At this time, the caving zone gradually stabilizes, the caving zone of the overlying rock is compacted, and the roof collapses in a large area, resulting in rapid upward development of cracks in the overlying rock such that the split layer cracks in the central overlying rock are gradually compacted and closed. There are obvious longitudinal cracks above the working face, and the longitudinal cracks at the cutting hole develop upward rapidly; at this time, the development height of the water-conducting fracture zone is approximately 54.5 m.
When advancing from 119 to 133 m, the sixth pressure cycle occurs with the step distance of 14 m, and the fracture characteristics of the overlying rock are as shown in Figure 9I. In the middle of the overlying rock, the separation fractures expand, and the longitudinal fractures above the cutting hole and working face continue to develop upward. At this time, the development height of the water-conducting fracture zone is approximately 62.3 m. When the working face advances from 133 to 148 m, the seventh cycle of pressure occurs with the step distance of 15 m, and the fracture characteristics of the overlying rock are as shown in Figure 9J. At this time, the goaf is further compacted by the subsidence of the overlying rock, and the separation fissures of the central overlying rock start closing. The longitudinal cracks above the cutting eye and working face continue to develop upward, and the development height of the water-conducting fracture zone is approximately 70.8 m.
When advancing from 148 to 162 m, the eighth pressure cycle occurs with the step distance of 14 m, and the fracture characteristics of the overlying rock are as shown in Figure 9K. The overlying rock bends and subsides as a whole, the existing underlying fissures are closed, and the development rate of the longitudinal fissure at the cutting hole and above the working face slows to become stable. At this time, the height of the water-conducting fracture zone is 72.3 m. When the working face advances from 162 to 176 m, the ninth pressure cycle occurs with the step distance of 14 m, and the fracture characteristics of the overlying rock are as shown in Figure 9L. At this time, the overlying rock bends and sinks, and the height of the water-conducting fracture zone is 74.6 m.
When the working face advances from 176 to 190 m, the tenth cycle pressure occurs with the step distance of 14 m, and the overburden fracture characteristics are as shown in Figure 9M. The uppermost stratum develops fractures in the middle of the overburden rock, and the gaps in the stratum expand. The existing fractures in the lower overburden layers are closed, and the fractures stop developing. The longitudinal fissures also stop developing at the cutting hole of the working face. At this time, the excavation is complete, and the development height of the water-conducting fissure zone is finally determined as 74.6 m.
From the above statistical analysis of the overburden caving morphology for different advancement distances, it can be seen that there are ten pressure cycles in this experiment, with an average step distance of 14.9 m. In the process of coal-seam excavation, pressure is exerted by the period, and the roof of the working face undergoes separation as well as formation of cracks and fractures during testing, which finally generate the caving zone. The caving zone is roughly shaped as a trapezoidal platform, and its characteristics can be seen in Figure 10. With continuous advancement of the working face, many longitudinal and stratified fractures appear in the old overburdened rock, the formation of the water-conducting fracture zone develops rapidly, and the stratified fractures present a dynamic process of formation, expansion, contraction, and closure, as shown in Figure 11. Thus, the water gusher channel is mainly dominated by the fracture of the rock layer. As the dynamic process of the separation fracture shrinks and closes with advancement of the working face, thereby compacting gradually, the water gusher channels of the overlying water-bearing rock layer have difficulty passing through the separation fractures, as shown in Figure 12.
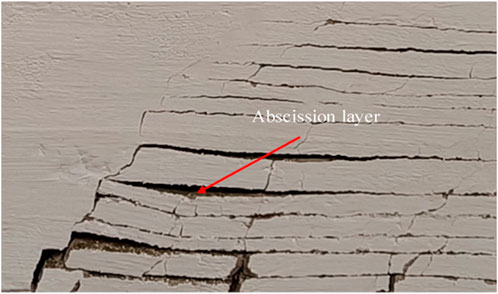
Figure 10. Caving zone characteristics.
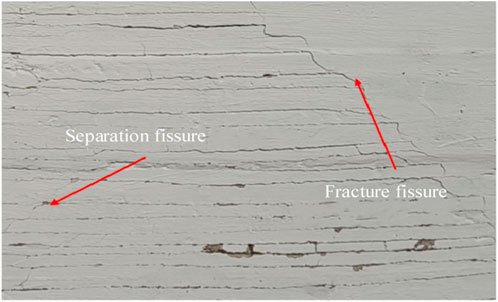
Figure 11. Characteristics of the fracture zone.
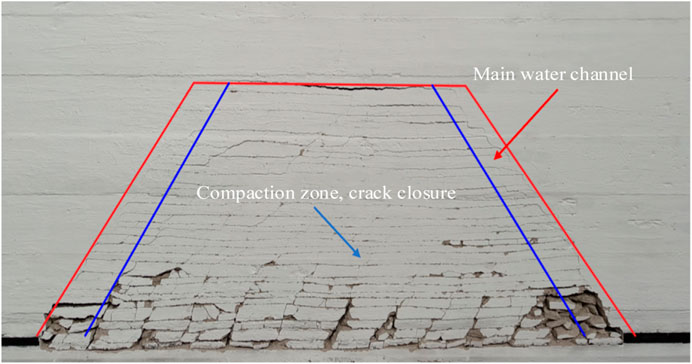
Figure 12. Main water channel in the fracture zone.
With the advancement of the working face, the water-guiding fracture zone continues to develop upward. To reflect the relationship between the water-guiding fracture zone and advancement of the working face more intuitively, Origin mapping software is used to draw the distribution curves according to the test data, as shown in Figure 13. As can be seen from Figure 13, with the advancement of the working face, the development height of the water-conducting fracture zone increases rapidly at first and then increases slowly to a stable level. The development height of the water-conducting fracture zone then stabilizes at approximately 74.6 m and does not develop further. This shows that the maximum development height of the water-conducting fracture zone is approximately 74.6 m, which is 15.87 times the thickness of the coal layer.
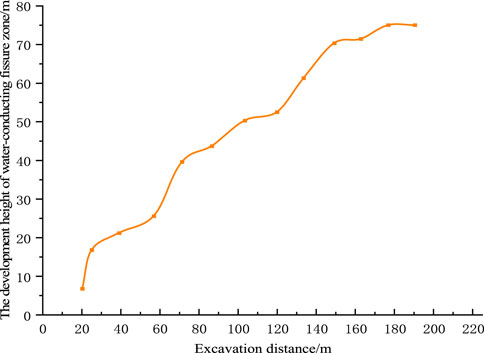
Figure 13. Distribution of the development height of the fracture zone with advancement of the working face.
4.5 Analysis of the displacement law of the overlying rock model
In the physical similarity simulation experiments, the coal seam was excavated stepwise, and the displacement measurement points on the back of the test platform were moved by different degrees after each excavation. The movement of each displacement measurement point can be obtained by comparison with the initial position. The lateral and longitudinal displacements of the measuring points can be recorded and calculated using the XTDP 3D optical photogrammetry system. The longitudinal subsidence of each measurement point is obtained using XTDP 3D optical photogrammetry because the lateral displacements of the rock strata are very small and can be ignored. A total of three measurement lines are arranged on the back of the model, and the subsidence displacements of the measurement lines are shown in Figures 14–16.
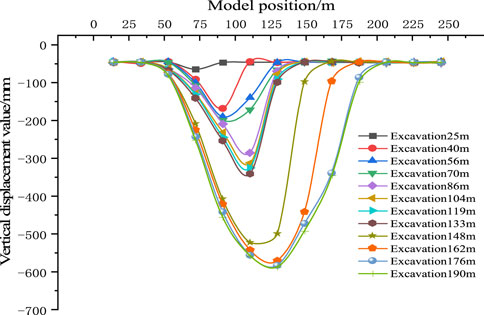
Figure 14. Vertical displacement curve at survey line 3.
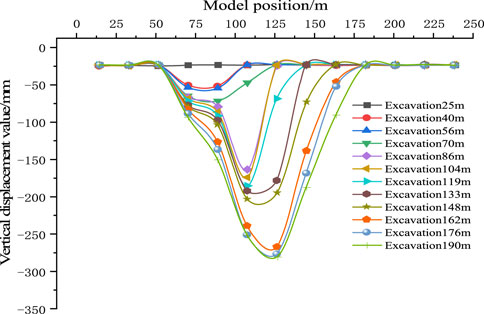
Figure 15. Vertical displacement curve at survey line 2.
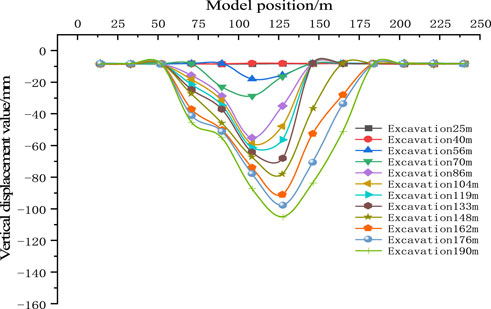
Figure 16. Vertical displacement curve at survey line 1.
Figure 14 shows the changes in the vertical displacements of survey line 3 during coal-seam excavation. The vertical distance of survey line 6 from the coal-seam roof is 80 m. Before the working face advances to 133 m, survey line 3 only has slight deformation, indicating that the mining dynamic disturbance has not affected the place 50 m before the working face advances to 133 m. When the working face advances to 148 m, the vertical displacement of survey line 6 changes greatly. At this time, the maximum subsidence displacement is 0.51 m, indicating that the caving zone of the overlying rock is further compacted and that the roof collapses in a large area, resulting in rapid upward development of cracks in the overlying rock such that the breakaway cracks in the middle of the overlying rock are gradually compacted and closed. In the process of gradually advancing to 190 m, given the periodic breaking of the overlying rock, the vertical displacement measurement lines change in stages, and the final maximum subsidence value was 0.58 m.
Figure 15 shows the changes in the vertical displacements of survey line 2 in the process of coal-seam excavation. The vertical distance of survey line 2 from the coal-seam roof is 100 m. In the process of advancement of the working face, survey line 2 only deforms slightly, indicating that survey line 2 is in the bending subsidence zone. When the working face advances to 190 m, the vertical displacement of survey line 2 reaches the maximum value, and the maximum subsidence displacement is 0.28 m.
Figure 16 shows the changes in the vertical displacements of measurement line 1 during coal-seam excavation. The vertical distance of survey line 1 from the coal-seam roof is 120 m, and its overall subsidence changes minimally. Survey line 1 is located in the curved subsidence zone; when the coal seam is excavated to 190 m, the subsidence does not change greatly, and the final maximum subsidence is 0.12 m.
5 Conclusion
To address the problem of deep-fault overlying rock breakage during the mining of ultra-thick coal seams, this study adopted numerical simulation and physical similarity simulation to compare and analyze the mining fracture evolution characteristics and overlying rock displacement laws of non-tectonic and fault-bearing overlying rock corresponding to fully mechanized caving mining based on the engineering background of the Yaoqiao Coal Mine; the failure characteristics and displacement laws of the overlying rock are thus systematically explained under the influence of deep faults. The main conclusions of this study are as follows:
(1) The fracture height of the overlying rock presents a specific change law with advancement of the working face: it rapidly increases to a maximum of 74 m at the initial stage (when the working face advances to 90 m), then decreases to 54 m and becomes stable with the development of the plastic zone indicating past yield, such that the final caving angle of the fracture is stable at 70°.
(2) In coal mining under normal fault conditions, when the working face advances from the upper to lower walls, the roof forms a masonry beam structure to slow down fault activation and crack development. When moving away from the fault, the overburden movements and water-conducting cracks are fewer, and the crack height is lower than that without faults. When approaching the fault, the influence of the faults on the fracture zone increases, and the height of fracture development reaches the maximum value after crossing the fault, highlighting the significant influence of the fault on fracture development.
(3) Through similarity simulation tests, it is seen that the caving zone of the overlying rock is compacted further and that a large area of roof caving occurs, resulting in rapid upward development of the cracks in the overlying rock along with gradual compaction and closure of the separation cracks in the central overlying rock. In the process of gradual advancement of the working face to 190 m, given the periodic breaking of the overlying rock, the vertical displacement measurement line changed in stages, and the final maximum subsidence value was 0.58 m.
Data availability statement
The raw data supporting the conclusions of this article will be made available by the authors, without undue reservation.
Author contributions
P-DZ: writing–original draft and writing–review and editing. Y-ZW: writing–original draft and writing–review and editing. Z-ZC: writing–review and editing. Z-HL: writing–review and editing. FD: writing–review and editing. W-QW: writing–review and editing. M-LZ: writing–review and editing.
Funding
The author(s) declare that financial support was received for the research, authorship, and/or publication of this article. This research was supported by the Natural Science Foundation of Henan Province (Grant Nos 222300420007 and 242300421246), the National Natural Science Foundation of China (Grant Nos 52004082, 52174073, and 52274079), the Key Supported Project of the National Natural Science Foundation of China Regional Innovation and Development Joint Fund (Grant No. U23A20600), the Science and Technology Project of Henan Province (Grant No. 232102321098), the Program for the Scientific and Technological Innovation Team in Universities of Henan Province (Grant No. 23IRTSTHN005), the Program for Science & Technology Innovation Talents in Universities of Henan Province (Grant No. 24HASTIT021), the Cultivation Project of “Double First-Class” Creation of Safety Discipline (Grant No. AQ20240724), and the Young Teacher Foundation of Henan Polytechnic University (Grant Nos 2023XQG-01 and 2019XQG-08).
Conflict of interest
Author P-DZ was employed by Shanghai Datun Energy Resources Co., Ltd.
The remaining authors declare that the research was conducted in the absence of any commercial or financial relationships that could be construed as a potential conflict of interest.
Publisher’s note
All claims expressed in this article are solely those of the authors and do not necessarily represent those of their affiliated organizations, or those of the publisher, the editors, and the reviewers. Any product that may be evaluated in this article, or claim that may be made by its manufacturer, is not guaranteed or endorsed by the publisher.
References
Cai, Y., Ma, Y., Teng, T., Xue, Y., Wang, L., Cao, Z., et al. (2024). Risk assessment and analysis of rock burst under high-temperature liquid nitrogen cooling. Water 16 (4), 516–615. doi:10.3390/w16040516
Cheng, W., Sun, L., Wang, G., Du, W., and Qu, H. (2016). Experimental research on coal seam similar material proportion and its application. Int. J. Min. Sci. Technol. 26 (5), 913–918. doi:10.1016/j.ijmst.2016.05.034
Chen, L., Wang, Y., Qinghua, O. U., et al. (2021). Prediction model for development height of water-conducting fractured zone during mining near loose stratum considering influence of overburden structure: a case study of Huaibei coalfield. J. Eng. Geol. 29 (4), 1048–1056.
Guobiao, KANG, Bian, T., and Pingwu, P. U. (2021). Study on development height and influencing factors of overburden water conducting fracture zone in large mining height face. Coal Sci. Technol. 49 (S2), 19–24.
Heping, X. I. E., GuangmingYANG, Y. U. L., et al. (1999). Research on the fractal effects of crack network in overburden rock stratum. Chin. J. Rock Mech. Eng. 18 (2), 147–151.
Jialin, X. U., and Minggao, QIAN (2004). Study and Application of mining-induced fracture distribution in green mining. J. China Univ. Min. Technol. 33 (2), 17–20.
Jun, W., Han, J., Zhu, C., Lu, W., Zhang, Y., He, X., et al. (2024). Structural optimization and engineering application of concrete-filled steel tubular composite supports. Eng. Fail. Anal. 159, 108082. doi:10.1016/j.engfailanal.2024.108082
Kong, H., Wang, L., Gu, G., and Xu, B. (2018). Application of DICM on similar material simulation experiment for rock-like materials. Adv. Civ. Eng. 12 (1), 1–15. doi:10.1155/2018/5634109
Li, T. L., Zhao, W., Liu, R., Han, J., Jia, P., and Cheng, C. (2023). Visualized direct shear test of the interface between gravelly sand and concrete pipe. Can. Geotechnical J. 61, 361–374. doi:10.1139/cgj-2022-0007
Pengshuai, W., Zhengzheng, C., Zhenhua, L., Feng, D., Wenqiang, W., Minglei, Z., et al. (2024). Experimental research on mechanical performance of grouting plugging material with large amount of fly ash. Sci. Rep. 14, 6308. doi:10.1038/s41598-024-53623-x
Shao, L., and Yu, Z. (2018). Application of QGA-RFR model in prediction of height of water flowing fractured zone. China Saf. Sci. J. 28 (3), 19–24.
Teng, T., Li, Z., Wang, Y., Liu, K., and Jia, W. (2024). Experimental and numerical validation of an effective stress-sensitive permeability model under hydromechanical interactions. Transp. Porous Media 151, 449–467. doi:10.1007/s11242-023-02043-y
Wang, L. C., Xue, Y., Cao, Z., Kong, H., Han, J., and Zhang, Z. (2023c). Experimental study on mode I fracture characteristics of granite after low temperature cooling with liquid nitrogen. Water 15, 3442. doi:10.3390/w15193442
Wang, L. C., Zhang, W., Cao, Z., Xue, Y., Liu, J., Zhou, Y., et al. (2023b). Effect of weakening characteristics of mechanical properties of granite under the action of liquid nitrogen. Front. Ecol. Evol. 11. doi:10.3389/fevo.2023.1249617
Wang, W., Li, Z., Du, F., Cao, Z., and Li, G. (2023a). Untersuchung von Technologien zur Kontrolle von Wassereinbrüchen sowie der Nutzung von Wasserressourcen beim Kohleabbau in einem Karstgebiet. Mine Water Environ. 42, 546–559. doi:10.1007/s10230-023-00953-3
Wang, G., Guangming, Y. U., Yongjiang, Y. U., et al. (2012). Study on cracks fractal evolution laws of mining rock mass. J. Mining&Safety Eng. 29 (6), 859–863.
Wang, J., and Wang, X. (2021). Seepage characteristic and fracture development of protected seam caused by mining protecting strata. J. Min. Strata Control Eng. 3 (3), 033511.
Wei, L., Dang, F., Ding, J., Wu, X., Li, J., and Cao, Z. (2023). An analysis of thixotropic micropore variation and its mechanism in loess. Front. Ecol. Evol. 11. doi:10.3389/fevo.2023.1242462
Xingliang, L. I., and Qingxiang, HUANG (2022). High development characteristics of water flowing fractured zone in fully-mechanized top-caving mining of extremely thick coal seam under water. J. Min. Saf. Eng. 39 (01), 54–61.
Xue, Y., Wang, L., Liu, J., Ranjith, P. G., Gao, F., Cai, C., et al. (2024). Experimental study on the effect of heating and liquid nitrogen-cooling cyclic treatment on mechanical properties and fracturing characteristics of granite. Int. J. Rock Mech. Min. Sci. 176, 105691. doi:10.1016/j.ijrmms.2024.105691
Yongjiang, W., Zhengzheng, C., Zhenhua, L., Feng, D., Wenqiang, W., Minglei, Z., et al. (2024). Seepage evolution characteristics and water inrush mechanism in collapse column under mining influence. Sci. Rep. 14, 5862. doi:10.1038/s41598-024-54180-z
Zhang, H., Zhu, Z., Huo, B., et al. (2013). Water flowing fracture zone height prediction based on improved FOA-SVM. China Saf. Sci. J. 23 (10), 9–14.
Zhang, J., Wang, Z., and Song, Z. (2020). Numerical study on movement of dynamic strata in combined open-pit and underground mining based on similar material simulation experiment. Arabian J. Geosciences 13 (16), 785–800. doi:10.1007/s12517-020-05766-0
Zhang, P., Daqiang, X. U., Xiang, F. U., et al. (2022). Evaluation of hydraulic conductivity based on fault confinement studies. J. Min. Strata Control Eng. 4 (2), 023033.
Zhang, X., Zhengrong, X. U., Su, Z., et al. (2001). Study on computer simulation of fracture network in mined rock masses. Chin. J. Rock Mech. Eng. 20 (6), 809–812.
Zhao, L. (2022). Study on water inrush mechanism of overlying rock in mining face under fault action. Coal Sci. Technol. 50 (S1), 207–211.
Zhao, Y., Chunwei, L., Liu, B., et al. (2021). Fracture evolution and energy dissipation of overlying strata in shallow-buried underground mining with ultra-high working face. J. Min. Saf. Eng. 38 (1), 9–18.
Zheng, C., Pengshuai, W., Zhenhua, L., and Feng, D. (2024c). Migration mechanism of grouting slurry and permeability reduction in mining fractured rock mass. Sci. Rep. 14, 3446. doi:10.1038/s41598-024-51557-y
Zheng, C., Qiang, S., Zhenhua, L., and Feng, D. (2024b). Abnormal ore pressure mechanism of working face under the influence of overlying concentrated coal pillar. Sci. Rep. 14, 626. doi:10.1038/s41598-024-51148-x
Zheng, C., Xiangqian, Y., Zhenhua, L., and Feng, D. (2024a). Evolution mechanism of water-conducting fractures in overburden under the influence of water-rich fault in underground coal mining. Sci. Rep. 14, 5081. doi:10.1038/s41598-024-54803-5
Zheng, C., Yunlong, J., Zhenhua, L., and Feng, D. (2023). Research on slurry diffusion and seepage law in mining overburden fractures based on CFD numerical method. Sci. Rep. 13, 21302. doi:10.1038/s41598-023-48828-5
Keywords: deep fault, overburden failure, numerical simulation, mining-induced fissure, similarity simulation
Citation: Zhang P-D, Wu Y-J, Cao Z-Z, Li Z-H, Du F, Wang W-Q and Zhai M-L (2024) Study on overburden failure characteristics and displacement rule under the influence of deep faults. Front. Earth Sci. 12:1388612. doi: 10.3389/feart.2024.1388612
Received: 20 February 2024; Accepted: 28 March 2024;
Published: 30 April 2024.
Edited by:
Jianyong Han, Shandong Jianzhu University, ChinaReviewed by:
Fanfei Meng, China University of Mining and Technology, ChinaJia Liu, Xi’an University of Technology, China
Copyright © 2024 Zhang, Wu, Cao, Li, Du, Wang and Zhai. This is an open-access article distributed under the terms of the Creative Commons Attribution License (CC BY). The use, distribution or reproduction in other forums is permitted, provided the original author(s) and the copyright owner(s) are credited and that the original publication in this journal is cited, in accordance with accepted academic practice. No use, distribution or reproduction is permitted which does not comply with these terms.
*Correspondence: Zheng-Zheng Cao, Y2FvenpAaHB1LmVkdS5jbg==