 Yu Lu
Yu Lu Lian-Feng Zhao
 Xin-Liang Pang1*
- 1State Key Laboratory of NBC Protection for Civilian, Beijing, China
- 2Key Laboratory of Earth and Planetary Physics, Institute of Geology and Geophysics, Chinese Academy of Sciences, Beijing, China
- 3Heilongjiang Mohe Observatory of Geophysics, Institute of Geology and Geophysics, Chinese Academy of Sciences, Beijing, China
In seismic nuclear monitoring, attenuation models are important prerequisites for reliably estimating the explosive yield in an uncalibrated region without the occurrence of standard events. The seismic moment obtained by fitting source spectra is related to the source energy. This approach is appropriate for estimating yield, as the attenuation effects on the propagation path can be accurately considered. In this study, we collected 2022 vertical component waveforms in and around the Korean Peninsula from May 2010 to May 2022 to construct a high-resolution broadband Lg-wave attenuation model and inverted the Lg-wave source excitation spectra of the nuclear explosion simultaneously with attenuation correction. We obtained the scalar seismic moments by fitting the theoretical source spectra based on the Brune (J. Geophys. Res., 1970, 75, 4997–5009) model. Under the given emplacement conditions and burial depths, the seismic moments can be used to estimate yields of the North Korean nuclear tests, which are 4.6, 8.5, 19.9, 20.9, 24.7, and 337.4 kt for six nuclear explosions that occurred between 2006 and 2017. Our results are consistent with those obtained from previous teleseismic observations.
Highlights
• A broadband Lg attenuation model is constructed for the Korean Peninsula and its surrounding areas.
• Both the seismic moment and corner frequency are obtained based on Lg-wave excitation spectra.
• The explosive yields of North Korean tests are increasing based on the seismic moments of Lg waves.
1 Introduction
When characterizing an explosive event, determining the yield is an important step (Pasyanos, 2022). With the rapid development of modern seismic networks, broadband digital seismograms on high-density stations have promoted the widespread application of regional monitoring techniques for yield estimation (Hong et al., 2008; Zhao et al., 2008; Pasyanos et al., 2012; Yao et al., 2018; Kim et al., 2019; Ma et al., 2020; Delbridge et al., 2023). The continental crustal-guided Lg-wave is the most prominent phase of a seismic event at a regional distance (e.g., Hong et al., 2008). The broad sampling of different ray paths from the source makes Lg particularly suitable for yield estimation (e.g., Zhao et al., 2008). However, Lg-derived yield estimations are critically dependent on regional attenuation and strongly dependent on the selected frequency band (e.g., Zhao et al. (2012)). For example, Zhao et al. (2008) used the third-peak amplitude and the root mean square (RMS) amplitude of Lg waves at approximately 1 Hz to measure body-wave magnitudes mb (Lg) to obtain yield estimations. These results are different from those of magnitude-yield estimations based on teleseismic P waves (Zhang and Wen, 2013; Xie and Zhao, 2018; Yao et al., 2018; Voytan et al., 2019; Yang et al., 2021). The waveform energy difference may be a dominant factor within a selected frequency band (Aki and Richards, 2002).
Six underground nuclear explosion tests were conducted in North Korea on 9 October 2006, 25 May 2009, 12 February 2013, 6 January 2016, 9 September 2016, and 3 September 2017 (NKT1-6) (e.g., Voytan et al., 2019). Historical explosive yield estimations are obtained by converting seismic magnitudes from the amplitudes of teleseismic body waves to yields using empirical relationships (Bowers et al., 2001; Nuttli, 1973; Nuttli, 1986; Patton and Schlittenhardt, 2005; Patton and Taylor, 2011). Since the North Korean nuclear test site is uncalibrated, there are challenges in terms of absolute explosion magnitude and yield estimations (Delbridge et al., 2023). As a measurable and well-understood physical parameter of seismic sources, the seismic moment allows us to move away from purely empirical calibrations and directly calculate the yield of explosions theoretically (Pasyanos and Chiang, 2021). Unlike body wave magnitudes, which focus on the amplitude of narrowband high frequencies (>1 Hz), the seismic moment is obtained by fitting the long-period portion of observed seismic source spectra. Alvizuri and Tape (2018) and Chiang et al. (2018) calculated the seismic moment of NKT1-6 based on regional long-period surface waves between 0.02 and 0.05 Hz, all of which rely on the same 1D-layered Earth model, MDJ2 (Ford et al., 2009), with a constant attenuation assumption. Although the attenuation of low-frequency (<0.05 Hz) seismic waves may be relatively stable, the signal-to-noise ratio (SNR) for low-yield explosions is poor at relatively lower frequencies. Over a large frequency range, crustal seismic attenuation might introduce significant errors into seismic moment calculations (e.g., Delbridge et al., 2023). Delbridge et al. (2023) calculated coda wave spectral ratios to remove path and site effects to solve precise relative source moments. Therefore, if a high-resolution seismic attenuation model is used to calculate the seismic moment, the reliability of the explosive yield estimation can be effectively improved. The resolutions are lower for previous Lg-wave attenuation models due to sparse ray coverage (Zhao et al., 2010; Pasyanos et al., 2012; Ranasinghe et al., 2014). With the development of Lg attenuation tomography and the regional network around the Korean Peninsula, Lg-wave source excitation spectra can be extracted simultaneously by correcting path attenuation to further obtain seismic moments by fitting observed source spectra based on Brune’s source model (e.g., Brune (1970); Zhao et al. (2010); He et al. (2020)).
In this study, based on a large dataset from both the natural earthquake and nuclear explosion in the Korean Peninsula and surrounding regions, we extracted both single-station and two-station Lg-wave spectral data to develop a high-resolution broadband Lg attenuation tomography model and simultaneously inverted the Lg source excitation spectra. Thus, the source parameters, including the scalar seismic moment, corner frequency, and high-frequency falloff rate, were estimated for NKT1-6. Considering the burial depths and local rock conditions, such as P- and S-wave velocities, density, and gas porosity, we estimated the explosive yields of NKT1-6 based on the seismic moment–yield relationship (Yang et al., 2021; Pasyanos, 2022).
2 Data
2.1 Regional seismic datasets
We collected 2022 vertical-component digital seismograms from 155 seismic events recorded at 93 stations in and around the Korean Peninsula. The seismic events included 146 natural earthquakes between May 2010 and May 2022, six North Korean nuclear tests, and three chemical explosions that occurred in August 1998 (Zhang et al., 2002; Yang et al., 2021). These seismic events occurred within the crust at focal depths shallower than the Moho discontinuity from CRUST1.0 (Laske et al., 2012). Natural earthquakes with moderate magnitudes between mb 3.5 and 5.3 were selected to ensure high SNRs and to avoid complex rupture effects. The epicentral distances are between 150 and 1700 km to observe the Lg-wave phase clearly (e.g., Zhao et al., 2010; 2013). We visually inspected individual traces to remove low-quality data that were saturated or noisy or had incorrect timing, possibly due to off-point records, low magnitudes, or the superposition of multiple events. Although the selection process reduces the amount of available data, a reasonable dataset is obtained following this process. The locations of the stations and events used in this study are shown in Figure 1, and their parameters are listed in Supplementary Tables S1, S2.

Figure 1. Map showing the surface topography of the Korean Peninsula and surrounding areas, which are overlapped by the locations of stations (blue triangles), natural earthquakes (red circles), North Korean nuclear tests (red stars), and chemical explosions for deep sounding (red diamonds).
2.2 Lg-wave amplitude spectrum
Following Zhao et al. (2013), we processed the seismic data to extract Lg-wave amplitude spectra. After removing the trends, means, and instrument responses from the raw vertical-component seismograms, we scanned the most energetic waveforms within a group velocity window of 0.6 km/s between 3.7 and 2.8 km/s for Lg amplitude measurements (Figure 2) (Zhao and Xie, 2016; Zhang et al., 2022). Subsequently, we captured the time series of pre-P noise and pre-Lg noise with a time length window equal to the Lg waveform and calculated the waveform energy. The fast Fourier transform was used to calculate the amplitude spectrum of the Lg waves and noises at 66 discrete frequencies log-evenly distributed between 0.05 and 20.0 Hz. Pre-P noise and pre-Lg phase noise were used for both data quality control and correction of the Lg-wave energy (e.g., Luo et al., 2021). Lg waves with an SNR to pre-P noise of less than 2.0 were removed to ensure Lg data quality. Furthermore, we also set a pre-Lg SNR threshold of 1.0 to remove data that were possibly dominated by Sn coda (Zhang et al., 2022). Then, the amplitude spectrum of the Lg wave can be obtained by using
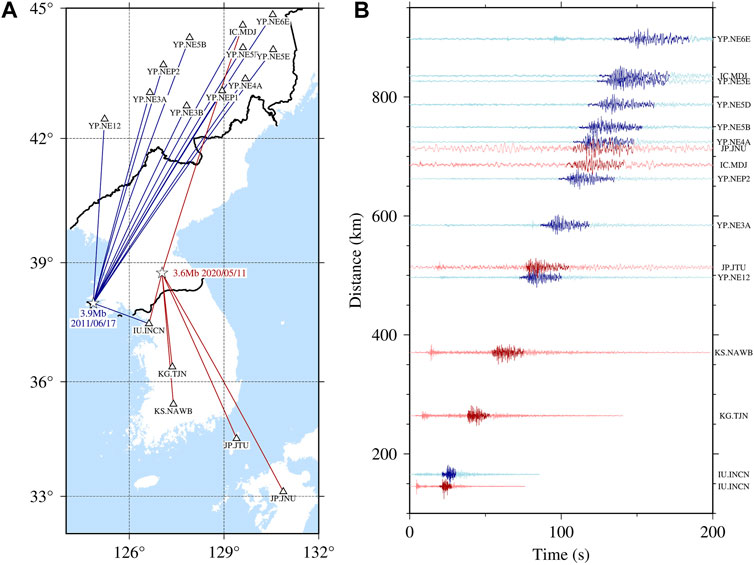
Figure 2. (A) Great circle paths from the epicenters (stars) of two earthquakes that occurred on 17 June 2011 and 11 May 2020 to selected stations (triangles), where the magnitudes and times of the earthquakes and the names of the network and stations are labeled. (B) The normalized vertical-component velocity records aligned according to epicentral distances, where the Lg phases are highlighted between 3.7 and 2.8 km/s.
3 Methods
3.1 Modeling of the Lg amplitudes
The Lg-wave amplitude spectrum recorded by station
where
The attenuation factor can be expressed as follows (Zhao et al., 2013)
where
When two stations
where
3.2 QLg tomography
To establish an inversion system for Lg-wave Q tomography, we apply the natural logarithm to Eqs 1, 2 based on perturbation theory (e.g., Zhao et al., 2010; 2013). By neglecting the random effects along the propagation path, we assume that
The terms
where
where
Then, we obtain the amplitude spectrum residual by taking Eq. 8 minus Eq. 9 as follows:
Therefore, the perturbations in the attenuation, source, and site response are related to the amplitude residual. The amplitude residual
where
where
For two-station data, since the source term is eliminated by taking the spectral ratios in Eq. 3, the similar linear matrix equation of the Lg-wave Q perturbation is
In general, it is assumed that
Eq. 14 forms a joint inversion problem for perturbation vectors
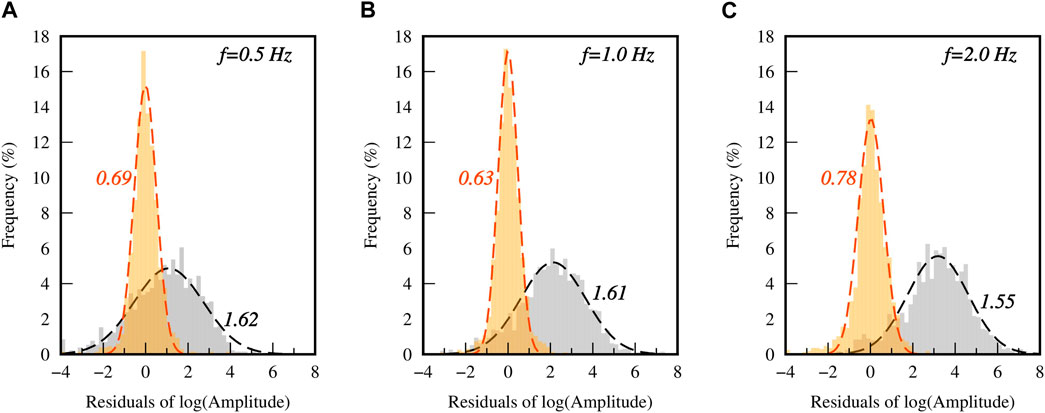
Figure 3. Histograms of the Lg spectral amplitude misfits before (gray) and after (orange) inversion at (A) 0.5, (B) 1.0, and (C) 2.0 Hz. The dashed lines represent the best-fitting normal curves, and the adjacent labels denote the RMS residuals.
3.3 Resolution test
The checkerboard method was used for the resolution analysis (Zelt, 1998; Morgan et al., 2002; Zhao et al., 2013). To create a checkerboard-shaped QLg model, ±7% logarithmic perturbations are superimposed on a constant background QLg (Zhao et al., 2013). We generated synthetic Lg spectral amplitudes according to actual ray paths (Figure 4A) and added 10% random noise to form a tomographic dataset (e.g., Zhang et al., 2022), where the source functions adopted inverted source spectra. Both single- and two-station synthetic data were jointly used to reconstruct the QLg model (e.g., Zhang et al., 2022). Figure 4 shows the ray path coverage and reconstructed Q perturbation model at 1.0 Hz. Note that the resolution is significantly improved compared with that of previous studies (Zhao et al., 2010; 2013). The workflow for data collection, pre-processing, tomography, and verifications can be referred to Zhao et al. (2022).
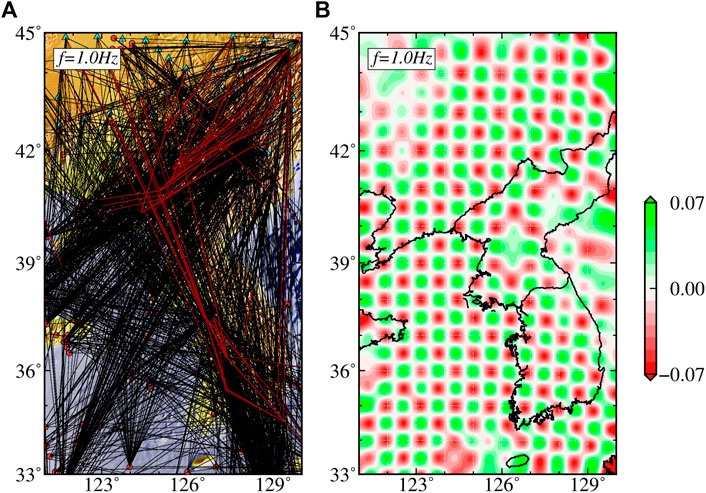
Figure 4. Ray path coverage for both a single-station (black) and two-station (red) ray paths (A) and the reconstructed 0.5°×0.5° checkerboard of Q perturbations (B) at 1 Hz.
4 Results
4.1 Broadband QLg model in and around the Korean Peninsula
Based on the inversion procedure described in the previous section, we obtained the QLg model at 66 individual frequencies between 0.05 and 20 Hz. Figure 5 shows the QLg map coverages at 0.5, 1.0 and 2.0 Hz. The lateral QLg variations are consistent with the regional tectonic conditions. In the Korean Peninsula region, the QLg distribution is characterized by high values for the Nangrim Massif (NM) in the north and the Yeongnam Massif (YM) in the south and low values for the Gyeonggi Massif (GM) in the middle, especially at a frequency of 1.0 Hz (Figure 5B). Our results are consistent with those of previous studies but at relatively higher resolutions, and they cover the entire Korean Peninsula (Zhao et al., 2010; 2013; Pasyanos et al., 2012; Ranasinghe et al., 2014).
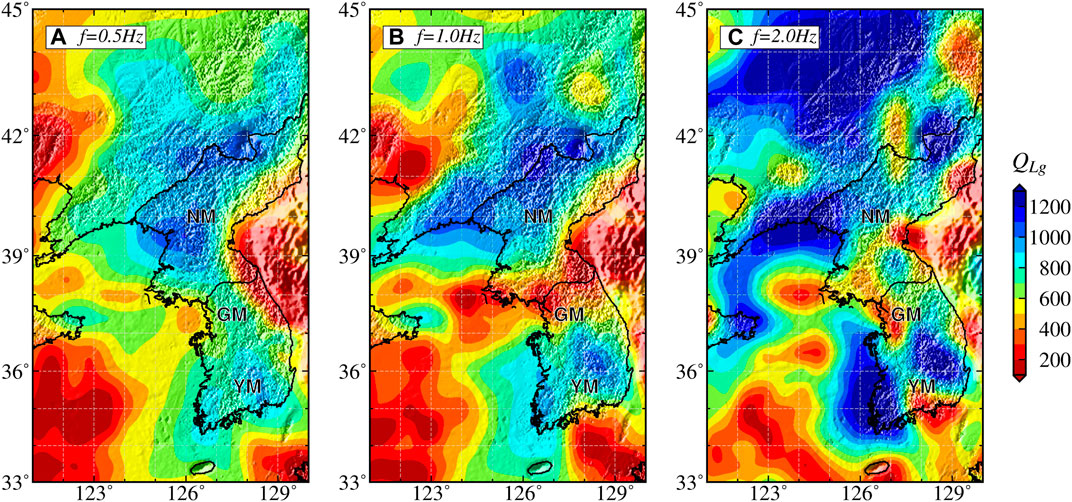
Figure 5. QLg maps at 0.5 (A), 1.0 (B), and 2.0 Hz (C). Note that a similar scale was used for all the maps.
We investigated the regional variations and frequency dependence of QLg in three massifs to characterize the Lg-wave attenuation for different geological formations on the Korean Peninsula. For example, the scattered distribution of observed QLg values is shown for the Gyeonggi Massif (Figure 6A), whereas the average QLg versus frequency is summarized for all three massifs in the Korean Peninsula (Figure 6B). The average QLg values increase with increasing frequency for an individual massif below 0.3 Hz and above 3.0 Hz. However, the QLg variation in the Gyeonggi Massif (GM) differs from that in the other two massifs between 0.3 and 3.0 Hz.
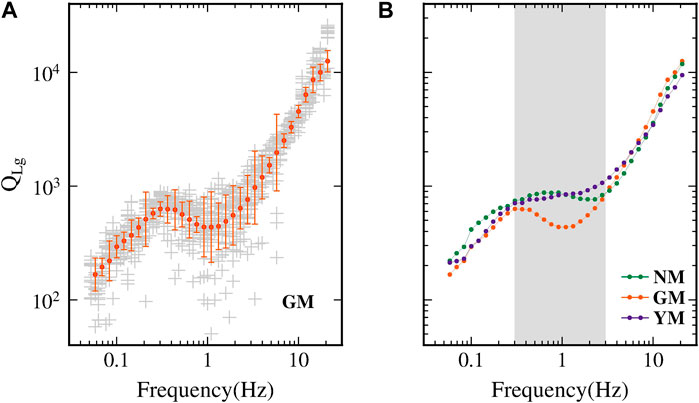
Figure 6. (A) Frequency dependence of the QLg values for the Gyeonggi Massif (GM), where the average QLg values (circles) and their standard deviations (error bars) are obtained based on the tomographic QLg values (gray crosses) at reference frequencies. (B) Average QLg versus frequency for the Nangrim Massif (NM), Gyeonggi Massif (GM), and Yeongnam Massif (YM).
Figure 7 shows a comparison of the resulting broadband QLg with the surface topography, crustal thickness, and seismicity. The Lg attenuation variations indicate changes in the crustal waveguide and crustal physical properties across the three massifs. The boundary between the NM and GM corresponds to low QLg values of approximately 1.0 Hz (Figures 7C, D). QLg usually decreases with decreasing crustal thickness (Zhao et al., 2010; 2013). Numerical simulation studies have shown that the seismic Lg wave attenuates with crustal thinning along the waveguide (e.g., Hong et al., 2008). However, the abnormally low QLg for the GM does not correspond to a significant Moho depth increase in the Korean Peninsula (Figure 7B). Therefore, the Lg attenuation is not strongly affected by a smooth anomaly in the Moho depth (Campillo, 1987). The thickness variation in the crustal waveguide is not the main factor affecting the QLg on the Korean Peninsula. Strong seismicity can be observed in the uppermost mantle beneath the low-QLg crust at approximately 38.5°N (Figure 7B). Therefore, the low-QLg region, located at the boundary between the NM and the GM, can be attributed to complex tectonic sutrue between two ancient plates (the North China Craton and the South China Block), where the crustal structure has been strongly influenced by tectonic processes, including the extension of the Sulu collision Belt (Chough et al., 2000; Zhai et al., 2019).
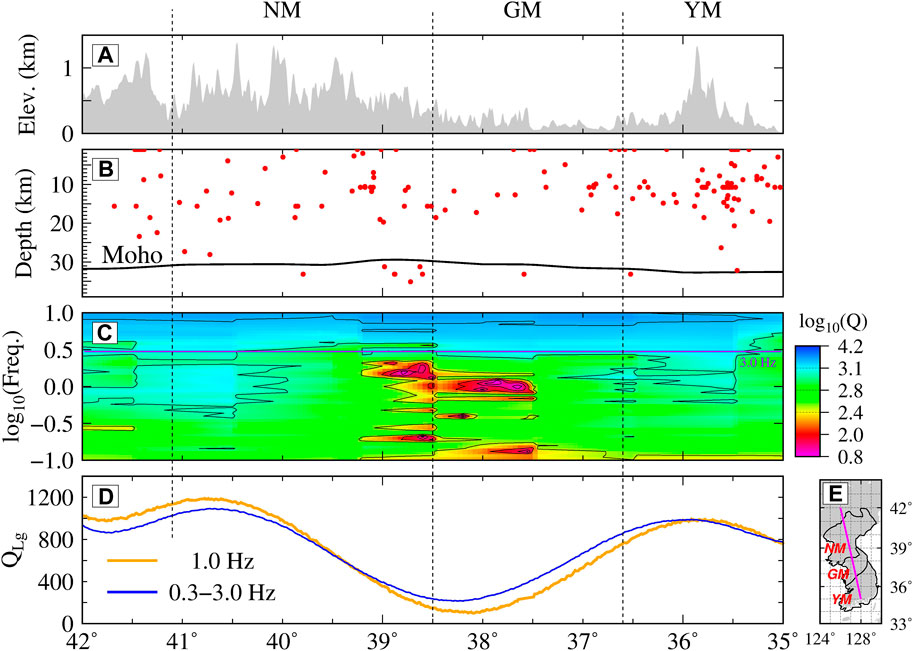
Figure 7. Cross-sections through three massifs, NM, GM, and YM, on the Korean Peninsula showing (A) surface topography, (B) Moho depth (black) and seismicity (red dot), (C) QLg versus frequency, (D) variations in the average QLg between 0.3 and 3.0 Hz and Q0, and (D) the location of the cross-section between (126°E, 42°N) and (128°E, 35°N). The vertical black dashed lines represent the massif boundaries on the cross-section. The Moho depth was extracted from CRUST 1.0 (Laske et al., 2012). The seismicities of earthquakes with magnitudes higher than 1.0 are plotted for the period between 1968 and 2023.
4.2 Lg-wave source spectra
During the joint inversion, the Lg-wave source excitation spectral amplitudes at 66 discrete frequencies are calculated for all events. The source parameters are obtained by fitting the resulting Lg excitation spectra (Zhao et al., 2010; 2013; He et al., 2020). We calculated the scalar seismic moment
where
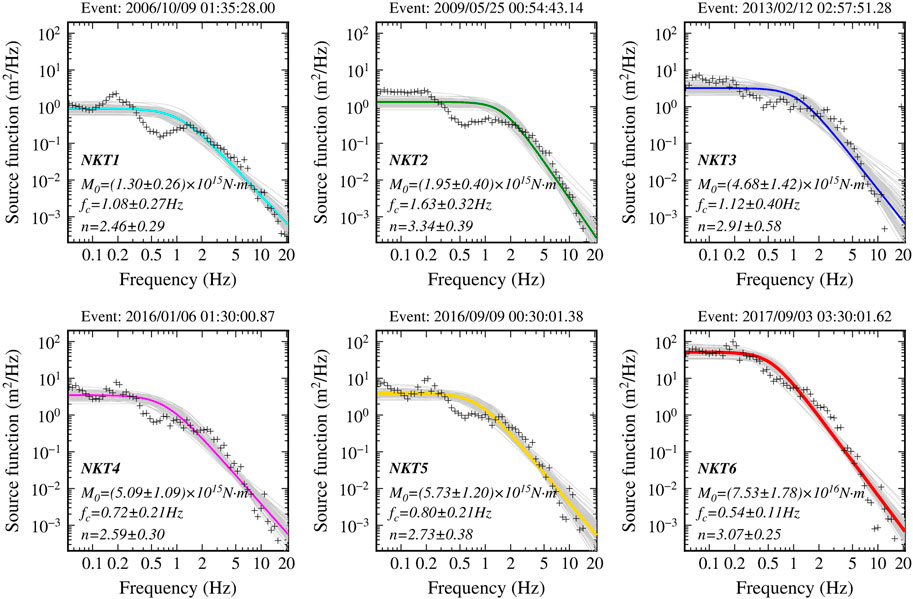
Figure 8. Retrieved Lg-source excitation spectra for NKT1-6. The black crosses are direct inversion results. The solid-colored lines are the best-fit source models, and the shaded areas are their standard deviations. The resulting
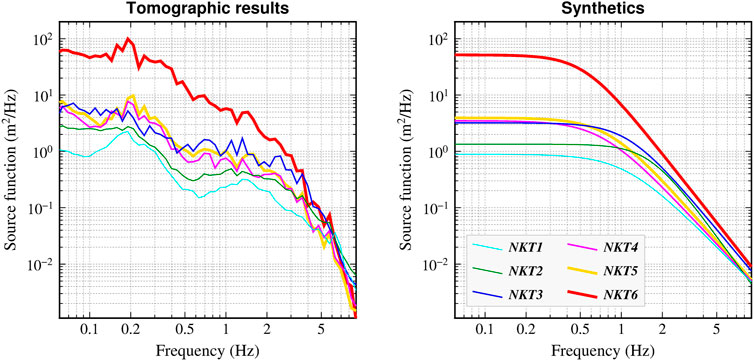
Figure 9. Comparisons between the retrieved (left) and best-fit (right) source models.
Figure 10 shows a comparison between the seismic moment
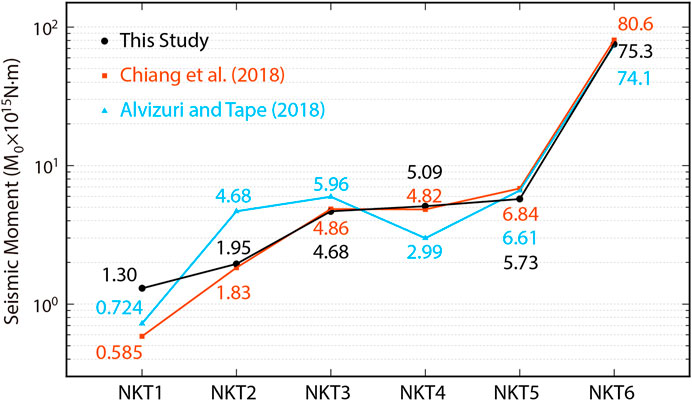
Figure 10. Scalar seismic moments compared with other results.
4.3 Yield estimation
Pasyanos (2022) estimated the yields of NKT1-6 by utilizing the seismic moment function of Denny and Johnson (1991), in which the moment is proportional to the yield. Replacing the units of yield from kilotons to joules, the moment-to-yield ratio (
where the material properties (
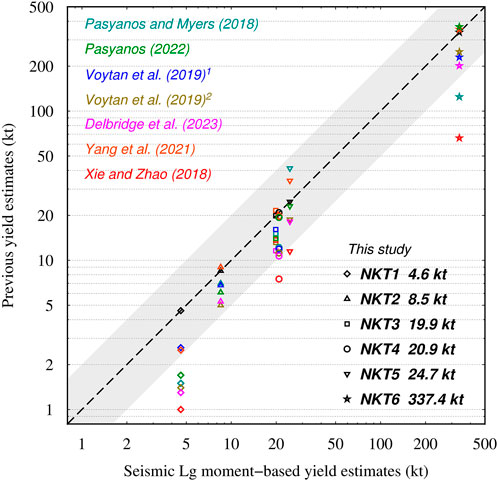
Figure 11. Comparison of the results of yield estimates from different studies. Different symbols indicate North Korean nuclear tests NKT1-6, whereas different colors indicate different methods, including regional waveform envelopes (Pasyanos and Myers, 2018), seismic moments (Chiang et al., 2018; Pasyanos, 2022), waveform equalization to teleseismic P and regional Pn seismograms and high-frequency (>4.0 Hz) P waves (Voytan et al., 2019), coda spectral ratios (Delbridge et al., 2023), NEIC mb after burial depth correction (Yang et al., 2021), and mb (Lg) (Xie and Zhao, 2018). The gray shading represents 0.5 to 2 times the deviation range of the yield estimations obtained in this study.
Figure 11 shows a comparison between the yield estimation results for NKT1-6 above and several other estimates based on (1) regional waveform envelopes (Pasyanos and Myers, 2018), (2) the seismic moment using the formula of Pasyanos (2022) with
5 Discussion and conclusion
Based on 2022 vertical-component digital seismograms recorded at 93 stations from 155 seismic events over the past decade, we develop a new broadband Lg-wave attenuation (QLg) model for the Korean Peninsula and its surrounding regions, which has a relatively dense ray path distribution (e.g., Zhao et al. (2010)). The QLg lateral variations correlate with the geological units well. We directly removed the attenuation effect from the observed spectra to obtain the
The corner frequency may directly cause bias between mb(P) and mb (Lg) values and hence lead to lower estimated yields. Pasyanos (2022) suggested that the mb (Lg) value is not equivalent and is often significantly biased relative to teleseismic mb. Several previous studies have shown that mb (Lg)-derived yield estimations are smaller than the results of mb(P) for NKT (Zhao et al., 2016; Zhao et al., 2017; Xie and Zhao, 2018; Yao et al., 2018) and the five historical nuclear tests at the Semipalatinsk nuclear test site in the Soviet Union (Ma et al., 2020). Following burial depth corrections, the absolute yields re-estimated (Xie and Zhao, 2018) by mb (Lg) were close to the teleseismic observations (Yang et al., 2021) for NKT1-3; however, they were still significantly lower for NKT4-6. The Lg-wave corner frequencies of NKT1-3 are greater than 1.0 Hz; however, those of NKT4-6 are less than 1.0 Hz (Figure 8). The
The amount of energy associated with larger explosions is more concentrated at low frequencies, and the source spectra of high-yield explosions fall faster with increasing frequency than do those of low-yield explosions. Thus,
Data availability statement
The original contributions presented in the study are included in the article/Supplementary Material, further inquiries can be directed to the corresponding author.
Author contributions
YL: Formal Analysis, Funding acquisition, Investigation, Methodology, Validation, Visualization, Writing–original draft. L-FZ: Conceptualization, Data curation, Formal Analysis, Funding acquisition, Methodology, Software, Supervision, Writing–review and editing. X-LP: Conceptualization, Funding acquisition, Investigation, Project administration, Supervision, Writing–review and editing. Z-XY: Methodology, Software, Supervision, Writing–review and editing.
Funding
The author(s) declare that financial support was received for the research, authorship, and/or publication of this article. The National Natural Science Foundation of China (U2139206, 41974054, and 41974061).
Acknowledgments
The comments from Editor K. H. Liu and two reviewers are valuable and greatly improved this manuscript. This research was supported by the National Natural Science Foundation of China (U2139206, 41974054, and 41974061). The broadband waveform data used in this study were collected from the Incorporated Research Institutions for Seismology Data Management Center (IRIS-DMC) and are available at https://ds.iris.edu/wilber3/find_event (last accessed October 2023). Certain figures were generated using the Generic Mapping Tools (GMT; https://www.generic-mapping-tools.org/).
Conflict of interest
The authors declare that the research was conducted in the absence of any commercial or financial relationships that could be construed as a potential conflict of interest.
Publisher’s note
All claims expressed in this article are solely those of the authors and do not necessarily represent those of their affiliated organizations, or those of the publisher, the editors and the reviewers. Any product that may be evaluated in this article, or claim that may be made by its manufacturer, is not guaranteed or endorsed by the publisher.
Supplementary material
The Supplementary Material for this article can be found online at: https://www.frontiersin.org/articles/10.3389/feart.2024.1386932/full#supplementary-material
References
Aki, K. (1982). Scattering and attenuation. Bull. Seismol. Soc. Am. 72, S319–S330. doi:10.1785/BSSA07206B0319
Aki, K., and Richards, P. G. (2002). Quantitative seismology. 2nd ed. Melville, NY, USA: University Science Books.
Alvizuri, C., and Tape, C. (2018). Full moment tensor analysis of nuclear explosions in North Korea. Seismol. Res. Lett. 89, 2139–2151. doi:10.1785/0220180158
Bowers, D., Marshall, P. D., and Douglas, A. (2001). The level of deterrence provided by data from the SPITS seismometer array to possible violations of the Comprehensive Test Ban in the Novaya Zemlya region. Geophys. J. Int. 146, 425–438. doi:10.1046/j.1365-246x.2001.01462.x
Brune, J. N. (1970). Tectonic stress and the spectra of seismic shear waves from earthquakes. J. Geophys. Res. 75, 4997–5009. doi:10.1029/JB075i026p04997
Campillo, M. (1987). Lg wave propagation in a laterally varying crust and the distribution of the apparent quality factor in central France. J. Geophys. Res. 92, 12604–12614. doi:10.1029/JB092iB12p12604
Campillo, M. (1990). Propagation and attenuation characteristics of the crustal phase Lg. Pure Appl. Geophys. 132, 1–19. doi:10.1007/BF00874355
Chiang, A., Ichinose, G. A., Dreger, D. S., Ford, S. R., Matzel, E. M., Myers, S. C., et al. (2018). Moment tensor source-type analysis for the Democratic People’s Republic of Korea–declared nuclear explosions (2006–2017) and 3 september 2017 collapse event. Seismol. Res. Lett. 89, 2152–2165. doi:10.1785/0220180130
Chough, S. K., Kwon, S. T., Ree, J. H., and Choi, D. K. (2000). Tectonic and sedimentary evolution of the Korean peninsula: a review and new view. Earth-Sci. Rev. 52, 175–235. doi:10.1016/S0012-8252(00)00029-5
Delbridge, B. G., Carmichael, J. D., Phillips, W. S., Cleveland, K. M., Begnaud, M. L., and Gammans, C. (2023). Source characterization of the declared North Korean nuclear tests from regional distance coda wave spectral ratios. J. Geophys. Res. 128, e2022JB024728. doi:10.1029/2022JB024728
Denny, M. D., and Johnson, L. R. (1991). The explosion seismic source function: models and scaling laws reviewed. Explos. Source Phenomenol. 65, 1–24. Am.Geophys.Monograph. doi:10.1029/GM065p0001
Ford, S. R., Dreger, D. S., and Walter, W. R. (2009). Source analysis of the memorial day explosion, kimchaek, North Korea. Geophys. Res. Lett. 36. doi:10.1029/2009gl040003
He, X., Zhao, L.-F., Xie, X.-B., Shen, L., Wang, W.-M., and Yao, Z.-X. (2020). Stress drop assessment of the August 8, 2017, Jiuzhaigou earthquake sequence and its tectonic implications. Earthq. Sci. 33, 161–176. doi:10.29382/eqs-2020-0161-01
Hong, T.-K., Baag, C.-E., Choi, H., and Sheen, D.-H. (2008). Regional seismic observations of the 9 October 2006 underground nuclear explosion in North Korea and the influence of crustal structure on regional phases. J. Geophys. Res. 113. doi:10.1029/2007JB004950
Kim, S. G., Gitterman, Y., and Lee, S.-k. (2019). Depth calculation for the January 06, 2016, the September 09, 2016 and the September 03, 2017 nuclear tests of North Korea from detailed depth phases using regional and teleseismic arrays. Pure Appl. Geophys. 176, 133–146. doi:10.1007/s00024-018-1958-y
Laske, G., Masters, G., Ma, Z., and Pasyanos, M. (2012). Crust1.0: an updated global model of Earth's crust. Geophys. Res. Abs. 14, 3743.
Luo, Y., Zhao, L., Ge, Z.-X., Xie, X.-B., and Yao, Z.-X. (2021). Crustal Lg-wave attenuation in Southeast Asia and its implications for regional tectonic evolution. Geophys. J. Int. 226, 1873–1884. doi:10.1093/gji/ggab122
Ma, X., Zhao, L., Xie, X.-B., He, X., and Yao, Z.-X. (2020). Regional seismic characteristics of chemical explosions on the eastern margin of the Junggar basin, northwest China, and of historical Semipalatinsk nuclear tests. Bull. Seismol. Soc. Am. 111, 606–620. doi:10.1785/0120200151
Morgan, J. V., Christeson, G. L., and Zelt, C. A. (2002). Testing the resolution of a 3D velocity tomogram across the Chicxulub crater. Tectonophysics 355, 215–226. doi:10.1016/S0040-1951(02)00143-9
Mueller, R. A., and Murphy, J. R. (1971). Seismic characteristics of underground nuclear detonations: Part I. Seismic spectrum scaling. Bull. Seismol. Soc. Am. 61, 1675–1692. doi:10.1785/BSSA0610061675
Ottemöller, L., Shapiro, N. M., Krishna Singh, S., and Pacheco, J. F. (2002). Lateral variation of Lg wave propagation in southern Mexico. J. Geophys. Res. 107, ESE 3–13. doi:10.1029/2001JB000206
Paige, C. C., and Saunders, M. A. J. A. T. M. S. (1982). Lsqr: an algorithm for sparse linear equations and sparse least squares. ACM Trans. Math. Softw. 8, 43–71. doi:10.1145/355984.355989
Pasyanos, M. E. (2022). Estimating explosion yields using moment tensor solutions and seismic moment. Seismol. Res. Lett. 93, 2230–2238. doi:10.1785/0220220032
Pasyanos, M. E., and Chiang, A. (2021). Full moment tensor solutions of U.S. underground nuclear tests for event screening and yield estimation. Bull. Seismol. Soc. Am. 112, 538–552. doi:10.1785/0120210167
Pasyanos, M. E., and Myers, S. C. (2018). The coupled location/depth/yield problem for North Korea’s declared nuclear tests. Seismol. Res. Lett. 89, 2059–2067. doi:10.1785/0220180109
Pasyanos, M. E., Walter, W. R., and Mayeda, K. M. (2012). Exploiting regional amplitude envelopes: a case study for earthquakes and explosions in the Korean Peninsula. Bull. Seismol. Soc. Am. 102, 1938–1948. doi:10.1785/0120120012
Patton, H. J., and Taylor, S. R. (2011). The apparent explosion moment: inferences of volumetric moment due to source medium damage by underground nuclear explosions. J. Geophys. Res. 116, B03310. doi:10.1029/2010JB007937
Ranasinghe, N., Gallegos, A., Trujillo, A., Blanchette, A., Sandvol, E., Ni, J., et al. (2014). Lg attenuation in northeast China using NECESSArray data. Geophys. J. Int. 200, 67–76. doi:10.1093/gji/ggu375
Sereno Jr, T. J., Bratt, S. R., and Bache, T. C. (1988). Simultaneous inversion of regional wave spectra for attenuation and seismic moment in Scandinavia. J. Geophys. Res. 93, 2019–2035. doi:10.1029/JB093iB03p02019
Shen, L., Zhao, L.-F., Xie, X.-B., Yang, G., and Yao, Z.-X. (2023). Extremely weak Lg attenuation reveals ancient continental relicts in the South China block. Earth Planet Sci. Lett. 611, 118144. doi:10.1016/j.epsl.2023.118144
Stevens, J. L., and Day, S. M. (1985). The physical basis of m<sub>b</sub>: M<sub>s</sub> and variable frequency magnitude methods for earthquake/explosion discrimination. J. Geophys. Res. 90, 3009–3020. doi:10.1029/JB090iB04p03009
Street, R. L., Herrmann, R. B., and Nuttli, O. W. (1975). Spectral characteristics of the Lg wave generated by central United States earthquakes. Geophys. J. Int. 41, 51–63. doi:10.1111/j.1365-246X.1975.tb05484.x
Voytan, D. P., Lay, T., Chaves, E. J., and Ohman, J. T. (2019). Yield estimates for the six North Korean nuclear tests from teleseismic P wave modeling and intercorrelation of P and Pn recordings. J. Geophys. Res. 124, 4916–4939. doi:10.1029/2019JB017418
Wu, R. S., and Aki, K. (1985). Elastic wave scattering by a random medium and the small-scale inhomogeneities in the lithosphere. J. Geophys. Res. 90, 10261–10273. doi:10.1029/JB090iB12p10261
Xie, J., and Mitchell, B. J. (1990). Attenuation of multiphase surface waves in the basin and range province, part I: Lg and Lg coda. Geophys. J. Int. 102, 121–137. doi:10.1111/j.1365-246X.1990.tb00535.x
Xie, X.-B., and Zhao, L. (2018). The seismic characterization of North Korea underground nuclear tests. Chin. J. Geophys. 61, 889–904. doi:10.6038/cjg2018L0677
Yang, G., Zhao, L. F., Xie, X. B., Zhang, L., and Yao, Z. X. (2021). High-precision relocation with the burial depths of the North Korean underground nuclear explosions by combining Pn and Pg differential traveltimes. J. Geophys. Res. 126. doi:10.1029/2020jb020745
Yao, J., Tian, D., Sun, L., and Wen, L. (2018). Source characteristics of North Korea’s 3 September 2017 nuclear test. Seismol. Res. Lett. 89, 2078–2084. doi:10.1785/0220180134
Zelt, C. A. (1998). Lateral velocity resolution from three-dimensional seismic refraction data. Geophys. J. Int. 135, 1101–1112. doi:10.1046/j.1365-246X.1998.00695.x
Zhai, M., Zhang, X.-H., Zhang, Y.-B., Wu, F.-Y., Peng, P., Li, Q.-L., et al. (2019). The geology of North Korea: an overview. Earth-Sci. Rev. 194, 57–96. doi:10.1016/j.earscirev.2019.04.025
Zhang, C. K., Zhang, X. K., Zhao, J. R., Liu, B. F., Zhang, J. S., Yang, Z. X., et al. (2002). Crust-mantle structure of the Changbaishan Tianchi volcanic region and its vicinity: an exploratory study and inferences. Chin. J. Geophys. 45. doi:10.1002/cjg2.301
Zhang, L., Zhao, L., Xie, X.-B., Wu, Q.-J., and Yao, Z.-X. (2022). Lateral variations in crustal Lg attenuation in and around the Hangay Dome, Mongolia. Int. J. Earth. Sci. 111, 591–606. doi:10.1007/s00531-021-02131-8
Zhang, M., and Wen, L. (2013). High-precision location and yield of North Korea's 2013 nuclear test. Geophys. Res. Lett. 40, 2941–2946. doi:10.1002/grl.50607
Zhao, L., and Mousavi, S. M. (2018). Lateral variation of crustal Lg attenuation in eastern North America. Sci. Rep. 8, 7285. doi:10.1038/s41598-018-25649-5
Zhao, L., Xie, X.-B., Wang, W., Na, F., Zhao, X., and Yao, Z. X. (2017). The 9 September 2016 North Korean underground nuclear test. Bull. Seismol. Soc. Am. 107, 3044–3051. doi:10.1785/0120160355
Zhao, L., Xie, X.-B., Wang, W., and Yao, Z.-X. (2008). Regional seismic characteristics of the 9 October 2006 North Korean nuclear test. Bull. Seismol. Soc. Am. 98, 2571–2589. doi:10.1785/0120080128
Zhao, L., Xie, X.-B., Wang, W., and Yao, Z.-X. (2012). Yield estimation of the 25 May 2009 North Korean nuclear explosion. Bull. Seismol. Soc. Am. 102, 467–478. doi:10.1785/0120110163
Zhao, L., Xie, X.-B., Wang, W., and Yao, Z.-X. (2014). The 12 February 2013 North Korean underground nuclear test. Seismol. Res. Lett. 85, 130–134. doi:10.1785/0220130103
Zhao, L., Xie, X.-B., Wang, W., Zhang, J., and Yao, Z.-X. (2010). Seismic Lg-wave Q tomography in and around northeast China. J. Geophys. Res. 115. doi:10.1029/2009JB007157
Zhao, L., Xie, X.-B., Wang, W., Zhang, J., and Yao, Z.-X. (2013). Crustal Lg attenuation within the North China Craton and its surrounding regions. Geophys. J. Int. 195, 513–531. doi:10.1093/gji/ggt235
Zhao, L.-F., and Xie, X.-B. (2016). Strong Lg-wave attenuation in the Middle East continental collision orogenic belt. Tectonophysics 674, 135–146. doi:10.1016/j.tecto.2016.02.025
Zhao, L.-F., Xie, X.-B., He, X., Shen, L., Zhang, L., and Yao, Z.-X. (2022). Seismic Lg-wave attenuation tomography: method, algorithm, data processing flow and application. Rev. Geophys. Planet. Phys. 53 (6), 721–744. (in Chinese). doi:10.19975/j.dqyxx.2022-024
Keywords: seismic attenuation, Lg source spectra, yield estimation, underground nuclear tests, the Korean Peninsula
Citation: Lu Y, Zhao L-F, Pang X-L and Yao Z-X (2024) Yield estimation of North Korean underground nuclear tests using Lg-wave source spectra. Front. Earth Sci. 12:1386932. doi: 10.3389/feart.2024.1386932
Received: 16 February 2024; Accepted: 18 April 2024;
Published: 06 May 2024.
Edited by:
Kelly Hong Liu, Missouri University of Science and Technology, United StatesReviewed by:
Xueyang Bao, Southern University of Science and Technology, ChinaChandrani Singh, Indian Institute of Technology Kharagpur, India
Copyright © 2024 Lu, Zhao, Pang and Yao. This is an open-access article distributed under the terms of the Creative Commons Attribution License (CC BY). The use, distribution or reproduction in other forums is permitted, provided the original author(s) and the copyright owner(s) are credited and that the original publication in this journal is cited, in accordance with accepted academic practice. No use, distribution or reproduction is permitted which does not comply with these terms.
*Correspondence: Lian-Feng Zhao, emhhb2xmQG1haWwuaWdnY2FzLmFjLmNu; Xin-Liang Pang, cGFuZ3hpbmxpYW5nQHNpbmEuY29t