
94% of researchers rate our articles as excellent or good
Learn more about the work of our research integrity team to safeguard the quality of each article we publish.
Find out more
ORIGINAL RESEARCH article
Front. Earth Sci., 14 June 2024
Sec. Atmospheric Science
Volume 12 - 2024 | https://doi.org/10.3389/feart.2024.1377715
 Liang Jin1,2,3
 Chunlei Liu1,2,3,4*
 Ning Cao1,2,3*
 Xiaoqing Liao1,2,3,4
 Yufeng Xue1,2,3Ruijuan Bao5
 Lingli Fan1,2,3
 Lingjing Zhu1,2,3Qianye Su1,2,3
 Ke Yang1,2,3
 Rong Zheng1,2,3Shujie Chang1,2,3
 Mei Liang1,2,3
The western Pacific warm pool (WPWP) is a major thermal driver of atmospheric deep convection and global atmospheric circulation in the tropics, and changes in its ocean heat content (OHC) affect the local and global climates. Four state-of-the-art ocean reanalyses and one objective analysis were used to study the variations in the WPWP OHC, ocean heat content tendency (OHCT), and ocean heat transport (OHT). The variabilities of both the OHC and OHCT integrated from 0 to 300 m are consistent between the datasets and are closely related to the El-Niño southern oscillation cycle. The integrated OHC from 0 to 2000 m shows an overall increasing trend in the WPWP. The WPWP mainly gains heat from the eastern boundary and loses heat from the northern boundary. The heat transport through the eastern boundary of the WPWP is mainly facilitated by the westward flowing south and north equatorial currents as well as the equatorial countercurrent around the depth of the thermocline, whereas the OHT at the northern boundary is mainly driven by the western boundary current of the Pacific Ocean, which shows complex flow structures.
The western Pacific warm pool (WPWP) is a region with a relatively higher temperature compared to its surrounding areas; its mean sea-surface temperature (SST) is above 28°C all year round (Levitus, 1982), which is a major thermal driver of atmospheric deep convection and global atmospheric circulation in the tropics (Bjerknes, 1969). Therefore, changes in WPWP ocean heat content (OHC) have significant impacts on the global atmosphere and ocean circulations. Garcia (1983) noted that the location variability of the WPWP’s high-temperature center would have a profound impact on the temporal and spatial changes in convection over the tropical regions. The convective heating above the warm pool maintains the energy cycle of the Walker circulation and drives the anomalies of the local Hadley circulation, affecting the global climate (Dayem et al., 2007; Williams and Funk, 2011; Kim et al., 2020). The variations in the thermal state of the WPWP have important impacts on the interannual variability of the western Pacific subtropical high through the East Asia/Pacific (EAP) teleconnection propagating eastward along East Asia (Chen and Huang, 2008; Huang and Wang, 2010). The OHC change in the WPWP is also closely related to heat convergence and divergence in the tropical Pacific and El-Niño southern oscillation (ENSO) processes (Hu and Hu, 2014; Mayer et al., 2014; Hu et al., 2017; Wu et al., 2018; Cheng et al., 2019).
Recent studies have shown that the frequency and duration of ocean heat anomalies in the surface and subsurface layers of the WPWP region over the past few decades have increased significantly and that the ocean heat anomalies in this region are mainly driven by ocean–atmosphere dynamic processes related to ENSO events (Holbrook et al., 2021; Huang et al., 2021; Spillman et al., 2021; Lee et al., 2022; Zhang et al., 2022). The OHC in the WPWP has significant interannual variations and is closely related to the precipitations in the surrounding regions, which can be used as predictive indicators of the precipitations in these regions (Ren et al., 2018; Zheng et al., 2018). The OHC changes along the thermocline near the WPWP were also used as indicators to predict the frequency of tropical cyclones landfalling along the coastal areas of China (Sparks and Toumi, 2020; Liu et al., 2023). Additionally, it was found that the earlier onset of the South China Sea summer monsoons after the late 1990s were likely caused by the warming of the WPWP and enhancement of convective activity over the WPWP during the corresponding period (Huangfu et al., 2017). Therefore, the OHC changes in the WPWP play important roles in many aspects of global climate change.
The WPWP formation is the result of regulation of large-scale ocean–atmospheric dynamic processes (Clement et al., 2005). Pierrehumbert (1995) affirmed the role of ocean heat transport (OHT) in maintaining the WPWP. Wyrtki (1989) argued that the changes in the warm pool are the result of interactions between the subtropical circulations in the southern and northern hemispheres and that the OHC flowing through the warm pool area plays an important role in maintaining the warm pool itself. Studies have shown that the SST anomalies of the north equatorial warm currents flowing westward are an important cause of the corresponding SST anomalies in the WPWP (Yang et al., 2019). The anomalous meridional flows in the upper layers of the equatorial western Pacific and equatorial central Pacific are also important driving forces for OHC changes in the WPWP (Qi et al., 2010). Hu and Hu (2014) as well as Hu et al. (2017) argued that the ocean circulation in the WPWP region is related to the ENSO cycle; therefore, investigating the OHC changes and OHTs of the WPWP can provide a better understanding of its relationship with ENSO processes.
Four state-of-the-art ocean reanalysis datasets were employed in this study to investigate the changes in the WPWP OHC, OHC tendency (OHCT), and OHT as well as explore the relationships between the OHC, OHCT, OHT, and ENSO. The remainder of this manuscript is organized as follows. Section 2 introduces the datasets and methods used in the study. Section 3 presents the OHC, OHCT, and OHT results in the WPWP, and Section 4 presents the discussion and conclusions of this work.
Four ocean reanalysis datasets, including the Ocean Reanalysis System 5 (ORAS5), Global Ocean Reanalysis and Simulations version 4 (GLORYS), Simple Ocean Data Assimilation version 3 (SODA3), and Global Ocean Data Assimilation System (GODAS), having high temporal and spatial resolutions, were selected for this study. The objective analysis product from the Institute of Atmospheric Physics (IAP) at the Chinese Academy of Sciences was also used for comparisons. All data were considered as monthly means, and the brief descriptions of the datasets are listed in Table 1.
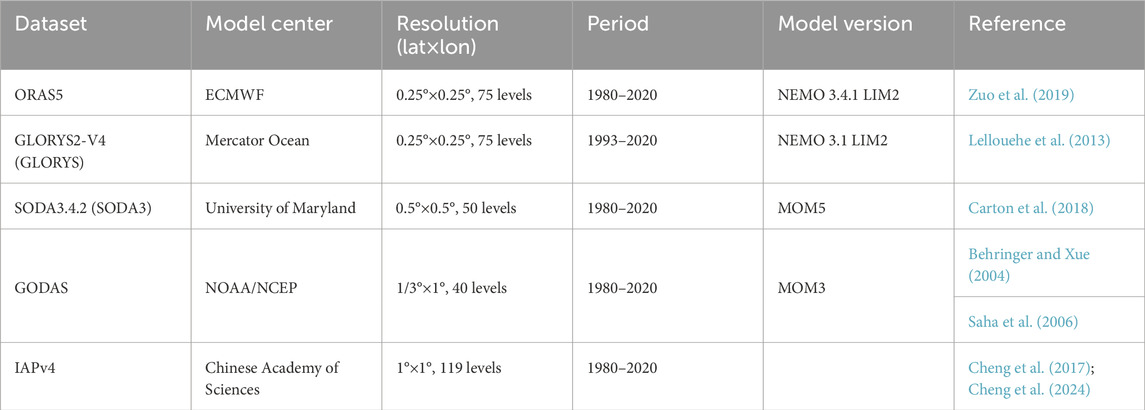
Table 1. Dataset and brief descriptions.
ORAS5 is an upgraded product of the ORAP5 from the ECMWF (Zuo et al., 2017, 2019) that uses the Nucleus for European Modelling of the Ocean (NEMO) model (Madec and the NEMO System Team, 2023) along with the NEMOVAR ocean assimilation system (Mogensen et al., 2012). NEMOVAR uses the 3D-Var FGAT (First Guess at Appropriate Time) assimilation technique to assimilate the sub-surface temperature, salinity, sea-ice concentration and sea-level anomalies. The ORAS5 data are forced by either global atmospheric reanalysis or ECMWF/IFS operational analysis and are also constrained by the observational data of the SSTs, sea-surface salinity, sea-ice concentrations, global-mean-sea-level trends, and climatological variations in the ocean mass. The ERA-interim atmospheric forcing and reprocessed observations over 1979–2014 were used along with the near real-time ORAS5 products using the ECMWF operational atmospheric forcing and near real-time observations, which have been available since 2015. The data have an eddy-permitting horizontal resolution of 0.25°×0.25° with 75 vertical levels.
GLORYS is a global ocean data assimilation reanalysis system implemented under the MyOcean framework with the aim of simulating the global ocean using a high-resolution grid under the constraint of assimilated data (Lellouche et al., 2013). The latest version of GLORYS2V4 spans the altimeter and Argo era from 1993 to present. The NEMO approach is implemented on the ORCA025 grid (horizontal resolution of 0.25°×0.25°, 75 vertical levels) and is coupled with the sea-ice model LIM2. The system uses a reduced-order Kalman filter assimilation scheme along with 3D-var for temperature and salinity error corrections. The model is forced by the ERA-interim.
SODA3.4.2 is the latest version of the SODA ocean reanalysis conducted at the University of Maryland (Carton et al., 2018). SODA3 is built on the Modular Ocean Model v5 (MOM5), which is the ocean component of the Geophysical Fluid Dynamics Laboratory CM2.5 coupled model (with a horizontal resolution of 0.5°×0.5° and 50 vertical levels); it also uses the ERA-interim forcing.
GODAS is used as the replacement for the previous version of the NCEP Pacific Ocean Data Assimilation System (ODAS) (Saha et al., 2006) and is based on a quasiglobal configuration of the GFDL MOM v3 (horizontal resolution of 1°×1/3°, 40 vertical levels). GODAS is forced by the momentum, heat, and freshwater fluxes from the NCEP atmospheric reanalysis 2. The temperature and synthetic salinity profiles are assimilated, and the 3D-var scheme is used.
The fourth version of the OHC objective analysis product (IAPv4) is developed by the Institute of Atmospheric Physics and accounts for the recent developments in quality control (QC) procedures, climatology, and bias corrections. The IAPv4 has a horizontal resolution of 1°×1° and 119 vertical levels. Compared with IAPv3, the data quality of the new version is greatly improved (Cheng et al., 2017; Cheng et al., 2024).
Following Liu et al. (2023), the OHC in a grid box was calculated using the seawater potential temperature by the following equation:
where A is the horizontal area of the grid box, ρ is the density of seawater,
The OHCT is defined as the first derivative of the OHC and is calculated by the central difference as follows:
where i denotes a particular month, ti-1 and ti+1 denote the time instances one month before and after the month i, respectively.
The northward OHT at a given latitude θ can be estimated as per Hall and Bryden (1982):
where R is the radius of the Earth (in m), φ is the longitude, and v is the northward component of the current velocity. The reference temperature
Similarly, the eastward OHT at a given longitude φ is estimated as
where u is the eastward component of the current velocity.
Although the WPWP boundaries vary with time, a fixed region (10°S to 20°N, 110°E to 165°E) was selected (Figure 1) as the study area based on the time mean SST above 28.5°C and distance from the Australian continent to facilitate the study on changes in the OHC and OHT. The reference temperature
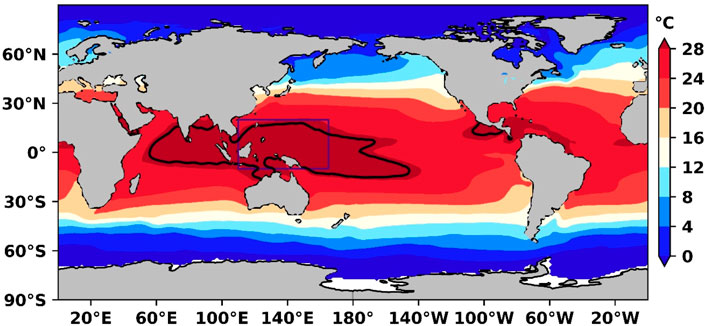
Figure 1. Multiannual mean sea-surface temperature (SST) spatial distribution over 1993–2020. The black contour line is the 28.5°C isotherm of the SST, and the rectangular box is the western Pacific warm pool (WPWP) area (10°S to 20°N, 110°E to 165°E) selected for this study.
The 12-month running mean WPWP OHC and OHCT time series from the five datasets are plotted in Figure 2. The OHC is shown on the left column, and the OHCT is shown on the right column. The time series ranges from 1980 to 2020, except for the GLORYS data that spans from 1993 to 2020. The time series of the OHC and OHCT from the five datasets are very consistent over 0–300 m (Figures 2A, E); they show slight warming before 1990, following which the OHC dropped for a few years owing to the eruption of Mount Pinatubo in May 1991, and again followed by the El-Niño cycle around 1997/98, when the ocean heat was transported from the WPWP to the eastern Pacific along the thermocline (Xu et al., 2020) and accompanied by a large drop of the OHC in the WPWP. All datasets show overall increasing trends (2.22–3.15 W/m2 in Table 2) during 1993–2010, followed by decreasing trends after 2010 and a large drop in the OHC around the 2010/11 ENSO event. The interannual variations were modulated by the ENSO, and the OHC and MEI have opposite phases. The correlation coefficients between the OHC and MEI are all less than or equal to −0.87 for the two selected time periods (Table 3). Below 300 m, the consistency among the five datasets is not as good as that over 0–300 m (Figures 2B, C), with the GODAS dataset showing a larger discrepancy over the others. There are large differences between the datasets in the range of 700–2000 m before 2005, and the trends from SODA3 and IAPv4 are much smaller than those from ORAS5 and GODAS, although the variability is quite consistent (high correlation coefficients in Table 2). The consistency improved after 2005, when more observations were available with the implementation of the Argo floats (Figure 2C). The GODAS has a spurious high value in January 2018 and merits further investigation. Similar to the variation in the OHC integrated from 0 to 300 m, the variability and trend of the OHC over 0–2000 m follow the MEI well and are mainly derived from the OHC in the top 0–300 m based on a comparison of the variability magnitudes. All datasets show significant warming trends over the different layers between 1993 and 2010, except for the SODA3 and IAPv4 data, which show insignificant trends in the depths between 700 and 2000 m. Most datasets show significant cooling trends in the layer between 0 and 700 m over 2010–2020, while the trends between 700 and 2000 m are significantly positive.
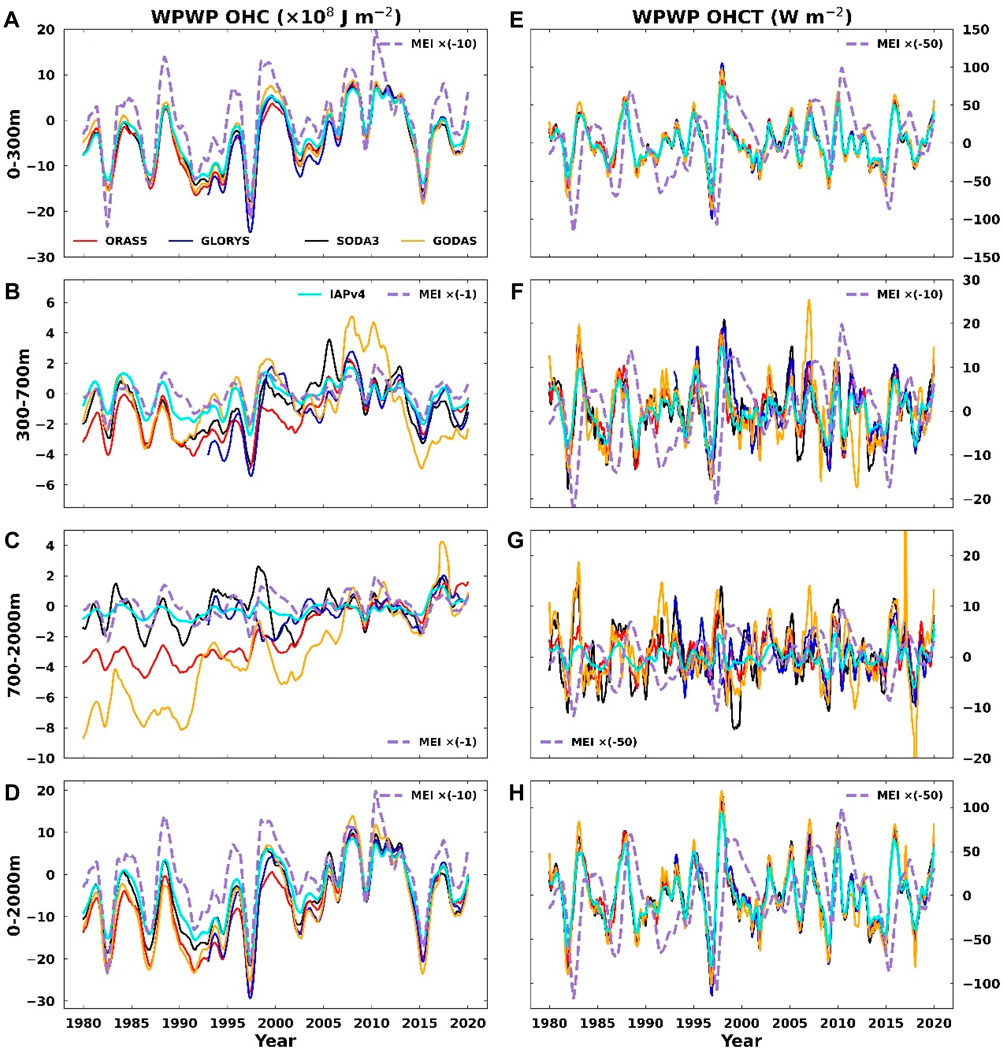
Figure 2. Time series of the WPWP OHC (left column) and its tendency (right column) integrated for 0–300 (A,E), 300–700 (B,F), 700–2000 (C,G) and 0–2000 m (D,H) from 1980–2020 based on four reanalysis datasets, namely SODA3 (black), ORAS5 (red), GLORYS (blue), and GODAS (orange), as well as the IAPv4 (cyan). The GLORYS time series is from 1993 to 2020. It is noted that the MEI is scaled by different factors in different panels for the sake of clarity.
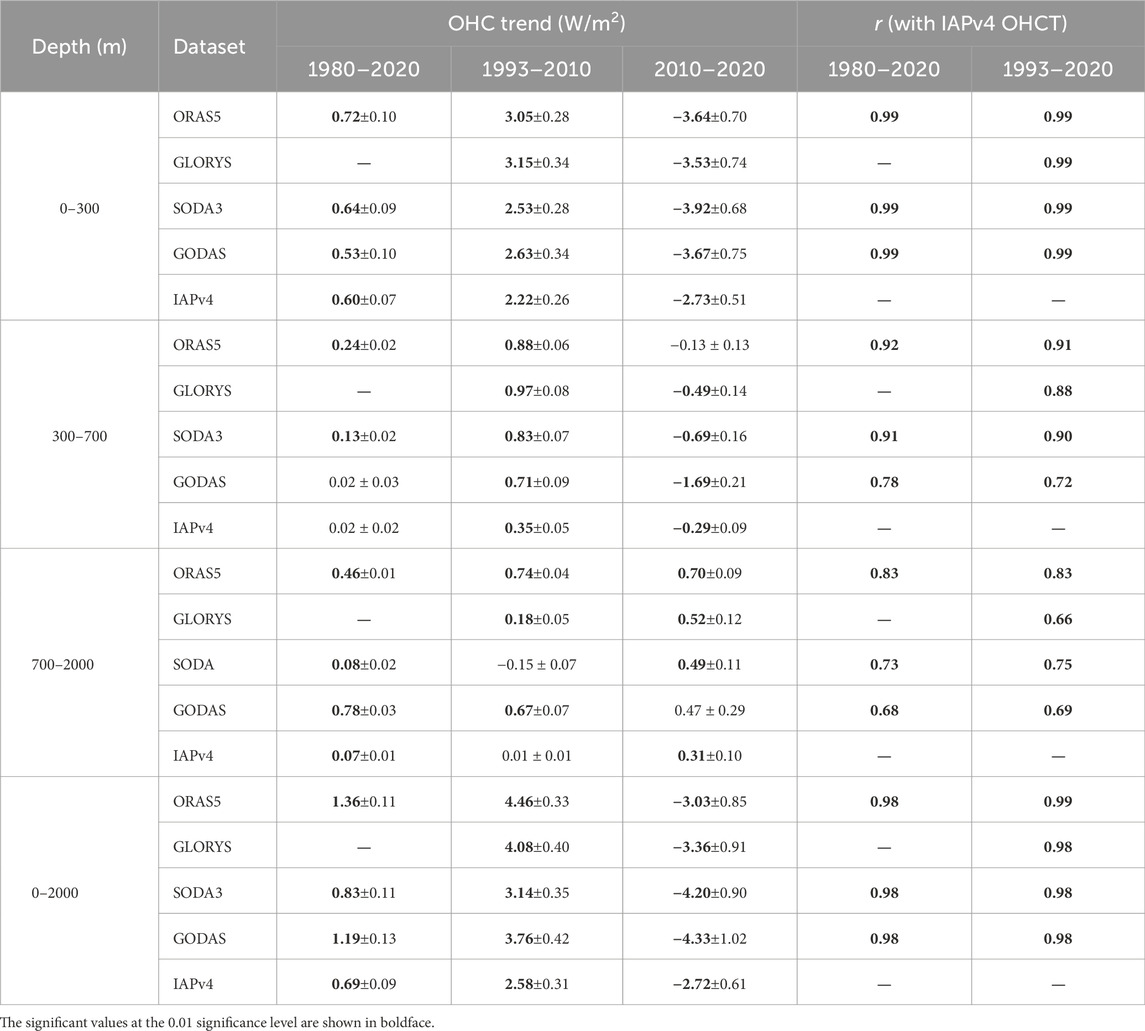
Table 2. OHC trends and correlation coefficients (r) between the IAPv4 OHCT and other datasets.
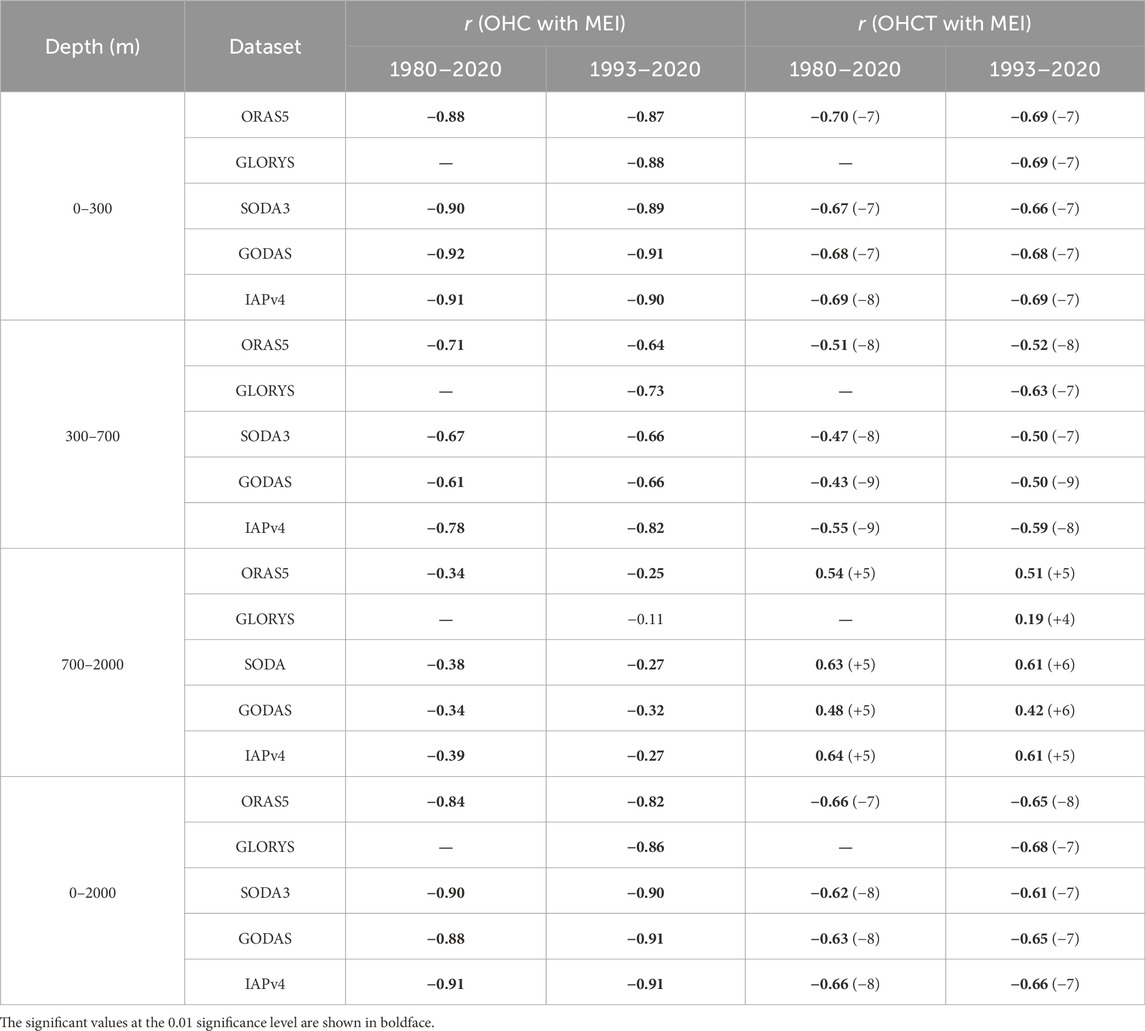
Table 3. Correlation coefficients (r) between the MEI and OHC/OHCT. The lead/lag months are also listed in the parentheses, and the negative values mean that the OHCTs lead the MEIs.
Similar to the OHC, the variability of the OHCT integrated from 0 to 300 m was also very consistent among the datasets (Figure 3E), as confirmed by their correlation coefficient of r = 0.99 over both 1980–2020 and 1993–2020 (Table 2). The OHCT is closely related to the MEI, and the correlation coefficients are all significant; meanwhile, the OHCT leads MEI by approximately 7 months (Table 3). It is interesting to note that the OHCT integrated over 300–700 m is also related to the ENSO cycle and leads the MEI by approximately 7–9 months depending on the selected datasets and time periods. However, the MEI leads the OHCT by 4–6 months between 700 and 2000 m. The OHCT integrated from 0 to 2000 m is similar to that integrated from 0 to 300 m, which dominates the variability of both OHC and OHCT in the top 2000 m of the WPWP.
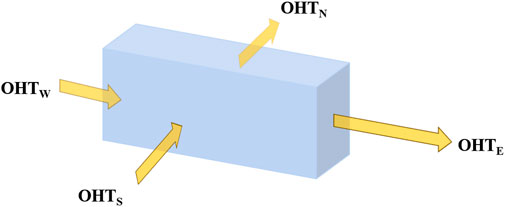
Figure 3. Schematic representation showing ocean heat transport (OHT) through four vertical sections along the boundaries of the WPWP. The northward and eastward OHTs are defined as positive.
To further investigate the causes of the OHC changes in the WPWP, the OHTs through four sections along the WPWP boundaries (Figure 3) were calculated, whose results are plotted in Figure 4. The y-axis in Figure 4 is scaled differently for each panel to show the OHT variability through each boundary. The plots with the same scaling are given in Supplementary Figure S1 for reference. The OHT was integrated from 0 to 2000 m, and the lines are 12-month running means. The eastward and northward OHTs are defined to be positive. The OHTs through the eastern, southern, western, and northern boundaries of the WPWP are denoted as OHTE, OHTS, OHTW, and OHTN, respectively. The OHTN through the northern boundary is all positive (Figure 4A), implying that heat flows away from the WPWP. The multiannual mean OHTN values are 0.95 (ORAS5), 1.17 (GLORYS), 1.22 (SODA3), and 1.13 PW (GODAS) (Table 4). The lines are broadly spread, and the mean standard deviations (STDs) are 0.15 PW over 1980–2020 (three datasets) and 0.58 PW over 1993–2020 (four datasets), with all of them being in phase. The correlation coefficients (r) between the ORAS5 and other datasets are listed in Table 5, and all the values are significant. The correlation coefficients between the OHTN and MEI are small, but most of them are significant (Table 5).
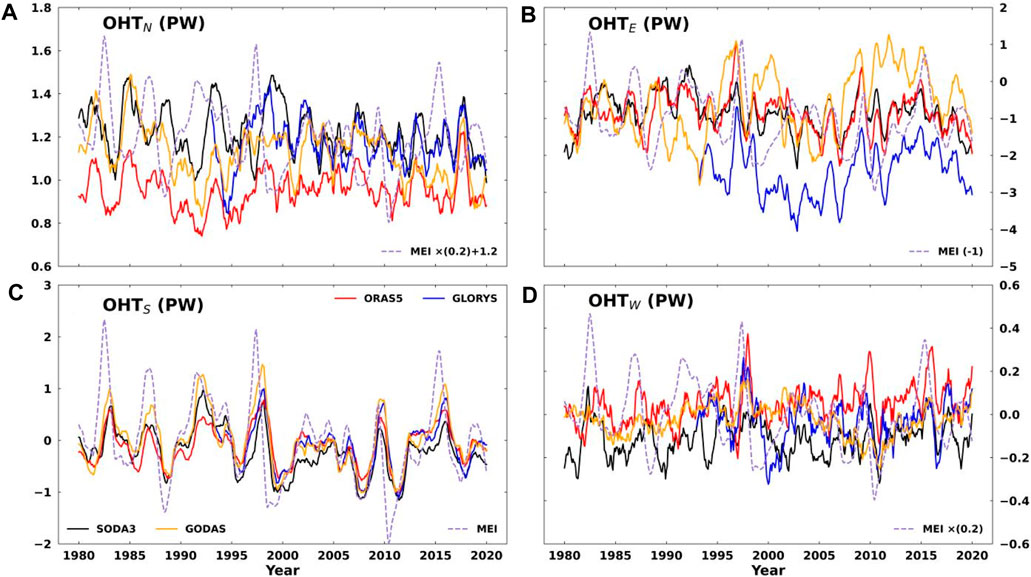
Figure 4. Time series of the OHTs through four sections along the WPWP boundaries. The OHTs are integrated from 0 to 2000 m, and the lines are 12-month running means. The eastward and northward OHTs are defined as positive. It is noted that the MEI is scaled by different factors in different panels for the sake of clarity.
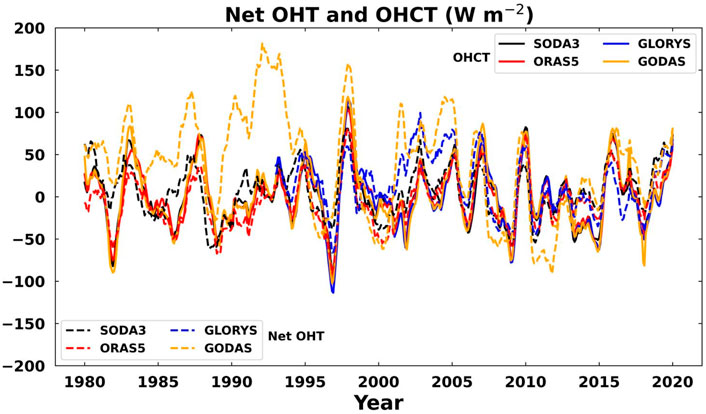
Figure 5. Comparison of the net heat transport in the WPWP divided by the area of the research region with OHCT. Since the OHC is relative to the years 2006–2018, the net heat transport is also relative to this period.
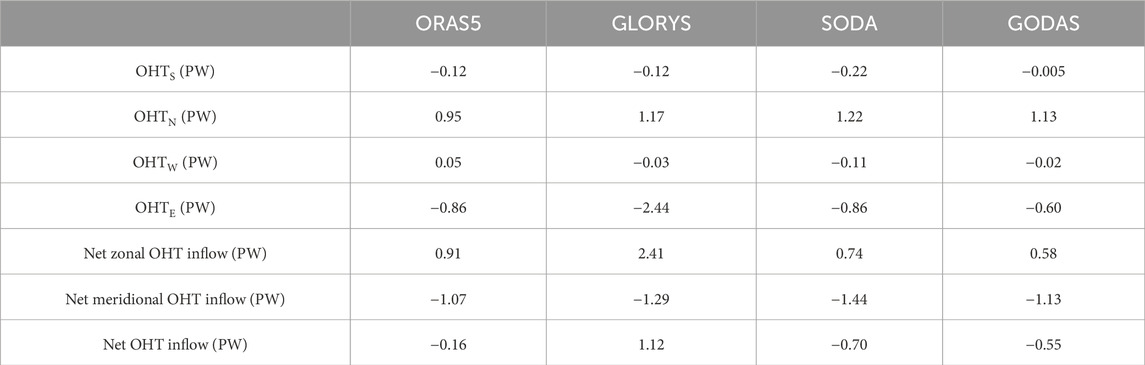
Table 4. Multiannual mean (1993–2020 for GLORYS but 1980–2020 for others) OHT values through the four WPWP boundaries integrated from 0 to 2000 m.
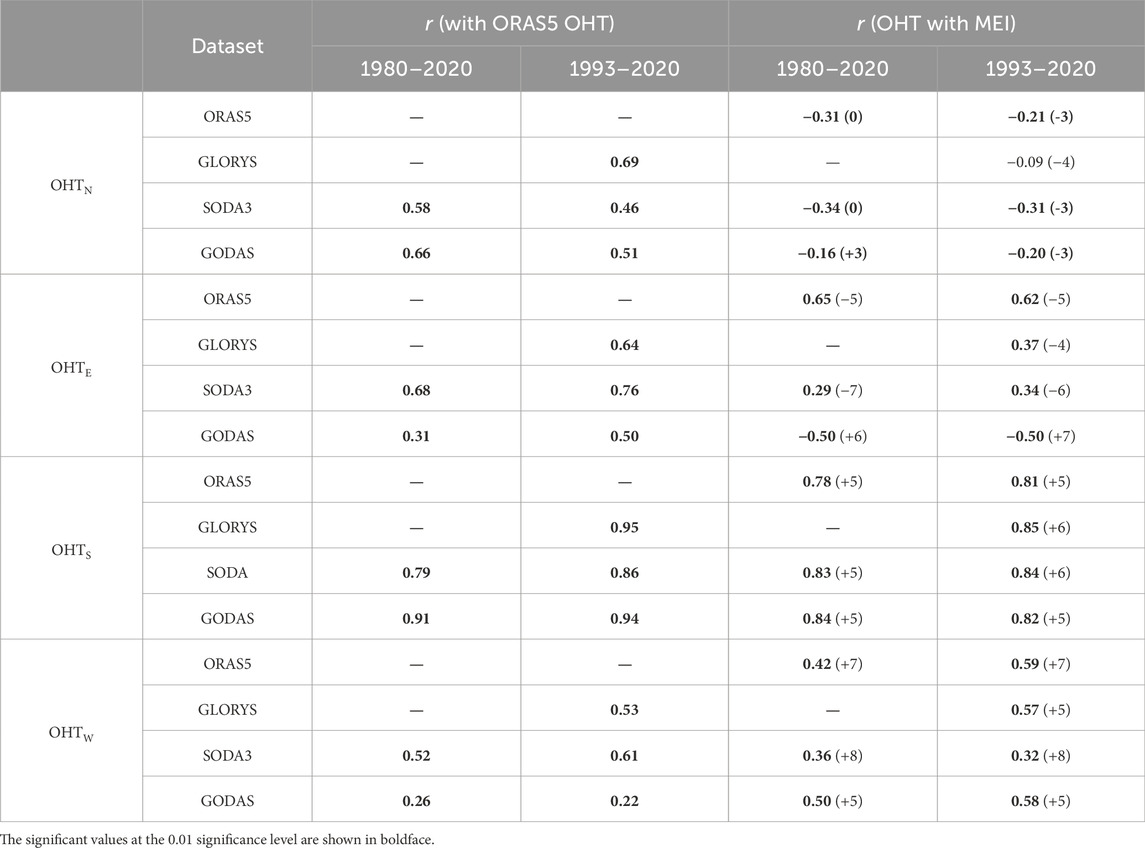
Table 5. Correlation coefficients (r) between ORAS5 OHT and other OHTs, as well as between the OHT and MEI at each boundary. The lead/lag months are also listed in the parentheses, and the negative values mean that the OHTs lead the MEIs.
The OHTE through the eastern boundary shows larger amplitude variability and larger spread (Figure 4B) than those of the OHTN, with the multidataset mean STDs being 0.58 PW (19080–2020) and 0.93 (1993–2020). The multiannual mean OHT values (ORAS5: −0.86 PW, GLORYS: −2.44 PW, SODA3: −0.86 PW, GODAS: −0.60 PW) are all negative, indicating inflow of heat to the WPWP. Therefore, the WPWP mainly gains heat from the eastern boundary and loses heat from the northern boundary. The OHTE time series are in phase with each other and lead the MEIs by 4–7 months except for the GODAS data, where the MEI leads the OHTE (Table 5). Compared with OHTN and OHTE, the multiannual mean OHTS values are −0.12 (ORAS5), −0.12 (GLORYS), −0.22 (SODA3), and −0.005 PW (GODAS). The transport direction is southward, and the amount of heat transported is small compared to those of the north and east sections (Table 4). The STDs are 0.23 PW (1980–2020) and 0.24 PW (1993–2020). The OHTW through the western boundary is also weak (Figure 4D), and its mean values (ORAS5: 0.05 PW, GLORYS: −0.03 PW, SODA3: −0.11 PW, GODAS: −0.02 PW) are quite small. The variability between the datasets is more or less consistent, and this is confirmed by the correlation coefficients (r) between ORAS5 and the other datasets, as listed in Table 5. However, the time series have large spreads compared with their interannual variabilities. The MEI leads both OHTS and OHTW. The net zonal OHT inflow to the WPWP is all positive, and the net meridional OHT inflow to the WPWP is all negative (Table 4). Therefore, the WPWP gains heat from the zonal flows, mainly from the flow through the eastern boundary. It is observed from Table 4 that the net OHT inflow in GLORYS is positive, while the values in the others are negative, with the value being less negative in ORAS5 than the other two. These differences between the estimates may be attributed to the increment in data assimilation, which must be taken into account to reduce uncertainties in future studies.
The net OHT inflow to the WPWP is divided by the section area to obtain the unit of W/m2. The net OHT and OHCT in the WPWP from the four datasets are plotted together in Figure 5; it is seen that there is good agreement in the variability and that the correlation improves after 1995 (Table 6); for example, the correlation coefficient r = 0.88, 0.88, and 0.90 for ORAS5 over 1980–2020, 1993–2020, and 2005–2020, respectively. These results imply that although there are energy flux exchanges at the surface and at 2000 m, the heat change rate in the top 2000 m of the WPWP is dominated by horizontal heat transport. The reason for the large net OHT deviation between GODAS and others before 1995 may be attributed to the use of different surface forcings, as described in Section 2, meriting further investigation.
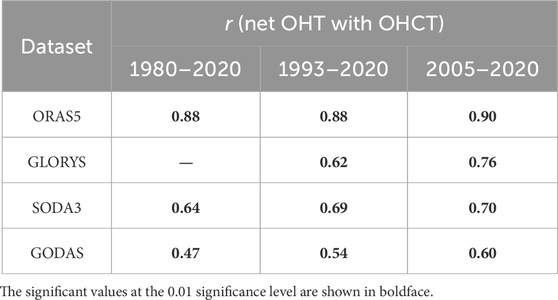
Table 6. Correlation coefficients (r) between the net incoming OHT to the WPWP and OHCT in the WPWP, as shown in Figure 5.
To track the paths of the heat flows to and away from the WPWP, the multiannual mean (2006–2018) OHTs through the latitude–depth cross sections at different longitudes are plotted in Figure 6 using ORAS5 data. There are several concentrated flow regions, which have been marked as A, B, C, and D. The positive OHT is the eastward flow, and the dashed black line is the position of the thermocline defined as the location of the 20°C isotherm. The thermocline moves toward the surface from west to east, as expected. The heat flow patterns in all panels from west to east are similar, but the concentrated flow regions move upward with elevating thermocline (Figures 6A–H). The westward south and north equatorial currents in regions A and B (Figure 6I) are due to the trade winds; the eastward countercurrent at the equator is due to the low sea-surface pressure (Hu et al., 2015) and is concentrated around the depth of the thermocline. The countercurrent is also closely related to the ENSO cycle consisting of the neutral, El-Niño, and La-Niña phases (Zhao et al., 2013; Chen et al., 2016; Webb, 2018; Wijaya and Hisaki, 2021). It has been reported that the latitude locations of these equatorial currents could change with warming climates (Zhai et al., 2014).
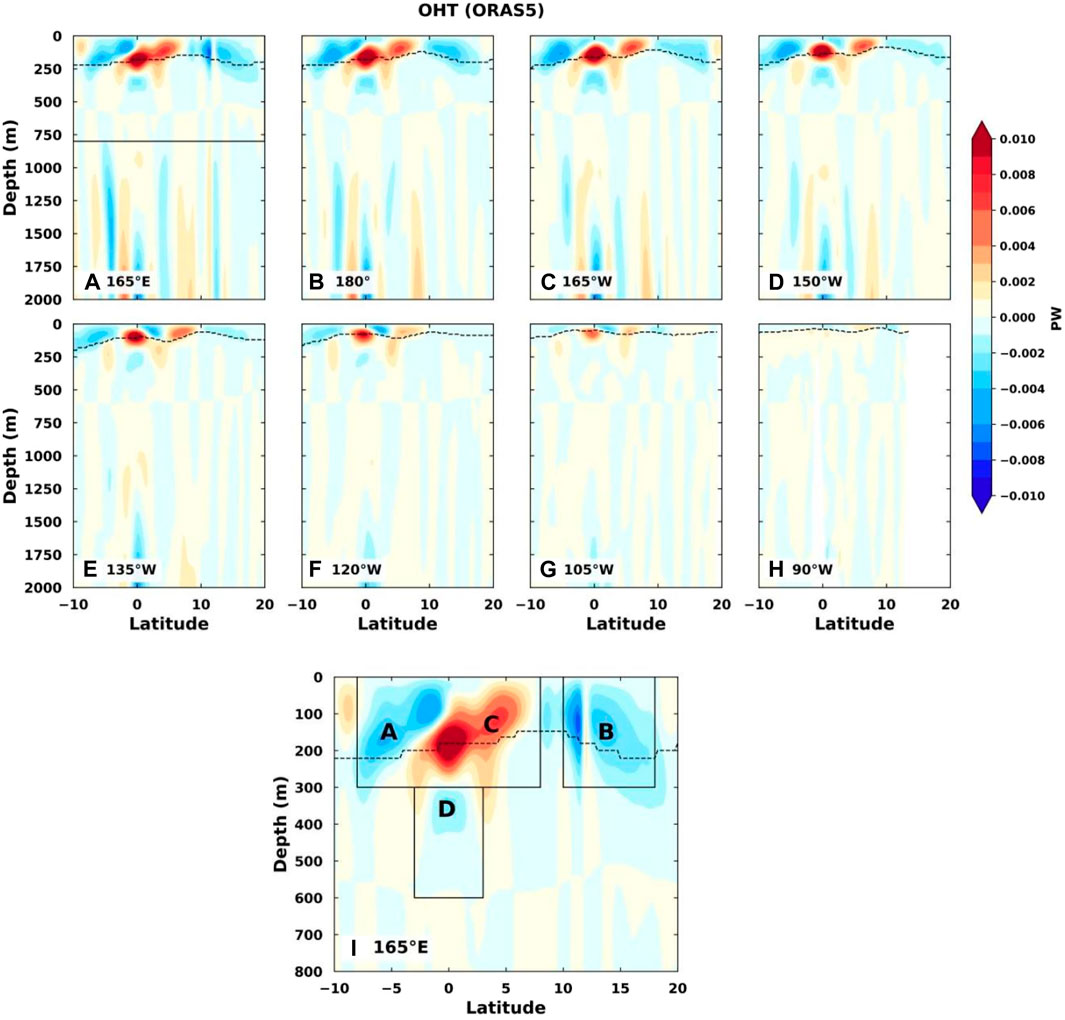
Figure 6. Multiannual mean (2006–2018) OHTs through the latitude–depth cross sections at different longitudes from 165°E to 90°W across the Pacific Ocean (A–H) using ORAS5 data. The positive OHT indicates eastward flow, and the dashed black line is the position of the thermocline that is defined as the location of the 20°C isotherm. Panel (I) is the enlarged plot of the black rectangular area in (A). Region A includes all westward OHT (negative) grid points, while region C includes all eastward OHT (positive) grid points in a rectangular area (8°S to 3°N, 300–600 m, at 165°E). Similarly, regions B (10°N to 18°N, 0–300 m, at 165°E) and D (3°S to 8°N, 0–300 m, at 165°E) include all westward OHT (negative) grid points in the corresponding rectangular areas.
The time series of the OHTs through the marked regions (Figure 6I) are plotted in Figure 7, together with the MEI time series. The maximum (minimum) lead–lag correlation coefficient (r1) between the OHT and MEI is also displayed with the leading months in the parentheses, where a negative leading month indicates that the OHT leads MEI. The selected region A includes all westward OHT (negative) grid points, while region C includes all eastward OHT (positive) grid points in a rectangular area (8°S to 3°N, 300–600 m, at 165°E); regions B (10°N to 18°N, 0–300 m, at 165°E) and D (3°S to 8°N, 0–300 m, at 165°E) include all westward OHT (negative) grid points in the corresponding rectangular areas. The OHTs show overall decreasing trends in region A following the MEI and a significant correlation coefficient of r1 = 0.79 with the OHT leading MEI by 4 months (Figure 7A). Both regions B and D have westward OHTs, and their magnitude variabilities are smaller than that for region A. The correlation coefficients between the OHTs, MEIs, and leading months are different in these two regions. In region C, the correlation coefficient is only 0.33, with the OHT leading MEI by 4 months. The results from the other three datasets show similar patterns (not shown here). The OHTE through the eastern boundary of the WPWP is also plotted for comparison of the OHTs through the marked regions. The correlation coefficient r2 between the OHT and OHTE is calculated and displayed; there are significant correlations for regions A, C, and D, but the correlation for B is insignificant. The corresponding scatter plots between the OHT and OHTE are shown in Figure 8 for regions A, B, and C along with their correlation coefficients.
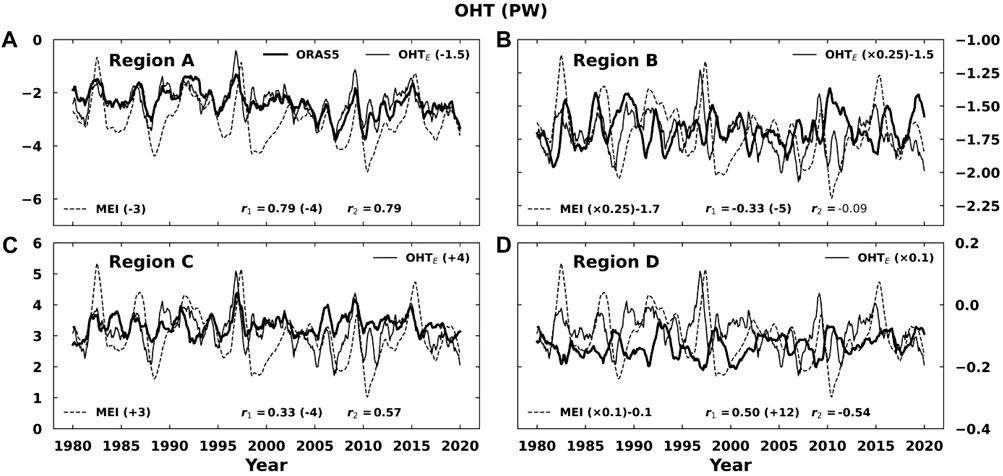
Figure 7. Time series of the OHTs through regions (A–D) (thick solid black lines), along with the MEI time series scaled by different factors for comparison purposes (dashed black lines). The OHTE (thin solid black line) through the eastern boundary of the WPWP is also plotted. The maximum (minimum) correlation coefficient (r1) between the OHT and MEI is displayed along with the leading months in parentheses (positive leading month means that the OHT leads MEI), and r2 is the correlation coefficient between the OHT and OHTE, where the OHTE is also scaled by different factors.
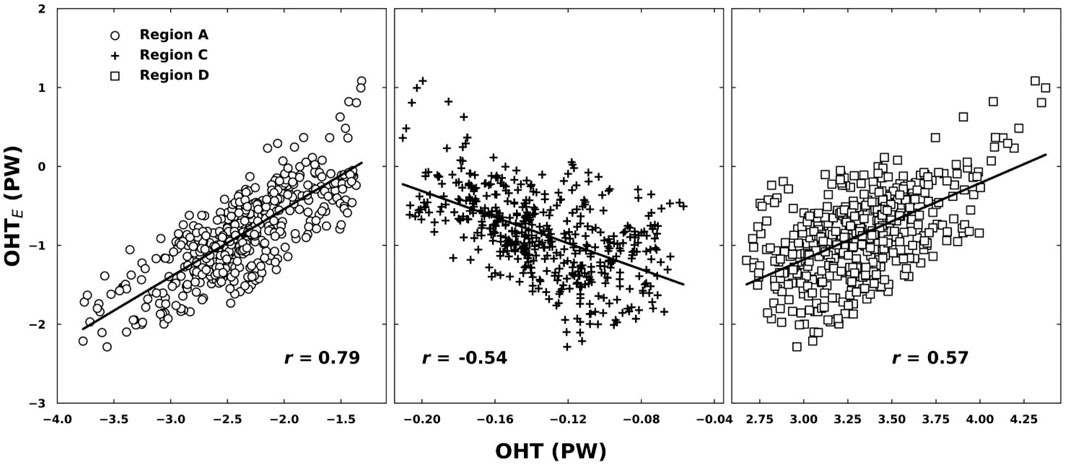
Figure 8. Scatter plots between the OHTE through the eastern boundary of the WPWP and OHTs through regions A, C, and D. The corresponding correlation coefficients are also displayed.
Similarly, the multiannual mean (2006–2018) OHTs through the longitude–depth cross sections at different latitudes are plotted in Figure 9; it is seen that the western boundary current of the Pacific Ocean dominates the heat flow and that the depth for the concentrated heat flow increases from 20°N to 35°N. The structure of the boundary current varies with latitude. There are northward and southward flows at 20°N, and the southward flow on the left is weaker than the northward flow. The flow structure from west to east becomes complicated at higher latitudes. There is a northward flow along the western boundary, followed by a southward flow and then a northward flow again from 25°N to 35°N. The northward flow is the Kuroshio current, which is mainly the diversion of the westward north equatorial current that turns eastward at approximately 35°N, and this can be seen in Figures 9E, F where the concentrated flow disappears. The time series of the OHTs through regions E and F are plotted in Figure 10 along with the MEI time series. The southward heat flow in region E shows an overall decreasing trend, and the correlation coefficient of 0.32 between the OHT and MEI is significant, with the OHT leading MEI by 14 months.
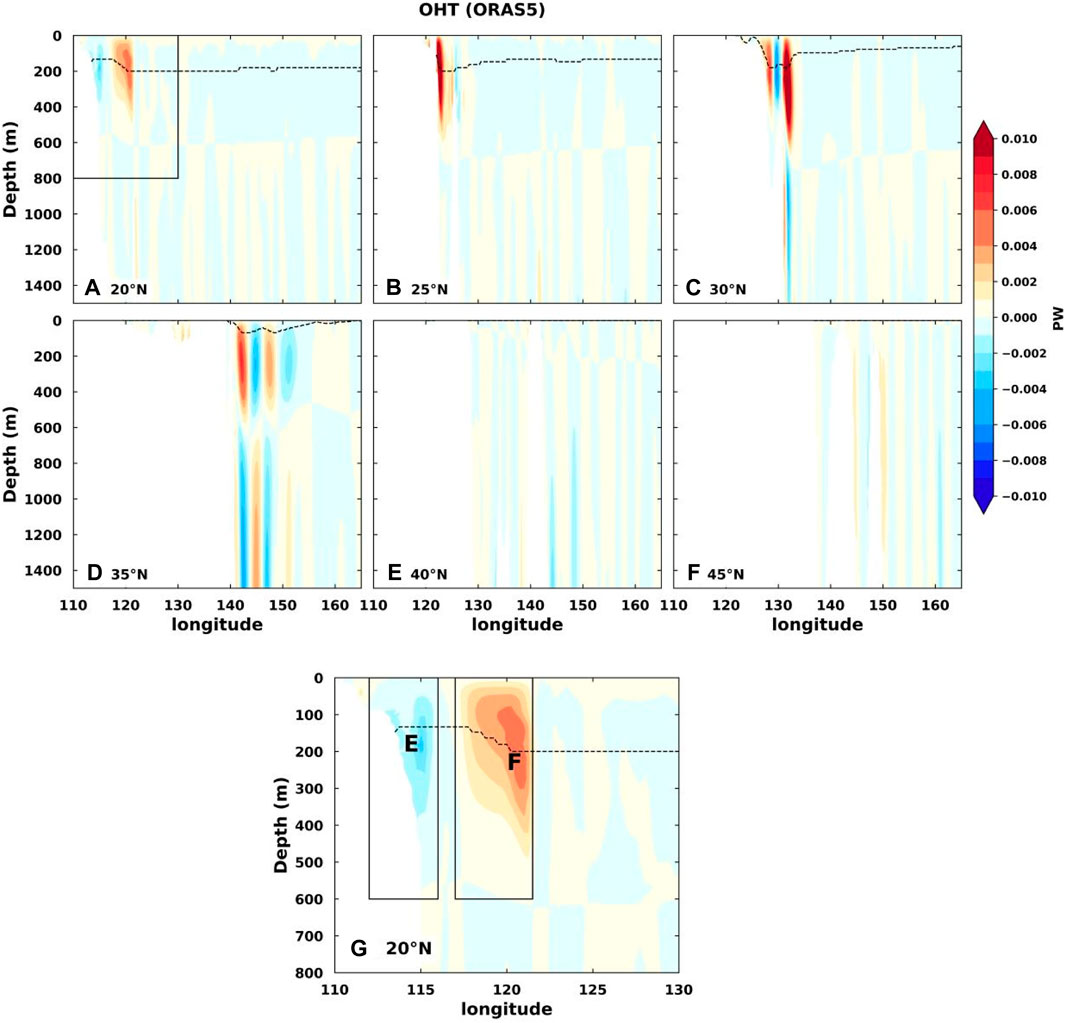
Figure 9. Multiannual mean (2006–2018) OHTs through longitude–depth cross sections at different latitudes from 20°N to 45°N (A–F) using ORAS5 data. The positive OHT indicates northward flow, and the dashed black line is the position of the thermocline defined as the location of the 20°C isotherm. Panel (G) is the enlarged plot of the black rectangular area in (A). Region E (112°E to 116°E, 0–600 m, at 20°N) includes all southward OHT (negative) grid points, while region F (117°E to 121.5°E, 0–600 m, at 20°N) includes all northward OHT (positive) grid points in the corresponding rectangular areas.
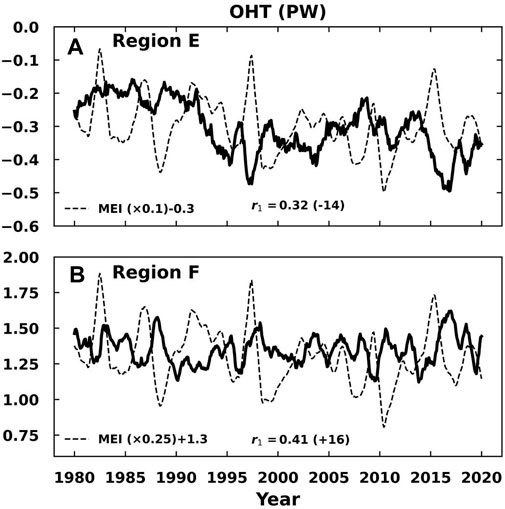
Figure 10. Time series of the OHTs through the E and F regions, along with the MEI time series scaled by different factors for comparison purposes. The maximum (minimum) correlation between the OHT and MEI is also displayed along with the leading months in parentheses (positive leading month means that the OHT leads MEI).
Four state-of-the-art ocean reanalysis datasets (ORAS5, GLORYS, SODA3, and GODAS) and one objective analysis product (IAPv4) were employed in this study to investigate the OHC, OHCT, and OHT in the WPWP region. The main conclusions of this study are as follows:
(1) There is good consistency between the four datasets for estimating the OHC and OHCT in the top 300 m of the WPWP, but larger differences exist at deeper layers, especially before 2005. All datasets show overall warming trends in OHC from 1980 to 2020.
(2) The OHC in the WPWP has a significant negative correlation with MEI, while the OHCT leads the MEI time series by 7–8 months.
(3) The OHCT variations in the WPWP are highly consistent with changes in the OHTs. The WPWP gains heat from the westward heat transport at the eastern boundary by the north and south equatorial currents while losing heat in the meridional direction from the northern boundary mainly due to the Kuroshio current along the western boundary of the Pacific Ocean.
(4) The variations in the estimated OHCs from different datasets are relatively large between 700 and 2000 m, and their agreement improves after 2005 when more Argo float observations are available.
(5) The OHTs through the WPWP boundaries have close relationships with the ENSO cycle, particularly at the eastern boundary.
The OHTs, particularly the concentrated flows from the north and south equatorial currents and countercurrent, were calculated to study the causes of the OHC changes in the WPWP. However, there is still much work to be done to link these processes to different ENSO development theories, such as the delayed oscillator theory (Suarez and Schopf, 1988; Battisti and Hirst, 1989), advective–reflective oscillator theory (Picaut et al., 1997), western Pacific oscillator theory (Weisberg and Wang, 1997), and recharge oscillator theory (Jin, 1997a; Jin, 1997b). The changes in the sea level heights over the WPWP region can have profound impacts on the current flows and ocean circulation, thereby influencing the heat amount and transport of the WPWP. The heat budget balance between the surface heat flux, heat storage, and transport in the WPWP as well as the effects of increments in the data assimilations on these quantities also need further investigation to derive clear images of the El-Niño cycle and climate change. The ENSO signal has profound influences on the precipitations in China and its surrounding areas (Liu et al., 2022; Gao and Li, 2023), and the leading signal of the OHT in the WPWP to ENSO may play a role in the precipitation forecast over this region.
The original contributions presented in the study are included in the article/Supplementary Material; further inquiries can be directed to the corresponding authors.
LJ: data curation, formal analysis, investigation, methodology, software, validation, visualization, writing–original draft, and writing–review and editing. CL: conceptualization, funding acquisition, methodology, project administration, supervision, writing–original draft, and writing–review and editing. NC: software, supervision, and writing–review and editing. XL: software and writing–review and editing. YX: writing–review and editing. RB: resources and writing–review and editing. LF: writing–review and editing. LZ: writing–review and editing. QS: software and writing–review and editing. KY: data curation and writing–review and editing. RZ: data curation, software, visualization, and writing–review and editing. SC: writing–review and editing. ML: writing–review and editing.
The author(s) declare that financial support was received for the research, authorship, and/or publication of this article. This work was supported by the National Natural Science Foundation of China (grant nos 42075036 and 42275017); Natural Science Foundation of Fujian Province of China (grant no. 2022J01441); LASG Key Open Project (grant no. 20230273) from the Institute of Atmospheric Physics, Chinese Academy of Sciences; Fujian Key Laboratory of Severe Weather (grant no. 2021KFKT02); Scientific Research Start-up Grant of Guangdong Ocean University (grant no. R20001); and Postgraduate Education Innovation Project of Guangdong Ocean University (grant nos. 202144 and 202253). CL was also supported by the University of Reading as a visiting fellow, and XL is currently a visitor at the University of Reading.
The authors are grateful to Dr Michael Mayer at the University of Vienna for his comments on the ocean heat transport. They thank the editor Prof Sabrina Speich and the two reviewers for providing constructive comments and suggestions.
The authors declare that the research was conducted in the absence of any commercial or financial relationships that could be construed as a potential conflict of interest.
All claims expressed in this article are solely those of the authors and do not necessarily represent those of their affiliated organizations, or those of the publisher, the editors, and the reviewers. Any product that may be evaluated in this article, or claim that may be made by its manufacturer, is not guaranteed or endorsed by the publisher.
The Supplementary Material for this article can be found online at: https://www.frontiersin.org/articles/10.3389/feart.2024.1377715/full#supplementary-material
Battisti, D. S., and Hirst, A. C. (1989). Interannual variability in a tropical atmosphere–Ocean Model: influence of the basic state, ocean geometry and nonlinearity. J. Atmos. Sci. 46, 1687–1712. doi:10.1175/1520-0469(1989)046<1687:iviata>2.0.co;2
Behringer, D. W., and Xue, Y. (2004). “Evaluation of the Global Ocean Data assimilation system at NCEP: the Pacific Ocean,” in Eighth symp. on integrated observing and assimilation systems for atmosphere, oceans, and land surface (Seattle, WA: Amer. Meteor. Soc.).
Bjerknes, J. (1969). Atmospheric teleconnections from the equatorial Pacific. Mon. Weather Rev. 97, 163–172. doi:10.1175/1520-0493(1969)097<0163:ATFTEP>2.3.CO;2
Carton, J. A., Chepurin, G. A., and Chen, L. (2018). SODA3: a new ocean climate reanalysis. J. Clim. 31, 6967–6983. doi:10.1175/JCLI-D-18-0149.1
Chen, G., and Huang, R. (2008). Influence of monsoon over the warm pool on interannual variation on tropical cyclone activity over the western North Pacific. Adv. Atmos. Sci. 25, 319–328. doi:10.1007/S00376-008-0319-7
Chen, X., Qiu, B., Du, Y., Chen, S., and Qi, Y. (2016). Interannual and interdecadal variability of the north equatorial countercurrent in the western pacific. J. Geophys. Res. 121, 7743–7758. doi:10.1002/2016JC012190
Cheng, L., Pan, Y., Tan, Z., Zheng, H., Zhu, Y., Wei, W., et al. (2024). IAPv4 ocean temperature and ocean heat content gridded dataset. Earth Syst. Sci. Data Discuss. 2024, 1–56. doi:10.5194/essd-2024-42
Cheng, L., Trenberth, K. E., Fasullo, J. T., Boyer, T., Abraham, J. P., and Zhu, J. (2017). Improved estimates of ocean heat content from 1960 to 2015. Sci. Adv. 3, e1601545. doi:10.1126/sciadv.1601545
Cheng, L., Trenberth, K. E., Fasullo, J. T., Mayer, M., Balmaseda, M. A., and Zhu, J. (2019). Evolution of ocean heat content related to ENSO. J. Clim. 32, 3529–3556. doi:10.1175/JCLI-D-18-0607.1
Clement, A. C., Seager, R., and Murtugudde, R. (2005). Why are there tropical warm pools. J. Clim. 18, 5294–5311. doi:10.1175/JCLI3582.1
Dayem, K. E., Noone, D. C., and Molnar, P. H. (2007). Tropical western Pacific warm pool and maritime continent precipitation rates and their contrasting relationships with the Walker Circulation. J. Geophys. Res. 112. doi:10.1029/2006JD007870
Gao, C., and Li, G. (2023). Decadal enhancement in the effect of El Niño in the decaying stage on the pre–flood season precipitation over southern China. J. Clim. 36 (23), 8155–8170. doi:10.1175/JCLI-D-22-0864.1
Garcia, O. (1983). Equatorial Pacific convective activity during the last three ENSO events. Trop. Ocean. Atmos. Newsletters 21, 6–7.
Hall, M. M., and Bryden, H. L. (1982). Direct estimates and mechanisms of ocean heat transport. Deep Sea Res. Part A. Oceanogr. Res. Pap. 29 (3), 339–359. doi:10.1016/0198-0149(82)90099-1
Hipel, K. W., and McLeod, I. (1994). Time series modelling of water resources and environmental systems. Amsterdam: Elsevier. doi:10.1016/s0167-5648(08)x7026-1
Holbrook, N. J., Hernaman, V., Koshiba, S., Lako, J., Kajtar, J. B., Amosa, P., et al. (2021). Impacts of marine heatwaves on tropical western and central Pacific Island nations and their communities. Glob. Planet. Change 208, 103680. doi:10.1016/j.gloplacha.2021.103680
Hu, D., Wu, L., Cai, W., Gupta, A. S., Ganachaud, A., Qiu, B., et al. (2015). Pacific western boundary currents and their roles in climate. Nature 522, 299–308. doi:10.1038/nature14504
Hu, S., and Hu, D. (2014). Variability of the Pacific North Equatorial Current from repeated shipboard acoustic Doppler current profiler measurements. J. Oceanogr. 70, 559–571. doi:10.1007/s10872-014-0253-5
Hu, S., Hu, D., Guan, C., Xing, N., Li, J., and Feng, J. (2017). Variability of the western Pacific warm pool structure associated with El Niño. Clim. Dyn. 49, 2431–2449. doi:10.1007/s00382-016-3459-y
Huang, R., and Wang, L. (2010). Interannual variation of the landfalling locations of typhoons in China and its association with the summer East Asia/Pacific pattern teleconnection [J]. Chin. J. Atmos. Sci. (in Chinese), 34 (5): 853–864. doi:10.3878/j.issn.1006-9895.2010.05.01
Huang, Z., Feng, M., Beggs, H., Wijffels, S. E., Cahill, M. L., and Griffin, C. (2021). High-resolution marine heatwave mapping in Australasian waters using Himawari-8 SST and SSTAARS data. Remote Sensing of Environment 267, 112742. doi:10.1016/j.rse.2021.112742
Huangfu, J., Huang, R., and Chen, W. (2017). Interdecadal increase of tropical cyclone genesis frequency over the western north Pacific in May. International Journal of Climatology 37, 1127–1130. doi:10.1002/joc.4760
Jian, Z., Wang, Y., Dang, H., Mohtadi, M., Rosenthal, Y., Lea, D. W., et al. (2022). Warm pool ocean heat content regulates ocean–continent moisture transport. Nature 612, 92–99. doi:10.1038/s41586-022-05302-y
Jin, F.-F. (1997). An equatorial ocean recharge paradigm for ENSO, Part I: conceptual model. J. Atmos. Sci. 54, 811–829. doi:10.1175/1520-0469(1997)054<0811:aeorpf>2.0.co;2
Jin, F.-F. (1997). An Equatorial ocean recharge paradigm for ENSO, Part II: a stripped-down coupled model. J. Atmos. Sci. 54, 830–847. doi:10.1175/1520-0469(1997)054<0830:aeorpf>2.0.co;2
Kim, H., Ha, K., Moon, S., Oh, H., and Sharma, S. (2020). Impact of the indo-pacific warm pool on the Hadley, walker, and monsoon circulations. Atmosphere 11 (10), 1030. doi:10.3390/ATMOS11101030
Lee, S., Yeh, S., Lee, J., Park, Y., Kwon, M., Jun, S., et al. (2022). Roles of atmosphere thermodynamic and ocean dynamic processes on the upward trend of summer marine heatwaves occurrence in east asian marginal seas. Frontiers in Marine Science 9. doi:10.3389/fmars.2022.889500
Lee, T., Fukumori, I., and Tang, B. (2004). Temperature advection: internal versus external processes. J. Pysical Oceanography 34, 1936–1944. doi:10.1175/1520-0485(2004)034<1936:taivep>2.0.co;2
Lellouche, J. M., Galloudec, O. L., Drévillon, M., Régnier, C., Greiner, E., Garric, G., et al. (2013). Evaluation of global monitoring and forecasting systems at Mercator Océan. Ocean Science 9, 57–81. doi:10.5194/OS-9-57-2013
Levitus, S. (1982). Climatological atlas of the world ocean, NOAA prof. Pap. No. 13. Washington, D. C: U.S. Dep. Commer., 173. doi:10.1029/eo064i049p00962-02
Liu, C., Yang, Y., Liao, X., Cao, N., Liu, J., Ou, N., et al. (2022). Discrepancies in simulated ocean net surface heat fluxes over the North Atlantic. Adv. Atmos. Sci. 39, 1941–1955. doi:10.1007/s00376-022-1360-7
Liu, C., Zheng, R., Jin, L., Bao, R., Cao, N., Liao, X., et al. (2023). Long-range prediction of the tropical cyclone frequency landfalling in China using thermocline temperature anomalies at different longitudes. Front. Earth Sci. 11. doi:10.3389/feart.2023.1329702
Madec, G.The NEMO System Team (2023). NEMO Ocean Engine Reference Manual, Zenodo. doi:10.5281/zenodo.8167700
Mayer, M., Haimberger, L., and Balmaseda, M. A. (2014). On the energy exchange between tropical ocean basins related to ENSO. Journal of Climate 27, 6393–6403. doi:10.1175/JCLI-D-14-00123.1
Mogensen, K., Alonso, M. D., Balmaseda, , and Weaver, A. T. (2012). The NEMOVAR ocean data assimilation system as implemented in the ECMWF ocean analysis for System 4. Toulouse, France: European Centre for MediumRange Weather Forecasts.
Picaut, J., Masia, F., and du Penhoat, Y. (1997). An advective-reflective conceptual model for the oscillatory nature of the ENSO. Science 277, 663–666. doi:10.1126/science.277.5326.663
Pierrehumbert, R. T. (1995). Thermostats, radiator fins, and the local runaway greenhouse. Journal of the Atmospheric Sciences 52, 1784–1806. doi:10.1175/1520-0469(1995)052<1784:TRFATL>2.0.CO;2
Qi, Q., Zhang, Q., and Hou, Y. (2010). Dynamic mechanism of interannual zonal displacements of the eastern edge of the western Pacific warm pool. Chinese Journal of Oceanology and Limnology 28, 387–397. doi:10.1007/S00343-010-9076-4
Ren, Q., Qi, L., Zhan, F., and He, J. (2018). Relationship between the precipitation during the Jiangnan rainy seasons (JRS) and the preceding heat content anomalies over the western Pacific Ocean warm pool and its possible mechanism. Trans Atmos Sci 41 (6), 762–774. (in Chinese). doi:10.13878/j.cnki.dqkxxb.20160310001
Saha, S., Nadiga, S., Thiaw, C. A., Wang, J., Wang, W., Zhang, Q., et al. (2006). The NCEP climate forecast system. Journal of Climate 19, 3483–3517. doi:10.1175/JCLI3812.1
Sparks, N., and Toumi, R. (2020). Pacific subsurface ocean temperature as a long-range predictor of South China tropical cyclone landfall. Communications Earth and Environment 1, 30. doi:10.1038/s43247-020-00033-2
Spillman, C. M., Smith, G., Hobday, A. J., and Hartog, J. R. (2021). Onset and decline rates of marine heatwaves: global trends, seasonal forecasts and marine management. Frontiers in Climate 3. doi:10.3389/fclim.2021.801217
Suarez, M. J., and Schopf, P. S. (1988). A delayed action oscillator for ENSO. J. Atmos. Sci. 45, 3283–3287. doi:10.1175/1520-0469(1988)045<3283:adaofe>2.0.co;2
Verdy, A., Mazloff, M. R., Cornuelle, B. D., and Subramanian, A. C. (2023). Balancing volume, temperature, and salinity budgets during 2014–2018 in the tropical Pacific Ocean state estimate. Journal of Geophysical Research Oceans 128, e2022JC019576. doi:10.1029/2022JC019576
Webb, D. J. (2018). On the role of the north equatorial counter current during a strong El Niño. Ocean Science 14, 633–660. doi:10.5194/os-14-633-2018
Weisberg, R. H., and Wang, C. (1997). A western Pacific oscillator paradigm for the El Ni˜no-Southern Oscillation. Geophys, Res. Lett. 24, 779–782. doi:10.1029/97gl00689
Wijaya, Y. J., and Hisaki, Y. (2021). Differences in the reaction of north equatorial countercurrent to the developing and mature phase of ENSO events in the western Pacific Ocean. Climate 9, 57. doi:10.3390/CLI9040057
Williams, A. P., and Funk, C. (2011). A westward extension of the warm pool leads to a westward extension of the Walker circulation, drying eastern Africa. Climate Dynamics 37, 2417–2435. doi:10.1007/S00382-010-0984-Y
Wolter, K., and Timlin, M. S. (2011). El Niño/Southern Oscillation behaviour since 1871 as diagnosed in an extended multivariate ENSO index (MEI.ext). International Journal of Climatology 31, 1074–1087. doi:10.1002/joc.2336
Wu, Q., Zhang, X., Church, J. A., and Hu, J. (2018). ENSO-related Global Ocean heat content variations. Journal of Climate 32 (1), 45–68. doi:10.1175/JCLI-D-17-0861.1
Wyrtki, K. (1989). “Some thoughts about the west Pacific warm pool,” in Proceedings of the western pacific international meeting and workshop on TOGA COARE (Nouméa, New Caledonia: ORSTOM), 99–109.
Xu, H., Xu, J., Liu, C., and Ou, N. (2020). Distinguishing characteristics of spring and summer onset El Niño events. Journal of Climate 33, 4579–4597. doi:10.1175/jcli-d-19-0605.1
Yang, X., Wu, X., Liu, Z., and Yuan, C. (2019). A preliminary study on an upper ocean heat and salt content of the western Pacific warm pool region. Acta Oceanologica Sinica 38, 60–71. doi:10.1007/s13131-019-1399-1
Zhai, F., Hu, D., Wang, Q., and Wang, F. (2014). Long-term trend of pacific south equatorial current bifurcation over 1950–2010. Geophys. Res. Lett. 41, 3172–3180. doi:10.1002/2014GL059934
Zhang, X., Zheng, F., Zhu, J., and Chen, X. (2022). Observed frequent occurrences of marine heatwaves in most ocean regions during the last two decades. Advances in Atmospheric Sciences 39, 1579–1587. doi:10.1007/s00376-022-1291-3
Zhao, J., Li, Y., and Wang, F. (2013). Dynamical responses of the west pacific north equatorial countercurrent (NECC) system to El Niño events. Journal of Geophysical Research 118, 2828–2844. doi:10.1002/JGRC.20196
Zheng, R., Liu, J., and Ma, Z. F. (2018). Impacts of the summertime warm pool in the West Pacific on Huaxi autumn rain and its possible physical mechanism. Acta Meteorologica Sinica 76 (5), 714–725. (in Chinese). doi:10.11676/qxxb2017.080
Zuo, H., Balmaseda, M. A., and Mogensen, K. (2017). The new eddy-permitting ORAP5 ocean reanalysis: description, evaluation and uncertainties in climate signals. Climate Dynamics 49, 791–811. doi:10.1007/s00382-015-2675-1
Keywords: western Pacific warm pool, ocean heat content, ocean heat content tendency, ocean heat transport, climate change
Citation: Jin L, Liu C, Cao N, Liao X, Xue Y, Bao R, Fan L, Zhu L, Su Q, Yang K, Zheng R, Chang S and Liang M (2024) Tracking the variability of the western Pacific warm pool heat content over 1980–2020. Front. Earth Sci. 12:1377715. doi: 10.3389/feart.2024.1377715
Received: 28 January 2024; Accepted: 15 May 2024;
Published: 14 June 2024.
Edited by:
Sabrina Speich, École Normale Supérieure, FranceReviewed by:
Meghan F. Cronin, National Oceanic and Atmospheric Administration (NOAA), United StatesCopyright © 2024 Jin, Liu, Cao, Liao, Xue, Bao, Fan, Zhu, Su, Yang, Zheng, Chang and Liang. This is an open-access article distributed under the terms of the Creative Commons Attribution License (CC BY). The use, distribution or reproduction in other forums is permitted, provided the original author(s) and the copyright owner(s) are credited and that the original publication in this journal is cited, in accordance with accepted academic practice. No use, distribution or reproduction is permitted which does not comply with these terms.
*Correspondence: Chunlei Liu, bGl1Y2xlaUBnZG91LmVkdS5jbg==; Ning Cao, bmNhb0BnZG91LmVkdS5jbg==
Disclaimer: All claims expressed in this article are solely those of the authors and do not necessarily represent those of their affiliated organizations, or those of the publisher, the editors and the reviewers. Any product that may be evaluated in this article or claim that may be made by its manufacturer is not guaranteed or endorsed by the publisher.
Research integrity at Frontiers
Learn more about the work of our research integrity team to safeguard the quality of each article we publish.