
95% of researchers rate our articles as excellent or good
Learn more about the work of our research integrity team to safeguard the quality of each article we publish.
Find out more
ORIGINAL RESEARCH article
Front. Earth Sci. , 21 August 2024
Sec. Hydrosphere
Volume 12 - 2024 | https://doi.org/10.3389/feart.2024.1377367
 Junaid Ali1
 Fakhrul Islam2*
 Tehmina Bibi3*
 Ijazul Islam4Muhammad Rizwan Mughal5Muhammad Sabir6Fuad Awwad7Emad Ismail7
Urbanization poses a significant threat to environmental sustainability, particularly in Pakistan, where uncontrolled urban growth and water mismanagement have exacerbated water scarcity and climate variability. This study investigates the spatiotemporal impacts of urbanization and climate change on groundwater in Lahore District, Pakistan. various parameters were considered to execute the study including land use/land cover (LULC), rainfall, Land Surface Temperature (LST), ground wells and population data using advanced techniques such as Random Forest machine learning algorithm, Climate Hazards Group Infrared Precipitation, and geographically weighted regression (GWR) analysis. Our findings reveal that urbanization has severely impacted the water table in the north, northwest, and southwest areas. There is a significant negative negative correlation (−0.333) between the quantity of groundwater level (GWL) and the annual average LST whereas, the p-value (0.75) is also showing highly significant relation of GWL and LST in the study area. Whereas a positive association (0.666) exist (p-value 0.333 moderately significant) between yearly GWL and the mean precipitation. This research provides crucial insights for policymakers to understand the effects of urbanization and climate change on groundwater and develop strategies to mitigate adverse impacts in the study area.
Globally, groundwater resources are under critical stresses owing to increased freshwater demand as a consequence of the increasing population and rapid growth in urbanization (Kalhor and Emaminejad, 2019). The process of urbanization has resulted in tremendous growth across the globe, leading to numerous socioenvironmental issues (Kalhor and Mahdisoltani, 2015). Research has demonstrated that the expansion of urban areas and progress of urban infrastructure have significantly contributed to various environmental problems, including pollution of surface water and depletion of groundwater sources (Chen et al., 2014). Urbanization and climate change have posed significant threats to groundwater resources globally. Groundwater meets approximately 97% of the freshwater and 50% of the irrigation needs globally (Jakeman et al., 2016); however, the ever increasing population, urbanization, and climate change have led to overexploitation, contamination, and depletion of the groundwater resources (Faheem et al., 2023a; Islam et al., 2023a). Pakistan, with its agriculture-based economy, is particularly vulnerable to groundwater resource depletion owing to rapid urbanization, industrialization, and poor management (Mishra et al., 2014; Rehman et al., 2024b).
The importance of groundwater resources has increased many fold because of the growing need for freshwater resources (Tariq et al., 2023a; Islam et al., 2023a). Land use and land cover (LULC) changes, especially in urban areas, have had significant impacts on groundwater recharge and quality (Mishra et al., 2014; Zahran et al., 2023b). Urbanization has led to the replacement of permeable surfaces with impervious ones, reducing groundwater recharge and increasing surface runoff (Zahran et al., 2023a). Climate changes have also affected groundwater resources, with changes in the precipitation and temperature altering recharge patterns (Ullah et al., 2023). Thus, it is important to evaluate the impacts of climate variables and LULC on groundwater resources (Zhao et al., 2024).
Urban sprawl and migration to suburban regions have resulted in increase in the impermeable cover, which in turn has led to decreased evapotranspiration and increased storm runoff (Rehman et al., 2024a). Although the majority of the Earth’s freshwater is contained in frozen form in the ice sheets, ice caps, glaciers, and icebergs that are primarily located in polar regions, a minor portion of the freshwater is stored under the surface of the Earth as groundwater in aquifers. A mere 3% of the Earth’s total water supply is classified as freshwater resources, and approximately 30% of this amount is readily available as groundwater (Kalhor and Ghasemizadeh, 2019). Therefore, the convenient availability of such freshwater supplies has had various effects on environmental processes, including the quantitative water balance.
Various scholars have studied the influence of urbanization on the quality and quantity of groundwater. They have employed experimental and/or numerical techniques to enhance understanding of the issues with regard to hydrological and hydrogeological systems caused by urbanization (Foster, 2001). Plenty of studies are also available on the impacts of urbanization around the globe (Minnig et al., 2018; Wakode et al., 2018). In addition, certain studies have specifically concentrated on the effects of urbanization on the qualities of groundwater and surface water (Subramani and Krishnan, 2012; Asadi et al., 2017). Increased nitrate concentrations to levels comparable to those in domestic sewage, a general rise in the phosphorus levels in urban areas, and increased chloride concentrations in the Zahedan Aquifer in southeast Iran have been reported (Khazaei et al., 2004). Additionally, groundwater contamination by fecal coliforms has also been reported.
The demand for water increases with the size of a metropolitan area; this may result in excessive groundwater extraction, which could lower the water table and eventually deplete the groundwater supply (Gul et al., 2022b; Sajjad et al., 2022b). The development of impermeable surfaces like roads and buildings during urbanization frequently leads to increasing surface runoff. Given the decreased water infiltration, groundwater recharge may also be limited (Islam et al., 2023a). Urban regions can be contributing factors to groundwater contamination owing to a number of reasons, including inappropriate waste disposal, industrial discharge, and sewage. Groundwater may thus get contaminated as a result of these inappropriate waste disposal methods through seepage into the earth (Maqsoom et al., 2020; Gul et al., 2022a).
Various studies have been carried out to examine the impacts of urbanization and changes in land cover on groundwater using remote sensing (RS) and geographical information system (GIS) methods. These approaches can also be used to analyze changes in the groundwater level (GWL) as well as the location and flow direction of groundwater. RS has several uses in hydrological investigations (Abdalla, 2012; Al-Bakri et al., 2012). Several researchers have investigated the correlation between urbanization and groundwater as well as identified possible groundwater zones in India utilizing the Indian satellite IRS (Singh, 2014; Asadi et al., 2017). It is important to note that while researching changes in land cover data, most academics have utilized Landsat data in their work owing to its comparatively high temporal and spatial resolutions as well as availability throughout the past few decades. Based on a study conducted by the United Nations (UN), urban development and population growth rates are increasing faster in Asia and Africa compared to Northern America, Australia, and most of Europe (Chen et al., 2014).
The increasing demand for groundwater due to urbanization has placed a significant strain on the inadequate groundwater resources. Furthermore, improper agricultural practices, exploration, and climatic changes have caused serious threats to freshwater reservoirs in tropical and subtropical regions of the world (Faheem et al., 2023a; Islam et al., 2023a). Since Pakistan has an agriculture-based economy, groundwater is the most important and crucial asset for development. Groundwater is a crucial component for socioeconomic development, but this precious resource is under major threat owing to population growth, industrialization, unscientific exploration, and poor groundwater management (Mishra and Sharma, 2021).
The Lahore district in Pakistan is facing severe groundwater depletion due to rapid urbanization and climate changes (Rehman et al., 2024b). Human activity and rapid urbanization have caused the plant cover in Lahore region to turn into urban class, resulting in an increase of 3°C in the surface temperature between June 2017 and June 2021 (Shakrullah and Shirazi, 2023). Therefore, it is essential to investigate the impacts of LULC and climatic variable changes on GWLs in this region. The present study aims to evaluate the spatial and temporal dynamics of urbanization and climate changes on groundwater resources using ground and satellite data. The findings are expected to provide valuable insights to policymakers for developing effective strategies for sustainable groundwater management.
The main objective of this work is to evaluate the impacts of LULC and climatic variable changes on GWL in Lahore district of Pakistan using ground and satellite data. This study uses a geographically weighted regression (GWR) approach to compute the spatial correlations of several parameters, including population, groundwater well data, rainfall, land surface temperature (LST), and LULC, to monitor groundwater. The findings of this study are expected to help the policy and decision makers of various public and private organization to design achievable plans.
The present study was conducted in Lahore district, which is the capital of Punjab province and second most populated area of Pakistan. According to Zahran et al. (2023a) the most recent census of 2017 showed that Lahore’s total pollution increased from 6.3 million in 1998 to 11.2 million at an annual increment of 3%. Lahore district has a total area of 1842 km2 and is situated on the left bank of the Ravi River. It is bounded on the northwest by the Ravi River and on the east by the Bambanwali Ravi Bedian Dipalpur (BRBD) Canal. The study area is geographically situated in the northeast area of Punjab between 31°15′ to 31°43′ N and 74°10′ to 74°39′ E.
Lahore is known for its cultural diversity and historical importance because of the city’s abundance of Mughal-era monuments, gardens, and parks. However, substantial growth of urban infrastructure in this metropolitan area, especially the increase in vehicular emissions, has altered the city’s landscape and badly impacted the gorgeous locations. The city of Lahore is divided into nine administration townships that are overseen by the Town Municipal Administration (TMA) and army cantonment area. The wintertime extends from November to March, and the chilly months of winter wherein the temperature ranges from 0°C to 3°C are December and January. The normal daily temperature ranges from 40°C to 45°C, with the highest temperature of about 48°C being recorded in the months of May and June (Tariq and Mumtaz, 2023). Lahore has frequent precipitations of about 600 mm in the months of July and August during the monsoon period; the average annual rainfall values for 2005, 2010, 2015, and 2020 were 580, 660, 850, and 940 mm, respectively, while the average rainfall over the period of 2005–2020 was 662 mm/year. The study area for the present study is shown in Figure 1.
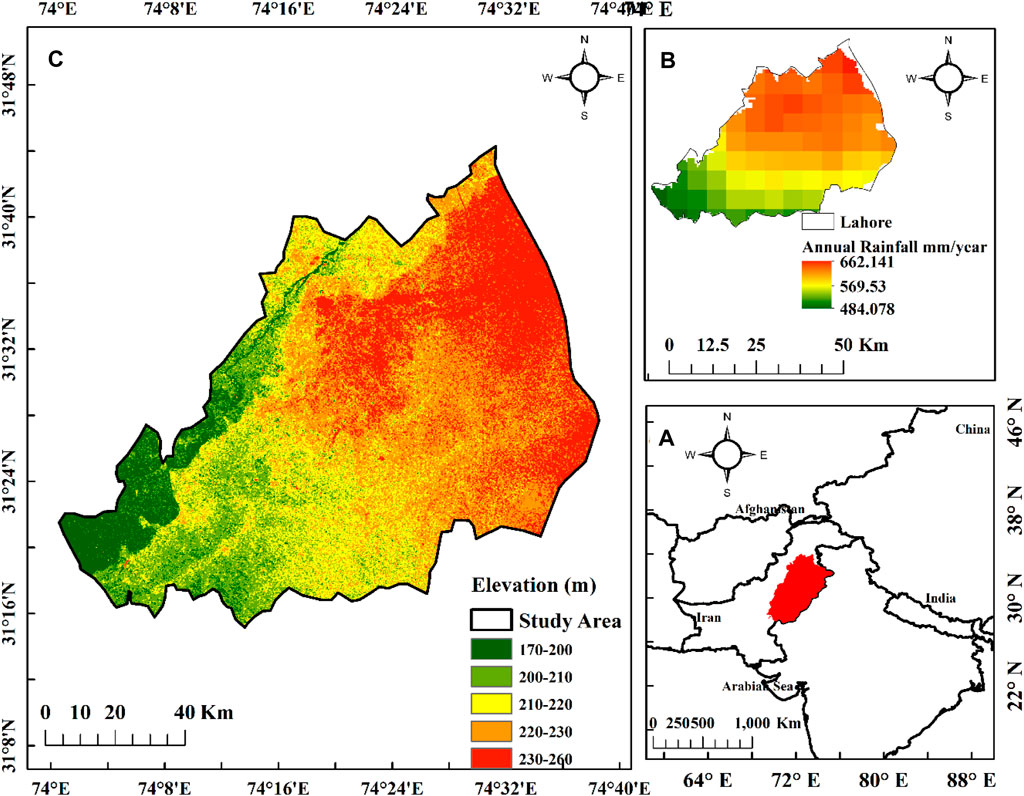
Figure 1. Location map of the study area in (A) Pakistan with international boundaries, (B) Lahore with the average annual rainfall in mm/year, and (C) Lahore with its elevation in meters.
Multiple datasets were used in the present study to prepare different factors. Data from both satellite and ground measurements are included in these datasets. Table 1 lists the specifics of the data and details about the sources.
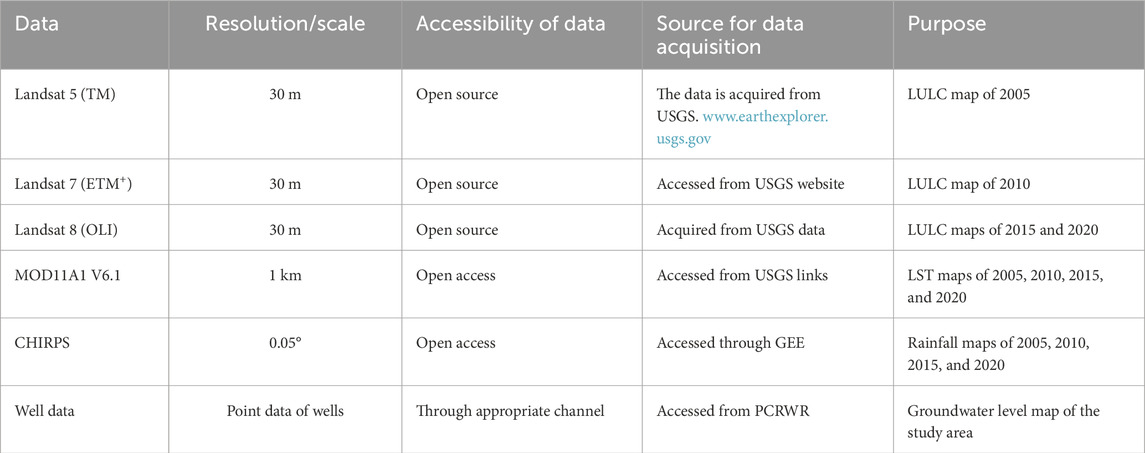
Table 1. Details and sources of the data used in this study.
The comprehensive methodological flowchart for the present study is shown in Figure 2. After acquisition, the data were processed to obtain the derivatives. Moreover, the images were classified to obtain LULC maps at 5-year intervals and validated using multiple software (e.g., QGIS, GEE, ArcGIS). After preparation of the dataset, the Kendall tau test was applied to determine the associations between the variables, and the GWR analysis was performed to find the spatial correlations between the dependent and explanatory variables to extract the results.
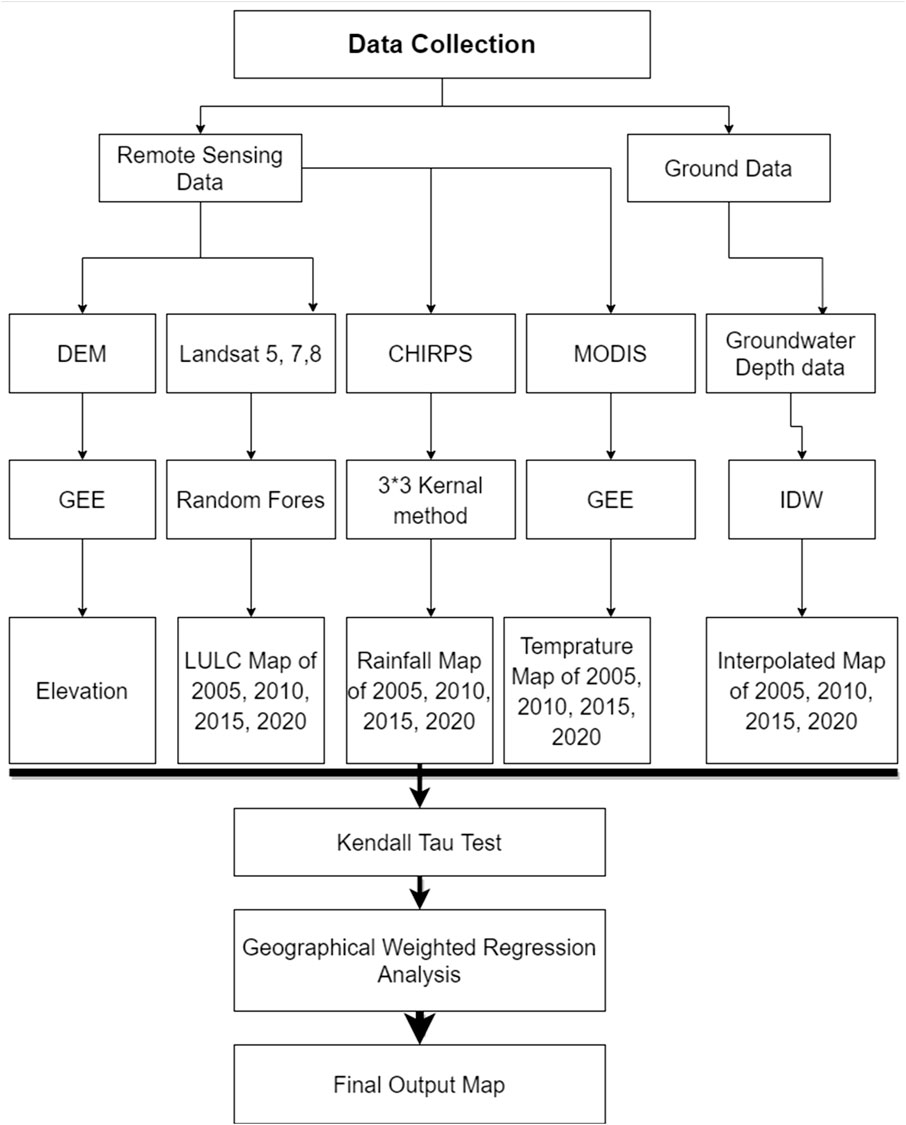
Figure 2. Workflow of the current study.
LULC classification analysis was performed using a multitemporal dataset from the Landsat series 5, 7, and 8 at intervals of 5 years (2005, 2010, 2015, and 2020). This interval was chosen to capture the changes in the LULC patterns over time and their impacts on the groundwater resources. The Landsat images were selected based on their spatial resolution (30 m) and availability for the study area. The LULC data were processed using the random forest (RF) algorithm in the Google Earth Engine (GEE) platform. The RF algorithm was chosen for its high accuracy and ability to handle large datasets. The training dataset consisted of 70% of the total samples, and the remaining 30% were used for validation. The number of trees generated was set to 100, and the maximum depth of each tree was set to 10. To ensure data integrity and accuracy, error lines present in the Landsat 7 imagery were removed using QGIS software. The processed data were then exported to ArcGIS 10.8 for further analyses.
The geospatial modeling techniques used in this study, including RF and Kappa coefficient (KC), were chosen on the basis of their abilities to handle large datasets and provide accurate results. QGIS, GEE, and ArcGIS were used for the data processing, analyses, and visualization, respectively, owing to their capabilities for handling geospatial data and performing spatial analyses.
LULC is a crucial factor affecting aquifer recharge, occurrence, availability, and accessibility (Javed et al., 2019). The environmental factors represented by LULC have substantial impacts on the groundwater quality because they affect surface discharge and infiltration (Islam et al., 2023b). Additionally, barren lands and constructed areas typically show poor groundwater potentials, whereas areas with vegetation and areas close to water reserves show better capacity (Tariq et al., 2023a). For the LULC classification analysis, a multitemporal dataset containing images from Landsat series 5, 7, and 8 was utilized. The LULC data for the current research was obtained from classified images of Landsat 5, 7 and 8 with a spatial resolution of 30 m for the years 2005, 2010, 2015, and 2020. Landsat 5 images were used for 2005, Landsat 7 images were used for 2010, and Landsat 8 images were used for 2015 and 2020. To extract the LULC information, shortwave infrared (SWIR) bands (bands 6, 7, or 9) were used to extract information on the moisture content and LST and discriminate different land cover types. Further, the visible bands Red (band 4), Green (band 3), and Blue (band 2) as well as near-infrared (NIR) band (band 5 or 6) were used in this study to extract information on the vegetation cover, water bodies, and soil characteristics.
The LULC map of the study area was prepared using the RF algorithm and GEE platform that has been widely used for LULC classifications using satellite imagery. The RF method, which was initially introduced by Brieman, is a popular machine learning technique that builds ensemble classifiers by mixing many CART trees (Anjomshoaa et al., 2022). It is crucial to take into account the size of the training dataset and quantity of trees generated throughout the processing phase when providing data to this method (Jiang et al., 2022). RF is a supervised machine learning approach that uses training datasets and random variable sampling to produce many decision trees. To ensure fair evaluation of the training samples at each node and generate correct separation, the efficacy of the RF algorithm was assessed using the non-training data. The maps were further grouped into four classes as urban, vegetation, water, and barren land. The spatiotemporal LULC maps of the study area for 2005, 2010, 2015, and 2020 are shown in Figures 3A–D.
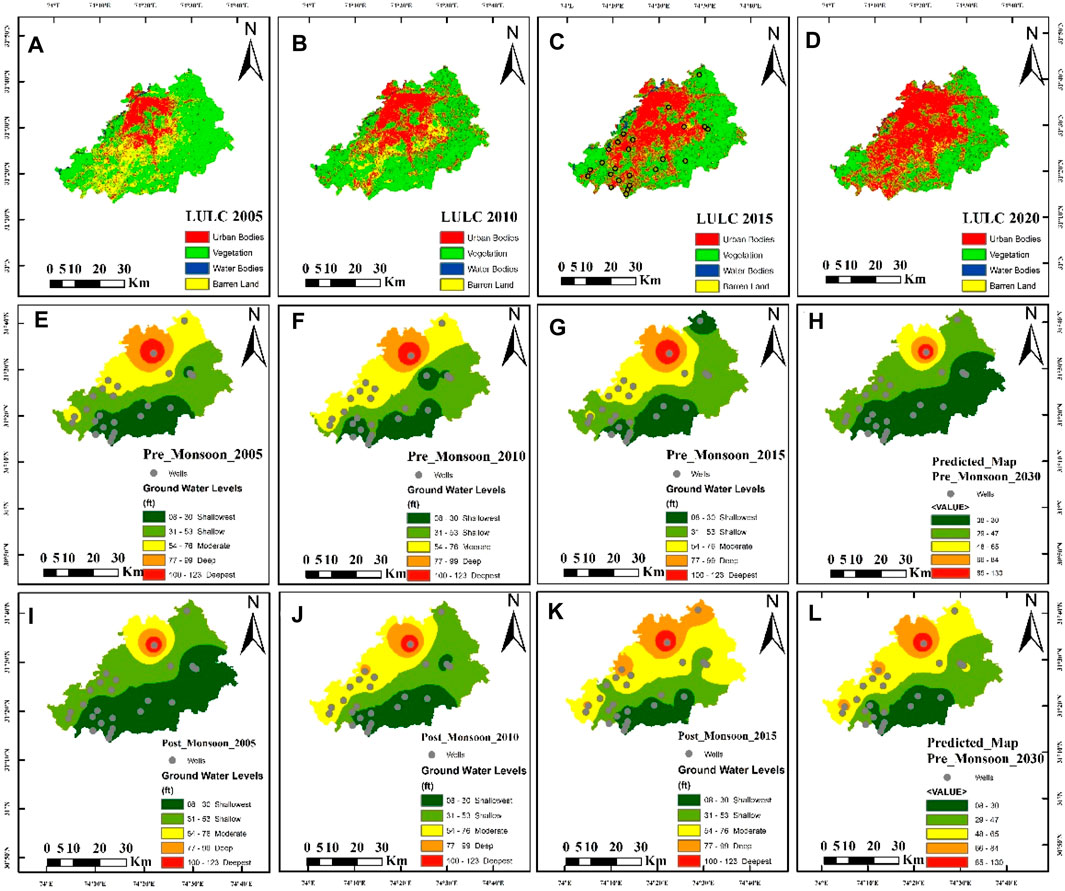
Figure 3. Parameters used in the present study: (A) land use and land cover (LULC) for 2005, (B) LULC for 2010, (C) LULC for 2015, (D) LULC for 2020, (E) premonsoon groundwater level (GWL) for 2005, (F) premonsoon GWL for 2010, (G) premonsoon GWL for 2015, (H) premonsoon GWL for 2020, (I) postmonsoon GWL for 2005 (J) postmonsoon GWL for 2010, (K) postmonsoon GWL for 2015, and (L) postmonsoon GWL for 2020.
To ensure data integrity and accuracy, the error lines present in the Landsat 7 images were removed using QGIS software. The accuracies of the models were determined using KC, which is often referred to as Cohen’s Kappa statistic; KC is a metric for assessing the agreement between two raters or classifiers and accounts for the possibility of chance-based agreement. In RS and GIS, KC is frequently used to evaluate the authenticity of LULC classification.
The KC is calculated using the Equation 1 given by Zhao et al. (2024) as
where Po is the relative observed agreement among the raters (classification accuracy), and Pe is the hypothetical probability of chance agreement calculated using the marginal totals of the confusion matrix.
The KC value ranges from −1 to 1, where 1 indicates perfect agreement between the raters, 0 indicates agreement equal to that expected by chance alone, and −1 indicates complete disagreement between the raters. In the context of LULC classification, a higher value of KC indicates more reliable classification. The confusion matrix for the years 2005 (Table 2), 2010 (Table 3), 2015 (Table 4), and 2020 (Table 5) show high accuracies of 84%, 86%, 90%, and 89%, respectively. These datasets were processed in GEE and exported to ArcGIS 10.8 for further analyses.

Table 2. Confusion matrix of Lahore classification map for the year 2005.
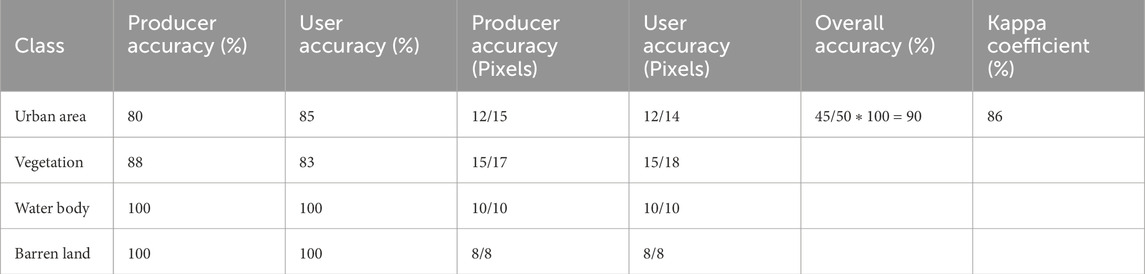
Table 3. Confusion matrix of Lahore classification map for the year 2010.
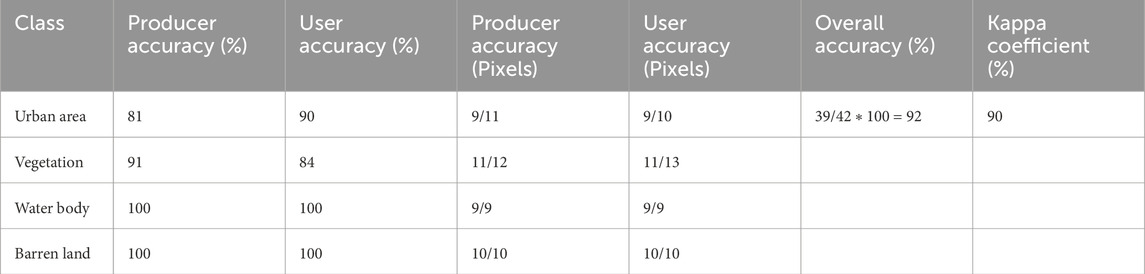
Table 4. Confusion matrix of Lahore classification map for the year 2015.
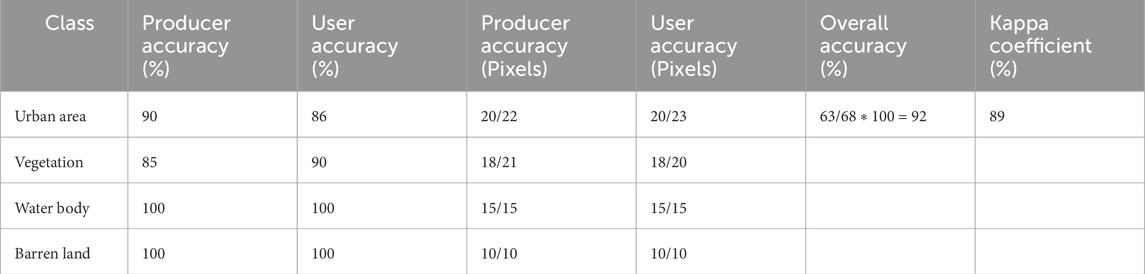
Table 5. Confusion matrix of Lahore classification map for the year 2020.
Data on the depths of the water wells were collected from the PCRWR of Pakistan. Geostatistical analysis was employed to create the spatial groundwater depth maps. Groundwater resource distribution was then identified spatially within the research areas using the inverse distance weighted (IDW) interpolation method in ArcGIS 10.8. By combining the number of well points with linear weights, IDW was used to determine the values of the cells (Tu and Xia, 2008). The groundwater depth maps of the present study for the pre and post monsoon seasons are shown in Figures 3E–L.
Groundwater is significantly influenced by climate parameters (Olivares et al., 2019). The main meteorological component that impacts aquifer recharge is rainfall and is counted as an influential factor for the aquifer potential because regions with high precipitation show more capacity to infiltrate and recharge groundwater reservoirs (Mary et al., 2023). The daily rainfall data for 2005, 2010, 2015, and 2020 were acquired from the CHIRPS satellite, and the corresponding rainfall maps were generated using a 3×3 kernel machine learning algorithm. The use of such a kernel for processing the rainfall data typically involves both data smoothing and integration of the rainfall data. CHIRPS is a high-resolution rainfall dataset that combines satellite imagery with ground station data to provide accurate and up-to-date precipitation information (Shahid et al., 2021). In this context, the 3 × 3 kernel algorithm is likely a spatial filtering technique used to process the data, where 3 × 3 grids are used to calculate the weighted averages or other statistical measures of the rainfall values within the grid. This helps to smooth the data, reduce noise, and improve the spatial representation of rainfall pattern. Overall, the 3 × 3 kernel machine learning algorithm plays a key role in processing the CHIRPS data for generating high-quality rainfall maps that can be used in various applications, such as drought monitoring, water resource management, and climate studies (Nawaz et al., 2021). The spatiotemporal rainfall maps of Lahore district for the years 2005, 2010, 2015, and 2020 are shown in Figures 4A–D, respectively.
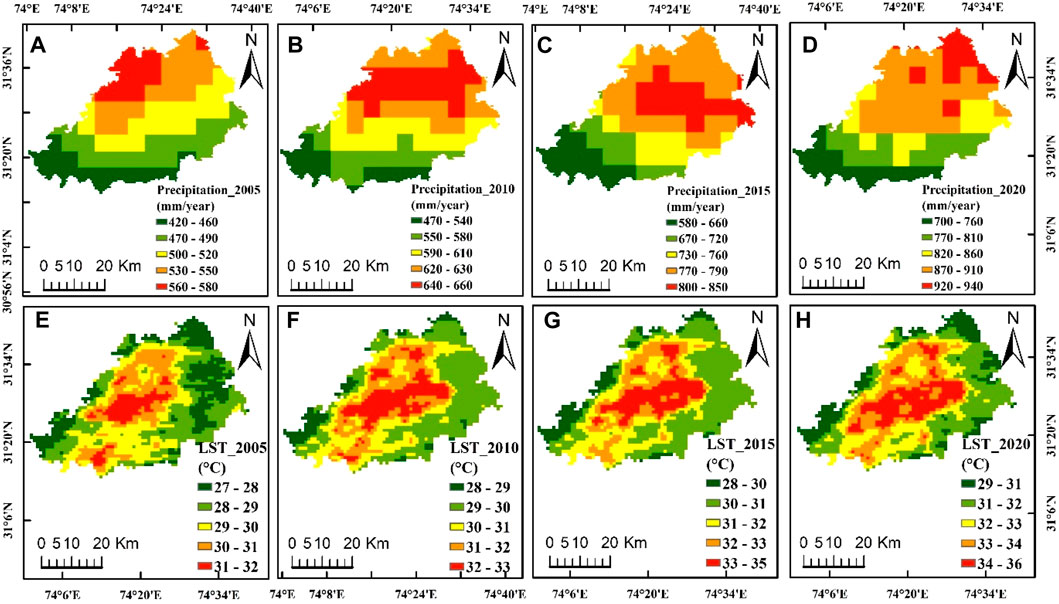
Figure 4. Spatiotemporal climatic variables of the present study: (A) precipitation for 2005, (B) precipitation for 2010, (C) precipitation for 2015, (D) precipitation for 2020, (E) land surface temperature (LST) for 2005, (F) LST for 2010, (G) LST for 2015, and (H) LST for 2020.
The LST is the average temperature of all integral substances on the exterior surface of the Earth. Numerous thermal infrared examinations have been performed by researchers globally to determine the LST. Given the impervious layers in the populus commercial, industrial, and urban regions, the LST has a wider range. The increase in LST in the cities is a result of the tendencies of these concrete materials to retain and use heat during the day and transmit it at nighttime (Zahran et al., 2023b). The LSTs for the years 2005, 2010, 2015, and 2020 in the present work were computed from MODIS data using GEE platform and exported to ArcGIS 10.8 to generate the LST maps. The spatiotemporal LST maps of Lahore region are shown in Figures 4E–H for the years 2005, 2010, 2015, and 2020, respectively.
Kendall’s tau (τ) is mostly applied to compute the associations between variables (Hamed, 2011). This feature has enhanced versatility and broad applicability across disciplines such as psychology, sociology, economics, and biology. The tau test, sometimes referred to as Kendall’s tau test or Kendall’s rank correlation coefficient, is a non-parametric statistical test used to quantify the magnitude and orientation of the relationship between two variables; it is especially beneficial for analyzing ordinal data or when the requirements of parametric tests such as the Pearson correlation are not satisfied. The tau test is a useful method for examining data that do not adhere to the assumptions of other correlation tests since it is not affected by the scale of measurement or existence of outliers. Kendall’s tau (non-parametric measure) has been used to ascertain the associations among hydrometeorological variables (precipitation and temperature) and hydraulic components (such as well depths). A positive correlation suggests that when one variable’s rank increases, the other factor also increases, and vice versa. The range of Kendall’s tau is from −1 to +1. If the tau value is 0 or close to 0, then there should be roughly equal numbers of greater successive readings and smaller following values. As a result, the results are devoid of patterns. These details are mentioned in Table 3.
The GWR approach considers the geographical variations of both dependent and independent variables by evaluating correlations among the recorded locations in accordance with their distances (Chen et al., 2003a; Koh et al., 2020). GWR methods typically outperform the ordinary least-squares (OLS) regression algorithms in terms of predicted accuracy for data with geographical variability (Fotheringham et al., 2003). A multivariate GWR method (Equation 2) was used herein to examine the overlapping effects of LULC and population density variables on surface water quality. The associations between the LULC classes and water quality are just one example of how the GWR is being increasingly used in hydrology to evaluate geographic relationships among various environmental variables (Fotheringham et al., 2015; Abbas et al., 2022b). GWR assists in the authentication of all geographical premises when evaluating geographical phenomena with multidimensional parameters that are effective with spatial dimensions (Iyanda and Osayomi, 2021; Abbas et al., 2022a). To achieve effective and efficient land use management using the GWR approach, it is vital to comprehend the spatiotemporal linkages between LULC and groundwater resources (Koh et al., 2020).
Here, uj and vj are the coordinates of each location j,
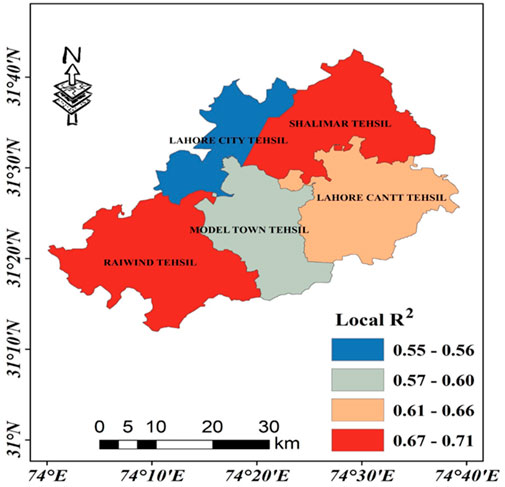
Figure 5. Geographically weighted regression (GWR) technique for geographical heterogeneity of the urban environment in the study area.
In the study area, the spatial distributions of the four primary LULC classes is illustrated for the years 2005, 2010, 2015, and 2020 in Figure 3 and Table 6. These show that the territory covered by the bare ground decreased from 434.63 km2 in 2005 to 161.18 km2 in 2010, 57.09 km2 in 2015, and 81.30 km2 in 2020. The present temporal-based investigations revealed that urbanization in the study area increased with time, i.e., 341.85 km2 in 2005, 506.25 km2 in 2010, 756.76 km2 in 2015, and 950.29 km2 in 2020, as shown in Table 6. From the results shown in Table 6, it is determined that the vegetation trend shows a dramatic decline in the study area. The vegetation in the research region decreased from 1,265.45 km2 in 2005 to 1,229.09 km2 in 2010, 1,084.89 km2 in 2015, and 1,023.91 km2 in 2020. The spatiotemporal results of this study reveal that the surface water bodies has areas of 32.48 km2 in 2005, 31.46 km2 in 2010, 18.91 km2 in 2015, and 10.42 km2 in 2020. The results of the spatiotemporal analyses of the LULC show that the water bodies, vegetation cover, and barren land have been gradually decreasing while the urban environment has consistently increased in the study area.
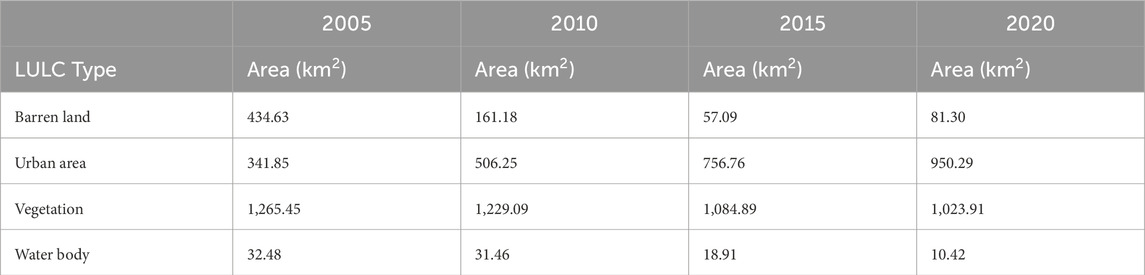
Table 6. Spatiotemporal changes of various classes of the LULC.
The present study reveals that urbanization and climate changes have significantly impacted groundwater resources in Lahore district of Pakistan. The spatiotemporal LULC maps (Figures 3A–D) show a decline in vegetation and an increase in urban areas over time, leading to decreased GWLs. The built-up index expansion is inversely related to the GWL degradation, indicating that the growing urban environment is the primary cause of groundwater decline. The GWL maps (Figures 3E–L) show significant decreases over time, with more pronounced declines during the post monsoon seasons. The spatial maps (Figures 3A–L) demonstrate direct relationships between the LULC changes and decline in GWLs.
The study area is located in a semi-arid, subtropical environment. Here, the monthly mean rainfall is low, and Figure 4 illustrates the monthly fluctuations of precipitation. The significant amounts of precipitation occur during the monsoon seasons in July and August, which substantially contribute to the yearly recharging of aquifers. The annual average rainfall trends from 2005 to 2020 are shown in Figures 4A–D.
Figures 4E–H show the spatial patterns of the LST over Lahore region for the years 2005, 2010, 2015, and 2020, respectively. The analytical outputs of the present study shown in Figure 4E illustrate that the average temperature range was 27°C–32°C in 2005. Figures 4F, G show that the mean LSTs for 2010 and 2015 were 28°C–33°C and 28°C–35°C, respectively. Figure 4H reveals that the average LST for 2020 was 29°C–36°C. The spatiotemporal results of the LST imply that the LST increased with time in the study area. It was observed that the temperature was significantly more severe in the urban environment of the study area relative to the rural regions, indicating the presence of the urban heat island (UHI) effect with apparent severity. The recorded UHI effects have been increasing over the past 20 years, which may be attributed to elements like the growing human population, increase in anthropogenic activities, and changes in the LULC.
To analyze the potential combined impacts of changes in LULC and climatic conditions on the geographical and temporal variations of GWLs between 2005 and 2020, four specific time points were chosen: 2005, 2010, 2015, and 2020. To compensate for the insufficient number of wells in the study region, a total of 27 monitoring wells were randomly selected along with their bordering areas to ensure more accurate results. Figure 6 displays the quantile–quantile (QQ) plots of the pre and post monsoon GWLs at various time intervals. A QQ plot is a visual tool for evaluating the conformity of a dataset to a specific distribution, such as the normal distribution. QQ plots are useful for visualizing changes in the distributions of GWLs over different years and offer insights into the form and variability of the data distribution over time through comparisons of the empirical quantiles of the data to theoretical quantiles of a normal distribution.
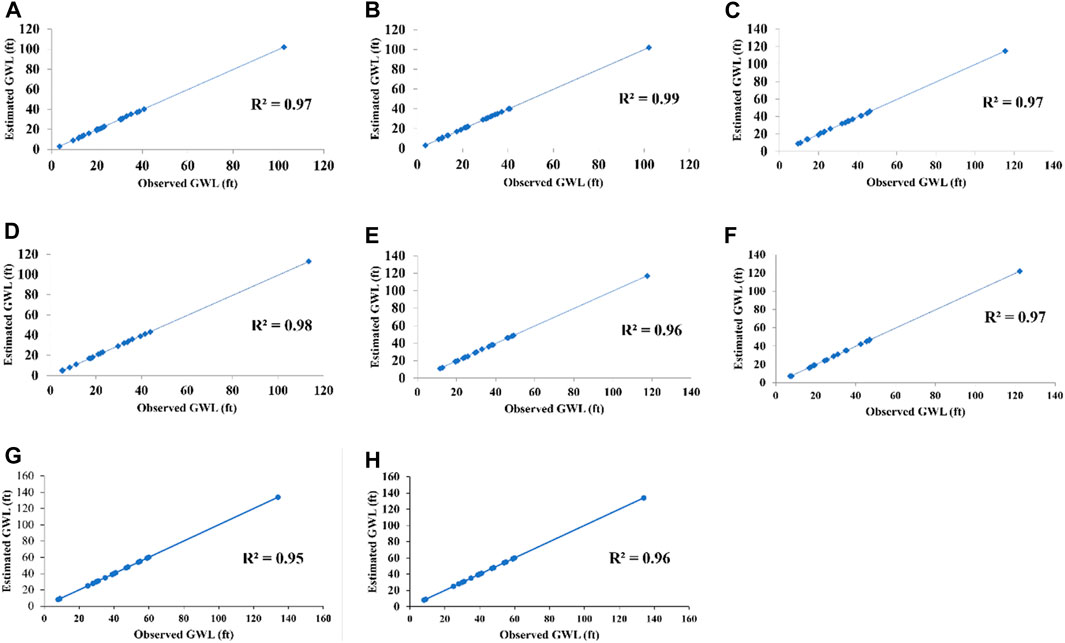
Figure 6. Quantile–quantile (QQ) plots of the study area: (A) premonsoon 2005, (B) postmonsoon 2005, (C) premonsoon 2010, (D) postmonsoon 2010, (E) premonsoon 2015, (F) postmonsoon 2015, (G) premonsoon 2020, and (H) postmonsoon 2020.
The results of the present study show that LULC has significant influence on the groundwater resources. We illustrate that the vegetation decreased over time while the urban environment grew rapidly, adversely disturbing the groundwater table in the study area. In contrast, the number of impermeable surfaces in the Lahore region of Pakistan has been increasing over time. This shows that groundwater resources declined as the built-up index expanded, indicating an inverse relationship between the impervious areas and GWL degradation.
The spatiotemporal LULC maps of the study area for 2005, 2010, 2015, and 2020 are shown in Figures 3A–D; the corresponding groundwater depth maps for the pre and post monsoon seasons are shown in Figures 3E–G and Figures 3H–L, respectively. By comparing the spatial maps in Figures 3A–C with those in Figures 3D–G and Figures 3H–L, it is seen that there was a direct relationship between LULC change and declining GWLs. The QQ plots (Figure 6) show that the study area’s pre and post monsoon GWLs are significantly affected by climate changes. These results clearly indicate that urbanization and climate changes are synergistically impacting groundwater resources, leading to declines in GWLs and groundwater quality. Furthermore, the results of the Kendall’s tau test (Table 7) reveal significant associations between the climate variables and groundwater. Specifically, there is a substantial negative correlation (−0.333) between groundwater quantity and annual average temperature, indicating that rising temperatures are contributing to groundwater depletion. On the other hand, there is a favorable association (0.666) between the yearly groundwater depth and mean precipitation, suggesting that increased precipitation can help mitigate groundwater decline.
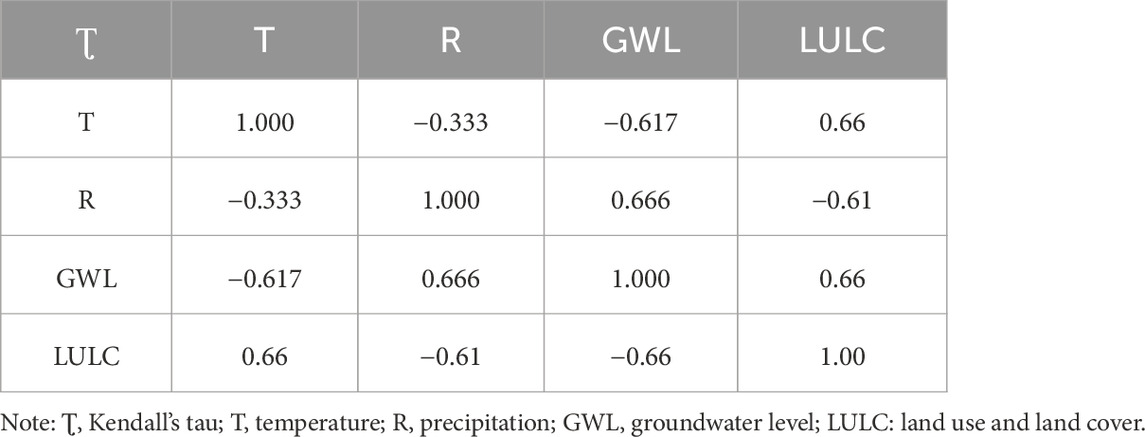
Table 7. Kendall’s tau test (τ) results.
Most of the water used in Lahore is sourced from the groundwater table rather than other sources. To meet the expanding water needs of metropolitan areas and the farming industry, constant water extraction has been investigated over the past 20 years. The spatiotemporal study results of the climatic variables are shown in Figure 4. The yearly average rainfall and temperature in the research region increased steadily over the period of 2005–2020. However, owing to the growing urban environment, the infiltration of precipitation into the soil was disrupted along with the LST. This resulted in loss of vegetation, which in turn hindered the replenishment of groundwater reservoirs.
The GWR analysis was performed in the study area to examine the spatial correlations between the dependent and explanatory variables (within one modeling approach). The dependent variable here was groundwater, while the explanatory variables were the population and built-up area. The findings of the GWR analysis, which illustrate how the local R2 varies throughout the five main regions (Tehsils) in Lahore, are shown in Figure 5. The results show an interesting spatial pattern and positive significance values. For Lahore, the entire area was split into four classes in the GWR analysis: 0.55–0.56, 0.57–0.60, 0.61–0.66, and 0.67–0.71. The variations in the built-up areas in the Raiwind Tehsil ward are strongly connected with changes in the population and GWL, as shown in Figure 5. The local R2 values for the northern, northeastern, and southern portions of Lahore are between 0.55 and 0.60. The model’s importance is demonstrated by the global R2 of 0.84. Overall, these findings imply that limiting the population increase is necessary to ensure sustainability of urbanization.
However, a difference was observed in the relationship between GWL and urban or built-up areas, which has strong impacts on urban planning of Lahore city from an environmental perspective. First, the results show that urbanization processes, which are shown by growing built-up areas and population density, have clear effects on how the groundwater moves. The strong link observed in the Raiwind Tehsil ward shows how important it is to target interventions in areas that are urbanizing rapidly to manage groundwater resources well. Further, the moderate to strong correlations seen in different parts of Lahore show that local factors are very important in shaping groundwater movements. This shows the importance of handling groundwater in a manner tailored to each situation rather than simply using global or regional models. The large global R2 value implies that the model can explain most of the changes in the GWLs across Lahore. This shows that GWR analysis is a useful method for finding links that are spread out over different areas of a city.
Overall, the results show the importance of developing plans for integrated land use and water resources management to ensure that Lahore’s urbanization will be sustainable. Limiting the population growth and controlling the urban sprawl are important steps in protecting groundwater supplies from the damage that come with urbanization and promotion of long-term sustainability. By highlighting the specific impacts of urbanization and climate changes on groundwater resources, this study aims to provide valuable insights for policymakers and stakeholders to develop effective strategies for sustainable groundwater management.
The findings of this study highlight the significant impacts of urbanization and climate changes on groundwater resources in Lahore district of Pakistan. The results show substantial decline in the GWLs, which are consistent with the findings of previous studies (Joodaki et al., 2014; Rana et al., 2018; Tariq et al., 2023a). The current findings also support the notion that urbanization and climate changes are synergistically affecting groundwater resources, leading to a decline in GWLs and decrease in groundwater quality.
Previous research has also shown the decline of aquifers due to urbanization (Delgado et al., 2010; Verma et al., 2020). For instance, a study conducted in Mexico showed that urbanization led to decreased vegetation cover and increased evapotranspiration, resulting in reduced soil moisture and groundwater recharge (Sajjad et al., 2022b). Similarly, a study conducted in India showed that urbanization and climate changes led to a decline in GWLs and decrease in groundwater quality (Kuang et al., 2024).
The current study findings also highlight the importance of considering the impacts of climate change on groundwater resources. The results show that temperature and rainfall variations have significant impacts on the aquifer systems in the study area, which is consistent with the findings of previous studies (Chen et al., 2003b; Jakeman et al., 2016). For instance, a study conducted in Australia showed that climate changes led to increased evapotranspiration and reduced groundwater recharge, resulting in a decline in the GWLs (Mandal et al., 2016).
The findings of the present study have important implications for sustainable groundwater management in Lahore district. The results suggest that urbanization and climate changes significantly affect groundwater resources and that sustainable management strategies must consider these factors. The findings also highlight the need for further research on the impacts of urbanization and climate changes on groundwater resources, particularly in the context of Pakistan. By relating the current findings to those of previous studies, we aim to highlight the importance of these results and provide a more comprehensive understanding of the impacts of urbanization and climate changes on groundwater resources.
This study demonstrates the significant impacts of urbanization and climate changes on groundwater resources in Lahore district of Pakistan. The findings highlight the need for sustainable management strategies to address the decline of GWLs and groundwater quality. The study results therefore have important policy implications, including the following:
1. Urban planning: decision makers should prioritize sustainable urban planning practices that minimize the impacts of urbanization on groundwater resources.
2. Rainwater harvesting: the development of rainwater harvesting structures (RWHSs) can help mitigate the effects of urbanization and climate changes on groundwater resources.
3. Climate change adaptation: policymakers should consider the impacts of climate changes on groundwater resources and develop strategies to adapt to these changes.
4. Interdisciplinary collaborations: future research should also involve interdisciplinary collaborations between hydrology, climatology, urban planning, and policy analysis to address complex research questions.
1. Investigating the impacts of urbanization and climate changes on groundwater quality.
2. Developing innovative geospatial technologies and algorithms to monitor and predict GWLs and groundwater quality.
3. Conducting case studies in other regions to compare the impacts of urbanization and climate changes on groundwater resources.
4. Developing sustainable management strategies for groundwater resources in the context of urbanization and climate change.
By highlighting the policy implications and future directions for research, we aim to provide a clear call to action for decision makers and researchers to address the complex issue of groundwater depletion in the context of urbanization and climate change.
The original contributions presented in the study are included in the article/Supplementary Material, and any further inquiries may be directed to the corresponding authors.
JA: Writing–original draft, Writing–review and editing, Conceptualization, Data curation, Formal analysis, Investigation, Methodology, Resources, Software, Validation. FI: Conceptualization, Formal analysis, Investigation, Methodology, Software, Supervision, Writing–review and editing, Writing–original draft. TB: Formal analysis, Methodology, Software, Supervision, Writing–review and editing. II: Investigation, Resources, Validation, Visualization, Writing–review and editing. MM: Data curation, Project administration, Validation, Writing–review and editing. MS: Formal analysis, Investigation, Resources, Writing–review and editing. FA: Funding acquisition, Resources, Validation, Writing–review and editing. EI: Resources, Validation, Writing–review and editing, Visualization.
The authors declare that financial support was received for the research, authorship, and/or publication of this article. This project was funded by King Saud University, Riyadh, Saudi Arabia (project number RSPD2024R576).
The authors declare that the research was conducted in the absence of any commercial or financial relationships that could be construed as a potential conflict of interest.
All claims expressed in this article are solely those of the authors and do not necessarily represent those of their affiliated organizations or those of the publisher, editors, and reviewers. Any product that may be evaluated in this article or claim that may be made by its manufacturer is not guaranteed or endorsed by the publisher.
Abbas, I., Moheb, J., Fileeh, K., Ebrahhem, M. A., Al, L. A., and Al-Ansari, N. (2022a). Geographically weighted regression model for physical, social, and economic factors affecting the COVID - 19 pandemic spreading. Environ. Sci. Pollut. Res. 29, 51507–51520. doi:10.1007/s11356-022-18564-w
Abbas, S. A., Xuan, Y., and Bailey, R. T. (2022b). Assessing climate change impact on water resources in water demand scenarios using SWAT-MODFLOW-WEAP. Hydrol 2022, 164–169. doi:10.3390/HYDROLOGY9100164
Abdalla, F. (2012). Mapping of groundwater prospective zones using remote sensing and GIS techniques: a case study from the Central Eastern Desert. Egypt: Elsevier. Available at: https://www.sciencedirect.com/science/article/pii/S1464343X12000763.
Al-Bakri, J. T., Duqqah, M., and of Geographic Information, T. B.-J. (2012). Application of remote sensing and GIS for modeling and assessment of land use/cover change in Amman/Jordan. J. Geogr. Inf. Syst. Available at: https://www.scirp.org/html/9-8401287_38390.htm.
Anjomshoaa, A., Kondor, D., Helfert, M., Amini, S., Saber, M., Rabiei-Dastjerdi, H., et al. (2022). Urban land use and land cover change analysis using random forest classification of Landsat time series. Remote Sens. 2022, 2654. doi:10.3390/RS14112654
Asadi, P., Ataie-Ashtiani, B., and Beheshti, A. (2017). Vulnerability assessment of urban groundwater resources to nitrate: the case study of Mashhad, Iran. Environ. Earth Sci. 76, 41. doi:10.1007/S12665-016-6357-Z
Chen, J., Li, J., Zhang, Z., Global, S. N.-, and Change, P. (2014). Long-term groundwater variations in Northwest India from satellite gravity measurements. Glob. Planet. Chang. •Elsevier 116, 130–138. doi:10.1016/j.gloplacha.2014.02.007
Chen, Q., Mei, K., Dahlgren, R., and Wang, T. (2003a). Impacts of land use and population density on seasonal surface water quality using a modified geographically weighted regression. USA: Elsevier. Available at: https://www.sciencedirect.com/science/article/pii/S0048969716317442 (Accessed June 21, 2023).
Chen, Y. X., Zhang, Y., and Chen, G. H. (2003b). Appropriate conditions or maximizing catalytic reduction efficiency of nitrate into nitrogen gas in groundwater. Water Res. 37, 2489–2495. doi:10.1016/S0043-1354(03)00028-9
Delgado, C., Pacheco, J., Cabrera, A., Batllori, E., Orellana, R., and Bautista, F. (2010). Quality of groundwater for irrigation in tropical karst environment: the case of Yucatán, Mexico. Agric. Water Manag. 97, 1423–1433. doi:10.1016/J.AGWAT.2010.04.006
Faheem, H., Khattak, Z., Islam, F., Ali, R., Khan, R., Khan, I., et al. (2023a). Groundwater potential zone mapping using geographic information systems and multi-influencing factors: a case study of the Kohat District, Khyber Pakhtunkhwa. Front. Earth Sci. 11. doi:10.3389/feart.2023.1097484
Foster, P. (2001). The potential negative impacts of global climate change on tropical montane cloud forests. Earth-Science Rev. 55, 73–106. doi:10.1016/S0012-8252(01)00056-3
Fotheringham, A. S., Brunsdon, C., and Charlton, M. (2003). Geographically weighted regression: the analysis of spatially varying relationships. Available at: https://books.google.com/books?hl=en&lr=&id=9DZgV1vXOuMC&oi=fnd&pg=PR7&ots=66HHLen8CI&sig=kLDQuh0ITe3QCr8Oku3Yj761UNg.
Fotheringham, A. S., Crespo, R., and Yao, J. (2015). Geographical and temporal weighted regression (GTWR). Geogr. Anal. 47, 431–452. doi:10.1111/GEAN.12071
Gul, S., Bibi, T., Rahim, S., Gul, Y., Niaz, A., Mumtaz, K. S., et al. (2022a). Monitoring of land use and land cover changes using remote sensing and geographic information system. doi:10.21203/RS.3.RS-1721904/V1
Gul, S., Ren, J., Wang, K., and Guo, X. (2022b). Estimation of reference evapotranspiration via machine learning algorithms in humid and semiarid environments in Khyber Pakhtunkhwa, Pakistan. Int. J. Environ. Sci. Technol. 20, 5091–5108. doi:10.1007/S13762-022-04334-1
Hamed, K. H. (2011). The distribution of Kendall’s tau for testing the significance of cross-correlation in persistent data. Taylor Fr. 56, 841–853. doi:10.1080/02626667.2011.586948
Islam, F., Tariq, A., Guluzade, R., Zhao, N., Shah, S. U., Ullah, M., et al. (2023a). Comparative analysis of GIS and RS based models for delineation of groundwater potential zone mapping. Geomatics, Nat. Hazards Risk 14. doi:10.1080/19475705.2023.2216852
Islam, F., Tariq, A., Guluzade, R., Zhao, N., Shah, S. U., Ullah, M., et al. (2023b). Comparative analysis of GIS and RS based models for delineation of groundwater potential zone mapping. Geomat. Nat. Hazards Risk 14. doi:10.1080/19475705.2023.2216852
Iyanda, A. E., and Osayomi, T. (2021). Is there a relationship between economic indicators and road fatalities in Texas? A multiscale geographically weighted regression analysis. GeoJournal 86, 2787–2807. doi:10.1007/S10708-020-10232-1
Jakeman, A. J., Barreteau, O., Hunt, R. J., Rinaudo, J. D., Ross, A., Arshad, M., et al. (2016). Integrated groundwater management: an overview of concepts and challenges. Libr. oapen.Org., 3–20. doi:10.1007/978-3-319-23576-9_1
Javed, T., Sarwar, T., Ullah, I., Ahmad, S., and Rashid, S. (2019). Evaluation of groundwater quality in district karak khyber pakhtunkhwa, Pakistan. Water Sci. 33, 1–9. doi:10.1080/11104929.2019.1626630
Jiang, X., Zhao, S., Chen, Y., and Lu, D. (2022). Exploring tree species classification in subtropical regions with a modified hierarchy-based classifier using high spatial resolution multisensor data. J. Remote Sens. (United States) 2022. doi:10.34133/2022/9847835
Joodaki, G., Wahr, J., and Research, S. S.-W. R. (2014). Estimating the human contribution to groundwater depletion in the Middle East, from GRACE data, land surface models, and well observations. Wiley Online Libr. 50, 2679–2692. doi:10.1002/2013WR014633
Kalhor, K., and Emaminejad, N. (2019). Sustainable development in cities: studying the relationship between groundwater level and urbanization using remote sensing data. China: Elsevier. Available at: https://www.sciencedirect.com/science/article/pii/S2352801X19300712.
Kalhor, K., and Ghasemizadeh, R. (2019). Assessment of groundwater quality and remediation in karst aquifers: a review. China: Elsevier. Available at: https://www.sciencedirect.com/science/article/pii/S2352801X18301632 (Accessed August 2, 2023).
Kalhor, K., and Mahdisoltani, M. (2015). Urbanization and its effects on the environment and society along with sustainable development. Res. Kalhor, M. MahdisoltaniThird Int. Symp. Environ. Water Resour. 2015•researchgate.net.
Khazaei, E., Mackay, R., and international, J. W. W.-W. (2004). The effects of urbanization on groundwater quantity and quality in the Zahedan aquifer, southeast Iran. Taylor Fr. 29, 178–188. doi:10.1080/02508060408691767
Koh, E., Lee, E., and Lee, K. (2020). Application of geographically weighted regression models to predict spatial characteristics of nitrate contamination: implications for an effective groundwater management strategy. J. Environ. Manage. 268, 110646. doi:10.1016/j.jenvman.2020.110646
Kuang, X., Liu, J., Scanlon, B. R., Jiao, J. J., Jasechko, S., Lancia, M., et al. (2024). The changing nature of groundwater in the global water cycle. Science 80, eadf0630. doi:10.1126/SCIENCE.ADF0630
Mandal, U., Sahoo, S., Munusamy, S. B., Dhar, A., Panda, S. N., Kar, A., et al. (2016). Delineation of groundwater potential zones of coastal groundwater basin using multi-criteria decision making technique. Water Resour. Manag. 30, 4293–4310. doi:10.1007/s11269-016-1421-8
Maqsoom, A., Aslam, B., Khalil, U., Ghorbanzadeh, O., Ashraf, H., Tufail, R. F., et al. (2020). A GIS-based DRASTIC model and an adjusted DRASTIC model (DRASTICA) for groundwater susceptibility assessment along the China–Pakistan economic corridor (CPEC) route. ISPRS Int. J. Geo-Information 2020, 332. doi:10.3390/IJGI9050332
Mary, R., Nasir, R., Alam, A., and Tariq, A. (2023). Exploring hazard quotient, cancer risk, and health risks of toxic metals of the mehmood booti and lakhodair landfill groundwaters, Pakistan. Germany: Elsevier. Available at: https://www.sciencedirect.com/science/article/pii/S2215153223000624 (Accessed June 21, 2023).
Minnig, M., Moeck, C., Radny, D., and Schirmer, M. (2018). Impact of urbanization on groundwater recharge rates in Dübendorf, Switzerland. J. Hydrol. 563, 1135–1146. doi:10.1016/J.JHYDROL.2017.09.058
Mishra, N., and Khare, D. (2014). Impact of land use change on groundwater—a review, R ShuklaAdvances Water Resour. Prot. 2014•researchgate.net. Available at: https://www.researchgate.net/profile/Nitin-Mishra-5/publication/279951307_Impact_of_Land_Use_Change_on_Groundwater_-_A_Review/links/559f723408ae03c44a5cf96c/Impact-of-Land-Use-Change-on-Groundwater-A-Review.pdf (Accessed April 4, 2024).
Mishra, N., and Sharma, A. K. (2021). Groundwater storage analysis in changing land use/land cover for haridwar districts of upper ganga canal command (1972–2011). Lect. Notes Civ. Eng. 87, 233–241. doi:10.1007/978-981-15-6463-5_22/COVER
Nawaz, M., Iqbal, M. F., and Mahmood, I. (2021). Validation of CHIRPS satellite-based precipitation dataset over Pakistan. Atmos. Res. 248, 105289. doi:10.1016/J.ATMOSRES.2020.105289
Olivares, E. O., Sensing, S. S. T.-R., Belmonte Jiménez, S. I., Campos Enríquez, J. O., Zignol, F., Reygadas, Y., et al. (2019). Climate change, land use/land cover change, and population growth as drivers of groundwater depletion in the Central Valleys, Oaxaca, Mexico. mdpi.Com. 11, 1290. doi:10.3390/rs11111290
Rana, R., Ganguly, R., and Gupta, A. K. (2018). Indexing method for assessment of pollution potential of leachate from non-engineered landfill sites and its effect on ground water quality. Environ. Monit. Assess. 190, 46. doi:10.1007/S10661-017-6417-1
Rehman, A., Islam, F., Tariq, A., Islam, I. U., J, D. B., Bibi, T., et al. (2024a). Groundwater potential zone mapping using GIS and Remote Sensing based models for sustainable groundwater management. Geocarto Int. 39. doi:10.1080/10106049.2024.2306275
Rehman, Z. U., Khan, N. M., Haq, F. U., Ahmad, I., and Raheem, A. (2024b). Evaluation of groundwater vulnerability in the Rachna Doab using a modified DRASTIC model: a comparative analysis. Int. J. Environ. Sci. Technol. 21, 6459–6480. doi:10.1007/S13762-024-05465-3
Sajjad, M. M., Wang, J., Abbas, H., Ullah, I., Khan, R., and Ali, F. (2022b). Impact of climate and land-use change on groundwater resources, study of faisalabad district, Pakistan. Atmos. 2022, Vol., Page 1097–1113. doi:10.3390/ATMOS13071097
Shahid, M., Rahman, K. U., Haider, S., Gabriel, H. F., Khan, A. J., Pham, Q. B., et al. (2021). Assessing the potential and hydrological usefulness of the CHIRPS precipitation dataset over a complex topography in Pakistan. Hydrol. Sci. J. 66, 1664–1684. doi:10.1080/02626667.2021.1957476
Shakrullah, K., and Shirazi, S. A. (2023). Changing Landscape Pattens And Its Effect On Rising Land Surface Temperature Of Lahore-Pakistan. Pak. J. Sci. 74. doi:10.57041/PJS.V74I3.788
Singh, A. (2014). Groundwater resources management through the applications of simulation modeling: a review. Sci. Total Environ. 499, 414–423. doi:10.1016/J.SCITOTENV.2014.05.048
Subramani, T., and Krishnan, S. (2012). Study of groundwater quality with GIS application for Coonoor taluk in Nilgiri district. Int. J. Mod. Eng. Res. 2, 586–592. Available at: https://www.researchgate.net/profile/Arvind-Singh-21/post/How-can-we-study-about-the-water-quality-using-GIS/attachment/5c8549facfe4a7299494740c/AS%3A734958196903937%401552239097992/download/3.pdf.
Tariq, A., Ali, S., Basit, I., Jamil, A., Farmonov, N., Khorrami, B., et al. (2023a). Terrestrial and groundwater storage characteristics and their quantification in the Chitral (Pakistan) and Kabul (Afghanistan) river basins using GRACE/GRACE-FO satellite data. Groundw. Sustain. Dev. 23, 100990. doi:10.1016/J.GSD.2023.100990
Tariq, A., and Mumtaz, F. (2023). Modeling spatio-temporal assessment of land use land cover of Lahore and its impact on land surface temperature using multi-spectral remote sensing data. Environ. Sci. Pollut. Res. Int. 30, 23908–23924. doi:10.1007/S11356-022-23928-3
Tu, J., and Xia, Z. G. (2008). Examining spatially varying relationships between land use and water quality using geographically weighted regression I: model design and evaluation. USA: Elsevier. Available at: https://www.sciencedirect.com/science/article/pii/S0048969708009121 (Accessed June 21, 2023).
Ullah, W., Karim, A., Ullah, S., Rehman, A. U., Bibi, T., Wang, G., et al. (2023). An increasing trend in daily monsoon precipitation extreme indices over Pakistan and its relationship with atmospheric circulations. Front. Environ. Sci. 11. doi:10.3389/fenvs.2023.1228817
Verma, P., Singh, P., and Srivastava, S. K. (2020). Impact of land use change dynamics on sustainability of groundwater resources using earth observation data. Environ. Dev. Sustain. 22, 5185–5198. doi:10.1007/S10668-019-00420-6
Wakode, H., Baier, K., Jha, R., and Water, R. A.-I. S. (2018). Impact of urbanization on groundwater recharge and urban water balance for the city of Hyderabad. India: Elsevier. Available at: https://www.sciencedirect.com/science/article/pii/S2095633916300818 (Accessed June 23, 2023).
Zahran, H., Ali, M., Jadoon, K., Sustainability, H. Y.-, Rahman, K. U., and Sheikh, N. A. (2023a). Impact of urbanization on groundwater and surface temperature changes: a case study of Lahore city. mdpi.Com. 15, 6864. doi:10.3390/su15086864
Zahran, H., Ali, M. Z., Jadoon, K. Z., Ullah, H., Yousafzai, K., Rahman, K. U., et al. (2023b). Impact of urbanization on groundwater and surface temperature changes: a case study of Lahore city.
Keywords: urbanization, climate change, Lahore, Pakistan, remote sensing, geographical information system (GIS)
Citation: Ali J, Islam F, Bibi T, Islam I, Mughal MR, Sabir M, Awwad F and Ismail E (2024) Quantifying the impact of climate change and urbanization on groundwater resources using geospatial modeling. Front. Earth Sci. 12:1377367. doi: 10.3389/feart.2024.1377367
Received: 27 January 2024; Accepted: 25 June 2024;
Published: 21 August 2024.
Edited by:
Mohamed Ahmed, Texas A&M University Corpus Christi, United StatesReviewed by:
Youssef M. Youssef, Suez University, EgyptCopyright © 2024 Ali, Islam, Bibi, Islam, Mughal, Sabir, Awwad and Ismail. This is an open-access article distributed under the terms of the Creative Commons Attribution License (CC BY). The use, distribution or reproduction in other forums is permitted, provided the original author(s) and the copyright owner(s) are credited and that the original publication in this journal is cited, in accordance with accepted academic practice. No use, distribution or reproduction is permitted which does not comply with these terms.
*Correspondence: Fakhrul Islam, Z2VvLmZha2hhcjE5ODlAZ21haWwuY29t; Tehmina Bibi, dGVobWluYS5iaWJpQGFqa3UuZWR1LnBr
Disclaimer: All claims expressed in this article are solely those of the authors and do not necessarily represent those of their affiliated organizations, or those of the publisher, the editors and the reviewers. Any product that may be evaluated in this article or claim that may be made by its manufacturer is not guaranteed or endorsed by the publisher.
Research integrity at Frontiers
Learn more about the work of our research integrity team to safeguard the quality of each article we publish.