
94% of researchers rate our articles as excellent or good
Learn more about the work of our research integrity team to safeguard the quality of each article we publish.
Find out more
ORIGINAL RESEARCH article
Front. Earth Sci., 27 September 2024
Sec. Atmospheric Science
Volume 12 - 2024 | https://doi.org/10.3389/feart.2024.1376605
 Andrew M. Thomas*
 Stephen Noble
To convert lightning indices generated by numerical weather prediction experiments into binary lightning hazard, a machine-learning tool was developed. This tool, consisting of parallel multilayer perceptron classifiers, was trained on an ensemble of planetary boundary layer schemes and microphysics parameterizations that generated four different lightning indices over 1 week. In a subsequent week, the multi-physics ensemble was applied and the machine-learning tool was used to evaluate the accuracy. Unintuitively, the machine-learning tool performed better on the testing dataset than the training dataset. Much of the error may be attributed to mischaracterizing the convection. The combination of the machine learning model and simulations could not differentiate between cloud-to-cloud lightning and cloud-to-ground lightning, despite being trained on cloud-to-ground lightning. It was found that the simulation most representative of the local operational model was the most accurate simulation tested.
While lightning risk has been steadily decreasing in the United States (Holle, 2016), exposure to lightning is projected to increase in a warming climate (Romps et al., 2014; Romps, 2019). Lightning indices, which quantify lightning hazards derived from numerical weather prediction models, are an important means of alerting those exposed to the hazard (Price and Rind, 1994; McCaul et al., 2009; Romps et al., 2014). The lightning potential index (LPI) (Yair et al., 2010) is one index that is useful for cloud-resolving models and is well-correlated with lightning strikes (Lynn and Yair, 2010; Gharaylou et al., 2019). The LPI quantifies the charge separation within the charging zone using model state variables via integrating the vertical velocity squared and a microphysical scaling parameter through the charging zone (the vertical column between 0°C and −20°C). While there are more sophisticated methods of predicting lightning (Lynn et al., 2012; Gharaylou et al., 2020), the computational efficiency of the LPI makes it more useful in an operational setting. One alternative to the LPI is the product of convective available potential energy (CAPE) and convective precipitation (hereafter referred to as CAPE-P). CAPE-P relies under the assumption that if there is convective precipitation, then lightning should be generated. This seems to perform better in some areas, such as the boreal region (Mortelmans et al., 2022), and over land (Romps et al., 2018). Two more useful indices are McCaul’s lightning threat index (McCaul et al., 2009) (LTI) and the index proposed by Price and Rind (1994) (PR92W). The LTI combines the vertical movement of graupel at −15°C and the vertical integral of cloud ice and hydrometeors. PR92W relies on correcting the maximum updraft velocity for resolution. PR92W and CAPE-P were originally designed for climate models, where resolution requirements forced parameterization of convection, and both indices were used to make inferences for lightning. While the LPI has been shown to be a better indicator of lightning than some of the other indices described (Saleh et al., 2023), the consideration of multiple lightning indices may be more informative than any one lightning index.
Previous studies of lightning index skill focus on particular case studies. Malečić et al. (2022) examined three cases with a large amount of hail and found systematic underprediction in the amount of lightning predicted using an ensemble of microphysics and planetary boundary layer (PBL) schemes by using the LPI. Lynn and Yair (2010) used two cases where there was a significant amount of lightning and found that the time-averaged LPI was well correlated with accumulated lightning flash density over space. The examination of the most significant lightning events may favor model performance, whereas the “garden variety” thunderstorm may be overlooked. These types of unorganized, non-severe storms tend to lead to the most lethal lightning incidents (Ashley and Gilson, 2009). Some studies examine the global distribution of lightning through climate change (Price and Rind, 1992; Finney et al., 2014; Romps et al., 2014).
These “garden variety” or “pulse thunderstorms” are regular occurrence to the southeastern United States (Miller and Mote, 2017) with topography influencing the spatial variability (Miller and Mote, 2017). The observed positive feedback mechanism between the soil moisture and atmosphere (Findell and Eltahir, 2003) resulting in high precipitation recycling (Dominguez et al., 2006) and a subtropical climate promote these non-severe thunderstorms. Therefore, the southeastern United States during the warm season is a suitable environment to study non-severe thunderstorms. This study will establish relationships between the four previously mentioned lightning indices, as computed by a physics-based ensemble of Weather Research and Forecasting (WRF) model simulations and observations of lightning through the use of a multilayer perceptron classifier.
There is some regional and event-specific variation to the relationship between lightning indices and lightning flashes (Yair et al., 2010). For example, while the LPI is clearly indicative of lightning, there is currently no universal relationship between the two. One method for mitigating this is to form a regression on the sorted values (Brisson et al., 2021; Mortelmans et al., 2022). This disregards amplitude error, favoring smoothing out spatiotemporal errors associated with the model. Other circumstances, such as the seasonality or event-specific nature of lightning, are also outstanding factors. Lead time or model configuration may be influential in identifying the predictability of lightning strikes in a future study. Disentangling the diagnostic capacity of lightning indices from model error is a prerequisite for identifying a generalizable, albeit local, relationship for predicting lightning.
We hypothesize that identifying a mean classification relationship from a physics-based model ensemble should reduce the bias associated with individual simulations. To this end, we trained a series of machine-learning based tool on a physics-based ensemble that will test different configurations of the microphysics and PBL schemes. The tool should combine lightning indices to identify a probability of cloud-to-ground lightning. This tool should not be reliant of model configuration, as to compare the model performance. The microphysics schemes should address variances in knowledge concerning microphysical development, while PBL schemes concern variances in the development of convection and the supply of moisture. Both are important to the development of convection, and especially lightning. This should lead to an ensemble average of probabilities based on indices that had variations from microphysics and PBL parameterizations. The effectiveness of this ensemble averaged probability will be tested on a subsequent period on each model run to compare model configurations for optimal use. The metrics to be evaluated include correlation coefficient, elements of confusion matrices, and the standard deviation normalized by the observations.
Operational forecasts are issued by the Atmospheric Technologies Group (ATG) of the Savannah River National Laboratory (SRNL) to protect workers at the Savannah River Site (SRS). SRNL and SRS have a wealth of meteorological observations for the southeastern United States, which is a region of increasing research interest regarding convection (Rasmussen, 2015; Kuang, 2023; Kosiba et al., 2023). SRS is a vast industrial facility with a large contingent of outdoor workers (over 1,000). ATG provides tailored hyper-local forecasts to assist in both weather-sensitive operations and worker safety. ATG is interested in producing guidance regarding lightning forecasts. Daily numerical weather model predictions from the Weather and Research Forecasting model (WRF) (Skamarock et al., 2019), with 36 h of lead time, are used to assist forecasters (Figure 1). The nested domain (D02) (Figure 1) is our area of interest. To test the implementation of the lightning indices into routine forecast operations, we have adopted the configuration described in Table 1. To create our 12-member set of experiments, we adjusted the microphysics parameterization, the boundary layer parameterization, and the surface layer parameterization (Table 2).
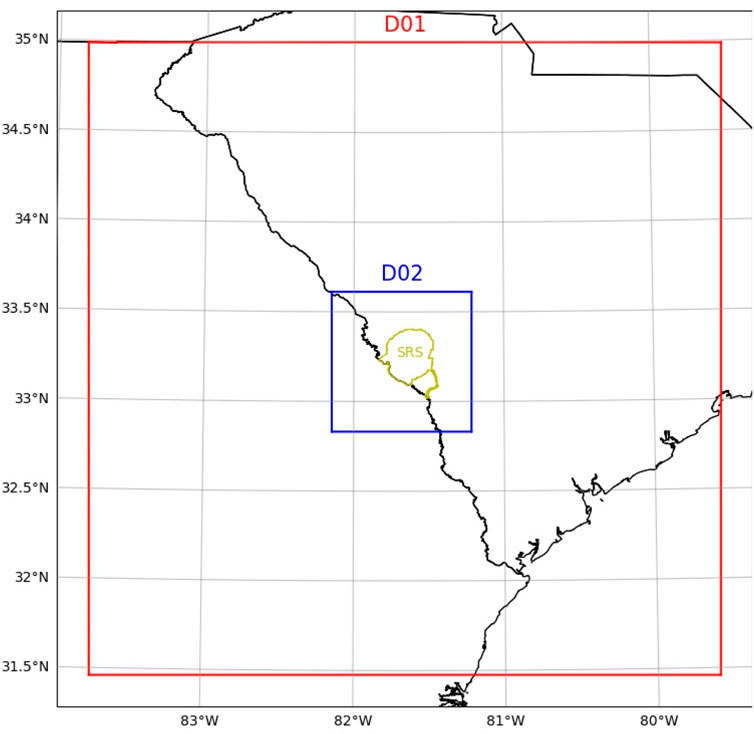
Figure 1. Location of the parent domain (D01) and nested domain (D02) which makes up the area of interest. The boundary of the Savannah River Site (SRS), located in the Southeastern United States, is plotted in yellow.
For some lightning indices, namely, the LPI and LTI, the microphysical mixing ratios are crucial for calculation. The microphysics parameterization modulates latent heating, which is a requirement for moist convection. The PBL parameterization is also an important feature, as it modifies the vertical transfer of heat and moisture that triggers convection. Vertical fluxes of moisture and heat have an important role in the development of convection and supply moisture from the surface. This is relevant, since the eastern US experiences a positive feedback mechanism between surface moisture and precipitation (Findell and Eltahir, 2003).
The specific parameterizations (Table 2) were chosen to describe commonly used PBL and microphysics parameterizations according to a WRF Physics Use survey from August 2015. The control run (CTRL) for this experiment most resembles the operational configuration, which uses the Thompson microphysics scheme (Thompson et al., 2008) and the third order Mellor-Yamada-Nakanishis-Niino (MYNN) scheme (Nakanishi and Niino, 2006; 2009; Olson et al., 2019). The other microphysics schemes tested include the Morrison (Morrison et al., 2009) and WRF Single Moment 6-Class (WSM6) (Hong and Lim, 2006) schemes. The other PBL schemes examined include the Yonsei University (YSU) (Hong et al., 2006), the Mellor-Yamada-Janjic (MYJ) (Mesinger, 1993; Janjić, 1994) and MYNN scheme (Nakanishi and Niino, 2006; 2009; Olson et al., 2019), including the 2.5 (denoted as MYN2) and third order scheme (MYN3). The YSU scheme is a nonlocal PBL scheme, while the MYJ is a 1.5-order turbulence closure model, and the MYN2 and MYN3 use a 2.5 and third order local turbulence closure. WSM6 is the only single moment (bulk mixing ratios only) microphysics scheme considered, while the Thompson and Morrison are both double-moment (mixing ratios and concentrations) microphysics parameterizations.
Two weeks of 36 h simulations were conducted for each experiment, with the first initialization on 7 July 2022 at 6 UTC and the last simulation initialized 20 June 2022 at 6 UTC. One slight difference between the experimental setup described and the operational settings is that operationally, nudging of in situ temperature, humidity, and wind observations at the SRS is implemented. Although observations are available for the entirety of this study, incorporating observations via nudging may reduce the differences between experiments, and thus dilute our result. While routine simulations are conducted every 6 h, only simulations initialized at 6 UTC were conducted for this study. The reasoning for this is that a forecaster may place more weight on recent initializations rather than previous initializations and 6 UTC runs are the most current to issue the morning forecast. During this period, lightning was abundant and occurred on most days (Figure 2). The National Lightning Detection Network (NLDN) (Murphy et al., 2021) was chosen since it measures cloud-to-ground lightning strikes, which is more relevant to the safety of outside workers. The number of lightning strikes varied during this period, with a peak exceeding 400 strikes, as well as a single strike in a 15 min period. There were some time periods where lightning was not observed in the NLDN but observed by the Geostationary Lightning Mapper (GLM), namely, 18 and 19 July 2022. That is, if lightning was observed by the GLM, which observes all lightning by detecting flashes in the visual range on the Geostationary Operational Environmental Satellite, but not reported by the NLDN, which observes cloud-to-ground lightning, then discrepancies between the two may be caused by cloud-to-cloud or cloud-to-air lightning. While we primarily used the NLDN for training the model, the GLM was useful for independent verification in the analysis.
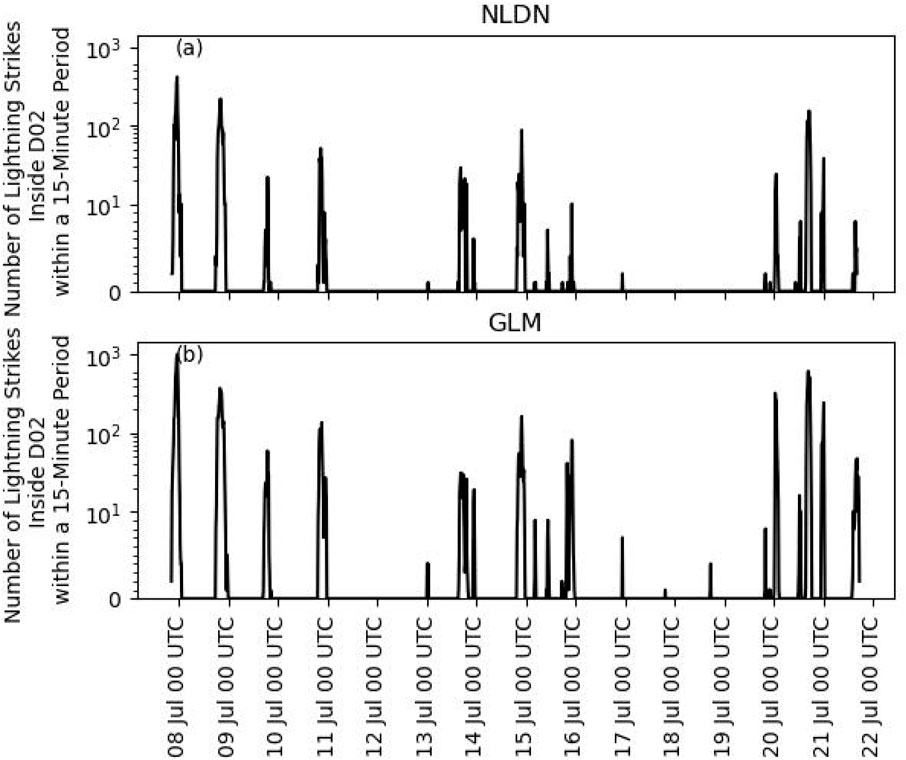
Figure 2. Number of Lightning strikes within a 15 min period inside D02 during the period of interest from the National Lightning Detection Network (NLDN) (A) and Geostationary Lightning Mapper (GLM) (B).
We used four lightning indices to diagnose lightning. The Lightning Potential Index (LPI) was calculated by WRF’s internal implementation and is computed by integrating the product of the vertical velocity squared against the ratio of the geometric mean to the arithmetic mean of liquid and frozen hydrometeors. The product of CAPE and precipitation rate (CAPE-P) was computed by multiplying the precipitation rate, which was calculated by applying centered finite differencing to accumulated precipitation, by the CAPE as computed by WRF-Python (Ladwig, 2017). The PR92W index uses the maximum vertical velocity, similar to that found by Price and Rind (1992), but scaled by the resolution (Wong et al., 2013). The McCaul’s Lightning Threat index (LTI) uses a combination of vertical graupel flux and total hydrometeors. LTI, LPI, and PR92W all use the vertical velocity, while CAPE-P simply uses CAPE as a proxy for the vertical velocity. LTI and LPI directly use the 3D mixing ratios of microphysics, while CAPE-P uses the precipitation rate to infer the convection being generated and PR92W does not consider the microphysical state. While both LPI and PR92W can be computed internally within WRF, all calculations of the lightning indices were performed offline.
Model errors in convective initiation were accounted for by both smoothing and sorting. First a 3 h moving average was applied to both lightning indices and gridded binary NLDN observations. Then the model and observed values were sorted at each timestep, retaining chronological relevance. This is similar to Brisson et al. (2021) and Mortelmans et al. (2022) which sorted all values in space and time, but is altered for operational value since each model run comprises 36 h of predictions. While this method of spatiotemporal reorganization may result in less pristine relationships between lightning indices and lightning observations, it will prevent associating lightning indices with observations potentially 36 h prior. Moreover, it should be more analogous to how lightning would be operationally evaluated than absolutely sorting time and space. Indices are still sorted in space to account for discrepancies in location of model convection, but smoothing and temporal sequencing retains the temporal relevance. This processing was only applied to the data ingested by a machine-learned (ML) member.
Each experiment was divided into two datasets. Simulations initialized between 7 and 13 July 2022 were designated as a training dataset, while simulations initialized between 14 and 20 July 2022 were designated as a testing dataset. The testing dataset may then be a mostly independent dataset, with the exceptions of being closely related in time as well as the 12 h overlap between the experiments initialized on the 13 July and 14 July. The lightning indices of the training dataset of each experiment were converted into the standard score (subtracted by the mean and divide by the standard deviation) by the Standard Scaler, and then underwent Principal Component Analysis (PCA) via scikit-learn (Pedregosa et al., 2011). Each principal component is a linear combination of the four lightning indices that is orthogonal to the other components. Orthogonality is important for reducing the multicollinearity that arises when several indices are related on a similar physical process-namely, the generation of lightning. The first two components of the PCA were then used to train a multilayer perceptron classifier-type of neural network on binary observations of lightning. The pipeline of the StandardScaler, which divides the mean-subtracted variable by its trained variance, to PCA to multilayer perceptron classifier (MLPClassifier) is denoted a ML member, with each experiment associated with a ML member. The MLPClassifier can provide not just a classification, but also a probability for each classification by applying a forward pass. Some hyperparameters, shown in Table 3, were chosen via an exhaustive grid search with cross-validation (GridSearchCV), maximizing the equitable threat score. The other hyperparameters, some of which were dependent on the results of GridSearchCV, were found by testing randomly selected values on a normal distribution (RandomizedSearchCV) to further optimize the equitable threat score. Details regarding the final hyperparameters and the mean equitable threat score as applied to the (processed) training dataset of the MLPClassifiers are found in Supplementary Table S1. Thus with 12 ML members available, a composite mean of probabilities of lightning can be attained.
After a ML member was trained on each experiment during the training period, the ensemble of ML members was applied to each experiment within the testing dataset. The average of the probabilities was used, which ideally would make a composite estimator for determining model performance, creating an impartial post processed binary lightning product for identifying model performance. This process is depicted in Figure 3. One advantage to this is the generation of multiple probabilities gives a possible range and confidence to the estimate, but we do not explore this aspect in any detail. There are several weaknesses to this, such as biases in the training data leading to biases in the estimator. While taking an average of the probabilities should lead to an impartial probability and attempts to avoid overfitting, the biases in each trained dataset can lead to biases in evaluating the testing dataset. Additionally, the composition of several neural networks and training on a recurrent phenomenon limits the scope of the usability and portability of this composite of ML members. One other downside of having different PCAs associated with different experiments brings up an issue of not being able to intercom pare the components of each PCA.
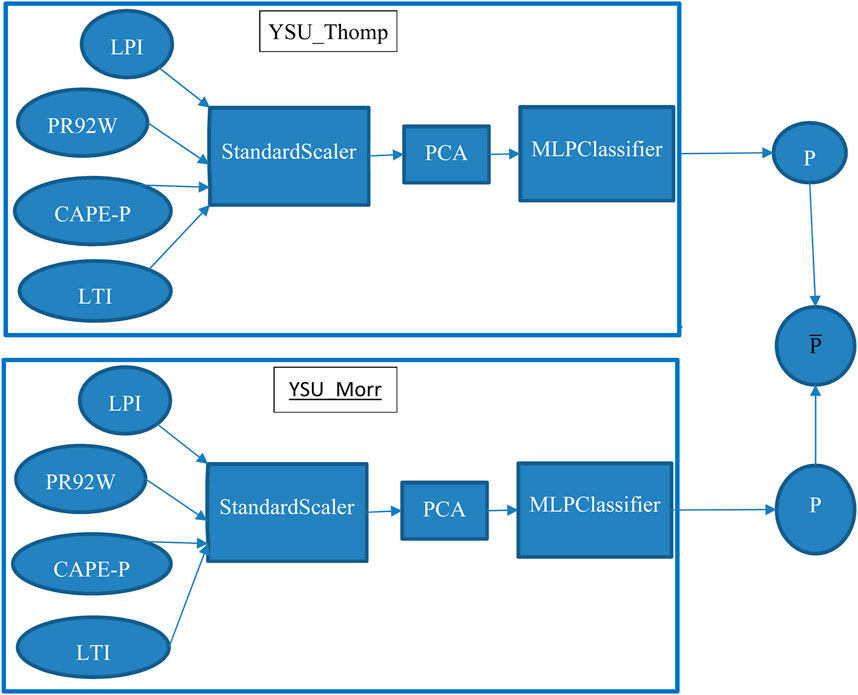
Figure 3. Flowchart showing part of the ensemble of machine learning tools in an abridged format (with only two variables and two members of the ensemble).
Table 4 shows the percentage of the contribution, which we define as the absolute value of the coefficients normalized by the sum of the absolute values. Since the variables are standardized by subtracting the mean and dividing by the standard deviation, the absolute values depict the total contribution to each Principal Component (PC). For the first component, each of the indices have similar contributions, though both CAPE-P and PR92W have slightly more of a contribution than LPI or LTI. For PC2, the LPI is most influential in the Morrison and WSM6 microphysics schemes, while the LTI is most influential in the Thompson microphysics scheme. The approximate weighting of PC1 between all 4 indices, with slight weighting towards CAPE-P and PR92W suggests that PC1 represents the presence of convection. For PC2, the LPI and LTI both rely heavily on microphysics, suggesting secondary importance on the microphysical state as compared to the presence and activation of convection. In short, PC1 is indicative of the presence, or at least the conditions conducive of, convection, while PC2 describes the sufficiency of the microphysics for generating lightning. This assessment of the similarity in performance, but with weighting toward the inclusion of microphysical processes, is consistent with the findings of Saleh et al. (2023).
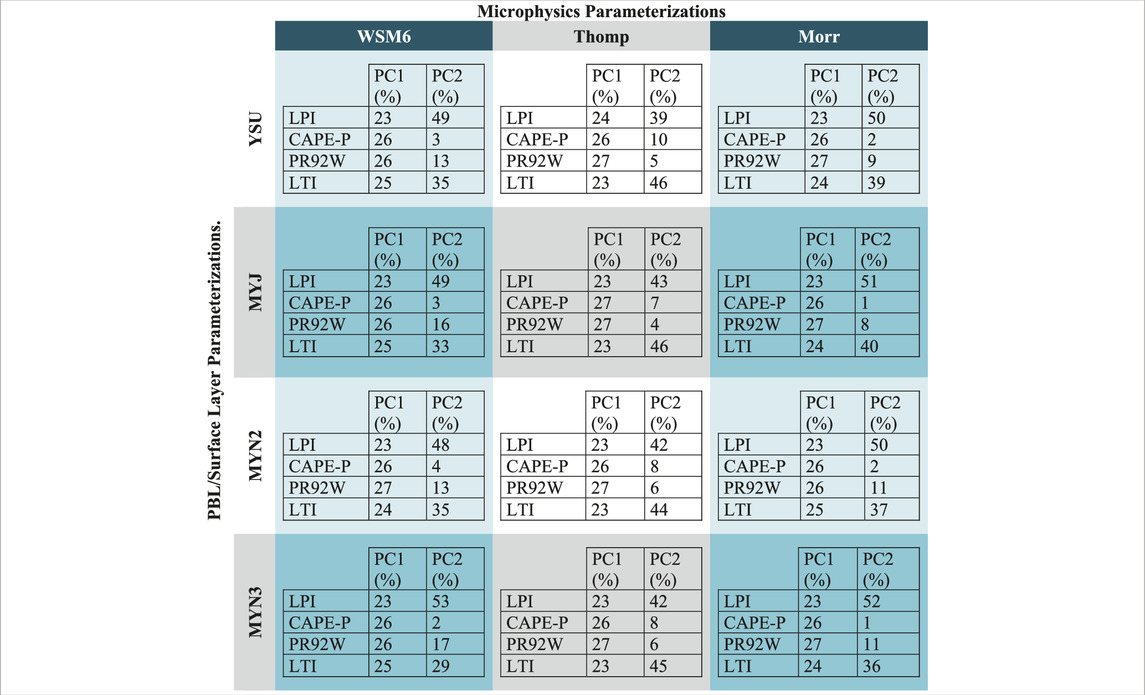
Table 4. Absolute values of the coefficients for the Principal Component Analysis divided by the sum of the coefficients for each standardized lightning index.
Taylor diagrams (Taylor, 2001) can map out the accuracy of the composite mean of ML members applied to each experiment, relative to the observed mean. On the radial axis is the normalized standard deviation (relative to observations), while the azimuth contains the correlation coefficient. The distance from a “Perfect” prediction is proportional to the root mean squared error. For a timeseries, the angle along the arc connecting the observed mean to the perfect prediction (which will be referred to as the critical arc) denotes phase error. The corollary for a spatiotemporal dataset is differences in timing or space. By contrast, the radial distance from the arc is indicative of an under- or over-amplified signal. As applied to our problem regarding lightning prognostication, the Taylor diagram is advantageous as it may assess the probabilities of lightning to the boolean observations, as compared to other diagrams that may require a threshold that could be considered arbitrary or subjective based on allowable risk. To summarize, Taylor diagrams are a useful way of comparing the variability (radial coordinate) and correlation (angular coordinate), relative to observations, for members of an ensemble.
Figure 4 shows a Taylor Diagram for the spatial maximum probability from the composite mean of the ML members, as applied to the unprocessed training dataset. The clustering of the experiments suggest consensus. All of the experiments show over predictions in the variability. The departure from the “Observed mean” indicates some informedness regarding the timing of the lightning. The departure from the critical arc (bolded) may be the result of errors in convection production (i.e., lightning indices are high before or after lightning was produced), the result of the processing applied to the training dataset prior to the fitting of the data, or the production of either cloud-to-ground or cloud-to-air lightning within the model. Although this performance is drastically improved when applied to the processed training dataset (not shown) applying this to the unprocessed dataset is more representative of the accuracy a forecaster at SRS gauging lightning potential may experience.
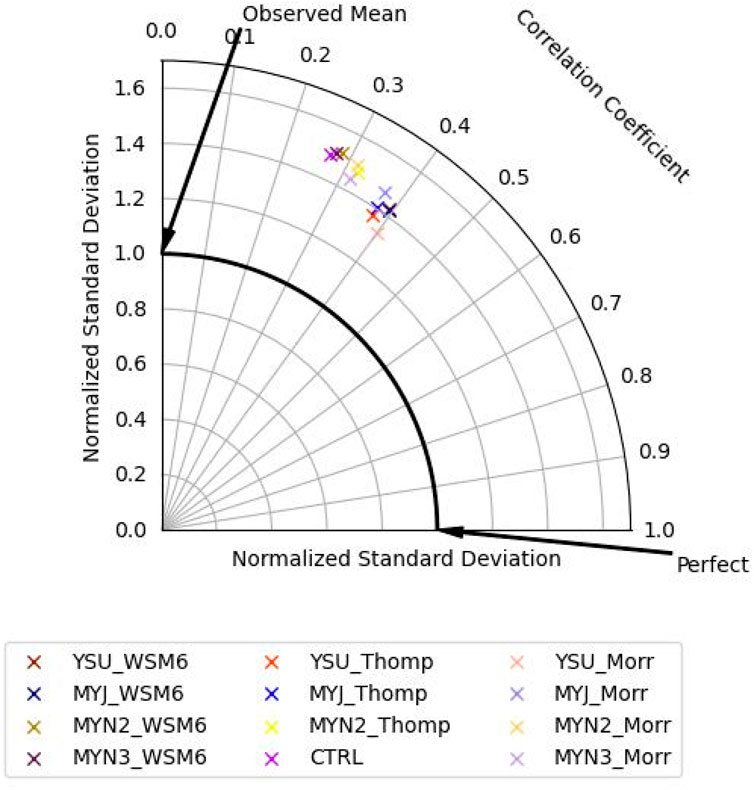
Figure 4. Taylor diagram of the composite machine learning model as applied to the training dataset.
Figure 5 applies the same concept of the Taylor diagram to the spatial maximum probability of the testing dataset. As expected, the composite mean probability of the ML members was not as accurate for the testing dataset as the training dataset. The composite mean probability of the ML members was far more variable for the testing dataset than the training dataset. This increase in variability may be the result of forecast periods where all of the lightning generated was not cloud-to-ground. This is reinforced by the ratio of cloud to ground lightning to total lightning, which can be inferred by Figure 2.
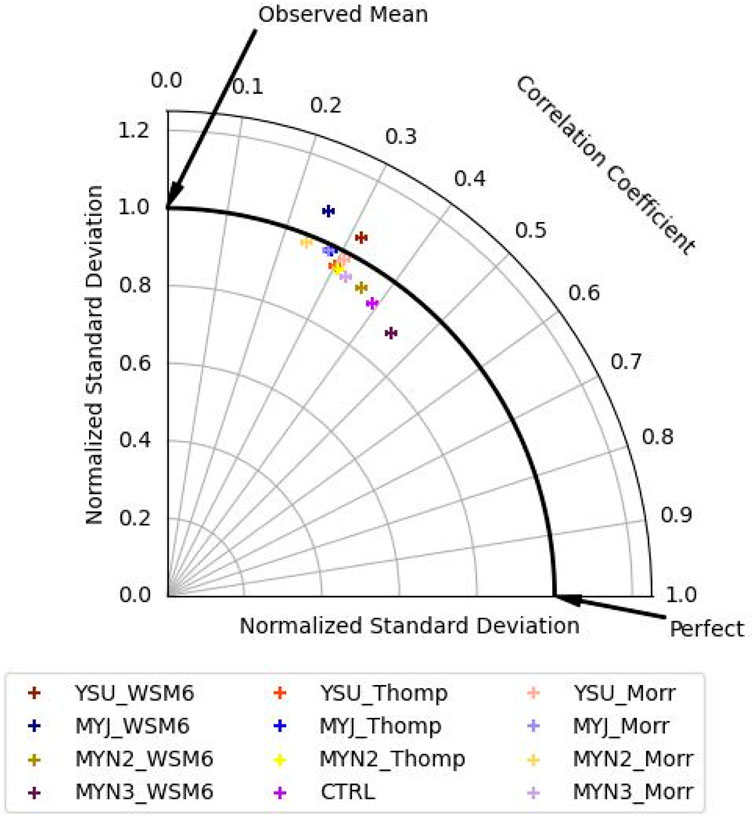
Figure 5. Taylor diagram of the machine-learning tool as applied to the testing dataset of each experiment.
In order to reduce the influence of spatial error, the maximum probability of lightning was compared to the presence of lightning in the domain. Figure 6 shows a timeseries of what a forecaster may expect out of each experimental configuration on 14 July 2022. All of the experiments were able to show high probability of lightning for the period with long periods of cloud-to-ground lightning, though with some timing issues. The MYN2 experiments with double moment microphysics (MYN2_Thomp, MYN2_Morr) were the only experiments that produced high probabilities for the lightning event near 15 July at 04 UTC, though those also had timing issues. The WSM6 experiments also seem to be overly conservative with lightning probabilities in the YSU, MYN2, and MYN3 experiments leading to more underestimates of lightning.
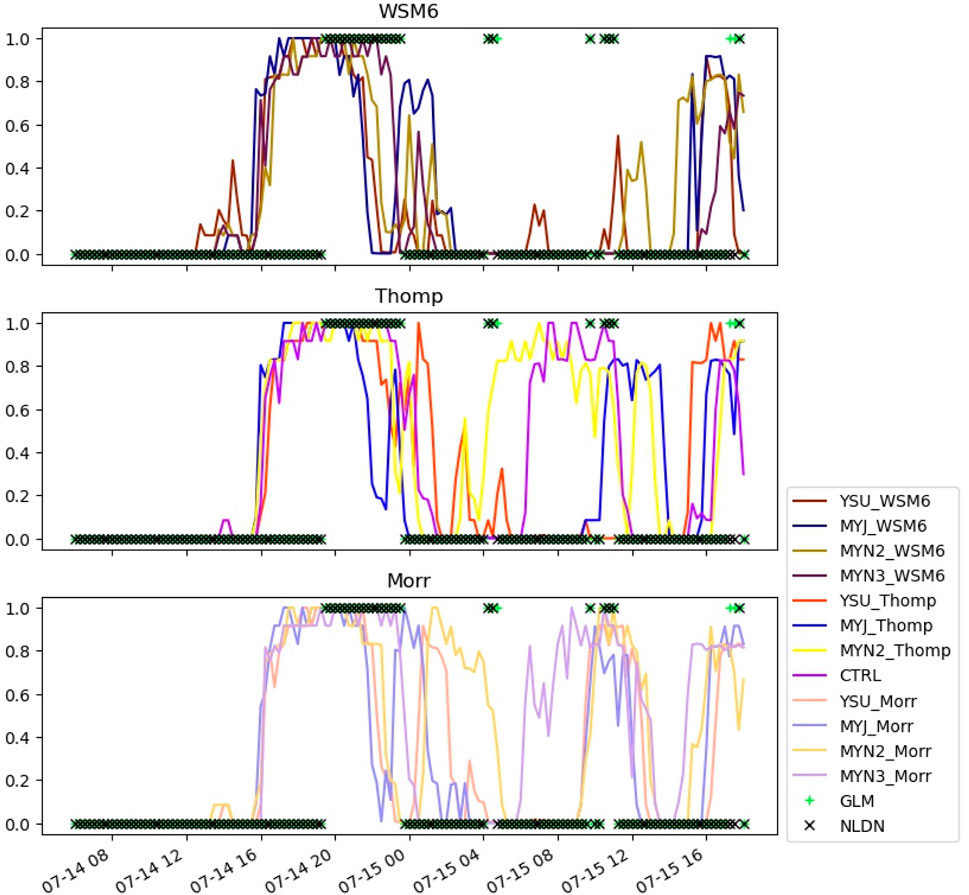
Figure 6. Maximum probability of lightning in the model domain for the simulations initialized 14 July 2022.
Figure 7 shows a forecast period, initialized 18 July 2022 06 UTC, where no cloud-to-ground lightning was observed, making all predictions of lightning false positives. Yet high probabilities of cloud-to-cloud or cloud-to-air lightning were observed by the GLM. This suggests that the composite mean of the ML members is incapable of discriminating cloud-to-ground lightning, which impacts workers on the ground, from lightning that may not impact workers. Figure 7 also shows how much erroneously predicted thunderstorms may impact forecast accuracy. All of the experiments indicate high probabilities of lightning over a long period for a brief duration of observed lightning. By 19 July at 04 UTC, all of the experiments indicate that the lightning event, which observations suggest was more succinct than the observations suggest, spurious convection then increased the probability at approximately 19 July at 08 UTC. Here, WSM6 experiments predicted higher (more erroneous) probabilities than the Morr or Thomp experiments. Towards the end of the forecast period, at near 16 UTC on 19 July, all the experiments except for MYN3 predict non-negligible probabilities of lightning, leading to false positives.
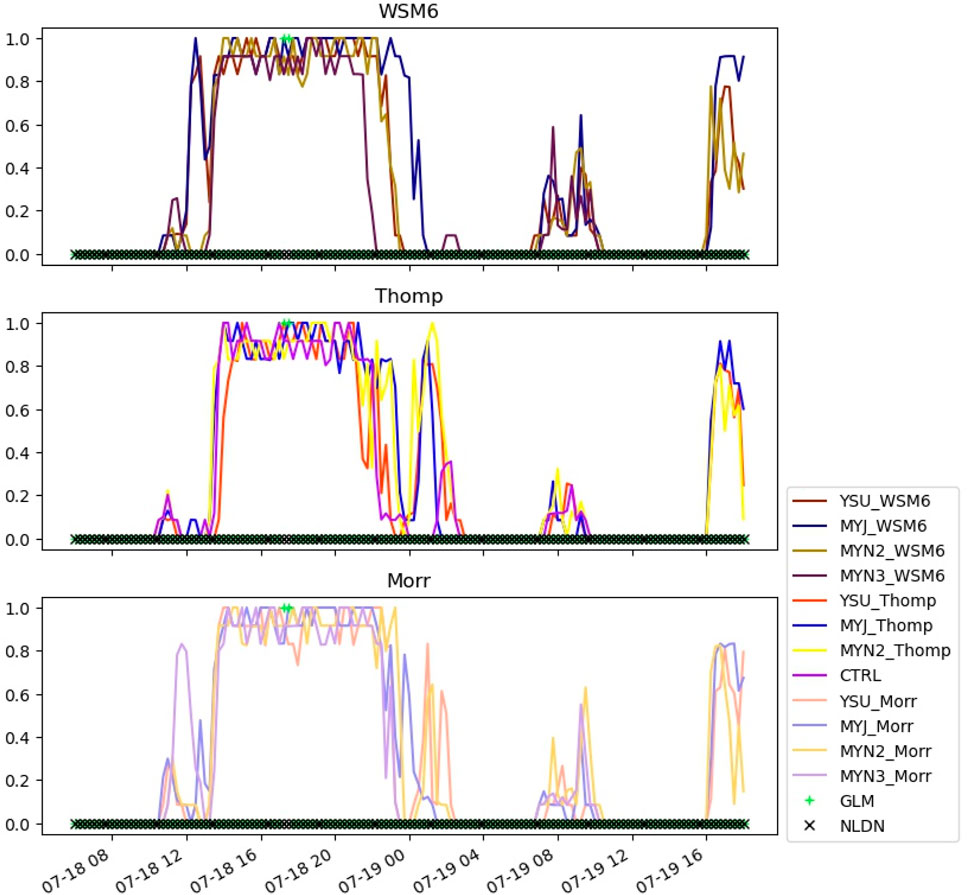
Figure 7. Similar to Figure 6, but for 18 July 2022.
If the probabilities are used to decide on lightning or no lightning, a confusion matrix may be computed. We applied a threshold of 50% to the composite mean probability of the ML members as applied to the testing dataset to make confusion diagrams for each experiment, as shown in Table 5. Although intuitive, true negatives are the most frequently observed occurrence with probabilities ranging from 63%–71%. WSM6, which is the only representative of the single moment microphysics schemes evaluated in our choice of parameterizations, has the lowest true positive rate, with MYN3_WSM6 having more false positives than true positives. The CTRL (represented as MYN3_Thomp) not only has more true negatives than any of the other experiments, CTRL has more true negatives than some experiments have total correct predictions (such as MYJ_Morr or MYN2_Thomp).
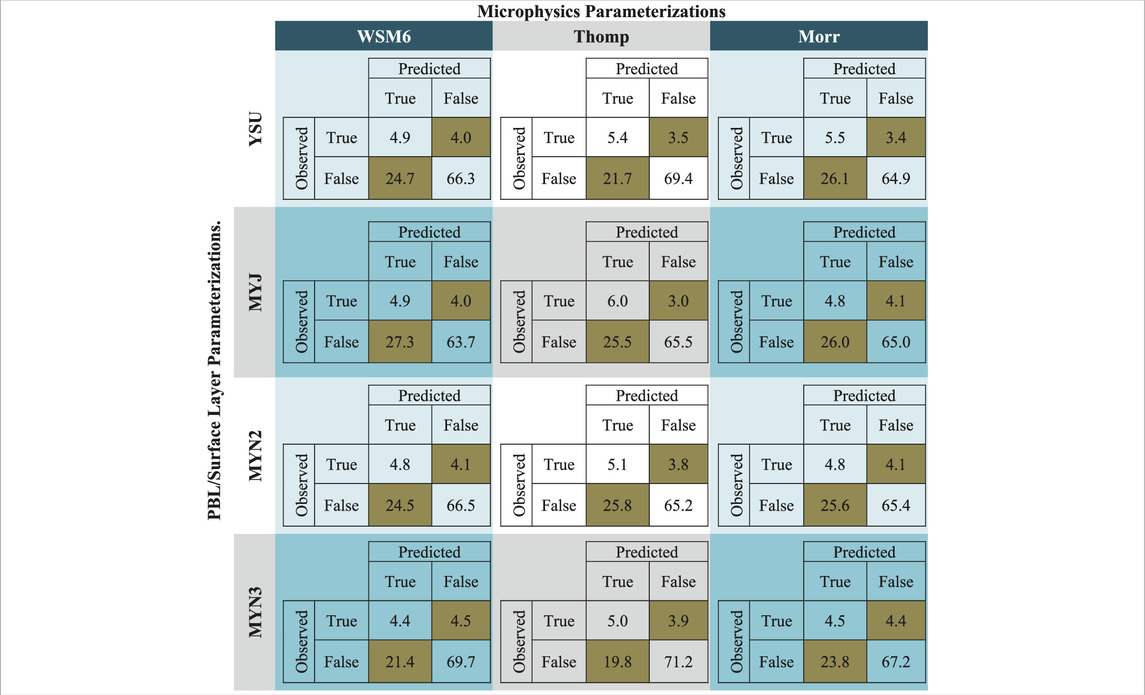
Table 5. The confusion matrix (percentages of true and false positives and negatives) using the maximum probability in D02 for each experiment in the testing dataset, as compared to binary lightning observations. Incorrect predictions (false positives and false negatives) are shaded in brown.
Identifying the relationship between lightning indices and lightning is not a trivial task. Research is available for guidance, but there is currently no known universal relationship for multiple lightning indices. Previous research has generated possible relationships between the two, but those relationships were formed using spatiotemporal sorting which presumes perfect matching of distributions and disregards the potential for model error. Those studies also focus on cases where vast quantities of lightning occur, which occur in scenarios where lightning fatalities may not be as representative of lightning events that are likely to cause injuries. In “garden variety” thunderstorms, lightning may still be present, despite weakly forced convection, resulting in lower lightning indices, and more risk to outdoor workers.
There are also several indices that may be used to aid in lightning prediction. And yet these indices are confounded with multicollinearity, suggesting that they diagnose a similar attribute, namely, convection. Within our training dataset, we identified a maximum variance inflation factor of 24 for one experiment. The use of Principal Component Analysis to form a regression relationship (called Principal Component Regression or PCR) was therefore applied to reduce not just the dimensionality, but also the multicollinearity of the indices. This PCR was used to train a classification mechanism to determine the probability of lightning for each model. With a probability of lightning attained, each model was evaluated according to the results of the probabilities generated during the testing dataset, which were simulations conducted during the latter half of the period of interest.
One reasoning behind the choice to examine the combination of microphysics and PBL schemes was to identify possible changes to CTRL to optimize the prediction of lightning. The results of this study suggest that no deviations regarding the microphysics or PBL scheme are necessary but reinforce the initial choice of model settings. Moreover, this study provides guidance regarding accuracy of this tool for lightning prediction. However, using methods to generate ensembles that may attempt to change the timing or distribution of convection, such as perturbing the initial and boundary conditions, may be more beneficial for training ML members than preprocessing or physics-based ensembles.
Despite of the ability of the composite mean of ML members to produce probabilistic estimates of lightning, false positives resulted from an overproduction of convection and/or the generation of lightning that was not cloud-to-ground. One way to improve upon this is to apply machine learning to spatial distributions of convection to try to discern between lightning trajectories. This would require a study over a longer period. The idea would be to describe the ratio of cloud-to-ground to total lightning through spatial distributions of convection.
Another avenue of research is to extend this analysis to timescales of a year or longer, which will have a variety of mesoscale drivers for lightning. Training a ML member on an extended period should provide a diverse set of environments, whereas this study focused on a consistent environment. Testing the composite ML tool formed from this study may be a suitable control compared to the machine learning tool formed from the proposed study. Besides the amount of data required to be stored, another downside may be choosing separate training and testing datasets that do not have a seasonal bias. This may be remedied by choosing systematic sampling, such as conducted in this study.
The The WRF model (available at https://github.com/wrf-model/WRF), combined with the NAM model (available at https://www.ncei.noaa.gov/data/north-american-mesoscale-model/access/analysis/) was used to generate the meteorological model data. The machine learning models were generated using the scikit-learn module (available at https://scikit-learn.org/stable/). The NLDN data is a commercial dataset, available at https://www.vaisala.com/en/products/national-lightning-detection-network-nldn. GLM data may be found at https://www.avl.class.noaa.gov/saa/products/search?sub_id=0&datatype_family=GRGLMPROD&submit.x=12&submit.y=8.
AT: Conceptualization, Data curation, Formal Analysis, Investigation, Methodology, Software, Validation, Visualization, Writing–original draft, Writing–review and editing. SN: Funding acquisition, Project administration, Resources, Supervision, Writing–review and editing.
The author(s) declare that financial support was received for the research, authorship, and/or publication of this article. This work was supported by the Laboratory Directed Research and Development (LDRD) program within the Savannah River National Laboratory (SRNL). This document was prepared in conjunction with work accomplished by Battelle Savannah River Alliance, LLC under Contract No. 89303321CEM000080 with the U.S. Department of Energy. Publisher acknowledges the U.S. Government license to provide public access under the DOE Public Access Plan (http://energy.gov/downloads/doe-public-access-plan).
The authors would like to thank Steve Weinbeck for the helpful discussions, as well as David Werth for proofreading and providing general guidance and Steven Chiswell for the initial configuration of WRF.
The authors declare that the research was conducted in the absence of any commercial or financial relationships that could be construed as a potential conflict of interest.
All claims expressed in this article are solely those of the authors and do not necessarily represent those of their affiliated organizations, or those of the publisher, the editors and the reviewers. Any product that may be evaluated in this article, or claim that may be made by its manufacturer, is not guaranteed or endorsed by the publisher.
The Supplementary Material for this article can be found online at: https://www.frontiersin.org/articles/10.3389/feart.2024.1376605/full#supplementary-material
Ashley, W. S., and Gilson, C. W. (2009). A reassessment of U.S. Lightning mortality. Bull. Am. Meteorological Soc. 90, 1501–1518. doi:10.1175/2009bams2765.1
Brisson, E., Blahak, U., Lucas-Picher, P., Purr, C., and Ahrens, B. (2021). Contrasting lightning projection using the lightning potential index adapted in a convection-permitting regional climate model. Clim. Dyn. 57, 2037–2051. doi:10.1007/s00382-021-05791-z
Dominguez, F., Kumar, P., Liang, X.-Z., and Ting, M. (2006). Impact of atmospheric moisture storage on precipitation recycling. J. Clim. 19, 1513–1530. doi:10.1175/jcli3691.1
Findell, K. L., and Eltahir, E. a.B. (2003). Atmospheric controls on soil moisture–boundary layer interactions. Part II: feedbacks within the continental United States. J. Hydrometeorol. 4, 570–583. doi:10.1175/1525-7541(2003)004<0570:acosml>2.0.co;2
Finney, D. L., Doherty, R. M., Wild, O., Huntrieser, H., Pumphrey, H. C., and Blyth, A. M. (2014). Using cloud ice flux to parametrise large-scale lightning. Atmos. Chem. Phys. 14, 12665–12682. doi:10.5194/acp-14-12665-2014
Forney, R. K., Debbage, N., Miller, P., and Uzquiano, J. (2022). Urban effects on weakly forced thunderstorms observed in the Southeast United States. Urban Clim. 43, 101161. doi:10.1016/j.uclim.2022.101161
Gharaylou, M., Farahani, M. M., Hosseini, M., and Mahmoudian, A. (2019). Numerical study of performance of two lightning prediction methods based on: lightning Potential Index (LPI) and electric POTential difference (POT) over Tehran area. J. Atmos. Solar-Terrestrial Phys. 193, 105067. doi:10.1016/j.jastp.2019.105067
Gharaylou, M., Farahani, M. M., Mahmoudian, A., and Hosseini, M. (2020). Prediction of lightning activity using WRF-ELEC model: impact of initial and boundary conditions. J. Atmos. Solar-Terrestrial Phys. 210, 105438. doi:10.1016/j.jastp.2020.105438
Holle, R. L. (2016). A summary of recent national-scale lightning fatality studies. Weather, Clim. Soc. 8, 35–42. doi:10.1175/wcas-d-15-0032.1
Hong, S.-Y., and Lim, J.-O. J. (2006). The WRF single-moment 6-class microphysics scheme (WSM6). J. Korean Meteorological Soc. 42, 129–151.
Hong, S.-Y., Noh, Y., and Dudhia, J. (2006). A new vertical diffusion package with an explicit treatment of entrainment processes. Mon. Weather Rev. 134, 2318–2341. doi:10.1175/mwr3199.1
Iacono, M. J., Delamere, J. S., Mlawer, E. J., Shephard, M. W., Clough, S. A., and Collins, W. D. (2008). Radiative forcing by long-lived greenhouse gases: calculations with the AER radiative transfer models. J. Geophys. Res. 113 113. doi:10.1029/2008jd009944
Janjić, Z. I. (1994). The step-mountain eta coordinate model: further developments of the convection, viscous sublayer, and turbulence closure schemes. Mon. Weather Rev. 122, 927–945. doi:10.1175/1520-0493(1994)122<0927:tsmecm>2.0.co;2
Kosiba, K. W. J., Trapp, J., Nesbitt, S., and Parker, M. (2023). “Overview of the PERiLS (propagation, evolution and rotation in linear storms) Project,” in 11th European conference on severe storms. 8–12 May 2023, (Bucharest, Romania: European Meteorological Society). doi:10.5194/ecss2023-112
Kuang, C., Serbin, S. G. S., Elsaesser, G., Gentine, P., Heus, T., Oue, M., et al. (2023). Science plan for the deployment of the third ARM mobile facility to the southeastern United States at the bankhead national forest, Alabama (AMF3 BNF). Richland, Washington.
Lynn, B., and Yair, Y. (2010). Prediction of lightning flash density with the WRF model. Adv. Geosciences 23, 11–16. doi:10.5194/adgeo-23-11-2010
Lynn, B. H., Yair, Y., Price, C., Kelman, G., and Clark, A. J. (2012). Predicting cloud-to-ground and intracloud lightning in weather forecast models. Weather Forecast. 27, 1470–1488. doi:10.1175/waf-d-11-00144.1
Malečić, B., Telišman Prtenjak, M., Horvath, K., Jelić, D., Mikuš Jurković, P., Ćorko, K., et al. (2022). Performance of HAILCAST and the Lightning Potential Index in simulating hailstorms in Croatia in a mesoscale model – sensitivity to the PBL and microphysics parameterization schemes. Atmos. Res. 272, 106143. doi:10.1016/j.atmosres.2022.106143
Mccaul, E. W., Goodman, S. J., Lacasse, K. M., and Cecil, D. J. (2009). Forecasting lightning threat using cloud-resolving model simulations. Weather Forecast. 24, 709–729. doi:10.1175/2008waf2222152.1
Mesinger, F. (1993). Forecasting upper tropospheric turbulence within the framework of the Mellor-Yamada 2.5 closure. Res. Act. Atmos. Ocean. Mod.
Miller, P., and Debbage, N. (2023). Weakly forced thunderstorms in the southeast US are stronger near urban areas. Geophys. Res. Lett. 50. doi:10.1029/2023gl105081
Miller, P. W., and Mote, T. L. (2017). A climatology of weakly forced and pulse thunderstorms in the southeast United States. J. Appl. Meteorology Climatol. 56, 3017–3033. doi:10.1175/BAMS-D-16-0064.1
Miller, P. W. M., and Thomas, L. (2017). Standardizing the definition of a “pulse” thunderstorm. Bull. Am. Meteorological Soc. 98, 905–913.
Morrison, H., Thompson, G., and Tatarskii, V. (2009). Impact of cloud microphysics on the development of trailing stratiform precipitation in a simulated squall line: comparison of one- and two-moment schemes. Mon. Weather Rev. 137, 991–1007. doi:10.1175/2008mwr2556.1
Mortelmans, J., Bechtold, M., Brisson, E., Lynn, B., Kumar, S., and De Lannoy, G. (2022). Lightning over Central Canada: skill assessment for various land-atmosphere model configurations and lightning indices over a boreal study area. J. Geophys. Res. Atmos. 128. doi:10.1029/2022JD037236
Murphy, M. J., Cramer, J. A., and Said, R. K. (2021). Recent history of upgrades to the U.S. National lightning detection network. J. Atmos. Ocean. Technol. 38, 573–585. doi:10.1175/jtech-d-19-0215.1
Nakanishi, M., and Niino, H. (2006). An improved mellor–yamada level-3 model: its numerical stability and application to a regional prediction of advection fog. Boundary-Layer Meteorol. 119, 397–407. doi:10.1007/s10546-005-9030-8
Nakanishi, M., and Niino, H. (2009). Development of an improved turbulence closure model for the atmospheric boundary layer. J. Meteorological Soc. Jpn. Ser. II 87, 895–912. doi:10.2151/jmsj.87.895
Olson, J. B., Kenyon, J. S., Angevine, W., Brown, J. M., Pagowski, M., and Sušelj, K. (2019). A description of the MYNN-EDMF scheme and the coupling to other components in WRF–ARW. doi:10.25923/n9wm-be49
Pedregosa, F., Varoquaux, G., Gramfort, A., Michel, V., Thirion, B., Grisel, O., et al. (2011). Scikit-learn: machine learning in Python. J. Mach. Learn. Res. 12, 2825–2830. doi:10.48550/arXiv.1201.0490
Price, C., and Rind, D. (1992). A simple lightning parameterization for calculating global lightning distributions. J. Geophys. Res. Atmos. 97, 9919–9933. doi:10.1029/92jd00719
Price, C., and Rind, D. (1994). The impact of a 2 × CO2Climate on lightning-caused fires. J. Clim. 7, 1484–1494. doi:10.1175/1520-0442(1994)007<1484:tioacc>2.0.co;2
Romps, D. M. (2019). Evaluating the future of lightning in cloud-resolving models. Geophys. Res. Lett. 46, 14863–14871. doi:10.1029/2019gl085748
Romps, D. M., Charn, A. B., Holzworth, R. H., Lawrence, W. E., Molinari, J., and Vollaro, D. (2018). CAPE times P explains lightning over land but not the land-ocean contrast. Geophys. Res. Lett. 45, 12,623–612,630. doi:10.1029/2018gl080267
Romps, D. M., Seeley, J. T., Vollaro, D., and Molinari, J. (2014). Projected increase in lightning strikes in the United States due to global warming. Science 346, 851–854. doi:10.1126/science.1259100
Saleh, N., Gharaylou, M., Farahani, M. M., and Alizadeh, O. (2023). Performance of lightning potential index, lightning threat index, and the product of CAPE and precipitation in the WRF model. Earth Space Sci. 10. doi:10.1029/2023ea003104
Skamarock, W. C., Klemp, J. B., Dudhia, J., Gill, D. O., Liu, Z., Berner, J., et al. (2019). A description of the advanced research WRF model version 4. Natl. Cent. Atmos. Res. Boulder, CO, U. S. A. 145, 145. doi:10.5065/1DFH-6P97
Taylor, K. (2001). Summarizing multiple aspects of model performance in a single diagram. Journal of Geophysical Research: Atmospheres 106 (D7), 7183–7192. doi:10.1029/2000JD900719
Tewari, M., Chen, F., Wang, W., Dudhia, J., Lemone, M., Mitchell, K., et al. (2004). “Implementation and verification of the unified NOAH land surface model in the WRF model,” in 20th conference on weather analysis and forecasting/16th conference on numerical weather prediction, 2165–2170.
Thompson, G., Field, P. R., Rasmussen, R. M., and Hall, W. D. (2008). Explicit forecasts of winter precipitation using an improved bulk microphysics scheme. Part II: implementation of a new snow parameterization. Mon. Weather Rev. 136, 5095–5115. doi:10.1175/2008mwr2387.1
Wong, J., Barth, M. C., and Noone, D. (2013). Evaluating a lightning parameterization based on cloud-top height for mesoscale numerical model simulations. Geosci. Model Dev. 6, 429–443. doi:10.5194/gmd-6-429-2013
Keywords: lightning, machine-learning, numerical-weather-prediction, microphysics, planetary-boundary-layer
Citation: Thomas AM and Noble S (2024) A physics-based ensemble machine-learning approach to identifying a relationship between lightning indices and binary lightning hazard. Front. Earth Sci. 12:1376605. doi: 10.3389/feart.2024.1376605
Received: 25 January 2024; Accepted: 05 September 2024;
Published: 27 September 2024.
Edited by:
Amit Kumar Mishra, Jawaharlal Nehru University, IndiaReviewed by:
Shani Tiwari, Council of Scientific and Industrial Research (CSIR), IndiaCopyright © 2024 Thomas and Noble. This is an open-access article distributed under the terms of the Creative Commons Attribution License (CC BY). The use, distribution or reproduction in other forums is permitted, provided the original author(s) and the copyright owner(s) are credited and that the original publication in this journal is cited, in accordance with accepted academic practice. No use, distribution or reproduction is permitted which does not comply with these terms.
*Correspondence: Andrew M. Thomas, QW5kcmV3LnRob21hc0Bzcm5sLmRvZS5nb3Y=
Disclaimer: All claims expressed in this article are solely those of the authors and do not necessarily represent those of their affiliated organizations, or those of the publisher, the editors and the reviewers. Any product that may be evaluated in this article or claim that may be made by its manufacturer is not guaranteed or endorsed by the publisher.
Research integrity at Frontiers

Learn more about the work of our research integrity team to safeguard the quality of each article we publish.