 Chao Wang1,2
 Kai Zhan
 Rui Xu
94% of researchers rate our articles as excellent or good
Learn more about the work of our research integrity team to safeguard the quality of each article we publish.
Find out more
ORIGINAL RESEARCH article
Front. Earth Sci., 05 June 2024
Sec. Solid Earth Geophysics
Volume 12 - 2024 | https://doi.org/10.3389/feart.2024.1372459
As seismology has evolved, scientists have developed various earthquake magnitude scales tailored for specific scenarios, including Richter magnitude (ML) for local, moderate quakes, moment magnitude (Mw) for large-scale seismic events, energy magnitude (Me), which correlates directly with the total energy released, and duration magnitude (MD) for quickly assessing shallow or nearby seismic activities. Despite these advances, these scales were not specifically designed to address the unique challenges posed by mine earthquakes, particularly in coal mine environments where seismic events are typically of lower energy and lower perceptibility but have potentially significant impacts. This study applies the K-class magnitude system for the first time to address significant discrepancies in magnitude values for the same seismic events in mine earthquakes, particularly in coal mines when different formulas are used. However, because current seismic monitoring systems in domestic coal mines continue to employ a variety of magnitude scales, we have developed a corrected Richter scale (MLc) specifically tailored to the geological conditions of coal mines. This adaptation facilitates the conversion to and from the K class, enhancing the accuracy and relevance of seismic assessments in these environments. Therefore, we conducted continuous blasting experiments at the Dongtan Coal Mine and derived the corrected Richter magnitude MLc. Based on data analysis, we fitted the energy attenuation coefficient and compared the K values with four types of traditional magnitude results. Finally, we derived the conversion relationship between the K class and the corrected Richter magnitude MLc, establishing a mine earthquake measurement system. The successful application of the K class in coal mines suggests its potential to be extended to the entire field of induced microseismicity, including mining-induced microseismicity, shale gas extraction-induced microseismicity, and oil extraction-induced microseismicity, providing valuable insights and tools for a broader range of geophysical research and industry practices.
• Applied the K-class system for mine seismic events, resulting in a better fit for mining conditions.
• Conducted eight roof blasting experiments and fitted the energy attenuation coefficient.
• Adapted corrected Richter scale for seismic events within a 5-km epicentral distance.
• Derived the conversion relationship between K class and MLc.
The traditional seismic magnitude is a critical parameter for quantifying the size of an earthquake. With the development of seismology, various equations for calculating seismic magnitudes tailored to different application scenarios have been introduced (Feng 2020). The earliest magnitude scale was developed by Richter (1935). It defined the local magnitude (ML) as being associated with the amplitude of seismic waves and the distance from the epicenter. Due to the variability in regional media elastic parameters, different scholars have proposed various empirical equations for ML. A decade later, Gutenberg (1945) formally introduced the surface wave magnitude (Ms) and the body wave magnitude (Mb), thereby extending the Richter magnitude scale to teleseisms and deep earthquakes. All these three magnitudes are empirical relationships directly related to the amplitudes of seismic waves of different frequencies and types, which are subject to the phenomenon of “magnitude saturation” (Liu et al., 2015). Saturation occurs at approximately 6.5 for ML, 6 for Mb, and 8.4 for Ms (Lay and Wallace, 1995). Kanamori (1977) and Kanamori (1983) proposed defining the moment magnitude (Mw) based on the seismic moment (M0). It never saturates and carries profound physical significance. To reflect the dynamic characteristics of the seismic wave radiation process, which are distinct from those expressed by the moment magnitude, Boatwright and Choy (1986) introduced the energy magnitude (Me). In terms of development, energy magnitude may ultimately supersede moment magnitude. The concept of duration magnitude (MD) was first suggested by Bisztricsany (1958), using only the waveform duration to represent the size of an earthquake. The correlation between duration and event strength is significantly lower than that between waveform amplitude and event strength, which is one of the primary reasons duration magnitude has not been widely adopted. Lee et al. (1972) formally included MD in the calculation methods for magnitude estimation. China’s latest seismic magnitude national standard GB 17740-2017 (General Administration of Quality Supervision et al., 2017) conforms with previous definitions in terms of ML, Ms, and Mb, which are related to amplitude and epicentral distance, expressed as the sum of the logarithm of amplitude and a calibration function, with a minimum epicentral distance for the calibration function set at 5 km, and is applicable across a wide range. New additions to the standard include broadband versions of Ms(BB), MB(BB), and Mw, ensuring continuity in the determination of magnitudes and consistency with international agencies.
Mine microseismic events differ from natural earthquakes in several key aspects. The hypocenters of mine microseisms are shallow, and for a given magnitude, the rupture scale is considerably smaller than that of natural earthquakes. The magnitude of a mine microseism does not directly correlate with the extent of damage to the rock mass within the mine. Furthermore, the influence of a mine microseism’s magnitude is limited, with waveforms attenuating rapidly. Mine microseisms span a wide energy range, from 10 J to 109 J (Gu 2022). In mines, the most common method of quantifying the sizes of tremors is through energy calculation (Wang 1994); the primary difference between the K class and M is that the K class is technically calibrated to energy.
The domestic mining industry urgently requires a suitable measurement system for mine seismic monitoring within the sector, one that is both simple to understand and capable of “applying a positive shift to traditional magnitudes” by eliminating negative magnitudes, which are difficult for coal mine workers to comprehend. Under these circumstances, the introduction of the K-class system (Rautian, 1958; 1960; Rautian et al., 2007; Bormann et al., 2012) is highly rational. Utilizing the Russian term “класс,” the scale was defined as K = log ES (Rautian, 1958; Rautian, 1960; Rautian et al., 2007), where ES is measured in Joules. The relationship between energy and K class is established as Es = 10N J, with N representing the K class number. The initial framework for this scale was introduced in Rautian (1958) and later refined in Rautian (1960). Despite its challenges, the scale was straightforward to implement, given the resources and staff available at that time. By 1961, the K-class system was universally adopted for measuring earthquake magnitudes across the former Soviet Union and is still in use today. Beyond the borders of the USSR, the K-class methodology found significant application only in Mongolia and Cuba.
This article focuses on calculating the seismic wave radiated energy Es in mine seismic events. We will proceed to calculate Es differently based on the classification of mine seismic events and discuss the relationship between K class and magnitude, as well as the prospects for the development of K-class in mine seismic monitoring.
In an ideal scenario where energy uniformly disperses in every direction, the equation ES = 4πr2kε (Rautian et al., 2007) applies. This equation illustrates a shift from focusing on ε, which denotes the total energy density crossing through a circular wavefront with radius r per unit area, to depending on the peak amplitude observed at seismic stations. Such a shift is notably relevant for practical uses but introduces theoretical complexities. Here, k is a factor that compensates for various influences, including the topography of the Earth’s surface and the proportion of the measured component relative to the entire displacement vector.
To estimate ε, it is necessary to measure the amplitude, frequency, and duration of the signal. However, performing a visual spectral analysis on a seismogram is impractical. Rautian (1960) significantly simplified this process by determining the energy density with the sum of (Af)2 over the duration τ, where f is the measured frequency of a given cycle with displacement amplitude A. A correction, K, is the instrument’s amplification coefficient, and only a single recorded component is used instead of the complete vector. The relationship between kε and r is used to normalize the estimate of ε to r = 10 km. Thus, logEs (10 km) = log4πkε. Moreover, the amplitude data, encompassing both [AP(r) + AS(r)], were standardized to a distance of r = 10 km by applying an equation that correlates amplitude with distance. Taking the measurement results from the short-period VEGIK instruments used in the Garm area as an example (Rautian et al., 2007), the following empirical equation was derived:
In the realm of basic physics, Eq. 1 appears somewhat unusual. This is because, in the case of wave propagation through a homogeneous medium, one would typically expect the logarithm of energy (logES) to roughly equal the sum of the logarithm of amplitude squared and the logarithm of duration, plus a constant. In other words, intuitively and according to fundamental physical principles, the energy of a wave is directly proportional to the square of its amplitude and also depends on the duration of the wave. This equation suggests a relationship that deviates from expectations, making it look a bit strange.
The updated equation by Rautian et al. (2007) clearly does not apply to the calculation of seismic energy in mining areas. Therefore, we offer a new approach to calculating energy based on the classification of mine seismic events.
When we consider general microseismic situations, the energy at the source is equal to the average of the total seismic wave radiation energy at each station with energy attenuation compensation (Li et al. 2011). According to the theory of natural earthquakes, seismic wave motion can be decomposed into several simple harmonic motions. The energy of a simple harmonic motion wave is directly proportional to the square of its amplitude. Therefore, the energy of a seismic wave can be represented by the sum of the squares of the amplitudes of the sampling points during the duration of the seismic wave.
In coal mines, due to the relatively gentle seismic waves caused by the fracturing of coal and rock layers and the significant difference between the seismic wave propagation medium and rock, considering only the maximum amplitude is insufficient to accurately reflect the intensity characteristics of the event. It is also necessary to consider the duration of the energy release from the seismic source (Lee et al., 1972). Therefore, for microseismic monitoring using three-component detectors, the equation for expressing its energy is (Wang et al., 2020):
where Ee is the energy of the seismic waves at the measuring point location, in Joules; t0 is the starting sampling point (first arrival of P wave); T is the total number of sampling points (due to the high-frequency band of mining seismic events and their relatively short duration, in order to fully capture the entire event’s waveform (including body waves and tail waves, etc.), the waveform window is fixed at 5 s, which, when multiplied by the sampling rate, yields the total number of sampling points); A(t) is the average amplitude of the seismic wave recorded by the station at the t sampling point in millivolts; and m is the magnification of the instrument for the electrical signal. The source energy of microseismic events attenuates and dissipates in the mine rock mass medium. Therefore, the microseismic wave energy calculated from Eq. 2 is the energy at the monitoring point and the source energy after attenuation and dissipation. According to the article by Gao et al. (2007), the attenuation equation of microseismic wave energy is
where Es is the energy at the microseismic source, Ee is the energy attenuated at each station,
We carried out eight blasting tests on the 63upper06 roof of the track roadway and transport roadway in the Dongtan Coal Mine and found the most suitable earthquake magnitude calculation equation for the Dongtan Coal mine. We then apply the K class system in the Dongtan Coal Mine and discuss the relationship between K class and earthquake magnitude.
To investigate the true energy size of the seismic source point, artificial seismic sources are stimulated using verification shots in the mine site to study the attenuation and dissipation patterns of microseismic wave energy and to derive an empirical equation for the attenuation of microseismic source energy.
To ensure the safety of the 63upper06 working face, eight blasting operations were conducted to alleviate pressure on the track and transportation roof. Details of these blasting events, including the chemical energy of the explosives (4100 kJ/kg), the conversion rate of explosive energy in a single sealed hole to seismic wave energy (approximately 0.025%), and the amplification gain setting of the station (12 dB, equivalent to an amplification factor of 4), are presented in Table 1.
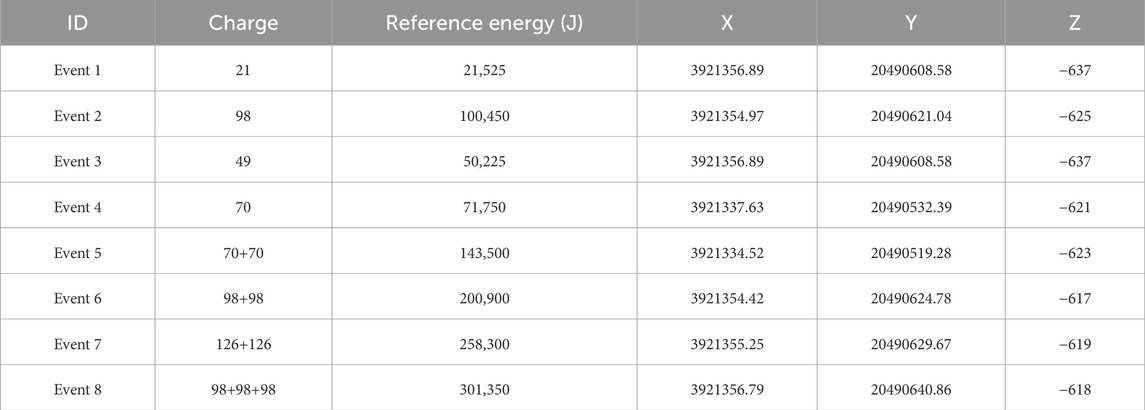
Table 1. Eight blast events.
We have precise information on the epicenter locations and the amounts of explosives used for these eight blasting events. We will calculate the common seismic magnitudes (Richter magnitude, moment magnitude, energy magnitude, and duration magnitude) with the equations for these calculations provided in Supplementary Material S1, “Calculate the commonly used earthquake magnitude.” The data are preprocessed before these calculations. Due to the differences in waveform amplitude units and frequency bands used in magnitude calculation and energy calculation, the amplitude for magnitude calculation is displacement, while the amplitude for energy calculation is voltage. Magnitude calculation requires high-pass filtering, whereas energy calculation requires information across the full frequency band without filtering. Therefore, prior to commencing the calculations, we preprocess the data by initially detrending and eliminating the mean. Subsequently, we execute energy computation, remove the instrument response to convert amplitude into displacement for magnitude estimation, and conclude with high-pass filtering utilizing a cutoff frequency of 6 Hz (The selection of a cutoff frequency of 6 Hz is based on our extensive data analysis and empirical findings). The K-class system will be applied to evaluate these eight blasting events.
After clarifying the basic conditions of the working face, the coal seam, and the roof and floor, we determined the critical stratum for blasting based on the depressurization effect of blasting. Within a 52 m range above the coal seam, there are medium sandstone and sandstone, which are the critical layers for roof blasting. To meet the roof blasting effects, the design includes a 63upper06 track roadway and transport roadway cutoff borehole with a vertical depth of about 50 m, fulfilling the requirement that “the borehole depth must penetrate at least 2/3 of the thickness of the lower critical rock layer (National Coal Mine Safety Administration, 2018).
Boreholes for roof blasting were constructed along the 63upper06 track roadway and transport roadway route, and roof blasting was carried out with no more than three holes blasted at a time. The construction parameters and site drawings are depicted in Figures 1–3.
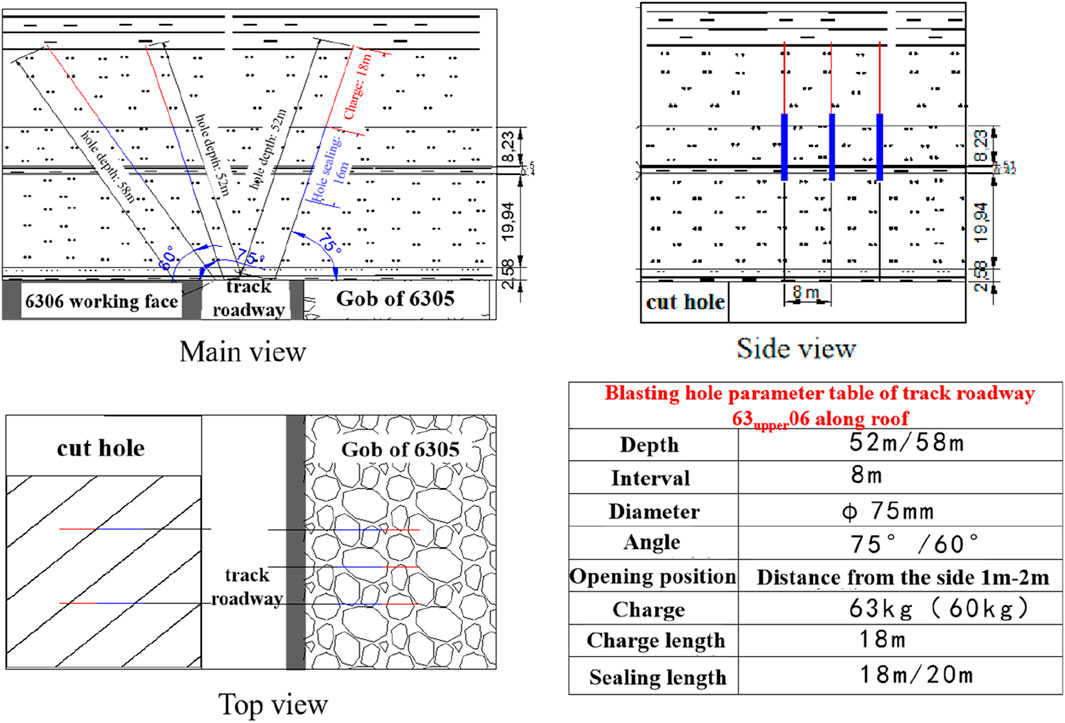
Figure 1. Schematic diagram of the track roadway blasting roof caving profile on working face 63upper06.
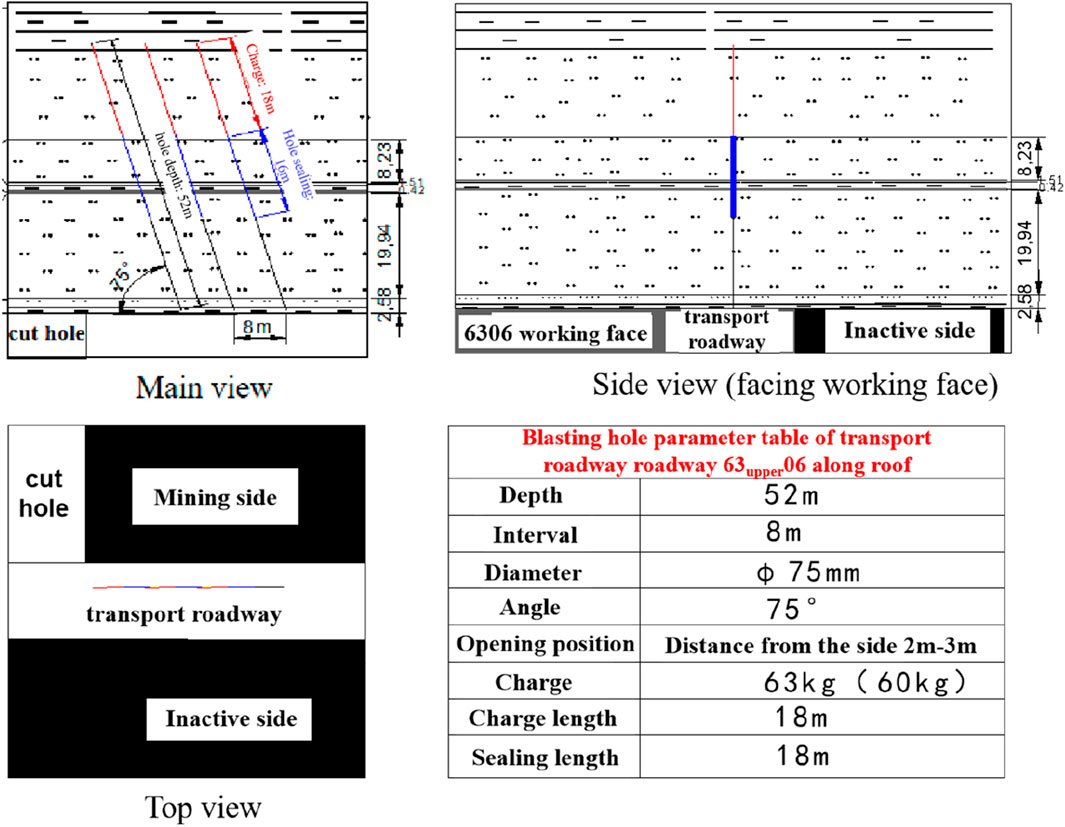
Figure 2. Schematic diagram of the transport roadway blasting roof caving profile on working face 63upper06.

Figure 3. Part of the location of the broken top blasting field diagram.
We utilize the self-developed mine seismic monitoring system, which is equipped with a total of seven three-component stations with a 500 Hz sampling rate. After roof blasting, the Dongtan Coal Mine seismic monitoring system is used to calculate the different magnitudes of blasting event monitoring data. The distribution of stations is shown in Figure 4, and the station coordinates are shown in Table 2.
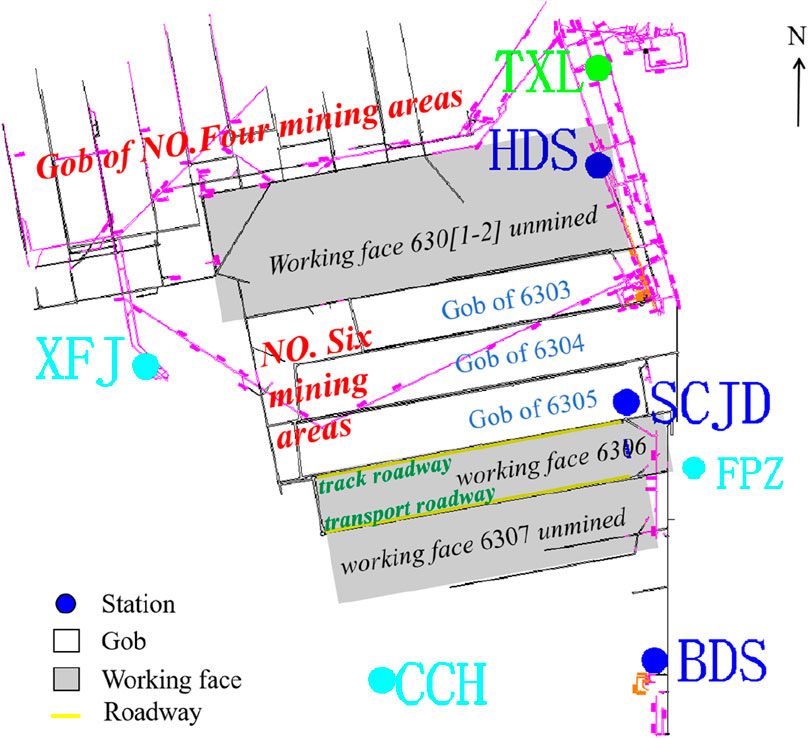
Figure 4. Monitoring system station distribution. The colored dots represent the stations, the white area represents the goaf, the gray area represents the working/unworking face, and the yellow lines represent the track and transport chutes, using the 6306 face as an example. Deep blue dots represent stations below the working face, light blue dots represent stations above the working face, and green stations indicate poor waveform quality.
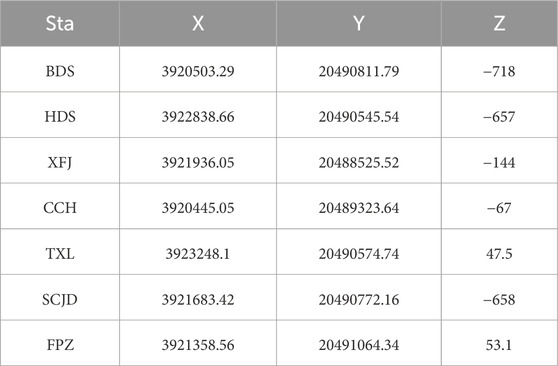
Table 2. Station coordinates.
The first four events are single borehole blasts, making the theoretical energy values easy to calculate. The last four events involve simultaneous blasting in multiple boreholes, which complicates the energy variation (including superposition and cancellation, etc.), so we only use the first four blasting events for energy attenuation fitting.
As shown in Figure 5, energy attenuation fitting is performed using the energy records of all stations from four single-hole blasting events. The expression for energy attenuation is
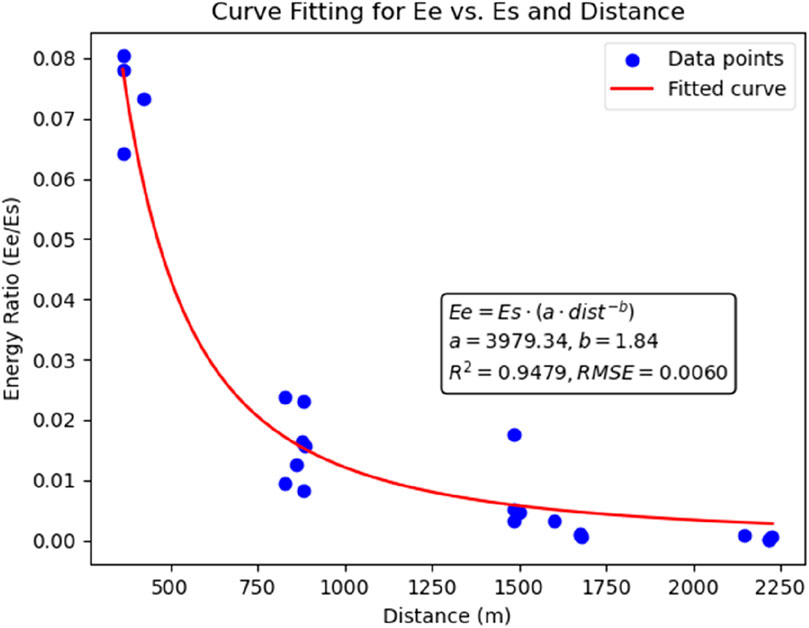
Figure 5. Energy attenuation equation fitting. The blue points represent the fitted event points, and the red represents the fitted energy attenuation curve, with R2 = 0.9479 and RMSE = 0.006.
In the equation,
First, we calculate the energy at each station using Eq. 2, and then we use Eq. 5 to calculate the energy at the source point. The average of the source point energies calculated by each station represents our undecayed source point energy. To ensure the reasonableness of the average, we discard one maximum and one minimum value before calculating the average. Due to space constraints, only the energy calculations for Event 5 are shown in Table 3. At the time of this event, obvious microseismic waveforms were detected by seven stations, including BDS and HDS, as shown in Figure 6. The waveforms of the microseismic waves varied as they reached different stations, resulting in varying degrees of attenuation.
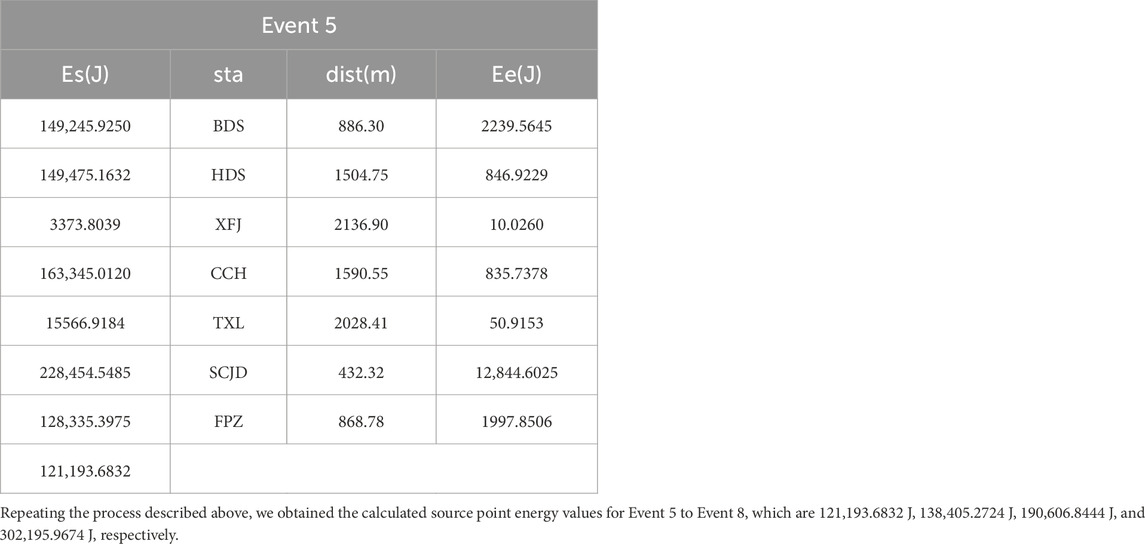
Table 3. Example of porous blasting energy calculation.
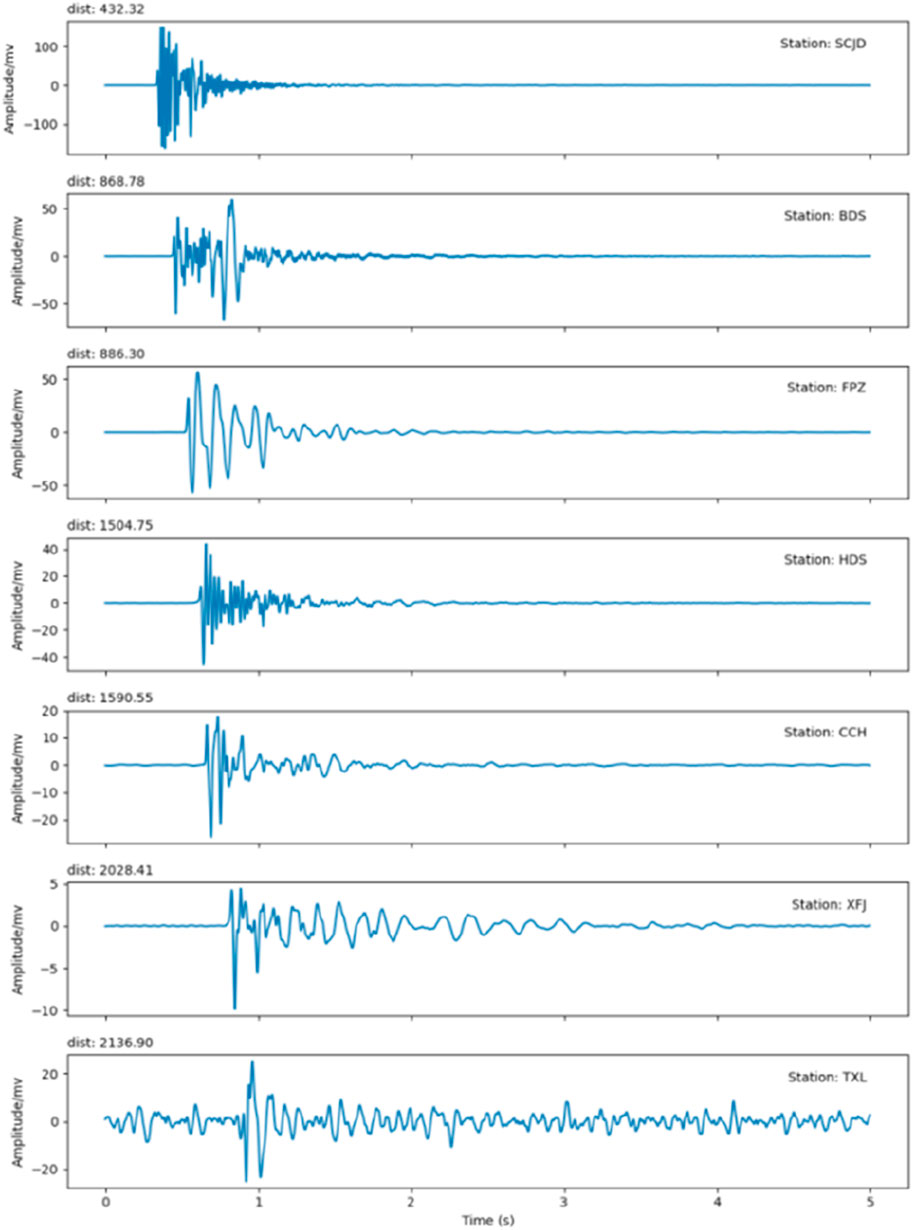
Figure 6. Event 5 station waveform recording.
Therefore, we have obtained a multi-faceted standard for measuring mine seismic events by referring to the source energy calculated above and the calculation equations for four commonly used seismic magnitudes provided in Supplementary Material S1, as shown in Table 4.
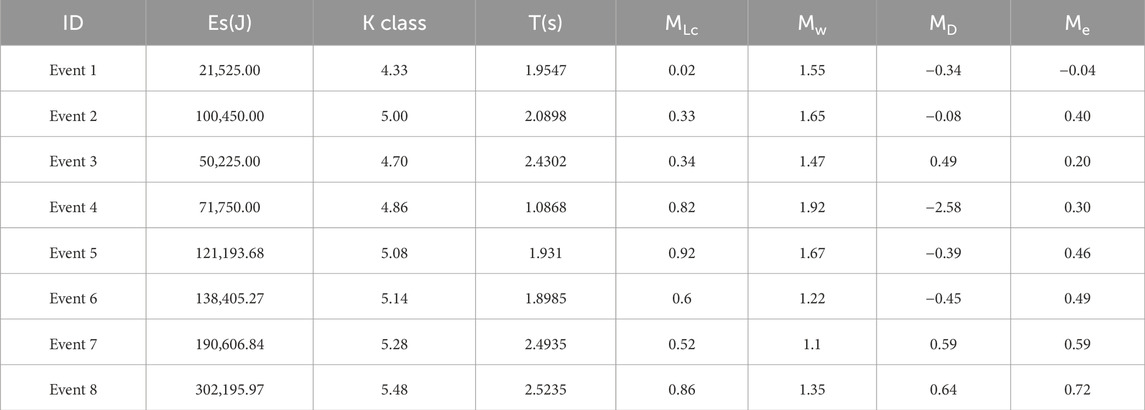
Table 4. Calculation results of the blast event.
The K class of the eight blasting events ranges from 4.33 to 5.48. The inconsistency between the theoretical energy and the calculated energy for multiple simultaneous blasts could be due to the cancellation of energies. Similarly, the energy magnitude Me, calculated based on energy, ranges from −0.04 to 0.72, with the magnitude possibly being negative for smaller energies. The duration magnitude MD ranges from −2.58 to 0.64 and is severely affected by the quality of the waveform. The corrected Richter magnitude MLc ranges from 0.02 to 0.92; the gauge function for the small region was recalculated, making the magnitude more accurate. The moment magnitude Mw ranges from 1.10 to 1.92, which is larger than the other magnitudes.
Given the predetermined quantities of explosives and the amplitude readings at the station, we can determine the explosion’s reference energy as outlined in Table 4. In traditional magnitude scales, the energy magnitude Me is utilized as a baseline theoretical magnitude in this study; however, the equation for calculating Me was developed for natural earthquakes based on teleseismic P-waves and is used for calculating high-energy events above magnitude 6 (Choy and Boatwright, 1995; Di Giacomo et al., 2008), which means it lacks generality for calculating mine seismic events. Notably, MLc, characterized by its minimal deviation from the energy magnitude, proves to be a more precise equation for estimating microseismic magnitudes. The moment magnitude Mw can usually be obtained based on the inversion calculation of the moment tensor. However, for earthquakes below M ≤ 3, direct inversion of the moment tensor can result in significant errors (Li et al., 2023). The moment magnitude of microseismic events is usually calculated based on spectral analysis. To obtain accurate and reliable results of source spectrum analysis, it is necessary to study the detailed crustal velocity structure of the research area, especially a reasonable regional attenuation model, as well as a sufficient number (at least six) of high signal-to-noise ratio teleseismic waveforms. The conditions are very harsh (Li et al., 2023). However, due to the complex mining environment in coal mines and the constantly shifting stations, the application accuracy of moment tensor inversion in coal mines is limited (Cao et al., 2022). This renders the microseismic moment magnitude unsuitable for mine-induced microseisms, as evidenced by the significant disparities with other magnitudes shown in Table 4. Additionally, the duration magnitude MD, also detailed in Table 4, displays extensive variability and unpredictable behavior, with some readings as low as −2.5. This metric, reliant solely on the duration of seismic waves, has a weak correlation with the seismic activity itself and is vulnerable to interference from extraneous signals and instrument sensitivity. The extraction of waveform duration faces practical challenges, especially in mine environments where seismic events often produce densely packed, short-duration waveforms across a broad frequency band, leading to potential inaccuracies. Consequently, the refined Richter magnitude MLc emerges as the most accurate and reliable measure for assessing the size of microseismic events at the Dongtan Coal Mine, demonstrating its efficacy amid the complexities of seismic event analysis.
In terms of energy, we have applied the K class, which intuitively describes the scale of destruction of mine earthquakes. Because the energy of most mine earthquake events is relatively small, using conventional magnitudes can result in negative magnitudes, which are difficult for non-professionals to understand. The K-class definition equation ensures that there are no negative numbers in a K class; the lowest is when the energy is 1 J, at which point K = 0. However, mine earthquake events do not have such low energy levels (it is known from long-term experience that mine earthquake energy ranges from 103 J to 106 J), so using K class to measure mine earthquakes will not result in negative numbers, making it more accessible to non-professionals. Additionally, each difference of 1 in K only results in a tenfold difference in energy, compared to the magnitude equation in natural earthquakes, where a difference of one magnitude level corresponds to a 32× difference in energy (Gutenberg and Richter, 1954), allowing for a more detailed measurement of a mine earthquake.
In summary, both MLc and K class are good standards for measuring the magnitude of mine tremors. In order to combine these two standards, we use the 20 high-energy events fitting MD in Supplementary Material S1 to fit the curve of K versus MLc, with the fitting results shown in Figure 7. Events with MLc ≥ 1 are defined as high-energy events. The 20 high-energy events used for fitting were continuously monitored on the 6306 working face of the Dongtan Coal Mine, with monitoring times ranging from 10 September 2023 to 19 December 2023. The magnitudes of these events ranged from a minimum of 1.06 to a maximum of 2.16 on the Richter scale.
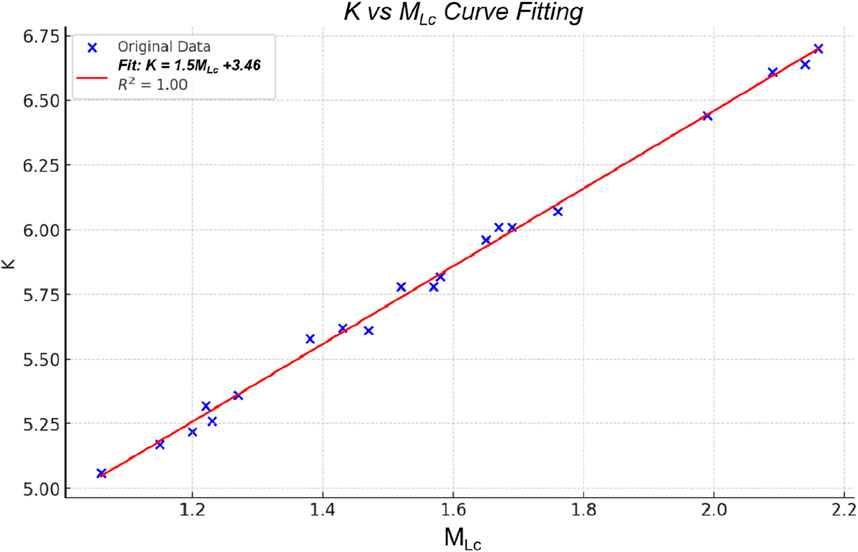
Figure 7. K class and magnitude curve fitting.
The fitting results show that R2 = 1.0, indicating a perfect fit, and that K and MLc have a linear relationship, as expressed by Eq. 6. Based on the range of K, mine earthquakes are divided into seven categories as follows (Figure 8): K ≤ 4, Unfelt mine microearthquake; 4< K ≤5, Weak mine microearthquake; 5< K ≤6, Minor mine microearthquake; 6< K ≤7, Moderate mine microearthquake; 7< K ≤8, Major mine microearthquake; 8< K ≤9, Strong mine earthquake; 9< K ≤10, and K > 10, Superlarge mine earthquake. The largest mine earthquake recorded in China occurred in 1970 at the Taiji Coal Mine in Beipiao, Liaoning, with a magnitude of MLc = 4.3. According to classification, the eight calibration blast events used in this article are weak mine microearthquakes.
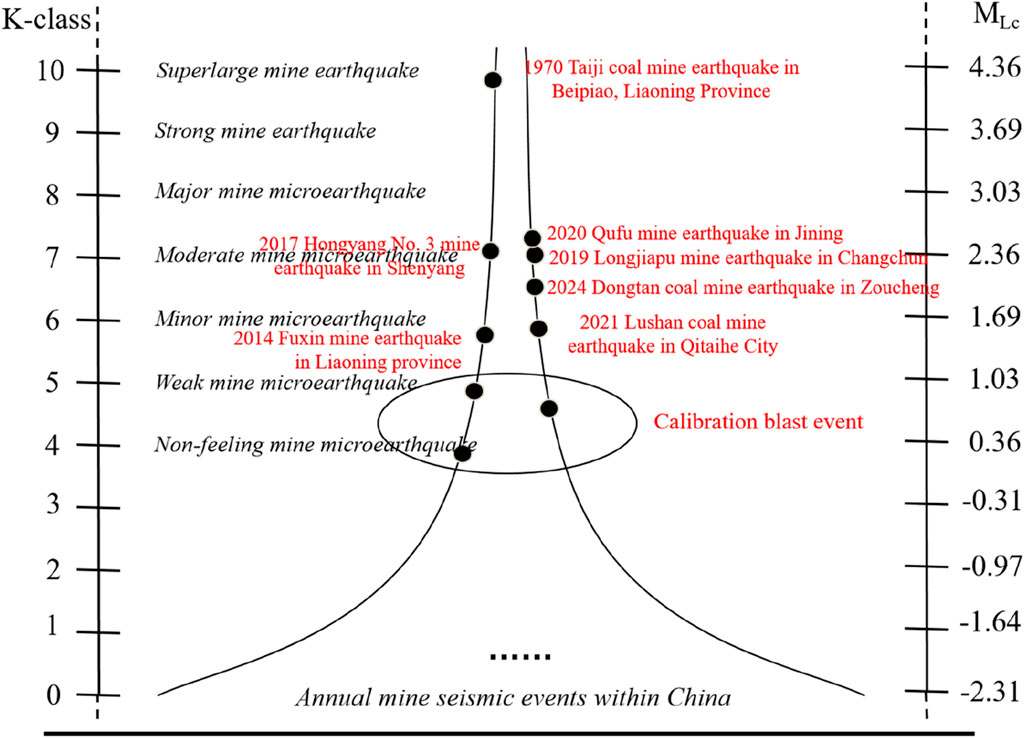
Figure 8. Measuring system for mine earthquakes.
When the epicenter distance is less than 5 km, the aforementioned Eqs 3, 6 in Supplementary Material S1 can be combined to obtain the new K-class calculation equation directly from the seismic wave amplitude and epicenter distance:
where A represents the average amplitude of the three components of the station, and Δ represents the epicenter distance.
We applied the K class, which intuitively measures the size of mine earthquakes using only energy, eliminates negative numbers, and is easier for non-professionals to understand. Each level differs by only a factor of 10 in energy, providing a more detailed depiction of the impact of mine earthquakes compared to the magnitude formula. The key to the K class is the calculation of seismic energy; hence, we discussed the superposition calculation of energy at a single station and considered the energy attenuation process. Based on single-hole blasting events in calibrated explosion tests, we fitted the energy attenuation coefficient. Then, we can perform energy correction to obtain the seismic source energy Es after calculating the attenuated energy Ee based on the amplitude at a single station. From the perspective of magnitude, the corrected local magnitude MLc for small scales (epicentral distance ≤ 5 km) can reflect the situation of mine earthquakes well. From the perspective of energy, K class can also reflect the situation of mine earthquakes well, and the two can be converted into each other. From the frequency domain, the calculation of magnitude considers only a specific frequency band (short-period body waves, long-period surface waves, etc.), and the determination of seismic energy should consider the energy of seismic waves in all frequency bands. However, in complex mine earthquake events, body waves contribute the vast majority of energy. Our calculation of MLc accurately utilizes the average maximum amplitude of P-waves, which gives significance to the empirical formula for converting K to MLc. Furthermore, the system for measuring and classifying mine earthquakes is of practical value.
The data analyzed in this study are subject to the following licenses/restrictions: Please contact the corresponding author. Requests to access these datasets should be directed to emhhbmthaUBzdHUuY2R1dC5lZHUuY24=.
CW: conceptualization, resources, and writing–review and editing. KZ: writing–review and editing. XZ: methodology, software, and writing–review and editing. RX: conceptualization and writing–original draft. CK: supervision, validation, and writing–review and editing.
The author(s) declare that no financial support was received for the research, authorship, and/or publication of this article.
Authors CW and XZ were employed by Yankuang Energy Group Co., Ltd.
Authors KZ, RX, and CK were employed by Shandong Keyue Technology Co., Ltd.
All claims expressed in this article are solely those of the authors and do not necessarily represent those of their affiliated organizations, or those of the publisher, the editors, and the reviewers. Any product that may be evaluated in this article, or claim that may be made by its manufacturer, is not guaranteed or endorsed by the publisher.
The Supplementary Material for this article can be found online at: https://www.frontiersin.org/articles/10.3389/feart.2024.1372459/full#supplementary-material
SUPPLEMENTARY FIGURE S1
Least squares fitting of the duration magnitude MD to the duration time t for the persistent event.
SUPPLEMENTARY TABLE S1
Large energy event table.
Bisztricsany, E. A. (1958). A new method for the determination of the magnitude of earthquakes. Geofiz. Kozlem 72.
Boatwright, J., and Choy, G. L. (1986). Teleseismic estimates of the energy radiated by shallow earthquakes. J. Geophys. Res. 91, 2095–2112. doi:10.1029/jb091ib02p02095
Bormann, P., Fujita, K., Mackey, K. G., and Gusev, A. (2012). “The Russian K-class system, its relationships to magnitudes and its potential for future development and application,” in New manual of seismological observatory practice 2 (NMSOP-2). Editor P. Bormann potsdam: deutsches GeoForschungsZentrum GFZ, 1–27.
Brady, B. H. G., and Brown, E. (2006). Rock mechanics for underground mining. Chapman and Hall, 1993.
Cao, A., Chen, F., Liu, Y., Dou, L., Wang, C., Yang, X., et al. (2022). Response characteristics of rupture mechanism and source parameters of mining tremors in frequent coal burst area. J. China Coal Soc. 47 (2), 722–733.
Choy, G. L., and Boatwright, J. L. (1995). Global patterns of radiated seismic energy and apparent stress. J. Geophys. Res. 100 (18), 18205–18228. doi:10.1029/95jb01969
Di Giacomo, D., Grosser, H., Parolai, S., Bormann, P., and Wang, R. (2008). Rapid determination of Me for strong to great shallow earthquakes. J. Geophys. Res. Lett. 35, L10308. doi:10.1029/2008gl033505
Feng, R. (2020). Interest Seismology (13): magnitude, approaching the energy scale. Adv. Earthq. Sci. 50 (01), 40–48.
Gao, M. S., Dou, L. M., Zhang, N., Mou, Z. L., Wang, K., and Yang, B. S. (2007). Experimental study of earthquake tremor for transmitting law of rockburst in geomaterials. Chin. J. Rock Mech. Eng. (07), 1365–1371.
General Administration of Quality SupervisionInspection and Quarantine of the People's Republic of ChinaStandardization Administration of China (2017). GB17740 -- 2017 Earthquake magnitudes. Beijing: Standards Press of China.
Grzegorz, K., Patricia, M. G., and Marco, B. (2016). HybridMT: a MATLAB/shell environment package for seismic moment tensor inversion and refinement. Seismol. Res. Lett. 87 (4), 964–976. doi:10.1785/0220150251
Gu, X. J. (2022). Study on Genetic mechanism of cave-in type mine earthquake. Chin. J. Saf. Sci. 12 (2), 60–63.
Gutenberg, B. (1945). Amplitudes of surface waves and magnitudes of shallow earthquakes*. Bull. Seis. Soc. 35, 3–12. doi:10.1785/bssa0350010003
Gutenberg, B., and Richter, C. F. (1954). Seismicity of the Earth and associated phenomena. 2nd edition. Princeton: Princeton University Press.
Jia, B. X. (2012). Research on the theory and application of mine earthquake monitoring. Master thesis. Liaoning, China: Liaoning Technical University.
Kanamori, H. (1977). The energy release in great earthquakes. J. Geophys. Res. 82 (20), 2 981–982 987. doi:10.1029/jb082i020p02981
Kanamori, H. (1983). Magnitude scale and quantification of earthquakes. Tectonophysics 93 (3-4), 185–199. doi:10.1016/0040-1951(83)90273-1
Lee, W. H. K., Bennet, R. E., and Meaghu, K. L. (1972). A method of estimating magnitude of local earthquakes from signal duration. Reston, Virginia, America: U.S. Geological Survey Open File Report, 28.
Li, B., Jin, Y. D., Li, J. L., Wang, Z. D., and Nganaye Gomer, D. (2023). Determination of moment magnitude based on spectrum analysis -- taking shanxi seismic belt as an example. Shanxi Earthq. (01), 1–8.
Li, S. B. (1959). Regional division of earthquake in China and its explanation. Chin. J. Geophys. 6 (2), 13∼24.
Li, T. Z., Zhao, Z., Ma, L., and Zhang, X. Y. (2011). Genetic analysisand preventive measure of earthquake induced by coal mining. J. Xuzhou Inst. Technol. Nat. Sci. Ed. 26 (03), 16–20.
Li, X. Z., Wang, H. J., and Lei, J. (2003). Determination of near field magnitude starting function and calculation of explosion aftershock magnitude. Earthq. China, 15–22.
Li, Z. (2019). Determination of energy magnitude and its application. Master thesis. China Earthquake Administration: Institute of Geophysics.
Liu, R. F., Chen, Y. T., Ren, X. S., Xu, Z. G., Wang, X. X., Zou, L. Y., et al. (2015). Measurement of earthquake magnitudes. Beijing: Seismological Press, 53.
National Coal Mine Safety Administration (2018). Detailed rules for the prevention and control of coal mine outburst. Beijing, China: Coal Industry Publishing House.
Rautian, T. G. (1958). Attenuation of seismic waves and the energy of earthquakes. I. Tr. Inst. Seism. Stroitel’stva i Seismol. Akad. Nauk. Tadjikskoi SSR 7, 41–85. (in Russian).
Rautian, T. G. (1960). “Energy of earthquakes,” in Methods for the detailed study of seismicity. Editor Y. V. Riznichenko (Moscow: Izdatel’stvo Akademii Nauk SSSR), 75–114. (in Russian).
Rautian, T. G., Khalturin, V. I., Fujita, K., Mackey, K. G., and Kendall, A. (2007). Origins and methodology of the Russian energy K-class system and its relationship to magnitude scales. Seismol. Res. Lett. 78 (6), 579–590. doi:10.1785/gssrl.78.6.579
Richter, C. F. (1935). An instrumental earthquake magnitude scale. Bull. Seismol. Soc. Am. 25 (1), 1–32. doi:10.1785/bssa0250010001
Wang, J. Q., Zhu, Q. J., and Zhang, E. H. (2020). A method for microseismic energy expressions in mine. Coal Eng. 52 (10), 86–91.
Wang, Y. M. (1994). Aerodynamics in mine and mine ventilation system. Beijing: Metallurgical Industry Press, 305–322.
Keywords: k-class, mine microseismicity, Richter magnitude, blasting experiment, mine earthquake measurement system
Citation: Wang C, Zhan K, Zhao X, Xu R and Kong C (2024) The application of the K-class system in mine seismicity. Front. Earth Sci. 12:1372459. doi: 10.3389/feart.2024.1372459
Received: 18 January 2024; Accepted: 07 May 2024;
Published: 05 June 2024.
Edited by:
Lianjie Huang, Los Alamos National Laboratory (DOE), United StatesReviewed by:
Vladimir Smirnov, Lomonosov Moscow State University, RussiaCopyright © 2024 Wang, Zhan, Zhao, Xu and Kong. This is an open-access article distributed under the terms of the Creative Commons Attribution License (CC BY). The use, distribution or reproduction in other forums is permitted, provided the original author(s) and the copyright owner(s) are credited and that the original publication in this journal is cited, in accordance with accepted academic practice. No use, distribution or reproduction is permitted which does not comply with these terms.
*Correspondence: Kai Zhan, emhhbmthaUBzdHUuY2R1dC5lZHUuY24=
Disclaimer: All claims expressed in this article are solely those of the authors and do not necessarily represent those of their affiliated organizations, or those of the publisher, the editors and the reviewers. Any product that may be evaluated in this article or claim that may be made by its manufacturer is not guaranteed or endorsed by the publisher.
Research integrity at Frontiers
Learn more about the work of our research integrity team to safeguard the quality of each article we publish.