 Wei-Chia Hung1,2
 Cheinway Hwang1*
 Shao-Hung Lin2,3
 Chuan-Sheng Wang2Yi-An Chen2Pei-Ching Tsai4Kuan-Chung Lin1,2
- 1Department of Civil Engineering, National Yang Ming Chiao Tung University, Hsinchu City, Taiwan
- 2Green Environmental Engineering Consulting Co. LTD., Hsinchu City, Taiwan
- 3Department of Geosciences, National Taiwan University, Taipei City, Taiwan
- 4Department of Geomatics, National Cheng Kung University, Tainan City, Taiwan
The Choushui River Alluvial Fan (CRAF) is a major agricultural area in Taiwan with heavy groundwater usage. The extraction of groundwater here has caused land subsidence, which is now a significant global environmental issue. This study analyzes land subsidence in the CRAF by integrating hydrogeological data from 233 groundwater monitoring stations across four aquifers (CRAF Groundwater_NET) and data from 50 continuous GNSS stations (CRAF GNSS_NET). We developed an automated processing flow for GNSS static surveying within CRAF GNSS_NET, and further employed a time-series fitting method to examine the long-term trends and annual changes for both GNSS and groundwater level data. Our analysis of the time-series data from the past decade identifies areas of significant groundwater level depletion and subsidence hotspots. We explore the relationship between groundwater level variations and surface displacements within CRAF, utilizing GNSS data to analyze horizontal and vertical displacement trends, as well as annual changes. We integrate these findings with hydrogeological data to understand regional subsidence patterns. Our results indicate that CRAF is characterized by distinct hydrogeological features. The study finds that the amplitudes of annual changes in both groundwater level and vertical displacement generally increase from northeast to southwest in the analyzed region. One particular area shows significant groundwater level decline, with the most severe rate recorded at 0.54 m/year. Similarly, GNSS analysis indicates pronounced subsidence trends in the same area, with rates ranging from 4.2 to 5.2 cm/year. These findings highlight the critical need for the development of effective groundwater management strategies to ensure sustainable use of groundwater resources and to implement mitigation measures against land subsidence in similar multiple-aquifer settings.
1 Introduction
Over-pumping of groundwater, intensified by depletion of freshwater due to climate anomalies, has led to widespread land subsidence globally (Taylor et al., 2013; Wang et al., 2022). According to Herrera-Garcia et al. (2021), the 19% of the global population may face a high probability of subsidence. Currently, monitoring techniques for land subsidence are categorized into land surface and underground measurements. Land surface monitoring methods include the precise leveling, radar interferometry, and Global Navigation Satellite System (GNSS) (Abidin et al., 2001; Burbey, 2003; Carruth et al., 2007; Figueroa-Miranda et al., 2018). The precise leveling method, popular from the 1970s–1980s, offers high accuracy of height measurements. However, its requirements of extensive ground-based leveling points and significant manpower lead to a high cost and long measurement time. While precise leveling measurements remain crucial for ground monitoring, considerations of budget and manpower have led to the adoption of alternative satellite monitoring technologies for assistance. Consequently, the severity of land subsidence areas is classified, with Taiwan serving as an example. In regions where significant subsidence is observed (with an annual rate exceeding 3 cm/year), measurements are conducted annually. In contrast, for areas without significant subsidence, leveling measurements are undertaken every 3–5 years to reduce the frequency and number of leveling surveys.
Interferometric Synthetic Aperture Radar (InSAR) method leverages satellite radar images for extensive monitoring. It offers a wide range of coverage with a short revisit time attributed of satellites like the Sentinel, which provides images for every 6–12 days. High-frequency imaging observation allows for detailed time series analysis of surface displacements, making InSAR highly effective in monitoring changes of land surface (Hung et al., 2011; Yang et al., 2019; Hung et al., 2023).
Underground monitoring techniques encompass two types of extensometers, namely, the Multi-layered Compaction Monitoring Well (MLCW) as described by Hung et al. (2010, 2012; Hung et al., 2021) and the extensometer technology reported by Burbey. (2020). Another key method involves the use of groundwater level observation wells, which primarily focus on monitoring variations in groundwater levels. These techniques are primarily used to analyze the deformation of underground layers, identifying major compaction depth in an aquifer system, correlating with groundwater level variation. They enable a comprehensive understanding of how underground strata respond to various forces, including earthquakes, and are instrumental in devising strategies to prevent land subsidence.
Despite differences in spatial-temporal resolution and observation accuracy among various monitoring data, a comprehensive monitoring result can be achieved through data cross comparison. Global Navigation Satellite Systems (GNSS) has undergone advanced development over the past 3 decades, establishing as a milestone in space geodesy positioning technology. GNSS includes Global Positioning System (GPS), GLObal’ naya NAvigatsionnaya Sputnikovaya Sistema (GLONASS), Galileo, and BeiDou Navigation Satellite System (BDS) and the regional Quasi-Zenith Satellite system (QZSS) and Navigation with Indian Constellation (NavIC) as well. The U.S. GPS is the best known currently (Odolinski et al., 2020).
Currently, the GNSS satellites have been transmitting signals on more than two frequencies. Multi-frequency data are available and can enhance the application of positioning and non-positioning purpose. It will significantly improve the current dual-frequency GPS positioning strategy. The benefits of combining GNSS constellations and using multi-frequency data have been evaluated and promoted by research and institute organizations such as the International Association of Geodesy (IAG), in Working Group 4.5.4: Data Processing of Multiple GNSS Signals, the International GNSS Service (IGS) Multi-GNSS Experiment (MGEX) and the Japan Aerospace Exploration Agency (JAXA) Multi-GNSS Asia (MGA) (Lau et al., 2015).
GNSS is extensively used for monitoring land subsidence, crustal deformation, and landslide activities (Gili et al., 2000; Motagh et al., 2007; Rau et al., 2008). A unique feature of GNSS technology is its ability to provide continuous displacement data at a specific site, which could enable further analysis of surface deformations. Furthermore, the modernization of satellites, particularly by the United States, has enhanced GNSS system capabilities since 2008. The new generation GPS satellites have already been transmitting new civil signals like L1C, L2C and L5, significantly improving GPS data accuracy and reliability for geodesy applications.
In Taiwan, increasing demands of freshwater due to a rapid economic growth cause excessive groundwater extraction. The over-pumping problem in aquifer systems has caused severe subsidence issues, particularly in southwest coastal areas. The issues of land subsidence and resultant problems like flooding have permanently damaged aquifer system and impose significant costs for relative hazards (Liu et al., 2004; Hung et al., 2021).
Excessive withdrawal of groundwater from aquifer systems leading to pore pressure imbalances is one of the primary mechanisms of land subsidence. Understanding the relationship between hydrogeological environments and groundwater level fluctuations is crucial. Over the past 30 years, extensive drilling and core sampling was conducted by the Central Geological Survey of the Ministry of Economic Affairs in Taiwan to thoroughly comprehend the hydrogeological environment of Choushui River Alluvial Fan (CRAF). Additionally, the 24 GNSS continuous stations have been strategically built for land subsidence monitoring in CRAF by Water Resources Agency (WRA, 2022). A GNSS network (CRAF GNSS_NET) is formed consisting of these stations with the other 26 GNSS stations established by various organizations in Taiwan.
This study proposes an automated GNSS calculation processing flow, including downloading of satellite parameters and modifying the parameters automatically, to ensure the stability of GNSS processing. By utilizing time series analysis, we assess the rates and amplitudes of annual change in time series obtained from GNSS and groundwater level data. We aim to identify regions prone to layered compaction, pinpoint the timing and magnitude of annual variation, and measure the extent of groundwater level decline. These insights are vital for understanding how groundwater fluctuations influence layer compaction and land subsidence, providing valuable guidance for managing and allocating groundwater resources.
2 Study area
CRAF, known for being a significant agricultural area on Taiwan’s west coast, is primarily formed by the alluvial deposits of the Choushui River, with its key regions being Changhua County and Yunlin County. It extends from the Wuxi River’s south bank in the north to the Puzi River in the south. Geographically, it begins at the western base of the Bagua Mountain Platform and Douliu Hills in the east and stretches to the Taiwan Strait in the west, covering an area of about 1,800 km2.
Historically, the Choushui River, which forms the fan’s mainstream, has undergone numerous course changes, including multiple diversions. Notably, during the period from 1918 to 1923, embankments were constructed along the Choushui River to establish the current main river channel. The alluvial fan is also home to several other rivers, which include the old Choushui River, new Huwei Creek, old Huwei Creek, Beigang Creek, and Puzi Creek, flowing from north to south (Figure 1).
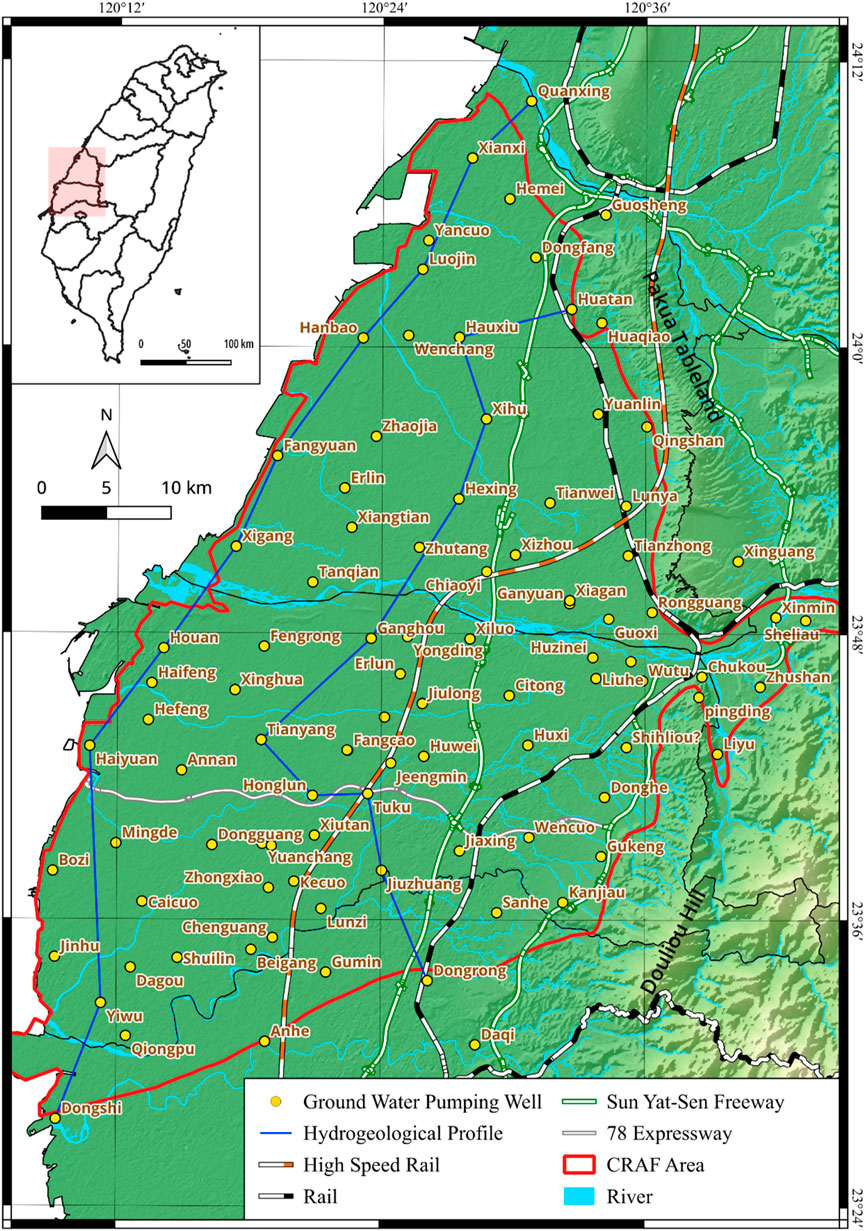
Figure 1. The geographic location of the Choushui River Alluvial Fan (the red-shaded region in the inserted map in the upper left) and townships.
Figure 2 shows a hydrogeological profile of CRAF, courtesy of the Central Geological Survey (CGS, 2002). This profile reveals significant geological variations, with the north side (Changhua and north Yunlin) characterized by a higher concentration of gravels and sand, and the south side (Yunlin area), especially south of old Huwei Creek, containing finer sand and compressible sediment such as silt and mud. These characteristics indicate a greater risk of ground subsidence in these areas, particularly when subjected to extensive water extraction.
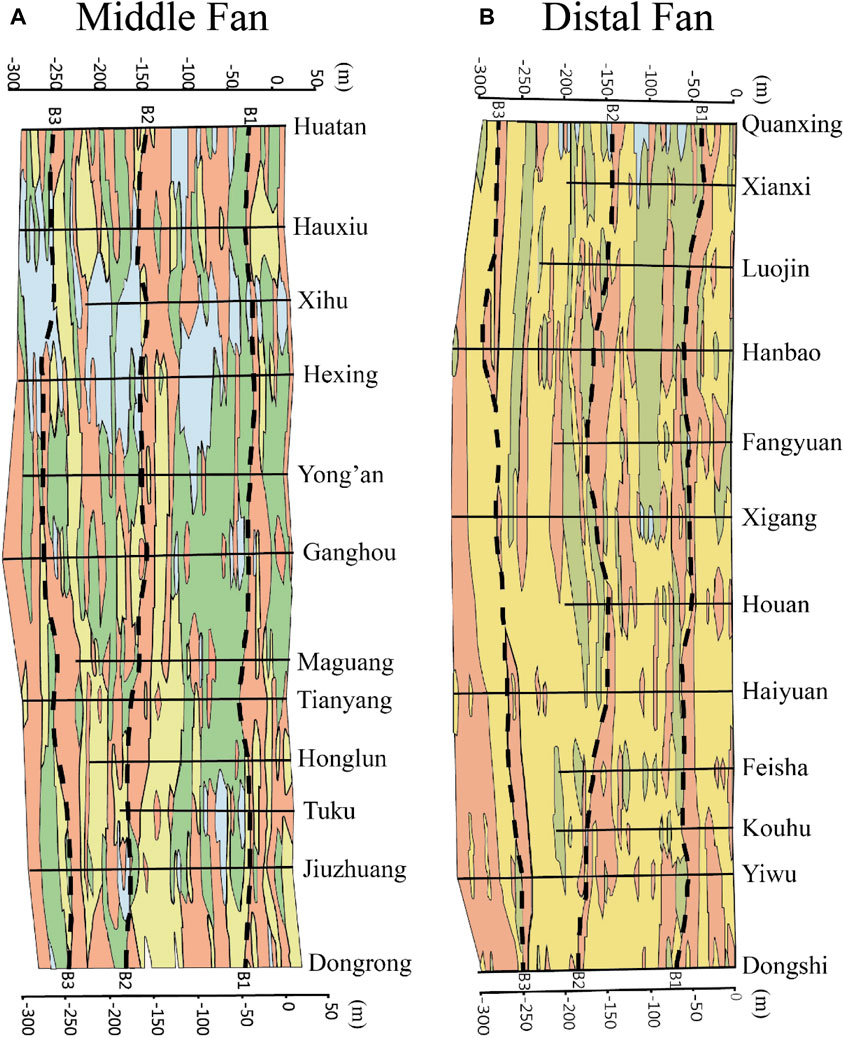
Figure 2. Hydrogeological profiles of the Choushui River Alluvial Fan (CRAF) up to depths of 300 m across different townships. (A) illustrates the Middle Fan and (B) the Distal Fan. Color coding indicates geological characteristics: blue for gravels, green for coarse sand, yellow for fine sand, and earthy yellow for silt, mud, and clay.
Figure 3, based on CGS (1999), presents a conceptual hydrogeological model of CRAF. It highlights that the primary groundwater recharge area is located at the Proximal Fan, characterized by thick gravel layers with indistinct stratification and lacking a significant resistive groundwater layer (mud layer), allowing unrestricted groundwater flow. The four aquifers in the Proximal Fan are essentially connected (Liu et al., 2004). They become finer towards the Middle and the Distal Fan of CRAF. The western side beyond the Proximal Fan, within 330 m depth, features four aquifers and four aquitards in Middle Fan and Distal Fan. The Proximal Fan consists of gravel and coarse sand layers. The Middle Fan contains two to three thin, loosely distributed extended clay layers within these braided layers, but their dimensions are smaller than the main four water-blocking layers, forming a porous layer. This structure, particularly in the clay layers within the porous layer, can lead to sediment compaction when groundwater is extracted.
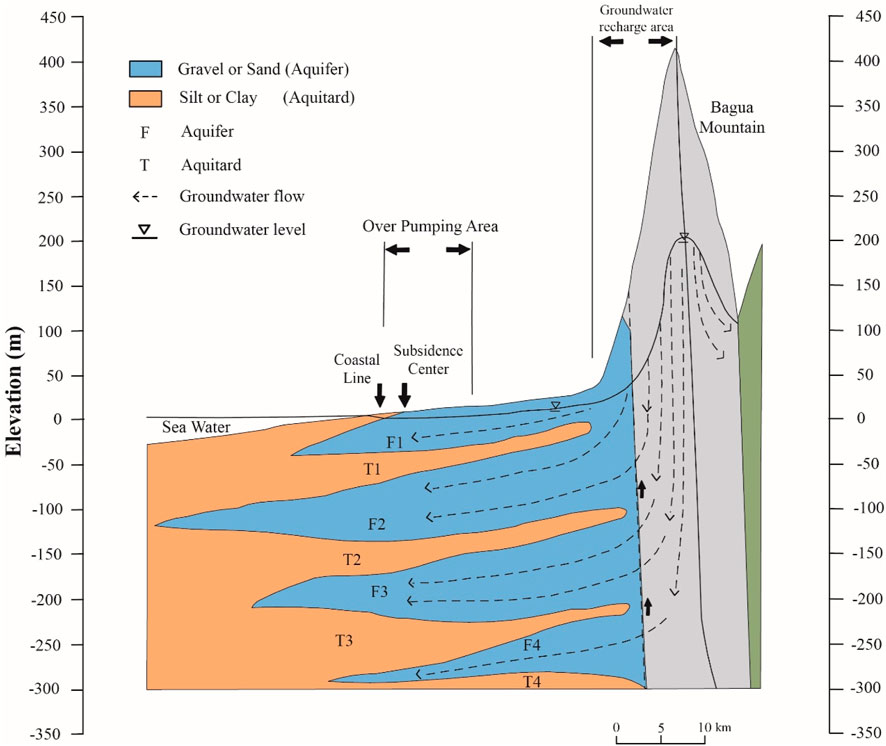
Figure 3. The hydrogeological conceptual model of CRAF according to CGS (2002).
In the central region of CRAF, aquifer stratification is clearly delineated, with the first aquifer spanning 0–50 m in depth, the second extending from 50 to 150 m, the third ranging from 150 to 250 m, and any depth beyond 250 m being classified as the fourth aquifer. Given CRAF’s significance as a pivotal rice production zone in Taiwan, and Yunlin County is a crucial part of CRAF, Yunlin gains even greater importance as a primary rice granary for Taiwan, supporting extensive rice cultivation. This agricultural intensity drives substantial groundwater extraction, mainly from the first and second aquifers, to sustain the vast stretches of farmland. This reliance on shallow aquifers underscores the critical need for sustainable water management practices in these agriculturally intensive regions to preserve water resources for future use.
3 Data and methods
3.1 Groundwater level data
In 1992, the WRA and the CGS of Taiwan’s Ministry of Economic Affairs jointly initiated the “Groundwater Monitoring Network Plan, Taiwan” (WRA, 2017). This 17-year project, spanning from 1992 to 2009, focused on managing Taiwan’s primary groundwater resources, constructing and maintaining a network to monitor groundwater and land subsidence. The plan involved studying the subsidence system and mechanisms, leading to the implementation of subsidence prevention and groundwater protection strategies between 1988 and 2023. In CRAF, 223 groundwater monitoring wells were established to form CRAF Groundwater_NET that spans across four distinct layers, including 73 wells in the first layer, 87 in the second, 47 in the third, and 17 in the fourth. The quantity and distribution of CRAF Groundwater_NET is illustrated in Table 1 and Figure 4. This study utilizes data from these 223 stations with the current measurement frequency set at an automated recording every 1 h. The measurement precision is approximately 3 cm, and the period used in this paper spans from January 2011 to July 2020 to analyze the velocity and gradient changes for time series.
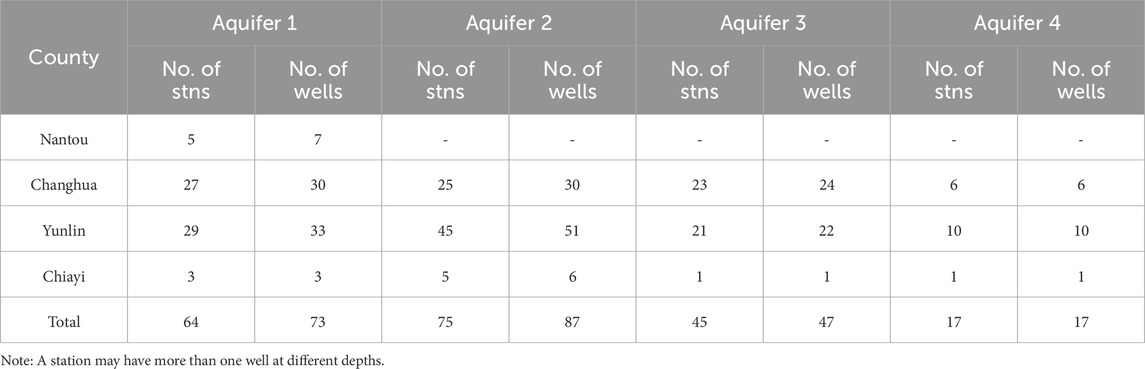
Table 1. Numbers of groundwater monitoring stations with numbers of wells in CRAF in four aquifers.
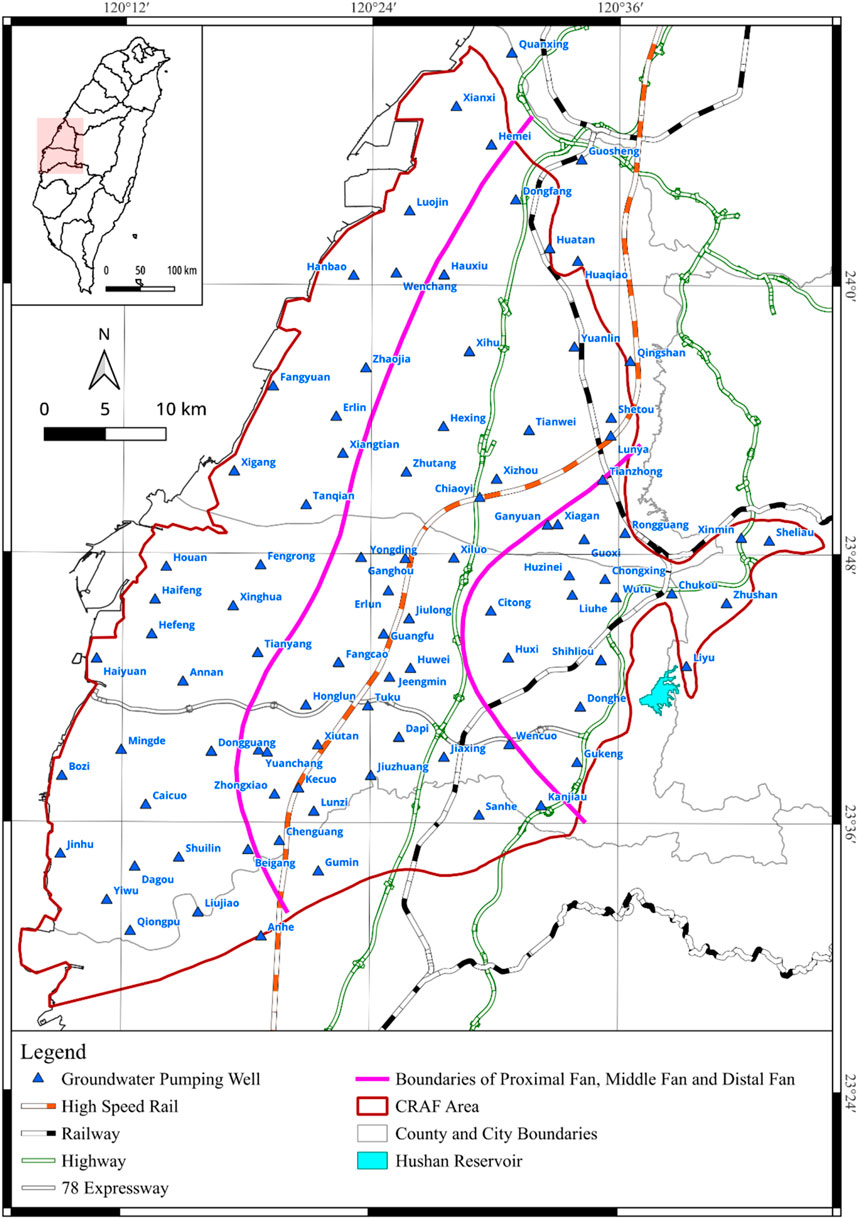
Figure 4. Distribution of groundwater monitoring wells and other features in CRAF. The inserted map (upper left) shows the location of CRAF in Taiwan (see also Figure 1).
3.2 Global Navigation Satellite System data
To monitor land subsidence and tectonic motion in Taiwan, the WRA has installed 24 GNSS continuous stations in CRAF. These stations are integrated with 26 additional GNSS stations from other organizations including CGS, Green Environment Consult Company (GEEC), Central Weather Bureau (CWB), Department of Lands and Lands of the Ministry of the Interior (MOI), National Land Surveying and Mapping Center of the Ministry of the Interior (NLSC) and Institute of Earth Sciences Academia (IES), forming CRAF GNSS_NET monitoring network. The distribution of these GNSS_NET stations is presented in Figure 5. This study uses GNSS data spanning from January 2011 to December 2022. The data are processed to calculate the daily coordinate solution for each station, tracking the positional changes over time. This enables the analysis of the movement trends at each GNSS station.
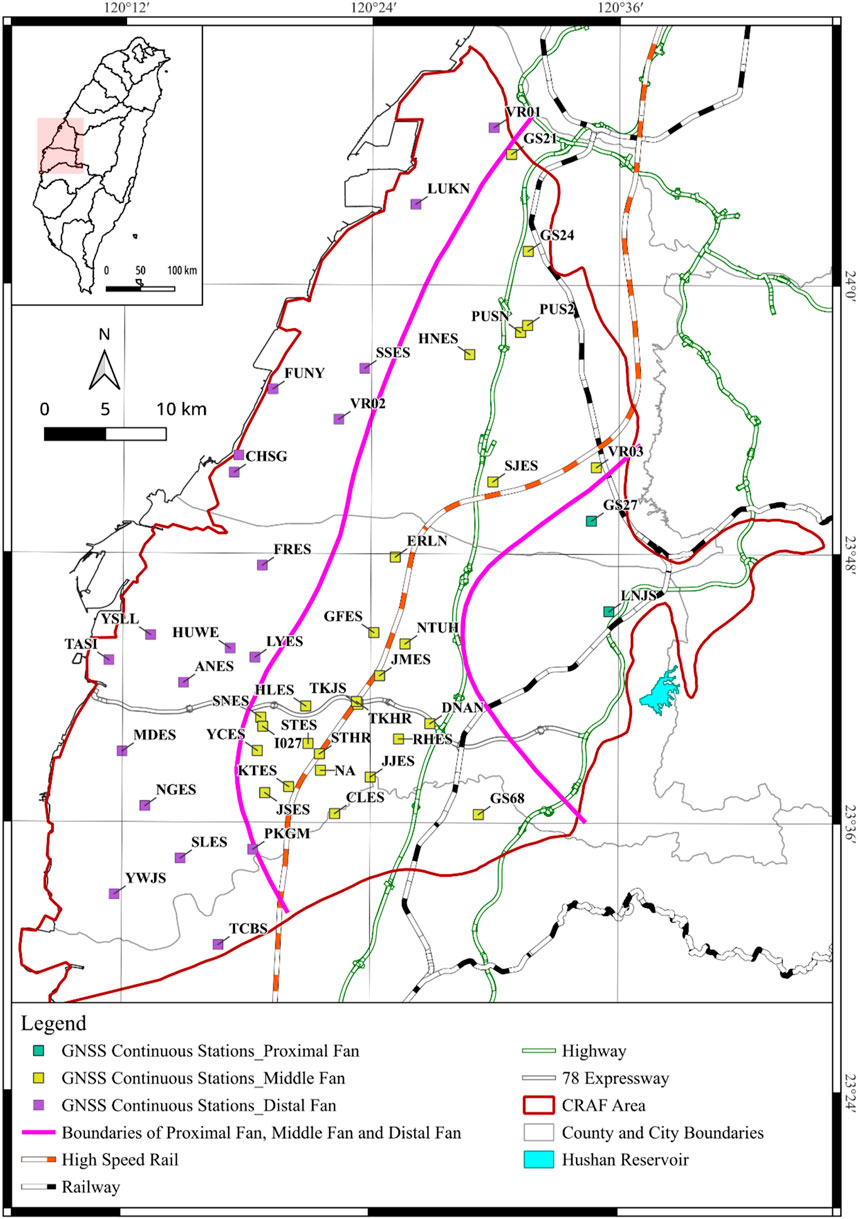
Figure 5. Distribution of continuous GNSS stations and other features in CRAF.
3.3 Method for GNSS data analysis
The CRAF GNSS_NET uses Taiwan’s GNSS base station named KMNM as a reference site. The coordinates of KMNM are based on the ITRF94 reference datum at the 2010.0 epoch. The results are then transformed to the Taiwanese coordinate system TWD97 [2010]. The software used for data-processing is the Bernese V5.2, which is developed by the Institute of Astronomy at the University of Berne, Switzerland (Dach et. al, 2015). To achieve rapid automated computation (Figure 6), this study utilizes an automated cloud integration platform set up on Amazon Web Services (AWS). A six-step procedure was used for data-processing as follows.
Step 1: Automatically receive GNSS_NET observation data and store the data in the archive built in AWS Cloud. The confirmation report is generated via automatic checking program for the verification of completion of data downloads.
Step 2: Use TEQC software for automated data quality control. This inceludes checking GNSS observational data against quality standards, focusing on observation counts, Mp1, Mp2, and Cycle Slip indicators.
Step 3: Automatically detect and synchronize the satellite health parameters, satellite information, Earth rotation parameters, and precise satellite ephemerides (IGS Final), Phase Center Offset (PCO) of antenna published by IGS and IGS AC.
Step 4: Perform automated calculations using Bernese V5.2 software. Compute the three-dimensional deformation of each fixed GNSS_NET station, with relevant parameters as outlined in Table 2.
Step 5: Transfer the computed results from the global ITRF datum (X, Y, Z) to Taiwan’s regional datum (N, E, h).
Step 6: Automatically generate GNSS time series plots to verify the accuracy of the computed results.
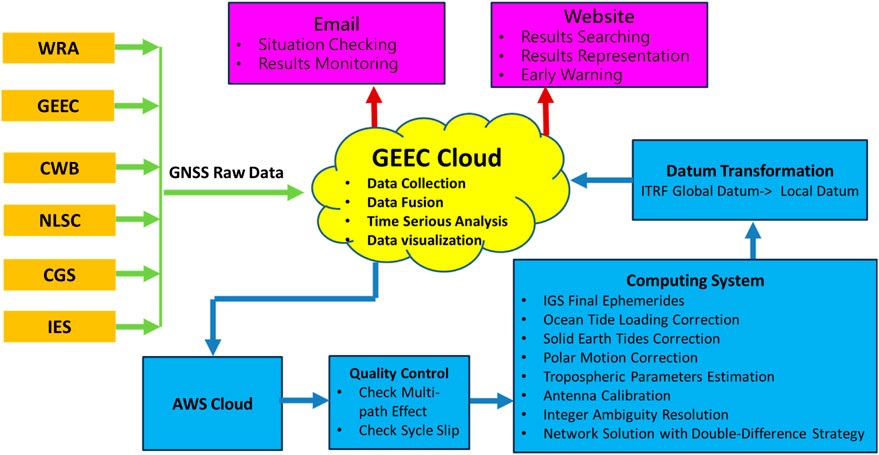
Figure 6. Flowchart for the automated GNSS calculation in this paper.
With the six steps completed, we then apply time series analysis to determine the three-dimensional velocities of displacement and the amplitudes of annual displacement, identifying subsidence hotspots using the velocities and groundwater level fluctuations. Finally, we use the GNSS time series to perform a multi-year analysis, tracing the patterns of inter-annual coordinate changes, as part of an early warning system for the impact of droughts on groundwater depletion.
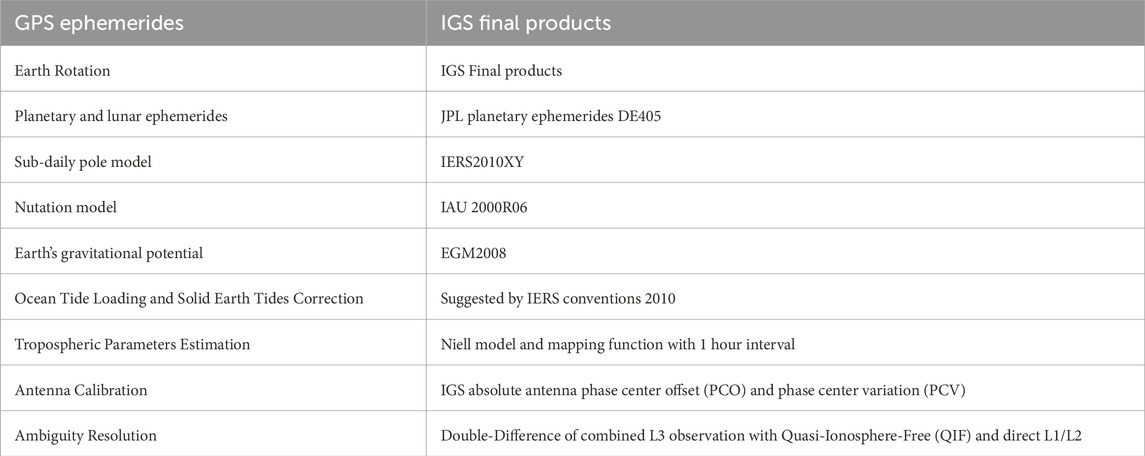
Table 2. Parameters for the automated GNSS calculation.
3.4 Method for time series analysis
The time series analysis method employed in this study is a method widely used in fields like earthquake prediction and GNSS simulations. The method decomposes a given time series into the velocity and periodic amplitude terms for isolating and examining the underlying patterns within the time series (Nikolaidis, 2002). The function describing a given time series is:
The parameter a is the intercept, the parameter b is the linear rate, the parameter
We use the aforementioned method to analyze groundwater level measurements and GNSS-retrieved land subsidence data for the purpose of calculating velocity and periodic amplitude.
4 Results
4.1 Time series analysis of groundwater level
We collected extensive groundwater level data in CRAF. Applying the time series method described in Section 3.4, we analyzed the groundwater level fluctuation velocity in the four different aquifers of CRAF, as shown in Figure 7A–D. Figure 7E–F show the amplitudes of annual change in the four aquifers.
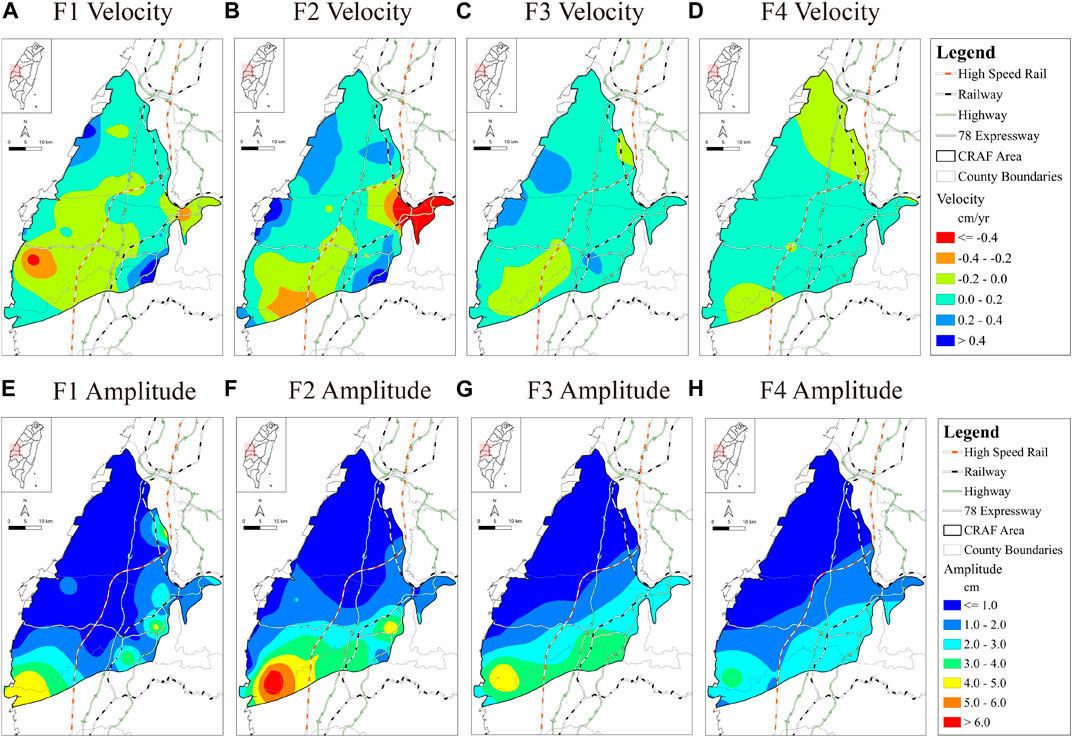
Figure 7. (A–D) Velocity of groundwater level changes in the first to fourth aquifers in CRAF, (E–F) amplitudes of annual groundwater level change in the first to fourth aquifers in CRAF.
Over the past decade, the groundwater levels of the first to fourth aquifers in the Changhua area (north of the Choushui River) have not decreased significantly and have even increased in certain parts (Figure 7A–D), with most of the annual changes being within a range of 0–2 m (Figure 7E–F). In contrast, the Yunlin area, which stretches from south of the 78 Expressway to north of Puzi Creek, has experienced a remarkable groundwater depletion (Figure 7A–D). There is a noticeable increase in amplitude, particularly in the central depletion (Figure 7A–D). There is a noticeable increase in amplitude, particularly in the central fan and tail area, with the groundwater level station in Yiwu reaching amplitudes of about 6 m (Figure 7E–F)
4.2 Vertical displacements from GNSS
The daily GNSS coordinate solutions achieve centimeter-level accuracy. Using the time-fitting method in Section 3.4, we determined the velocity of vertical displacement and the amplitudes of annual displacement at each station, as shown in Table 3. Figure 8A shows the velocity of the vertical displacements at the 24 GNSS continuous stations. Figure 8B shows the amplitudes of annual vertical displacement without the velocity.
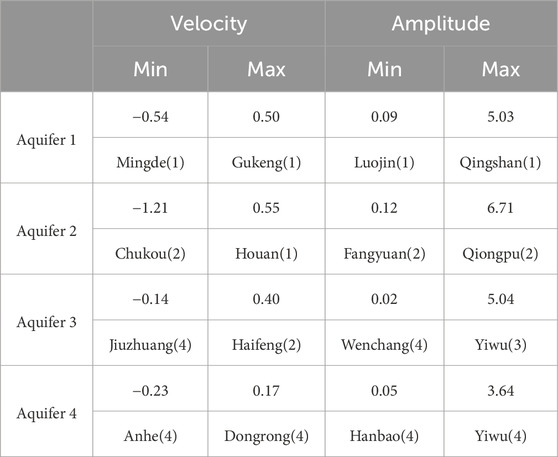
Table 3. Velocity of groundwater level change and amplitudes of annual change in the four aquifers of CRAF (unit: meter).
Figure 8. (A) Velocity of vertical displacement and (B) amplitudes of annual vertical displacement at GNSS stations in CRAF.
Using the velocities of vertical displacement from Table 4. Parameters such as the semi-variogram are optimized during the actual interpolation process to ensure the highest accuracy of the interpolated data. We constructed a 10-year field of vertical displacement rates for the Yunlin area, as shown in Figure 9A. We repeated this for the amplitudes of annual displacement to generate a 10-year field of amplitudes in the Yunlin area, as illustrated in Figure 9B.
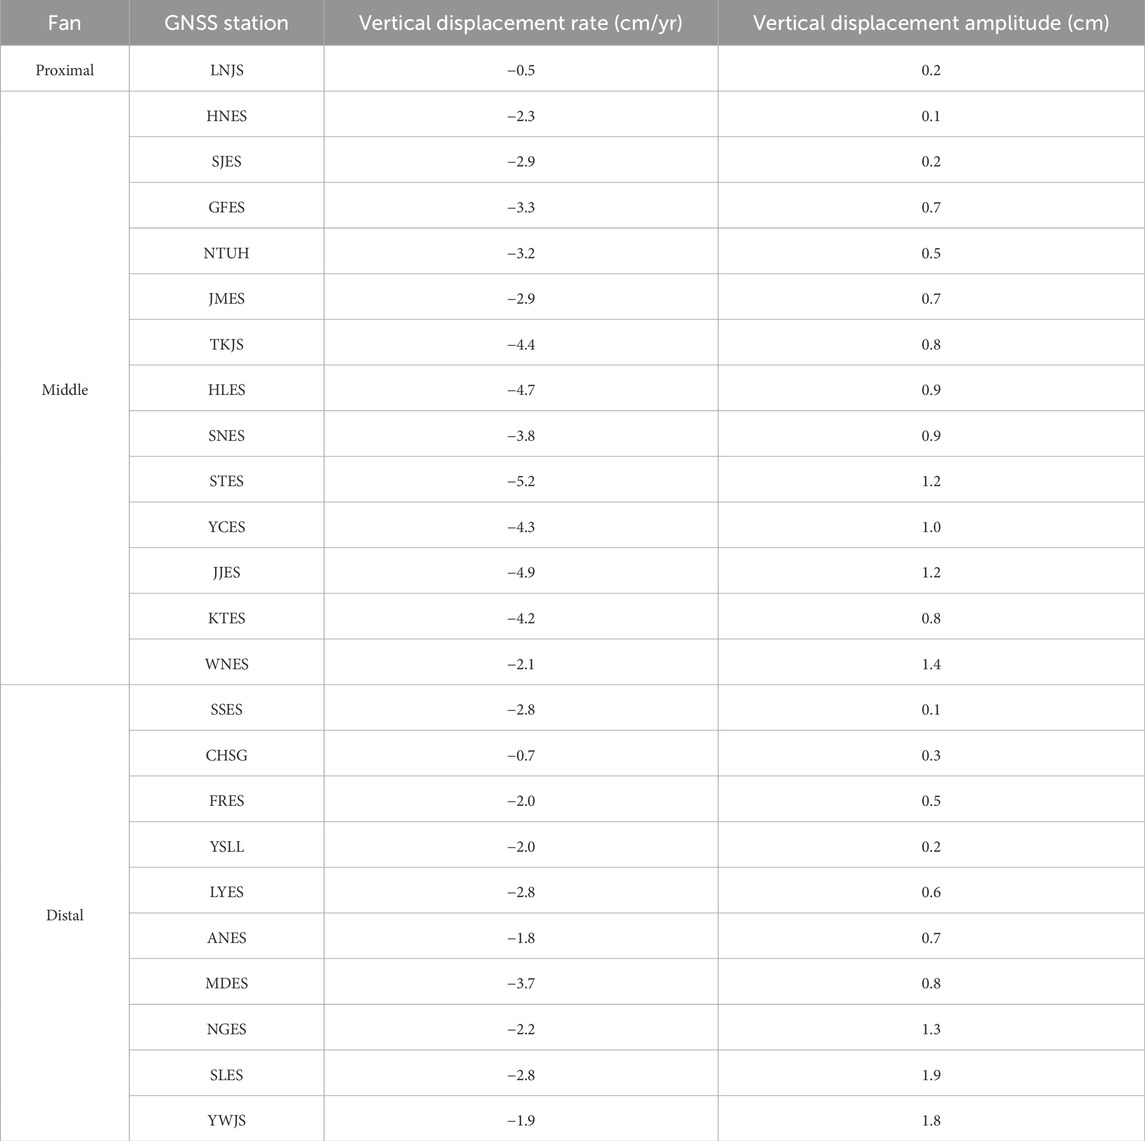
Table 4. Rates of vertical displacement and amplitudes of annual change at GNSS stations.
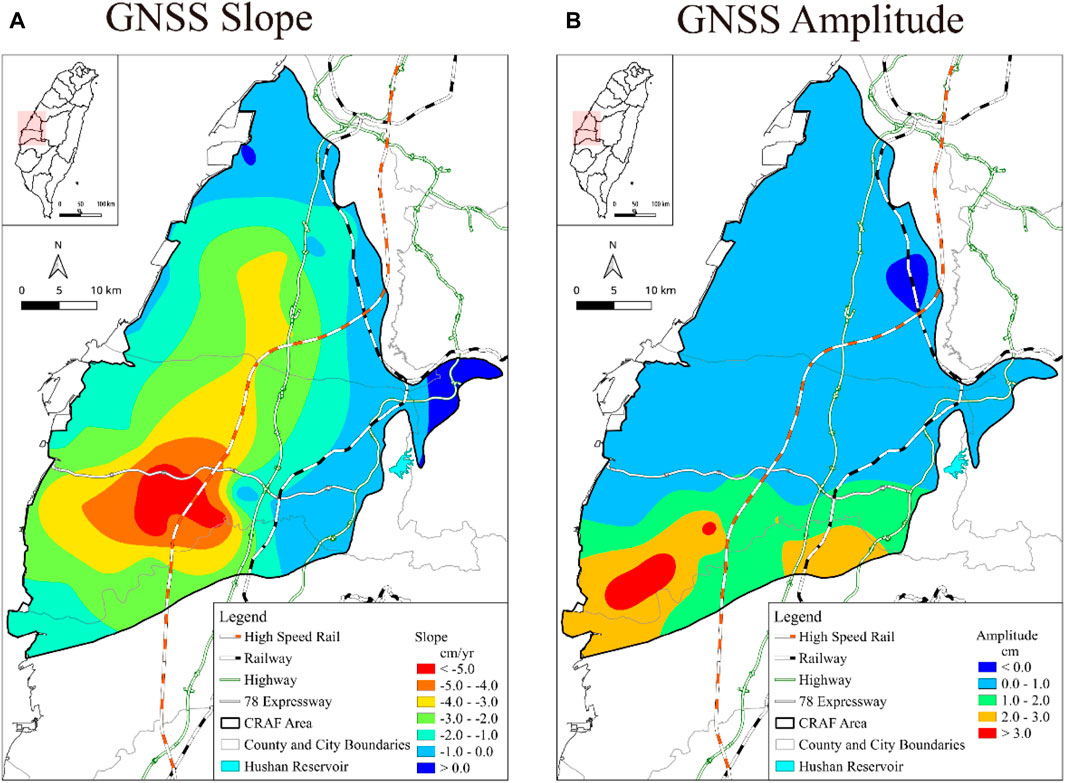
Figure 9. (A) Interpolated rates of vertical displacement and (B) interpolated amplitudes of annual vertical displacement in CRAF.
Figure 9A reveals that the smallest vertical displacements occur at the Proximal Fan and is less than 0.5 cm/year, followed by the fan tail area with subsidence rates ranging from 0.6 to 3.8 cm/year. The highest rates, between 2.1 and 5.2 cm/year, are found in the Middle Fan. The figure indicates that significant subsidence areas in Changhua (with an annual rate of approximately 2.9 cm/year) include Xizhou Township and Xihu Town. In Yunlin, notable subsidence areas are Huwei Town, Tuku Town, Yuanchang Township, Baozhong, Dapi Township, and Sihu Township.
Figure 9B shows that the smallest amplitude of annual change is at the Proximal Fan, which is about 0.2 cm, followed by the central fan area with amplitudes ranging from 0 to 1.4 cm. The highest amplitudes, between 0.1 and 1.9 cm, occur in the Distal Fan. Figure 9B suggests that vertical displacements in the Changhua area are relatively stable, with annual oscillations less than 1.0 cm. In Yunlin, the amplitude of annual vertical displacement gradually increases from north to south, especially south of the 78 Expressway, with the most significant changes in Tuku Township, Dapi Township, Sihu Township, and Kouhu Township, reaching a maximum amplitude of 1.9 cm.
In Figure 9B, the green squares represent the time series at the top of the fan, mustard squares denote the time series at the center of the fan, and purple squares indicate the time series at the tail of the fan. Additionally, the red solid line is used to illustrate the periodic cycle line. This color scheme helps differentiate the various segments and aspects of the data for easier interpretation. The high-speed rail lines are marked with orange and black alternating lines, and the 78 Expressway is represented by a white line. The inverted triangles indicate subsidence rates, with warm colors representing larger subsidence values and cool colors indicating smaller subsidence values. This color coding and symbolism provide a clear and intuitive understanding of the subsidence patterns in the area.
4.3 Horizontal displacements from GNSS
Using the Bernese software as described in Section 4.2, we calculated the three-dimensional displacements at each continuous GNSS station. The time series fitting method was applied to assess the horizontal displacement rates in CRAF, as shown in Figure 10. The average horizontal rate calculated at the continuous GNSS stations is 0.4 cm/year. In Figure 10, the GNSS stations with horizontal displacement rates greater than the average are indicated with red arrows, and those with rates below the average with pink arrows. The background contours in gray represent the cumulative subsidence from 2011 to 2023. Most GNSS stations show a west-northwest movement, with Proximal Fan and Middle Fan moving faster than the average.
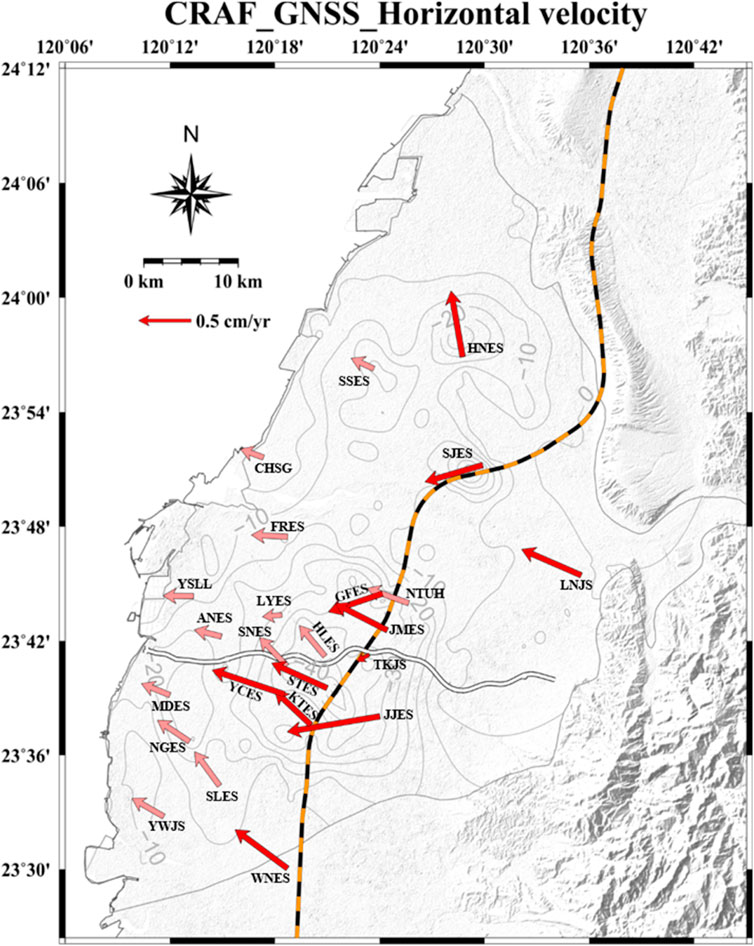
Figure 10. Velocities (rates) of horizontal displacement from GNSS. The arrows represent the horizontal velocity at each GNSS continuous station. The average velocity is 0.4 cm/year. A pink arrow indicates a velocity lower than the average and a red arrow represents a velocity greater than the average. The background contours show the cumulative vertical displacements from 2011 to 2022 (unit: cm).
The observed west-northwest displacement is attributed to tectonic movements resulting from the compression exerted by the Philippine Plate (Yu et al., 1997). This is because Taiwan is situated at the convergent plate boundary between the Eurasian Plate and the Philippine Plate. In the entire Distal Fan area, the rate of horizontal displacement is slower than the average, primarily due to the obstruction posed by the Beigang Highlands, located off the coast of Yunlin, which impedes the movement of the plates. This results in a gradual decrease in the rate of horizontal displacement. However, certain GNSS stations within CRAF exhibit atypical horizontal displacement rates, particularly near major subsidence centers like Tuku and Yuanchang Townships. These horizontal movements might be partially influenced by the subsidence of these centers, causing surface movements that orient towards the centers.
5 Discussion
5.1 Land subsidence in wet and dry seasons
In Taiwan, despite abundant rainfall, its distribution throughout the year is highly uneven. The wet season, from May to October, accounts for 78% of the annual rainfall. In contrast, the dry season lasts for 6 months (Wang et al., 1984). Data from the Central Weather Bureau’s Huwei Meteorological Station in Yunlin County show that most of the region’s rainfall occurs during the rainy and typhoon seasons from May to September, accounting for about 82% of the annual rainfall, with the least rainfall in November and December, less than 4% of the annual total. During the dry season, the groundwater level drops, and the rate of land subsidence increases rapidly. Conversely, in the wet season, the groundwater level rises, and the subsidence rate decreases. This pattern indicates that land subsidence is not a constant process, with more subsidence occurring during the dry season and less during the wet season.
This study distinguishes the dry season and wet season based on the rainy season in Taiwan. We define November to April as the dry season and May to October as the wet season. GNSS data analysis from 2017 to 2022 reveals the subsidence changes in CRAF during these periods, as illustrated in Figure 11. Our data consistently show greater subsidence during the dry seasons, particularly in 2018 and 2021, confirming the observed trends. This seasonal behavior mirrors findings in other coastal regions globally, where land subsidence is significantly influenced by both aquifer system characteristics and groundwater management practices. For instance, similar seasonal displacement trends have been observed in the Po Delta in Italy (Teatini et al., 2011), the Mississippi Delta in the United States (Törnqvist et al., 2008), and even in urban settings like New Orleans (van Asselen et al., 2024). These regions, much like CRAF, are characterized by their unconsolidated late Holocene sediments, which play a critical role in the dynamics of land subsidence.
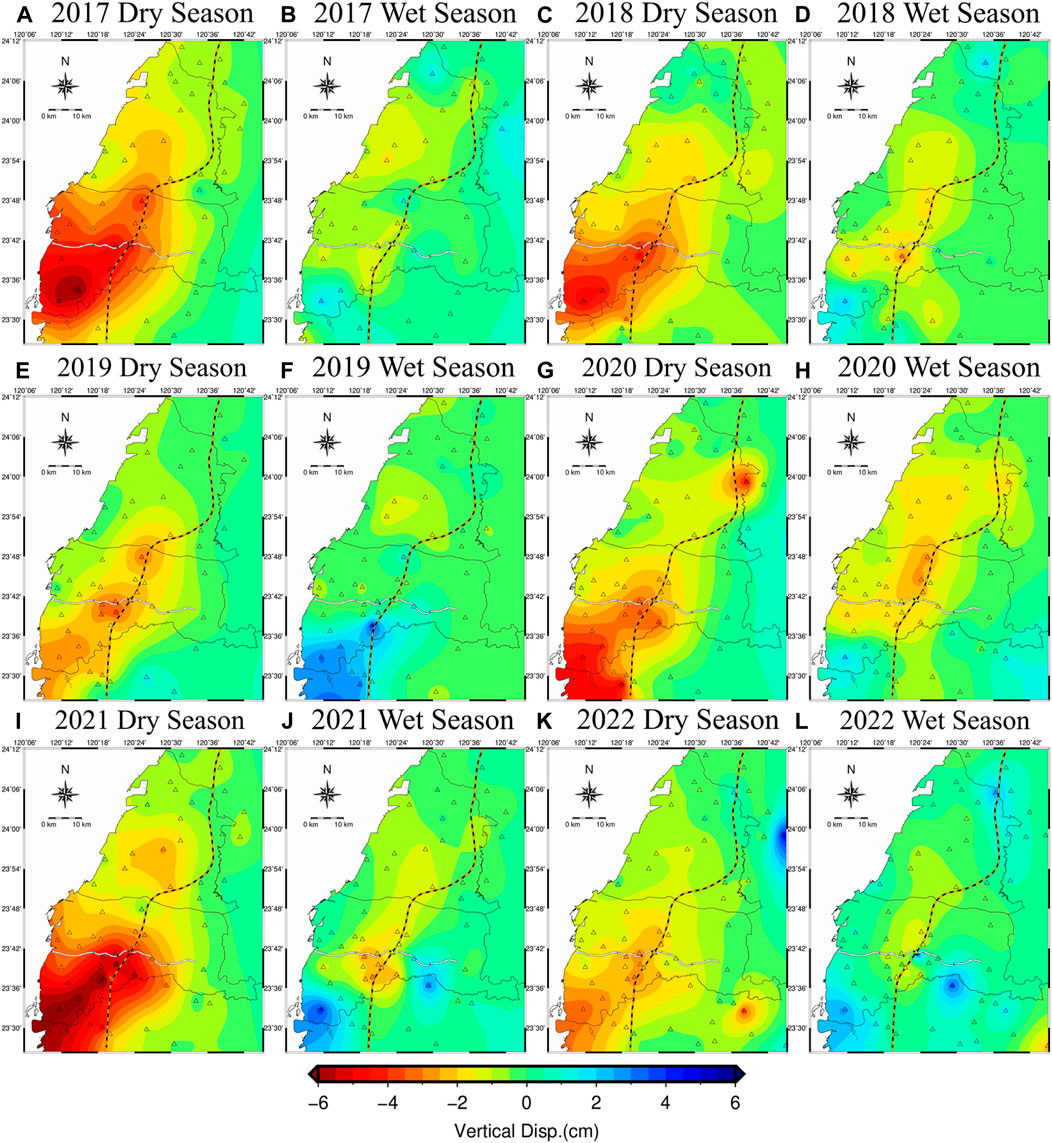
Figure 11. (A–L) Vertical displacements in dry and wet seasons over 2017–2022.
The time-series analytical results underscore that annual amplitudes of land subsidence are larger in the Distal Fan of CRAF compared to other areas, suggesting that the magnitude of seasonal displacement is closely tied to differences in aquifer system composition and groundwater usage conditions. Understanding the relationship between subsurface composition and land subsidence is crucial, as it helps to discern the recoverable components from the overarching trends of long-term subsidence (see the discussion for Eq. (1)). This knowledge is essential for implementing effective measures to mitigate the impacts of land subsidence, particularly in coastal and alluvial regions facing similar challenges.
By integrating these insights, we not only deepen our understanding of the mechanisms driving seasonal variations in land subsidence but also enhance our ability to predict and manage its long-term consequences. This approach is vital for sustaining environmental stability and supporting regional development strategies under varying hydrological conditions.
5.2 Relationship between land subsidence and groundwater level
Vertical displacements obtained from GNSS at HLES from Jan 2017 to December 2022, along with groundwater level changes are compared in Figure 12A and corresponding rainfall in Figure 12B. As land subsidence is strictly linked to groundwater level, which also depends on the aquifer recharge capability from precipitations, rainfalls and the groundwater levels were analyzed together with the ground movements. Groundwater level data were collected from Hunglun Station, at depths of 36 m and 225 m, situated on the same campus as HLES, and from Fangcao Station, at a depth of 130 m, located in proximity to the HLES stations.
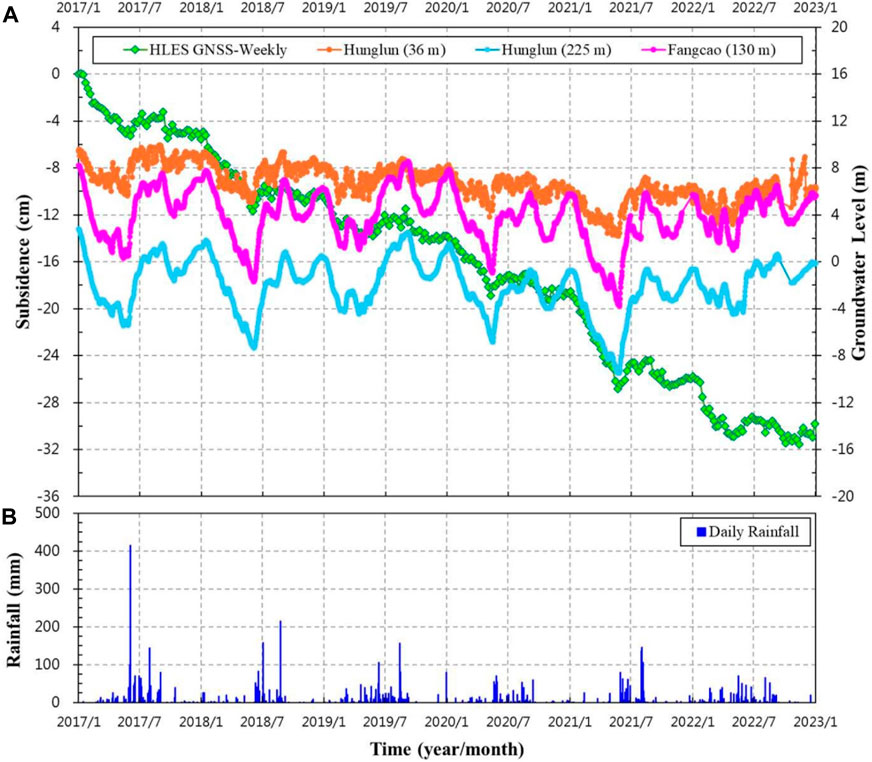
Figure 12. (A) GNSS vertical displacements (HLES) and groundwater level data from Hunglun (36 m), Hunglun (225 m) and Fangcao (130 m). (B) The rainfall record near the HLES GNSS station; see Figure 4 and Figure 5 for the locations of Hunglun and Fangcao.
In Figure 13A, we use data from the HLES GNSS continuous station (refer to Figure 5 for its location) to analyze the time series of subsidence each year, starting from the first day of the year. This analysis helps quickly identify subsidence characteristics in each area. According to Figure 13B, the primary subsidence period is from January to May (the first rice cultivation season), with a rebound observed from June to August (Taiwan’s rainy and typhoon season), followed by continual subsidence in September to October (second rice cultivation season), and no significant subsidence in November to December. In Figure 13B, we analyze the groundwater level data from the Fangcao monitoring well, located in Aquifer 2 (refer to Figure 4 for location). The graph shows that groundwater levels gradually decrease from January to May, then start rising towards the end of August. The levels drop again from September to November, and gradually rise in November to December. These patterns indicate that subsidence behavior is generally consistent each year from January to April. However, during drought years, such as the severe drought in 2021, more pronounced plastic deformation occurs due to greater drops in groundwater levels, leading to more severe subsidence.
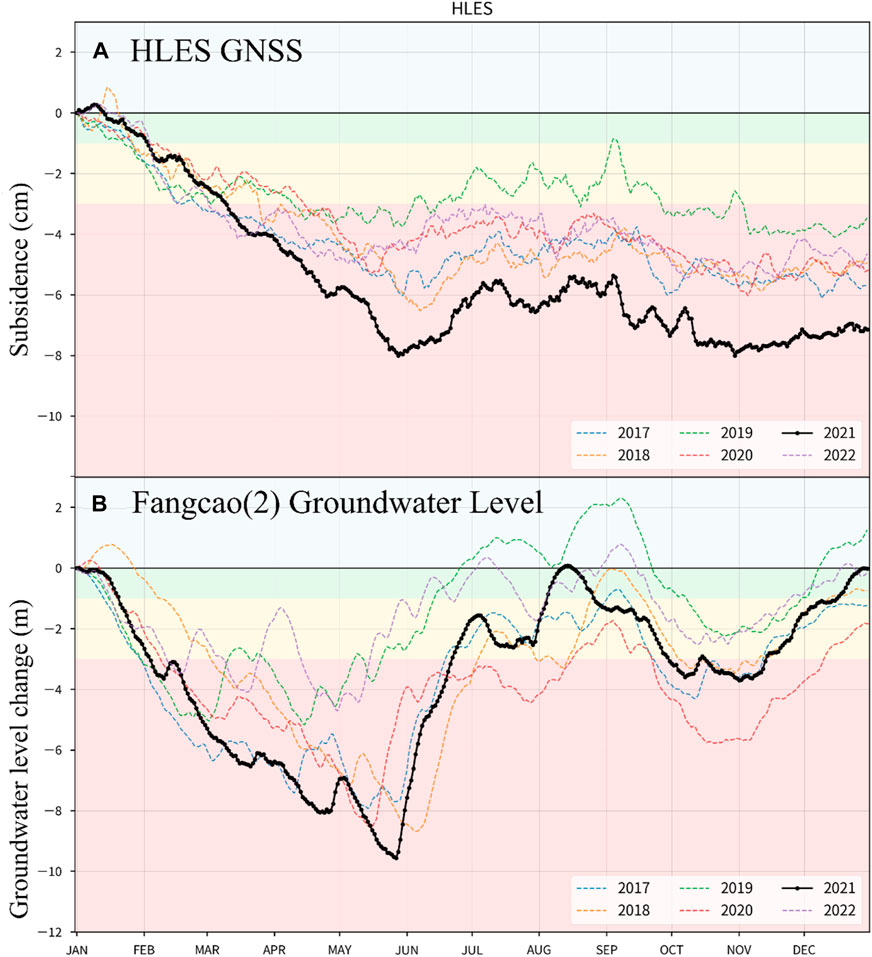
Figure 13. (A) Vertical displacements at HLES GNSS station and (B) groundwater level changes at Fangcao (no.2) groundwater station.
5.3 Stress and strain analysis at continuous GNSS stations
Based on the works by Terzaghi (1925), the effective stress
where
where
where
Given that GNSS measurements span from the surface to the bedrock, we employ the deformation data captured by the HLES GNSS as an indicator of strain. Similarly, the variations in groundwater level (GWL) recorded at Fangchao Station are considered as changes in hydraulic head (Δh). This approach enables us to show the stress-strain relationship and to detect how deformations correlate with variations in hydrological conditions.
Figure 14 correlates subsidence at GNSS continuous stations (strain) with groundwater level declines from Figure 13 (stress), using average monthly values to illustrate the stress-strain relationship. Figure 13 indicates that from January to May, subsidence increases concurrently with decreasing water levels, peaking in May. Conversely, from June to August, as groundwater levels recover, subsidence ceases. Between September and October, despite a decline in groundwater levels, subsidence remains minimal. This is attributed to the relatively minor decrease in water levels and the maintenance of relatively high groundwater levels, suggesting that the ground stays within its elastic deformation range. The graph implies that maintaining groundwater levels above a certain threshold prevents significant subsidence. When levels fall below this threshold, notable plastic deformation occurs, as particularly evidenced in 2021. This trend reveals that surface subsidence halts and partially rebounds when groundwater levels reach their lowest point, highlighting the critical role of groundwater management in controlling subsidence.
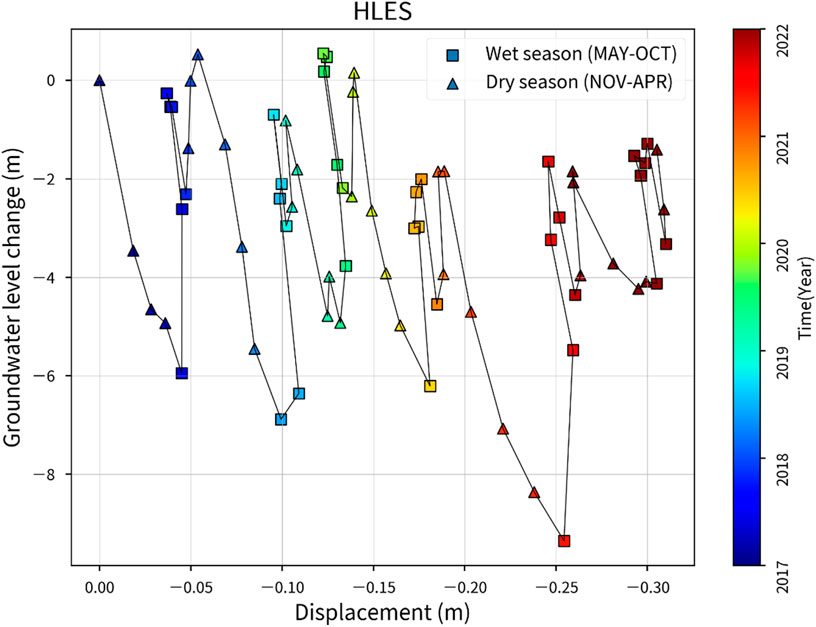
Figure 14. Relationship between stress (groundwater level change) and strain (vertical displacement) at HLES GNSS station. The squares and triangles represent the wet seasons (from May to October) and the dry season (January to April of the following year), respectively.
5.4 General implications
The dynamics of groundwater depletion and resultant land subsidence observed in Taiwan’s CRAF region in this paper provide critical insights into similar challenges faced globally. Regions like the Central Valley in California, USA, and the Po Valley in Italy have also experienced significant land subsidence due to extensive groundwater extraction for agricultural and industrial use. In the Central Valley, subsidence has historically reached rates as high as 28 cm/year, particularly during drought periods when groundwater use peaks (Sneed et al., 2013). Similarly, in the Po Valley, subsidence due to natural compaction and anthropogenic factors has significantly altered the landscape over decades (Teatini et al., 2005). Additional examples include Jakarta, Indonesia, where rapid urbanization and heavy reliance on groundwater have led to some of the fastest rates of land subsidence in the world, with certain areas sinking by as much as 10 cm per year (Abidin et al., 2011). In Beijing, China, excessive groundwater extraction has caused significant subsidence, impacting urban infrastructure and economic costs (Chen et al., 2020). Mexico City, Mexico, represents another profound case where subsidence rates reached −39 cm/year in 2014–2020 (Cigna and Tapete, 2021). Bangkok, Thailand, has also encountered serious land subsidence issues primarily driven by groundwater extraction for industrial purposes (Bremard, 2022).
The comparative analysis of these regions with CRAF reveals common drivers—intensive agricultural practices and the reliance on groundwater. However, the mitigation strategies employed vary. For example, in California, the Sustainable Groundwater Management Act (SGMA) was implemented to curb groundwater depletion by requiring groundwater sustainability plans from high- and medium-priority basins (California Department of Water Resources; https://water.ca.gov). This legislative approach contrasts with Taiwan’s technological and monitoring-focused strategies, emphasizing the integration of GNSS data analysis with hydrogeological assessments to manage and forecast subsidence risks.
Furthermore, the role of climate variability adds another layer of complexity to subsidence management. Unlike regions that can implement more straightforward water rationing during droughts, areas with irregular rainfall patterns, such as CRAF, must adopt more dynamic and responsive management strategies. This adaptability is crucial in light of changing global climate patterns, which are expected to exacerbate the frequency and intensity of droughts and flooding, further stressing water resources.
The lessons learned from CRAF and comparable global cases underscore the importance of integrated water resource management strategies that balance ecological sustainability with the needs of agricultural and urban development. These strategies should not only focus on immediate responses to water scarcity but also on long-term sustainability to prevent irreversible environmental impacts. Thus, this study broadens the scope of understanding subsidence not only as a localized geological phenomenon but as a global issue that requires comprehensive and adaptive management solutions to safeguard both the environment and human populations.
6 Conclusion
This study uses time-series analysis derived from GNSS data in conjunction with hydrogeological profiles within the Choushui River Alluvial Fan (CRAF) region. The findings indicate that the Yunlin area, particularly south of the 78 Expressway in the Middle Fan, consists of highly compressible materials like fine sand, mud, and clay. This composition contributes to more rapid compaction in inland areas. By integrating data from 223 groundwater observation stations and 50 continuous GNSS stations collected over a decade, the study conducted a time series analysis to identify annual amplitudes and long-term subsidence trends. This methodology provides insights into the patterns of land subsidence and its correlation with groundwater level fluctuations.
The hydrogeological data pinpointed significant compressibility in the Yunlin region south of the 78 Expressway, primarily due to the prevalence of easily compressible sediments. A velocity and amplitude analysis across four aquifers revealed that subsidence is primarily occurring in the first and second aquifers, especially south of the 78 Expressway and north of Puzi Creek.
Our vertical deformation analysis via GNSS data identified the primary areas of subsidence in the Middle Fan, with subsequent subsidence in the Distal Fan. Interestingly, the Proximal Fan exhibited negligible subsidence. Certain locales, such as Tuku and Yuanchang Townships in Yunlin, experienced notable subsidence rates ranging from 4.2 to 5.2 cm/year.
The analysis of GNSS and groundwater data from the CRAF reveals that the amplitude of land subsidence is markedly higher in the Distal Fan than in other areas, indicating that the physical characteristics of the aquifer system and the patterns of groundwater use are critical determinants of subsidence rates. The seasonal dynamics of subsidence, with more pronounced displacement during dry periods and a moderation during wet seasons, underscore the influence of groundwater levels on subsidence behavior. This observation is consistent with global patterns observed in similar multiple-aquifer settings such as the Po Delta in Italy and the Mississippi Delta in the United States, where the composition of unconsolidated sediments significantly impacts subsidence rates. The findings highlight the necessity of distinguishing between recoverable subsidence and irreversible long-term trends (see Eq. 1; Section 5.1). This distinction is crucial for developing effective groundwater management and land use policies that address both the immediate impacts of seasonal water extraction and the long-term sustainability of the aquifer systems. Effective management strategies must therefore not only respond to immediate hydrological challenges but also anticipate and mitigate the broader geological impacts of land subsidence, ensuring the resilience of both natural and human systems in face of changing climatic and environmental conditions.
Data availability statement
The original contributions presented in the study are included in the article/Supplementary Material, further inquiries can be directed to the corresponding author.
Author contributions
W-CH: Conceptualization, Data curation, Formal Analysis, Funding acquisition, Investigation, Methodology, Project administration, Resources, Software, Supervision, Validation, Visualization, Writing–original draft, Writing–review and editing. CH: Conceptualization, Data curation, Formal Analysis, Funding acquisition, Investigation, Methodology, Project administration, Resources, Software, Supervision, Validation, Visualization, Writing–original draft, Writing–review and editing. S-HL: Conceptualization, Data curation, Formal Analysis, Software, Writing–review and editing. C-SW: Conceptualization, Software, Writing–original draft. P-JT: Data curation, Software, Writing–review and editing. K-CL: Data curation, Formal Analysis, Investigation, Methodology, Software, Writing–original draft. Y-AC: Data curation, Investigation, Project administration, Software, Writing–original draft.
Funding
The author(s) declare financial support was received for the research, authorship, and/or publication of this article. This study is supported by National Science and Technology Council, Taiwan, under grant 112-2221-E-A49–025 -MY3.
Acknowledgments
We thank Water Resources Agency, Taiwan, for the data support.
Conflict of interest
Authors W-CH, S-HL, C-SW, Y-AC, K-CL were employed by Green Environmental Engineering Consulting Co. LTD.
The remaining authors declare that the research was conducted in the absence of any commercial or financial relationships that could be construed as a potential conflict of interest.
Publisher’s note
All claims expressed in this article are solely those of the authors and do not necessarily represent those of their affiliated organizations, or those of the publisher, the editors and the reviewers. Any product that may be evaluated in this article, or claim that may be made by its manufacturer, is not guaranteed or endorsed by the publisher.
References
Abidin, H. Z., Andreas, H., Gumilar, I., Fukuda, Y., Pohan, Y. E., and Deguchi, T. (2011). Land subsidence of Jakarta (Indonesia) and its relation with urban development. Nat. hazards 59, 1753–1771. doi:10.1007/s11069-011-9866-9
Abidin, H. Z., Djaja, R., Darmawan, D., Akbar, A., Rajiyowiryono, H., Sudibyo, Y., et al. (2001). Land subsidence and its geodetic system in Jakarta, Indonesia. Nat. Disasters 23, 365–387. doi:10.1023/a:1011144602064
Bremard, T. (2022). Monitoring land subsidence: the challenges of producing knowledge and groundwater management indicators in the Bangkok metropolitan region, Thailand. Sustainability 14 (17), 10593. doi:10.3390/su141710593
Burbey, T. J. (2003). Use of time–subsidence data during pumping to characterize specific storage and hydraulic conductivity of semi-confining units. J. Hydrology 281 (1-2), 3–22. doi:10.1016/S0022-1694(03)00197-5
Burbey, T. J. (2020). Extensometer forensics: what can the data really tell us? Hydrol. J. 28, 637–655. doi:10.1007/s10040-019-02060-6
Burbey, T. J., Warner, S. M., Blewitt, G., Bell, J. W., and Hill, E. (2006). Three-dimensional deformation and strain induced by municipal pumping, part 1: analysis of field data. J. Hydrology 319 (1–4), 123–142. doi:10.1016/j.jhydrol.2005.06.028
Central Geological Survey (1999). The investigation of hydrogeology in the Choushui River alluvial fan, Taiwan. MOEA, Taiwan: Taipei City: Central Geological Survey. (in Chinese).
Central Geological Survey (2002). General report on hydrogeological survey and research of Choushui River alluvial fan. MOEA, Taiwan: Taipei City: Central Geological Survey. (in Chinese).
Chen, B., Gong, H., Chen, Y., Li, X., Zhou, C., Lei, K., et al. (2020). Land subsidence and its relation with groundwater aquifers in Beijing Plain of China. Sci. Total Environ. 735, 139111. doi:10.1016/j.scitotenv.2020.139111
Cigna, F., and Tapete, D. (2021). Present-day land subsidence rates, surface faulting hazard and risk in Mexico City with 2014–2020 Sentinel-1 IW InSAR. Remote Sens. Environ. 253, 112161. doi:10.1016/j.rse.2020.112161
Dach, R., Arnold, D., Baumann, C., Bertone, S., Bock, H., Jean, Y., et al. (2015). Bernese GNSS software.
Figueroa-Miranda, S., Tuxpan-Vargas, J., Ramos-Leal, J. A., Hernández-Madrigal, V. M., and Villaseñor-Reyes, C. I. (2018). Land subsidence by groundwater over-exploitation from aquifers in tectonic valleys of Central Mexico: a review. Geol. Eng. 246, 91–106. doi:10.1016/j.enggeo.2018.09.023
Gili, J. A., Corominas, J., and Rius, J. (2000). Using global positioning system techniques in landslide monitoring. Eng. Geol. 55 (3), 167–192. doi:10.1016/s0013-7952(99)00127-1
Herrera-García, G., Ezquerro, P., Tomás, R., Béjar-Pizarro, M., López-Vinielles, J., Rossi, M., et al. (2021). Mapping the global threat of land subsidence. Science 371, 34–36. doi:10.1126/science.abb8549
Hung, W. C., Hwang, C., Chang, C. P., Yen, J. Y., Liu, C. H., and Yang, W. H. (2010). Monitoring severe aquifer-system compaction and land subsidence in Taiwan using multiple sensors: Yunlin, the southern Choushui River Alluvial Fan. Environ. Earth Sci. 59, 1535–1548. doi:10.1007/s12665-009-0139-9
Hung, W. C., Hwang, C., Chen, Y. A., Chang, C. P., Yen, J. Y., Hooper, A., et al. (2011). Surface deformation from persistent scatterers SAR interferometry and fusion with leveling data: a case study over the Choushui River Alluvial Fan, Taiwan. Remote Sens. Environ. 115 (4), 957–967. doi:10.1016/j.rse.2010.11.007
Hung, W. C., Hwang, C., Liou, J. C., Lin, Y. S., and Yang, H. L. (2012). Modeling aquifer-system compaction and predicting land subsidence in central Taiwan. Eng. Geol. 147, 78–90. doi:10.1016/j.enggeo.2012.07.018
Hung, W. C., Hwang, C., Sneed, M., Chen, Y. A., Chu, C. H., and Lin, S. H. (2021). Measuring and interpreting multilayer aquifer-system compactions for a sustainable groundwater-system development. Water Resour. Res. 57 (4), e2020WR028194. doi:10.1029/2020WR028194
Hung, W. C., Hwang, C., Tosi, L., Lin, S. H., Tsai, P. C., Chen, Y. A., et al. (2023). Toward sustainable inland aquaculture: coastal subsidence monitoring in Taiwan. Remote Sens. Appl. Soc. Environ. 30, 100930. doi:10.1016/j.rsase.2023.100930
Lau, L., Tateshita, H., and Sato, K. (2015). Impact of multi-GNSS on positioning accuracy and multipath errors in high-precision single-epoch solutions – a case study in ningbo China. J. Navigation 68 (5), 999–1017. doi:10.1017/S0373463315000168
Liu, C. H., Pan, Y. W., Liao, J. J., and Hung, W. C. (2004). Estimating coefficients of volume compressibility from compression of strata and piezometric changes in a multiaquifer system in west Taiwan. Eng. Geol. 75 (1), 33–47. doi:10.1016/j.enggeo.2004.04.007
Motagh, M., Djamour, Y., Walter, T. R., Wetzel, H. U., Zschau, J., and Arabi, S. (2007). Land subsidence in Mashhad Valley, northeast Iran: results from InSAR, levelling and GPS. Geophys. J. Int. 168 (2), 518–526. doi:10.1111/j.1365-246x.2006.03246.x
Nikolaidis, R. (2002). Observation of geodetic and seismic deformation with the global positioning system. San Diego: University of California. Ph.D. Dissertation.
Odolinski, R., Teunissen, P. J. G., and Zhang, B. (2020). Multi-GNSS processing, positioning and applications. J. Spatial Sci. 65 (1), 3–5. doi:10.1080/14498596.2020.1687170
Rau, R. J., Ching, K. E., Hu, J. C., and Lee, J. C. (2008). Crustal deformation and block kinematics in transition from collision to subduction: global positioning system measurements in northern Taiwan, 1995–2005. J. Geophys. Res. Solid Earth 113 (B9). doi:10.1029/2007jb005414
Sneed, M., Brandt, J., and Solt, M. (2013). Land subsidence along the delta-mendota canal in the northern part of the san joaquin valley. California: U.S. Geological Survey Scientific Investigations Report. 2013-5142.
Taylor, R. G., Scanlon, B., Döll, P., Rodell, M., Van Beek, R., Wada, Y., et al. (2013). Ground water and climate change. Nat. Clim. change 3 (4), 322–329. doi:10.1038/nclimate1744
Teatini, P., Ferronato, M., Gambolati, G., Bertoni, W., and Gonella, M. (2005). A century of land subsidence in Ravenna, Italy. Environ. Geol. 47, 831–846. doi:10.1007/s00254-004-1215-9
Teatini, P., Tosi, L., and Strozzi, T. (2011). Quantitative evidence that compaction of Holocene sediments drives the present land subsidence of the Po Delta, Italy. J. Geophys. Res. solid Earth 116 (B8), B08407. doi:10.1029/2010jb008122
Törnqvist, T. E., Wallace, D. J., Storms, J. E., Wallinga, J., Van Dam, R. L., Blaauw, M., et al. (2008). Mississippi Delta subsidence primarily caused by compaction of Holocene strata. Nat. Geosci. 1 (3), 173–176. doi:10.1038/ngeo129
van Asselen, S., Erkens, G., Keogh, M. E., and Stuurman, R. (2024). Shallow-subsidence vulnerability in the city of New Orleans, southern USA. Hydrogeology J. 32, 867–889. doi:10.1007/s10040-023-02762-y
Wang, S. J., Nguyen, Q. C., Lu, Y. C., Doyoro, Y. G., and Tran, D. H. (2022). Evaluation of geological model uncertainty caused by data sufficiency using groundwater flow and land subsidence modeling as example. Bull. Eng. Geol. Environ. 81 (8), 331. doi:10.1007/s10064-022-02832-7
Wang, S. T., Cheng, H., and Chao, Y. K. (1984). Natural seasons of the weather in the Taiwan area. Atmos. Sci. 11, 101–120.
Water Conservancy Agency (2022). Taipei city: water resources agency, MOEA, taiwan. (in Chinese).Groundwater observation network operation and groundwater protection plan in 2022.
Water Resources Agency (2017). The essential report of “groundwater monitoring network plan. Taiwan: Taipei City: Water Resources Agency, MOEA, Taiwan. (in Chinese).
Yang, Y. J., Hwang, C., Hung, W. C., Fuhrmann, T., Chen, Y. A., and Wei, S. H. (2019). Surface deformation from Sentinel-1A InSAR: relation to seasonal groundwater extraction and rainfall in Central Taiwan. Remote Sens. 11 (23), 2817. doi:10.3390/rs11232817
Keywords: Choushui river alluvial fan (CRAF), land subsidence, global navigation satellite system (GNSS), groundwater, time series analysis
Citation: Hung W-C, Hwang C, Lin S-H, Wang C-S, Chen Y-A, Tsai P-C and Lin K-C (2024) Exploring groundwater depletion and land subsidence dynamics in Taiwan’s Choushui river alluvial fan: insights from integrated GNSS and hydrogeological data analysis. Front. Earth Sci. 12:1370626. doi: 10.3389/feart.2024.1370626
Received: 15 January 2024; Accepted: 03 May 2024;
Published: 11 June 2024.
Edited by:
Luigi Tosi, Institute of Geosciences and Earth Resources (IGG) - National Research Council (CNR), ItalyReviewed by:
Artur Guzy, AGH University of Science and Technology, PolandMarta Cosma, Institute of Geosciences and Earth Resources (IGG) - National Research Council (CNR), Italy
Copyright © 2024 Hung, Hwang, Lin, Wang, Chen, Tsai and Lin. This is an open-access article distributed under the terms of the Creative Commons Attribution License (CC BY). The use, distribution or reproduction in other forums is permitted, provided the original author(s) and the copyright owner(s) are credited and that the original publication in this journal is cited, in accordance with accepted academic practice. No use, distribution or reproduction is permitted which does not comply with these terms.
*Correspondence: Cheinway Hwang, Y2hlaW53YXlAbnljdS5lZHUudHc=