
94% of researchers rate our articles as excellent or good
Learn more about the work of our research integrity team to safeguard the quality of each article we publish.
Find out more
ORIGINAL RESEARCH article
Front. Earth Sci. , 14 June 2024
Sec. Quaternary Science, Geomorphology and Paleoenvironment
Volume 12 - 2024 | https://doi.org/10.3389/feart.2024.1354686
This article is part of the Research Topic How Does the Architecture of Holocene Deposits Affect Land Subsidence and Saltwater Intrusion in Coastal Areas? View all 3 articles
 Michael S. Steckler1*
 Md. Hasnat Jaman2,3
 Céline Jo Grall1,4
 Steven L. Goodbred5
 Carol A. Wilson6
 Bar Oryan7
Coastal regions are vulnerable to rising seas, increasing storm magnitude, and decimation of ecologically-fragile areas. Deltas are particularly sensitive to the balance between sea-level rise, land subsidence and sedimentation that determine relative elevation. Bangladesh has been highlighted as being at risk from sea-level rise. Integrating measurements from different methods can approach a more complete understanding of factors controlling areally and temporally varying subsidence rates. To augment our compilation of rates from stratigraphic wells, historic buildings, vertical strainmeters, RSET-MH, and continuous Global Navigation Satellite System, we resurveyed 48 geodetic monuments in coastal Bangladesh ∼18 years after the monuments were installed. A later resurvey of 4 sites showed that some sites with higher subsidence may be unstable, but we consider the subsidence pattern of all the sites. Sites with rates <2 mm/yr overlie thin (≤35 m), sandy Holocene deposits located along interfluves between the main paleo-river valleys. As Holocene strata thicken seaward and become muddier, subsidence rates increase to 20–25 mm/y. Sites in incised valleys of the Ganges, Brahmaputra and Meghna Rivers, with Holocene sediments >100 m show subsidence rates of 20 ± 10 mm/y, with a slight seaward increase. Overall, subsidence rates increase with Holocene sediment thickness and the seaward shift from sandy to muddy sediments. Together with earlier measurements, we parse the different rates and mechanisms of subsidence. Earlier models show 2–3 mm/yr correspond to deep processes, such as isostasy. Within the shallow Holocene (<10 m), we estimate 5–8 mm/yr of subsidence from shallow, edaphic effects (tree roots, burrows, organic matter decomposition) and shallow (≤10 m) sediment consolidation on short timescales. Below this, we estimate 3–6 mm/yr from compaction of the upper Holocene strata, with 2–5 mm/yr occurring in deeper Holocene strata. Subsidence rates in areas of active sedimentation, such as rice fields and mangrove forests, are greater than buildings and structures with deep foundations. Subsidence on timescales >300 y, which do not include edaphic effects, are up to ∼5 mm/y. We note subsidence can be offset by active deltaic sedimentation, and does not necessarily indicate elevation loss. Collectively, the integration of these approaches allows us to begin quantifying the varied contributions to land subsidence from edaphic effects, Holocene sediment compaction, lithology, and time. Similar factors may contribute to the highly variable subsidence rates observed at other deltas worldwide.
Coastal regions worldwide face an ever-increasing sustainability issue as millions continue to migrate or retreat to these vulnerable regions susceptible to rising seas, storm impacts, and decimation of ecologically fragile areas. Deltas, the low-lying land at river mouths, are particularly sensitive to the dynamic physical forcings and delicate balance between sea-level rise, land subsidence and sedimentation–the major parameters governing delta fate and maintaining relative land-surface elevation at the coast (Milliman et al., 1989; Syvitski et al., 2005; Blum and Roberts, 2009; Giosan et al., 2014). However, each of these factors represents an aggregate of multiple, spatiotemporally variable processes that are not often disaggregated into their relevant components—rather, values for sea-level change, subsidence, and sedimentation are typically taken as mean rates of vertical change (units of mm/yr) and applied across entire delta systems, even where significant variations are well recognized (Passalacqua et al., 2021).
Despite their importance in understanding deltaic and coastal system dynamics, mean subsidence rates are most often used, or even maximum rates sometimes (e.g., Ericson et al., 2006; Syvitski et al., 2009; Ostanciaux et al., 2012; Tessler et al., 2015; 2018). This is because the field observations needed to differentiate spatial variations or to disaggregate individual components are difficult to make and have rarely been collected. This data gap represents a major problem for coastal risk assessment, because synoptic to decadal-scale observations for all three of these factors often yield rates that are 2–10x higher than the century to millennial-scale averages most commonly used to predict delta sustainability in the long term (Shirzaei et al., 2021). Furthermore, there is complex feedback whereby the sedimentation needed to offset elevation loss from subsidence also induces higher subsidence rates from compaction and isostatic loading. Thus, subsidence rates are often highest where deltas are receiving the sediments needed to counter it. Given the spatial variability of sediment deposition along deltaic channel networks (e.g., Passalacqua et al., 2013), this means the most rapid and spatially variable factors controlling land elevation are not typically considered in delta morphodynamics and risk assessment models.
In addition, the processes that contribute to subsidence act over different depth ranges. While glacial isostatic adjustment to water and sediment loading impact the entire sediment column, compaction is greatest near the surface and decreases with depth (e.g., Athy, 1930; Terzaghi and Peck, 1967; Sclater and Christie, 1980; Gluyas and Cade, 1997; Kooi and DeVries, 1998; Bahr et al., 2001; Sheldon and Retallack, 2001; Kominz et al., 2011). A substantial portion of high subsidence rates is often due to very shallow sediment compaction and edaphic/ecological factors. For example, Cahoon et al. (1995) examined four sites in the U.S. and found that shallow subsidence in the upper 3–5 m varied from 2 to 25 mm/yr with the highest rates in the Mississippi Delta. Their observed subsidence rates correlated closely with the sedimentation rates suggesting that sedimentation was driving shallow compaction. Jankowski et al. (2017) examined 274 sites in the Mississippi Delta and concluded that at least 60% of the total subsidence occurred in the upper 5–10 m, and at least 35% of sites exhibited vertical accretion deficits compared to Relative Sea Level Rise (RSLR = eustatic SLR + subsidence), the combination of subsidence and sea level rise. Saintilan et al. (2022) examined sites around the world and found that shallow subsidence increased with sedimentation. There is also the well-known Sadler effect (Sadler, 1981) in which sedimentation rates decrease with increasing timescale, as can be seen in subsidence rates measured in the Ganges-Brahmaputra Delta (Brown and Nicholls, 2015).
The variance of subsidence rates and their components occurs in four dimensions across areal, depth, and temporal scales, and each type of measurement provides an estimate relative to a different datum (DeWit et al., 2021; Steckler et al., 2022). Thus, measurements of land subsidence are like the fable of the blind men examining an elephant, each system measures part of the story. However, by combining multiple measurements, we can approach a more complete understanding of what is happening. Knowing the current balance of sediment deposition, sediment compaction, tectonic land movement, and isostatic loading is critical for understanding elevation and sediment dynamics in deltas around the world (Tornqvist and Blum, 2024). Here, we focus on the Ganges-Brahmaputra Delta (GBD) and the prospect for near-future land loss and salinization in this megadelta that is home to >200 million people. In this study, we add to a previous synthesis of subsidence measurement in the GBD by Steckler et al. (2022) by adding new results from a campaign GNSS survey of geodetic monuments in coastal Bangladesh. Integrating measurements from different methods (e.g., stratigraphic wells, historic sites, vertical strain meters, RSET-MH [Rod Surface Elevation Tables and Marker Horizons], continuous GNSS and campaign GNSS) allows us to approach a more complete understanding of the factors controlling the spatially and temporally varying rates of subsidence in this delta.
The GBD, the largest delta in the world, is formed by two of the world’s major rivers that carry the largest sediment load on Earth (∼109 tons yr−1; Figure 1). This delta has been building into the Bengal basin since the start of the Himalayan collision in the Eocene. It has accumulated 15–20 km of sediment (Singh et al., 2016; Mitra et al., 2018) and prograded the shelf edge 300–400 km seaward from the Hinge Zone, which marks the edge of the Indian Craton (Figure 1). On its northern and eastern flanks, the GBD is being overthrust by the Shillong Massif, the beginning of a forward jump of the Himalayas (Vernant et al., 2014; Mallick et al., 2020), and the IndoBurma subduction zone (IBSZ), the northward continuation of the Sumatra-Andaman subduction zone (Steckler et al., 2008). In the IBSZ accretionary prism, deformation transitions from fault propagation folds marked by prominent anticlines to gentle detachment folds that are buried by the deltaic sediments. The deformation front (Figure 1) marks the outer edge of GBD strata that are deformed by the subduction zone.
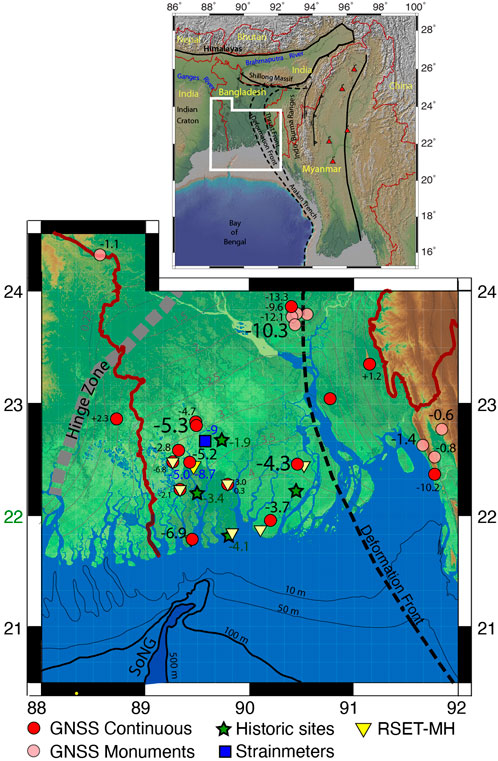
Figure 1. Top. Regional tectonic map showing the location of the area of study (white box). Major tectonic boundaries and fault are black lines, dashed where blind. Country boundaries are maroon. Red triangles are volcanos. Bottom. Close up of coastal GBD showing subsidence rates in mm/yr west of the deformation front (dashed line). Contours of Holocene subsidence rates (Grall et al., 2018) are given by thin gray lines. Text size for GNSS stations (red circles) is proportional to the √(time series length) to represent the reliability of the values. Rates for RSET sites (yellow triangles) are only provided for Polder 32 (brighter yellow), where the time series is sufficiently long. The two rates correspond to the values for inside and outside the embankment (Akter et al., 2024). The optical fiber compaction meter is located by the blue square. Historic sites values (green stars) are similar to Holocene average rates (Grall et al., 2018). GNSS rates are similar to slightly higher, especially farther west. Figure and values updated from Steckler et al. (2022). The thick gray line marks the Hinge Zone, the edge of the Indian Craton. Offshore bathymetric contours show the location of the Swatch of No Ground (SoNG) canyon.
During the Pleistocene lowstand, the shoreline regressed to near the current shelf edge at ∼20°N (Palamenghi, 2012). The rivers and glacial outburst floods carved deep (>90 m) paleovalleys into the underlying strata, which fed into the Swatch of No Ground canyon (Pickering et al., 2018). Exposure and weathering of the interfluves created an oxidized clay paleosol (Umitsu, 1993) that is readily identifiable in boreholes and has been mapped by Hoque et al. (2014) and termed the Last Glacial Maximum Paleosol (LGMP).
During the Holocene transgression, these incised valleys in the upper delta infilled with sandy strata (Pickering et al., 2018; Sincavage et al., 2019), when sediment supply was significantly larger than today. In the lower valleys and delta, both muddy and sandy strata rapidly infilled these areas (Raff et al., 2023). Beginning in the mid Holocene and continuing today, the marine delta foresets have been prograding across the midshelf at 20–80 m water depth at rates of 12–15 m/y (Michels et al., 1998; Palmenghi et al., 2011). The resulting Bengal depocenter can be separated into primarily sandy river-dominated fan deposits at its upstream reaches and a predominantly muddy low-lying fluvio-tidal deltaplain with meso-scale tides at its downstream reaches (Wilson and Goodbred, 2015).
In general, it is recognized that thick sedimentary deposits loading the lithospheric plate and compacting underlying deposits enhance the subsidence rate, and these rates are inversely time-dependent, with younger deposits consolidating at greater rates commensurate with their age (e.g., Meckel et al., 2007; Tornqvist et al., 2024; Yuill et al., 2009). Previous work studying subsidence in the GBD found this fundamental temporal control also holds true in the GBD (Brown and Nicholls, 2015; Steckler et al., 2022). The Holocene averaged subsidence rates increase from the Hinge Zone of the early Cretaceous passive margin seaward from 0 to 4.5 mm/yr (Figure 1; Grall et al., 2018). The rates derived from 300 to 600 year old archeological sites are similar to the estimated Holocene rates of 2–4 mm/yr (Figure 1; Sarker et al., 2012; Hanebuth et al., 2013; 2021; Chamberlain et al., 2020; Steckler et al., 2022). In comparison, Global Navigation Satellite System (GNSS) and tide gauge (Becker et al., 2020) subsidence rates from the past 2 decades generally show slightly higher rates than the Holocene averages (4—7 mm/y; Figure 1). Even more recent Rod Surface Elevation Tables coupled with Marker Horizons (RSET-MH) and vertical strainmeters show much higher rates of 6–11 mm/yr (Figure 1, blue text). These instruments, in sites of active sedimentation, include a new spatial component: shallow subsidence that is not recorded by river gauges and GNSS. However, it should be noted that GNSS records deep subsidence, which is not measured by RSETs or strainmeters. Regardless, results collected to present indicate that the amount of ongoing shallow sediment compaction in the GBD is considerable.
Recent InSAR analyses (Higgins et al., 2014; Woods et al., in prep.) suggest that average rates of surface subsidence range from 5 to 10 mm/yr over large areas of the GBD and reach 18 mm/yr in areas of recent channel infilling.
While subsidence rates appear to be driving the rates of RSLR in this delta (Steckler et al., 2022), water level fluctuations that drive land surface elevation are also compounded by tidal amplification. A recent study showed that mean high water levels in southwest Bangladesh are rising at rates between 10 and 20 mm/yr, primarily from poldering and the redistribution of tidal waters (Pethick and Orford, 2013; Bain et al., 2019). While areas still connected to the tides and the supply of sediment appear to be keeping pace with this Effective Sea Level Rise (ESLR= RSLR + tidal amplification; Bomer et al., 2020a; Valentine et al., 2021), the impacts delta-wide are poorly resolved. Further, as poldered landscapes appear to be compacting at seasonally high rates due to agricultural land-use changes, flood risk will only increase in these areas over time with ESLR (>60% according to Valentine et al., 2021). We require a better understanding of the elevation and water surface dynamics that are driving delta development, particularly in recent decades with human modification and land-use change.
Currently there are 38 sites where continuous GNSS measurements have been made in Bangladesh, but only 11 of them are in the coastal zone and not subject to vertical displacement imparted by interseismic motion of the Indo-Burma subduction zone (e.g., Steckler et al., 2022; Mallick et al., 2019; Oryan et al., 2023). While a few sites were established in 2003 and can provide accurate subsidence rates, some sites were only installed in 2019 and the resulting time series is still too short to yield accurate rates. The coastal zone GNSS sites are also sparsely located (Figure 1) and do not provide sufficient coverage to map the spatial variability of the surface vertical motion, particularly considering different geomorphic features in the lower tidal deltaplain (i.e., paleovalleys vs. interfluves, sandy vs. muddy strata, embanked vs. unembanked regions). However, data from the continuous GNSS sites are supplemented here by new results campaign measurements of some of the 278 geodetic monuments installed throughout Bangladesh by the Survey of Bangladesh (SoB) and the Japan International Cooperation Agency (JICA). The sites in southern Bangladesh, where subsidence is of greatest concern, were primarily installed in 2001–2002 and can provide a multi-decadal measurement of total subsidence. These sites are relatively densely located at approximately 15–30 km intervals, with a total of 55 sites in southwestern Bangladesh (Figure 2), providing excellent coverage of the region for densifying the subsidence map. The concrete monuments have a few designs. The most common extended ∼1.1 m below the ground surface, based on observations of eroded sites and SoB design (Supplementary Figure S2). The sites were first surveyed by campaign GNSS using a Leica SR9500s with Leiat302-GPs for a duration of 4 h in 2002. For sites having heavy tree cover or obstructions, a long pole (6.9–9.5 m) stabilized with guy wires was used for the antenna. Most sites were surveyed from January-March, with the remaining sites surveyed the following November-December after the monsoon (Supplementary Figure S2).
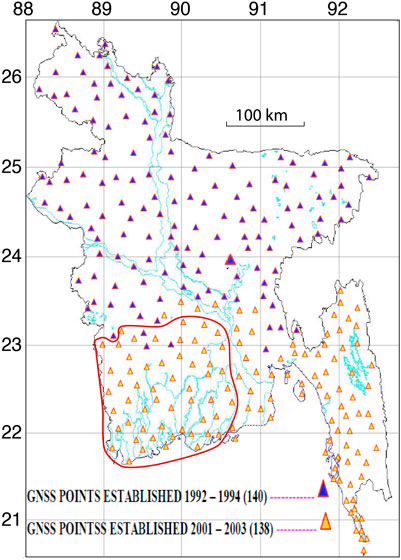
Figure 2. Map shows the position of the 278 geodetic monuments installed by the SoB in conjunction with JICA. The 55 monuments targeted for reoccupation are enclosed in by red curve. 47 of the sites were successfully remeasured. Map courtesy of SoB.
We resurveyed these sites in January-March 2020 (similarly during the pre-monsoon season) and computed subsidence rates relying on the original survey. Despite the long temporal gap between measurements (2002 and 2020), the lengthy span of approximately 18 years between observations ensures the accuracy of the resulting subsidence rates is not compromised, assuming linear subsidence over that time span. Additionally, the high number of observation sites enhances the ability to discern patterns in subsidence more clearly.
The field survey took place in several stages as part of the “Long Term Monitoring, Research and Analysis of Bangladesh Coastal Zone (Sustainable Polders Adapted to Coastal Dynamics)” project of the Coastal Embankment Improvement Project (CEIP-1). Our team consisted of personnel from Columbia University, the Institute of Water Modeling, the Survey of Bangladesh, Dhaka University, the University of Barishal and the French National Research Center (CNRS). One to two survey teams located sites and set up tripods with tribrachs, optical plummets and Trimble NetR9s with Zephyr Geodetic II antennas (Supplementary Figure S2). and occupied sites for ∼24 h, although some were occupied for as long as 3–6 days. For sites where the sky view of the monument was poor due to buildings or trees, we established a nearby GNSS site in an open field and used optical levelling to determine the elevation difference between the monument and the temporary GNSS marker. We were unable to obtain precise measurements because of tree cover at only one site. In some sites a tall monument incompatible with our tripods also required levelling, which generally added an uncertainty of 1 mm to the data. In the Sundarban Mangrove Forest and nearby sites without road access, the survey was conducted during a 10-day boat trip. The slower travel by boat led to the longest observation times. In all, 48 sites were reoccupied while 7 sites had eroded, been disturbed, or were otherwise unusable.
We processed the campaign data using GAMIT (Herring et al., 2018), the same software as used for the continuous GNSS sites. We used 16 global reference sites for stabilization, and, for 2020, we also used 2 of our continuous GNSS and a temporary reference site at Barishal University (see Supplement for details). For seasonal vertical motions, we corrected the rates using the seasonal motion at HRNP as a reference (Supplementary Figure S2). The results yielded a mixture of rates from very low to quite high. Because measurements only included 1 day in 2002 and usually 2–3 days (range 1–5) in 2020, linearity of the subsidence over that time span is necessarily assumed. The mean difference between the highest and lowest elevations for multiple day observations was 15 mm. The reoccupied sites had a modest median uncertainty of 0.94 mm/yr in the vertical, including uncertainties in the equipment setups, predominantly due to the large ∼18 y time gap between the occupations.
To evaluate possible scatter from only sampling a few days subject to variability, we estimated the impact using our site DHAK in Dhaka. This site recorded continuous GNSS data from 2003 to 2019. We compared the rates estimated using the same dates in 2004 and 2019 as the campaign observations were made to estimate the scatter from using only a few days at the beginning and end of the survey. We also note that the seasonal signal at DHAK is larger than HRNP. The mean rate, scaled to 18 years (2020–2002) instead of 15 (2019–2004), differed by only 0.02 mm/yr and had a standard deviation of 0.54 mm/y. As a result of this exercise, we have added 0.5 mm/yr to the uncertainties at the sites. Details are provided in the supplement.
About ½ the sites had rates >20 mm/yr or 360 mm over 18 years (Figure 3). We suspected that the monuments at these sites might be unstable and record subsidence or disturbance that is local to the site. Three sites yielded slight uplift, but at no site is the value beyond the 2σ uncertainty. To examine whether the highest rates of recorded subsidence are due to monument instability, a team from Barishal University reoccupied four sites near Barishal in October 2020, with two showing moderate rates (13–14 mm/yr) and two showing anomalously high rates (20–27 mm/yr). Both sites exhibiting the moderate rates yielded a colinear trend for the three measurements (Figure 4 top), suggesting that the recorded rates reflect an accurate long-term stable subsidence of the ground surface. In contrast, both sites with the anomalously higher subsidence rates yielded non-linear subsidence with the October 2020 measurement showing either no subsidence or uplift relative to the previous reoccupation of the site in January 2020 (Figure 4 bottom). For site GPS 192, we suspect that the monument was initially installed at road level, but subsequently slumped to the adjacent field level, producing additional subsidence, and is currently shifting vertically with the seasonal movements of the rice field. We note that other sites exhibiting such high subsidence rates could subject to similar surface instability and thus caution should be exercised in interpreting the data.
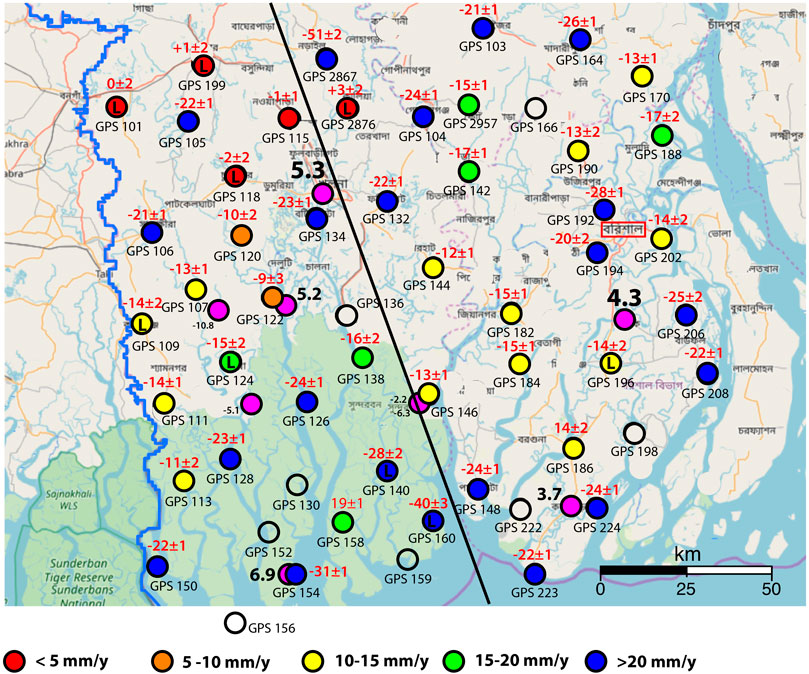
Figure 3. The map shows the results for the 55 monuments targeted for reoccupation. 47 sites were successfully remeasured. The apparent subsidence rates are above and the site names are below the colored circles. The magenta circles are the positions of our continuous GNSS installations with the rate in bold with the font size proportional to the √(time series length). The green area on the background map is the Sundarban Mangrove Forest. The line is the projected profile shown in Figure 7.
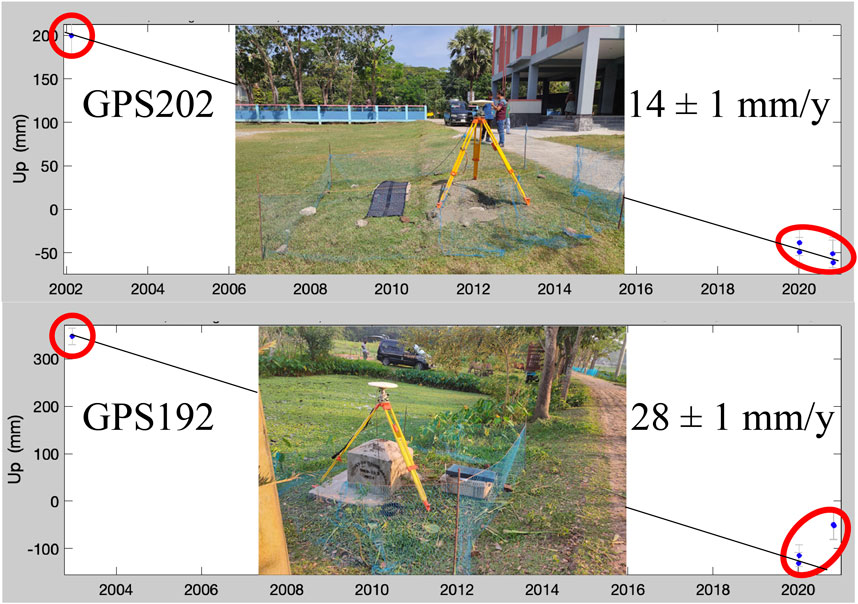
Figure 4. Plots of the time series for two of the reoccupied campaign sites. For the site on the top, the three measurements are colinear. For the site on the bottom, the third measurements yielded uplift relative to the long-term trend. We suspect that this site has slumped and is now shifting vertically seasonally with the rice field. This supports our inference of monument instability at some sites.
Over the past 20 years, we have been mapping the Holocene sediment thickness and lithology using hand-drill tube wells, a local, reverse-circulation, fulcrum-and-lever technique developed for installing drinking water wells (Pickering et al., 2014). Using this method, boreholes can extend up to 91 m (300 ft) below the surface. Samples were collected as wash borings at 1.5 m intervals. To date, we have drilled over 500 tube wells throughout Bangladesh and used them to map the thickness of Holocene sediments (Sincavage, 2017; Sincavage et al., 2017; Grall et al., 2018; Raff et al., 2023). Additional constraints on the Holocene sediment thickness were obtained from the mapping of Pleistocene paleosols reported by Hoque et al. (2014). Holocene sediment thickness contours are presented on Figure 5. Where the Holocene sediment thickness is greater than the maximum depth of tube wells, maximum depth to Pleistocene at the campaign GNSS sites (Supplementary Table S1) was roughly estimated using the incised valley pathways and the LGM depth of the SoNG canyon (>500 m; Palamenghi, 2012).
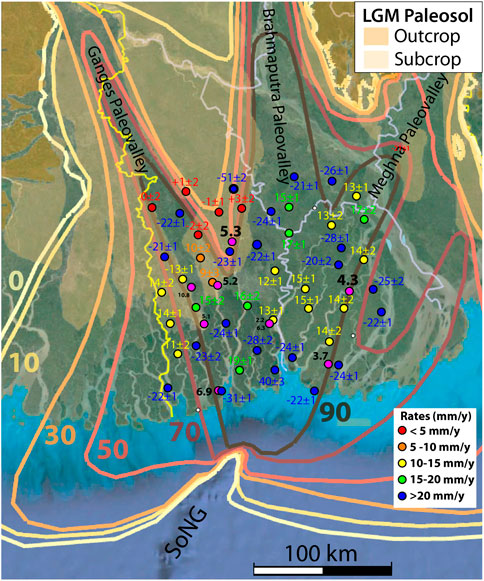
Figure 5. Map showing the contours of the Holocene sediment thickness (Sincavage, 2017; Sincavage et al., 2017) mapped using tube wells with a maximum depth of 91 m. The map shows that the major rivers incised significant valleys feeding into the shelf-indenting Swatch of No Ground (SoNG) canyon. Exposure and weathering of the interfluves created an oxidized clay paleosol that has been mapped by Hoque et al. (2014). Their mapped surface has been added in shades of brown. All of the low subsidence sites overly the thin Holocene overlying the LGMP while the higher rates are associated with thick sediments in the paleovalleys. Rates for the continuous GNSS sites (magenta circles) are presented in black with the font size proportional to the √(time series length).
Figure 6 presents the average lithology of the coastal zone as constrained by our tube well transects. Overall, there is an increase in the mud lithology towards the coast. In tube well Transect G the Holocene stratigraphy is predominantly sand units, with an average only 21% ± 19% mud lithology (Raff et al., 2023). The remaining sites with higher subsidence rates correspond to Transects H and J/K, where mud lithology comprises about twice as much of the Holocene stratigraphy at 50%± 19% and 55%± 15% of the total thickness, respectively (Figure 6). The greater occurrence of mud units in the stratigraphy of the lower fluvio-tidal deltaplain (Wilson and Goodbred, 2015; Raff et al., 2023) is therefore likely to be contributing to higher subsidence rates through greater sediment compaction, in addition to the greater Holocene sediment thickness. To note, the high silt load of the Ganges-Brahmaputra River and strong tidal bed shear across the lower delta plain result in the typical Holocene mud lithology being silt dominated with a mean size of 50.4 µm and a low clay content of ∼10% (n=319; Raff et al., 2023). To estimate the average lithology at each GNSS site, we interpolated from the average lithology of the nearest wells in the transects.
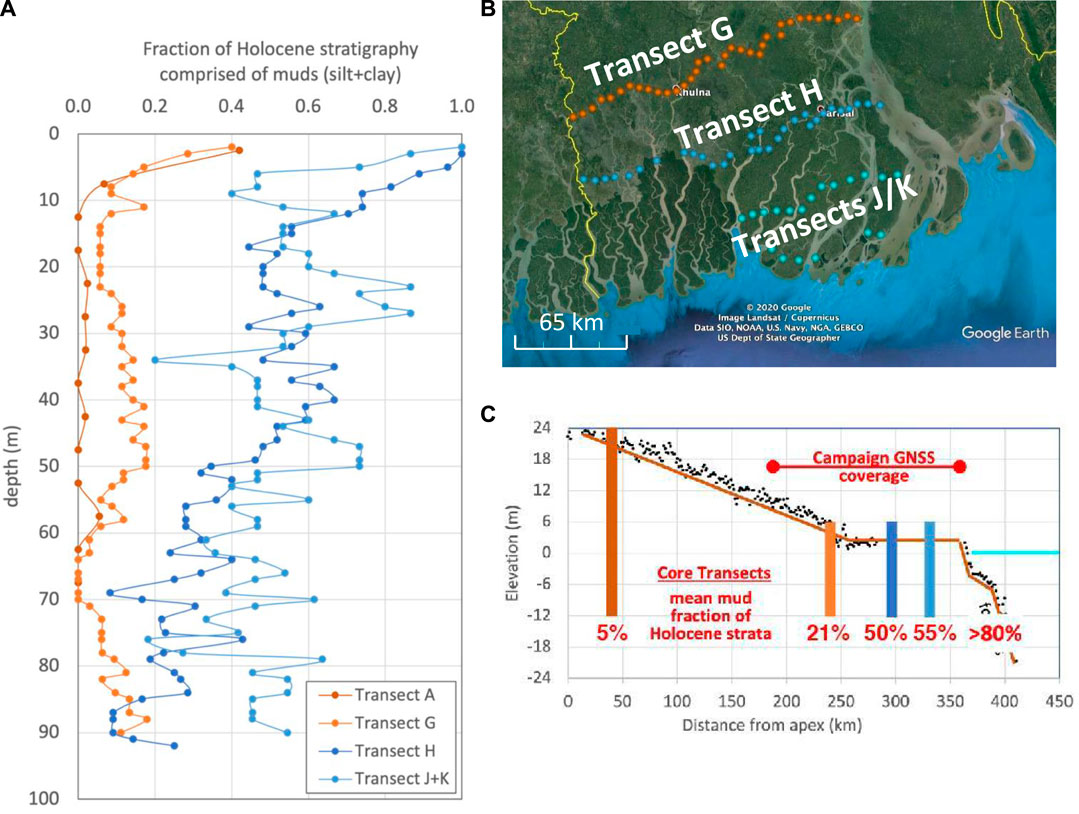
Figure 6. (A) Average lithology versus depth across the lower delta for each of the transects located in (B). Transect A is located in northern Bangladesh between latitudes 24.8–25.2°N. (B) Map showing the locations of the wells for each coastal tube well transect. (C) Cross section showing the increasing percentage of mud toward the coast. The topographic break corresponds to the fluvial to fluvio-tidal transition (Wilson and Goodbred, 2015) and a major increase in mud in the tidal zone of the delta.
Figure 5 displays the subsidence rates compared to the thickness of Holocene sediments mapped by over 500 hand-drilled tube wells (Sincavage, 2017; Sincavage et al., 2017; Grall et al., 2018; Raff et al., 2023). We note that all of the sites with near zero subsidence rates (red circles) are in the northwestern part of the field area and overlie the LGMP. The LGMP surface has been added in shades of brown in Figure 5, where it is found in outcrop and in the subsurface. The resulting patterns reveal that all of the low subsidence sites (<5 mm/y) are located where relatively thin Holocene sediments (30–40 m) overlie the LGMP, whereas the higher rates are associated with thicker sediments in the paleo valleys (>100 m). The low-rate sites are also near the Ganges fan interfluve upstream of the fluvial-tidal delta (Wilson and Goodbred, 2015), where sediments are sandier, in general (Figure 6). Two intermediate rate sites (5–10 mm/y) also overlie the mapped paleosol, but where it may be deeper (60–85 m), as they lie near wells with the LGMP at that depth. In contrast, a nearby site located adjacent to the interfluve but within the Ganges incised channel supports a much higher rate of 22 ± 1 mm/y. In general, subsidence rates increase farther seaward, with most of the subsidence rates near the coast exceeding 20 mm/y, where Holocene sediments are thicker and muddier. The campaign GNSS sites with the fastest subsidence rates mostly lie within the individual incised valleys or the broad confluence of the Ganges, Brahmaputra and Meghna paleo valleys, although there are some outliers.
In order to examine the relative influence of sediment thickness versus lithology on the subsidence rate, we project the results along a profile line that extends NW to SE, from the Ganges fan delta to the Bay of Bengal (Figure 7). We split the results into sites that overly the incised river valleys and where they coalesce, and sites on the interfluves, where the Holocene sediment thickness is less. We use where the Holocene sediments are <100 m and where they are >100 m for this split. The thickest Holocene sediments lie in the incised valleys feeding into the shelf-indenting Swatch of No Ground (SoNG) canyon (Figure 7; Pickering et al., 2018). However, the tube wells only extend to ∼91 m. Where the Holocene sediment thickness is greater than the maximum depth of tube wells, the maximum depth to Pleistocene was roughly estimated using the incised valley pathways and the thickness of Holocene strata at the SoNG canyon head (>500 m; Palamenghi, 2012). For the interfluve GNSS sites, subsidence rates increase from near zero in the NW to ∼24 mm/yr in the southeast (thick gray line in Figure 5). For the deep incised valley sites, subsidence rates increase gently from averaging a little below to a little above 20 mm/y, with a broader scatter around the trend. The plot also shows the transition from sandier to muddier lithology downstream. There is a clear outlier at site 2867. It yielded the highest subsidence rate although it overlies thin, sandy Holocene strata. We exclude this site from further discussion until it can be investigated.
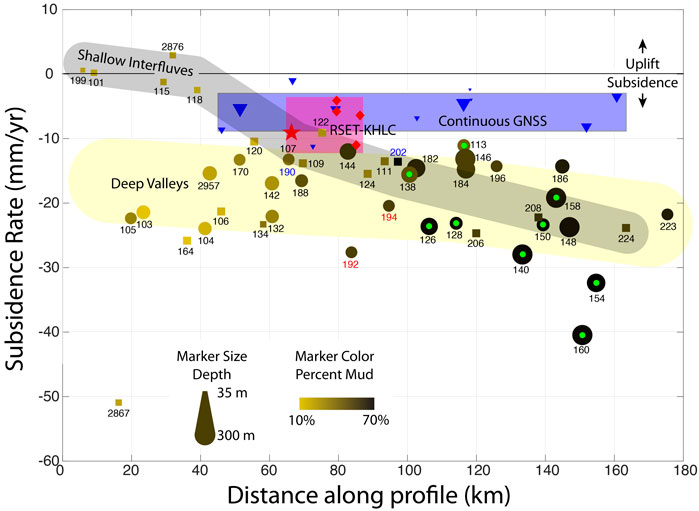
Figure 7. Plot shows subsidence rates from the SoB monuments projected along a profile N160°E, perpendicular to the subsidence contours in Grall et al. (2018) and shown in Figure 3. Markers for sites with the estimated Holocene sediment thickness is less than 100 m are squares and where the thickness is greater than 100 m are circles. Sizes are proportional to estimates thicknesses, with considerable uncertainty for the larger thicknesses. The green dots correspond to sites within the Sundarban Mangrove Forest. The blue and red site labels correspond to the four sites where the resurvey yielded linear and nonlinear subsidence, respectively. Grey and yellow bands show the trends for the two sets. The shallow interfluves show increasing subsidence along the profile as the Holocene sediments become thicker and muddier. The deep valley sites yield only a slight increase along the profile. The symbol size for the blue continuous GNSS sites are proportional to the time series length (Steckler et al., 2022). The red diamond are the RSET rates corresponding to proximal and interior polder sites at 79 km and stream bank and interior Sundarban sites at 85 km (Akter et al., 2024, in press). The KHLC compaction meter results is given as a red star (Steckler et al., 2022). See text for discussion.
Figure 7 also shows that most of the subsidence rates measured from the campaign monument surveys are considerably higher than those from continuous GNSS observations (4–7 mm/yr; blue rectangle in Figure 7). Since all but one of the continuous GNSS are installed on reinforced concrete buildings, we interpret that the SoB monuments measured by campaign GNSS are recording shallow subsidence of the sediments that is not observed at the continuous GNSS sites. This interpretation is supported by the shallow subsidence rates at the KHLC compaction meter (Steckler et al., 2022) and at the RSET-MHs (pink box in Figure 7; Bomer et al., 2020a; Akter et al., 2024). The compaction meter and the RSET-MH sites in the Sundarbans exhibit rates of 9 ± 1 mm/y. These sites have sedimentation rates of 15–25 mm/yr (Steckler et al., 2022; Akter et al., 2024). The RSET sites within the Polder 32 embankment have lower shallow subsidence rates, 5 ± 1 mm/y, and smaller sedimentation rates, 11 ± 3 mm/yr (Figure 1). Still, all of these sites only record shallow subsidence, above 9–15 m for the RSETs and above 100 m for the compaction meter. The greater subsidence rate at locations with great sedimentation rates suggests that a significant part of the shallow subsidence is due to compaction. The compaction vs depth profile at the KHLC site (Steckler et al., 2022) shows that all of the observed compaction is only occurring in the Holocene sediments alone, with no compaction in the Pleistocene strata between 100 and 300 m depth.
Figure 8 further shows relationship of the campaign GNSS subsidence rates, lithology, and Holocene sediment thickness. There is a clear increase in subsidence rate with sediment thickness, although the correlation is limited by the large uncertainties in the thicknesses. The plot symbols are also colored by the fraction of mud (interpolated) in the Holocene stratigraphy, showing that higher mud fraction also correlates with faster subsidence rates. The highest subsidence rates correlate with the muddiest sediments. Since the sandier Holocene sediments that lie upstream are also thinner compared with the thicker and muddier Holocene sediments of the lower delta (Figure 5; 6), we cannot parse out the relative importance of Holocene mud content versus sediment thickness with the current data.
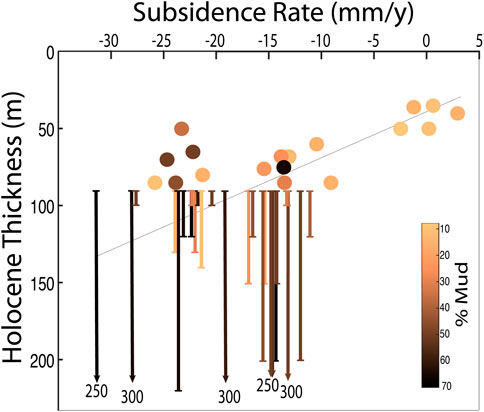
Figure 8. Plot of subsidence rate versus Holocene sediment thickness interpolated to the campaign GNSS sites. For sites where the sediment thickness is greater than the maximum depth of tube wells (91 m), the depth was roughly estimated using the incised valley pathways to the SoNG canyon lowstand surface (Palamenghi, 2012). The range is indicated by arrows and labels. The symbols are colored by the percentage muds at the site interpolated from nearby tube wells.
Understanding the current balance of regional and deep processes vs local and shallow processes such as sediment deposition, sediment compaction, tectonic land movement, and isostatic loading is critical for understanding elevation and sediment dynamics and the prospect for near-future land loss and salinization in the GBD (Raff et al., 2023). Previous research on subsidence measurements made using different methodologies in the GBD shows that variations exhibit systematic spatio-temporal patterns (Grall et al., 2018; Becker et al., 2020; Steckler et al., 2022). In general, it is recognized that thick sedimentary deposits loading the lithospheric plate and compacting underlying deposits are found to enhance the subsidence rate, and these rates are inversely time-dependent, with younger deposits consolidating at greater rates commensurate with their ages. Frederick et al. (2018) and Steckler et al. (2022) found this fundamental temporal control also holds true in the Mississippi Delta and GBD, respectively. The Holocene averaged subsidence rates increase from near zero at the Hinge Zone of the early Cretaceous passive margin (Figure 1) to the southeast toward the sea (4.5 mm/yr; Grall et al., 2018). The rates at 300–600 year old archeological sites are similar to the estimated Holocene rates (three to four mm/yr) at those locations (Figure 1; Sarker et al., 2012; Hanebuth et al., 2013; 2021; Chamberlain et al., 2020). In comparison, Global Navigation Satellite System (GNSS) and river gauge subsidence rates (Becker et al., 2020) from the past 2 decades generally show slightly higher rates than the Holocene (four to seven mm/y; Figure 1), with the highest rates in the muddy Sundarban Mangrove Forest near the coast. Rod Surface Elevation Tables coupled with Marker Horizons (RSET-MH) and vertical strainmeters show much higher rates of 6–11 mm/yr (Bomer et al., 2020b; Steckler et al., 2022; Akter et al., 2024; Figure 1). These instruments, in sites of active sedimentation, include a new spatial component: shallow subsidence that is not recorded by river gauges and GNSS. However, it should be noted that GNSS measurements include deep subsidence beneath the monument, which is not captured by the data collected from the RSETs or strainmeters. Regardless, the high rates of the RSET-MH and strainmeter results present indicate that there is a considerable amount of ongoing shallow sediment compaction. Akter et al. (2024) demonstrates that within an embanked island of coastal Bangladesh where sedimentation is limited, the shallow subsidence is significantly lower than in the adjacent Sundarban Mangrove Forest where sedimentation is rapid (5.0 ± 1.7 versus 8.7 ± 1.2 mm/y, respectively).
Spatially, decadal continuous GNSS subsidence rates are within a millimeter per year of the Holocene rates near the Arial Khan River/Tetulia Channel (Figure 1), the 17–19th century course of the Ganges River. Prior to the mid 17th century, the Ganges mainstem was along the Hooghly River in West Bengal, India and since the late 19th century it flows down the Lower Meghna River with the Brahmaputra River (Figure 1; Rennell, 1776; Majumdar, 1942; Eaton, 1993). West of the distributaries branching off the Lower Meghna River, however, continuous GNSS subsidence rates are consistently a few mm/yr greater than the longer-term rates (Figure 1). Steckler et al. (2022) previously hypothesized that this difference was due to ongoing sediment compaction in the muddier sediment deposited in the interfluves between the mainstem mouths of the Hooghly (Ganges) and Lower Meghna (Ganges and Brahmaputra) Rivers.
Our new data from the campaign GNSS Survey of Bangladesh benchmarks subsidence rates also appear to further support the hypothesis that sediment thickness and lithology are major controlling factors of subsidence rates (Figures 6–8). Measurements of the subsidence rates from 2002 (date of installation) to 2020 (date of second measurement) revealed very low rates in the NW part of the study area where five sites (Figure 5; 7; GPS 101, +0.21 ± 1.90; GPS 115, -1.23 ± 1.31; GPS 118, -2.48 ± 2.22; GPS 199, +0.61 ± 2.20; and 2876, +2.93 ± 2.06) show minimal subsidence. Two of these sites show slight uplift, but only the value from site 2876 shows uplift that is greater than the one sigma uncertainty, but it is still less than 2 sigma. These five sites all correspond to areas having thin (∼30 m), sandy Holocene stratigraphy with a low fraction (8%–15%) of mud lithology (Supplementary Table S3; Figures 6–8). Moving seaward, the campaign GNSS sites on the interfluves (Holocene thickness <100 m) yield subsidence rates that increase from ∼10 to ∼24 mm/yr (Figure 7, gray band). In the incised valleys and where they coalesce, the Holocene sediment thickness filling is over 100 m and could reach 300 m. The sediments are also considerably muddier than upstream (51% ± 8% mud content; Figure 6; 8). In this setting, rates average ∼20 mm/yr with a broad scatter of ±10 mm/yr (Figure 7 yellow band). There is a more modest seaward increase in the rates that goes along with the increasing Holocene thickness and muddiness. These rates are considerably greater than either the continuous GNSS or RSET/KHLC measurements reported by Steckler et al. (2022; Figure 7). The campaign GNSS measurements include both shallow and deep compaction/subsidence, while the GNSS contains only the deeper subsidence and the RSETs only shallow subsidence. We note that most of the sites in the Sundarbans Mangrove Forest (Figure 7, green dots) yielded high rates (11, 19, 22, 23, 24, 28, 31, 40 mm/y). Some of these higher rates could be due to the high sedimentation rates of the muddy sediments there (Rogers et al., 2013; Rogers and Overeem, 2017; Bomer et al., 2020a; Akter et al., 2024). GPS160 (40 mm/y) was buried by ∼250 mm of sediments. However, GPS 113 (11 mm/y) was also covered by 150–200 mm of sediments, while GPS 154 (31 mm/y) and GPS 158 (19 mm/y) were unburied. Future fieldwork and modeling efforts will investigate the extent of current sedimentation on the subsidence rates.
The remeasurements of four sites in October 2020 showed the three measurements at two sites with 13–14 mm/yr subsidence were colinear, but the measurements at the sites with 20–27 mm/yr subsidence were not (Figure 4; 7). While this suggests rates higher than 20 mm/yr could be related to monument instability, the data is insufficient to extend this to the entire dataset. There is too much continuity in the subsidence rate distribution to differentiate stable and unstable monuments. Still there are a few sites that overlie thin sandy Holocene sediments with very high subsidence rates, such as sites GPS 106, 132, 164 and especially 2867, that lie away from the trend of other measurements.
Combining these different measurements that sample overlapping combinations of shallow and deep subsidence—and that do or do not include near surface soils—we can begin to differentiate the depth range for the various components of subsidence. We focus this interpretation around Polder 32 (Figure 1). The region includes the RSETs and the PD32 continuous GNSS, the KHLC compaction meter is <20 km to the NE, and there are 7 campaign sites within 30 km. The subsidence rates at the campaign sites range from 9 to 24 mm/yr and average 16 ± 6 mm/y. With the areal variability, it is difficult to parse the subsidence rates to get the discrete contribution versus depth. However, we can approximate ranges for several different zones. We accept that the deep subsidence that is generated below the Holocene strata due to sediment isostasy associated with thick sedimentary deposits is 2–3 mm/yr (Figure 9) as estimated by Karpytchev et al. (2018) and Krien et al. (2019). Although the total sediment thickness beneath Bangladesh can be 15–20 km (Singh et al., 2016), sediment compaction at great depths is expected to be small because Pleistocene sediments beneath the incised river valleys (>100 m; Sincavage et al., 2017; Grall et al., 2018) already experienced prior loading and will not start to compact again until the weight of any new sediment exceeds the previous overburden reached prior to valley incision (Chapman, 1983). As a result, for most of the incised valleys, little to no compaction of the sediment below the lowstand erosion surface is expected. Exposure and weathering of the lowstand surface that created the LGMP (Umitsu, 1993; Hoque et al., 2014) also likely reduced the sediment porosity and its susceptibility to compaction.
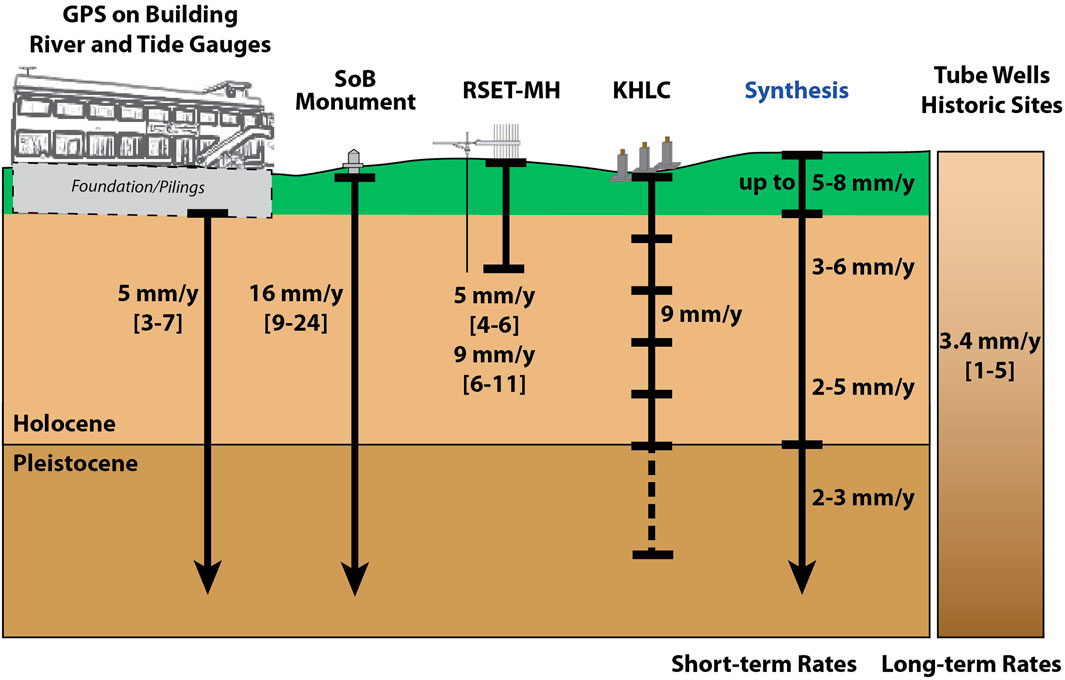
Figure 9. Cartoon presenting a synthesis of subsidence versus depth based on combining measurements from multiple instruments, each of which measure compaction or subsidence over a different depth range. Values are given near Polder 32 with the numbers in brackets showing the range of nearby sites. GNSS on building and tide gauges measure subsidence below the building or gauge foundations and miss shallow compaction. The RSET-MH and KHLC compaction meter measure compaction above the base of their instruments. The two values for the RSETs corresponds to the anthropogenically-modified sites and the natural sites. The campaign GNSS on SoB monuments measures both shallow and deep subsidence. Combining the results, the synthesis column shows a preliminary estimate of subsidence in each depth range. The long-term rates correspond to the sum of the two deeper brown layers.
Within the Holocene, we have estimates from the continuous and campaign GNSS stations, RSET stations to the depth of refusal (9–15 m), KHLC compaction meter (∼100 m). The continuous GNSS only measures subsidence beneath the foundation of the building and shows the lowest rates. The RSETs within the anthropogenically modified poldered regions, with limited sedimentation, show lower rates (4–6 mm/y) than the mangrove forest sites (6–11 mm/y), with higher sedimentation (Figure 9; Bomer et al., 2020a; Akter et al., 2024). We suggest that, similar to other delta systems (Cahoon et al., 1995; Keogh et al., 2021), the higher sediment accumulation rate in the Sundarban Mangrove Forest versus poldered areas (25 mm/yr vs. 11 mm/yr) is driving shallow compaction and is the cause of this difference (Akter et al., 2024). The RSET-MHs in the Sundarbans show similar average shallow subsidence rates as KHLC (Steckler et al., 2022), although KHLC is in an anthropogenically modified zone. However, KHLC sees compaction extending throughout the entire Holocene. Thus, for the shallowest depths (<10 m), we estimate the contribution to the subsidence rates to be up to 5–8 mm/yr (Figure 9), depending on the setting.
Above the base of the RSET rods, but below the shallowest depths, we see considerable variability, but estimate 3–6 mm/yr at most of the sites near Polder 32. This region is transitional between sandier sites to the north and muddier sites to the south (Figure 7), thus we expect considerable variability in the sediment compaction contributing to subsidence.The RSET rates apply to the depth of the instrumentation, i.e., 9–15 m at Polder 32, but up to 24 m at other sites (Figure 1). There is additional subsidence deeper in the Holocene below the base of the RSET rod (sensu Jankowski et al., 2017). This means that the KHLC subsidence rate of 9 mm/yr (Steckler et al., 2022) is greater than the shallow subsidence in the polder (4–6 mm/yr Akter et al., 2024) because it extends to 100 m, beyond the depth of the RSET rods. Thus, at intermediate depths, perhaps corresponding to the Holocene sediment thickness of up to a few hundred meters below the RSET rods (Figure 9), we estimate 2–5 mm/yr (Figure 9). This is likely varies with the Holocene thickness. At site GPS 122, across the Shibsa River from Polder 32, there is only 9 ± 3 mm/yr of subsidence where the Holocene is ∼85 m thick. However, at other sites in the incised valleys, the rates are 16–24 mm/y.
The values of shallow subsidence are similar to observations at the Mississippi Delta where estimates of 3–6 mm/yr were found (Jankowski et al., 2017; Karegar et al., 2020). The high rates of shallow subsidence in the Mississippi delta are likely due to the consolidation of organic-rich and muddy strata in the upper 10 m or less (Jankowski et al., 2017; Keogh et al., 2021). In the GBD with its large tidal range and highly seasonal water stage, most organic matter is consumed or oxidized such that there is little organic matter preservation deeper than ∼5 m (Allison et al., 2003; Goodbred et al., 2003; Bomer et al., 2020b). This loss of mass through organic degradation and wood extraction (Auerbach et al., 2015), and the collapse of large void spaces such as faunal burrows may contribute to the sizeable very shallow subsidence (Bomer et al., 2020a; 2020b). This is especially true in the Sundarbans, where the root of mangrove trees occupy a considerable volume (10%–20%). In the Po Delta, subsidence rates vary with time period and age of the underlying strata (Teatini et al., 2011). Rates from stratigraphy average 2.5 mm/yr over the last 1.43 My (Carminati and Di Donato, 1999), and from 0 to 5 mm/yr over the Holocene (Teatini et al., 2011), similar to the GBD. The Holocene thicknesses in the Po Delta are up to 40 m. InSAR subsidence rates of 1–20 mm/yr vary with the progradation age of the delta, with the most recently deposited strata subsiding the fastest. Thus, the current rates are similar to the GBD. Rates affected by anthropogenic groundwater extraction, mainly from 1950 to 1970) reach 70 mm/y.
In the Mekong Delta subsidence rates, exacerbated by rapid groundwater extraction, average 16 mm/yr and reach up to 40 mm/y (Erban et al., 2014; Minderhoud et al., 2017). Zoccarato et al. (2018) estimates that up to 20 mm/yr in the Mekong is due to compaction of the rapid progradation of the 20 m thick Holocene strata. These rates exceed our estimates for that sediment thickness, due to the primarily clay and organic clay lithology and rapid progradation (50 m/y) of the Mekong Delta. At the Yellow River Delta, InSAR subsidence estimates range from 0 to 30 mm/yr with an average of 15 mm/yr (Liu et al., 2021). Centennial-scale subsidence in boreholes varies with sediment thickness and soil type, with rates decreasing with time since deposition from a maximum of 70 mm/yr (Liu et al., 2021). Thus, the subsidence rates observed in the GBD are comparable to other deltas from active sedimentation. Many deltas and cities are affected by anthropogenic groundwater pumping, and these rates can be substantially higher (e.g., 25–75 mm/yr for the Sacramento-San Joaquin Delta, Rojstaczer et al., 1991; 5->40 mm/yr for the Mekong Delta; Minderhoud et al., 2017; 10–150 mm/yr for Jakarta; Abidin et al., 2011).
Finally, we note that the high rates of average total subsidence obtained by the campaign GNSS measurements (11–25 mm/y) do not necessarily indicate that there is elevation loss in the GBD. The most critical factor for the population is the net change in elevation relative to sea level. The sedimentation rates in active depositional areas of 25 mm/yr in the mangroves (Rogers et al., 2013; Rogers and Overeem, 2017; Akter et al., 2024) appear to be sufficient to keep pace with subsidence and sea level rise. Some high rates in the Sundarbans (e.g., GPS 154, 160), if accurate, may exceed sedimentation rates. However, the land near Hiron Point (GPS 154) has been aggrading. In contrast, the rates of sedimentation within the polders, with constrained riverine deposition (11 mm/yr; Akter et al., 2024) indicate that these areas are at risk of elevation loss, as has been previously documented (Auerbach et al., 2015). Better understanding of elevation change and its variation throughout the delta, in addition to our subsidence analysis, is seriously needed.
Previous global studies of deltas worldwide used single values for the subsidence of the GBD (Ericson et al., 2006; Syvitski et al., 2009; Ostanciaux et al., 2012), although compilations (Brown and Nicholls, 2015) show a wide range of apparent subsidence. New data presented here is beginning to refine our understanding of subsidence rates in the GBD by enabling us to parse out contributions from multiple measurement systems operating at different spatial and temporal scales and depth ranges (Figure 9). GNSS on building measure the total deeper subsidence, but miss shallowest subsidence above the depth of foundation/pilings of the building. The subsidence rates from the continuous GNSS (Figure 1; 3–7 mm/y) are similar to both the rates estimate for the region by tide gauge analysis (Becker et al., 2020), and average Holocene subsidence (Grall et al., 2018), although the distributions of the three sets of measurement have some differences. However, the continuous GNSS rates are a few millimeters/year higher in the southwest coastal zone due to greater compaction of muddier sediments found there. The similarity of rates for these methods indicates that the anchoring of the tide gauges also excludes the shallowest component of subsidence.
In contrast, methods that include very shallow subsidence, such as the RSET-MH, KHLC compaction meter, and the campaign GNSS survey yield much higher rates (Figure 1; 3, 5; 7). The RSET-MH measure all of the subsidence above the base of the rods (≤24 m). The optical fiber compaction meter wells each measure to the base of the well revealing compaction within the Holocene, which is ∼100 m thick at the site. The campaign GNSS at Survey of Bangladesh (SoB) monuments measure the total subsidence and yield considerably higher rates (Figure 3; 4). Mean values near the coast are 20–25 mm/y, but some sites yielded rates up to 40 mm/y. A few sites show signs of disturbances that increased the apparent local subsidence of the monuments. Using the combination of these tools, we create a preliminary estimate of subsidence in four depth zones.
For the deepest zone, we use the value 2–3 mm/yr of subsidence estimated by models (Karpytchev et al., 2018; Krien et al., 2019); Figure 9). This includes both sediment isostasy and any deeper sub-Holocene sediment compaction. We break the Holocene into 3 zones. The shallowest region of the upper few meters may have subsidence rates as large as 5–8 mm/yr corresponding to the dewatering of freshly deposited muds at the surface, collapse of burrows, and decay of organic matter including roots. Much of this is driven by active sedimentation, so subsidence rates in zones of active sedimentation accretion are subsiding faster than zones with human activity has limited sedimentation. In the intermediate zone below the foundations of the buildings and above the base of the RSETs at 9–15 m at Polder 32, but up to 24 m in other sites, we find 3–6 mm/yr of subsidence. Lower values correspond to regions with a sandier lithology, while compaction for muddier regions is yield higher rates. In sections with thicker Holocene strata, which could reach as much as 300 m locally, we estimate subsidence rates can reach 2–5 mm/y. On the longer term, we see the Holocene rates increase to the south, reaching up to 5 mm/yr across the region as found by Grall et al. (2018) and seen in historic sites (Steckler et al., 2022). These estimates are preliminary and subject to change as we obtain additional data from the more recent GNSS and RSET-MH installed in 2019. Additional measurements of lithology and porosity near the RSET and SoB monuments will further help refine estimates of the shallowest subsidence.
The highest rates of total subsidence exceed 20–25 mm/y, which includes compaction of the shallowest soils. These rates correspond to areas with active sediment deposition, and this sedimentation drives the shallowest compaction. These high rates do not imply elevation loss as sedimentation rates are still higher than subsidence rates (Rogers et al., 2013; Rogers and Overeem, 2017; Akter et al., 2024). However, the interior of polders, where sedimentation is limited have seen significant elevation loss that has resulted in drainage problems (Auerbach et al., 2015; Akter et al., 2024). At the polder embankments, site preparation and lack of sedimentation would eliminate the shallowest subsidence. We therefore expect that polder embankments and buildings should see subsidence rates comparable to the continuous GNSS on buildings (1–7 mm/y). However, this subsidence that is not compensated by sedimentation at the anthropogenically-modified polder sites. Quantified subsidence rates do vary across coastal Bangladesh in somewhat tractable regional patterns (see Figure 1; 5, 7), but we show they also vary locally depending on the depositional setting, underlying Holocene sediment thickness and lithology and the extent of anthropogenic modification. Similar factors may contribute to the highly variable subsidence rates observed at other deltas worldwide as well. For example, similar shallow subsidence is seen at the Mississippi and Po Deltas (Teatini et al., 2011; Jankowski et al., 2017). High subsidence rates are observed where the more compactable lithologies are present, such as the Mekong and Rhine-Meuse Deltas (Koster et al., 2018; Zoccarato et al., 2018). While the GBD is sandier with less shallow compaction, the greater Holocene sediment thickness increases both the compaction and isostatic contributions compared to other deltas.
The original contributions presented in the study are included in the article/Supplementary Material, further inquiries can be directed to the corresponding author.
HJ: Investigation, Writing–review and editing. CG: Formal Analysis, Investigation, Writing–review and editing. SG: Formal Analysis, Writing–original draft, Writing–review and editing. BO: Formal Analysis, Writing–review and editing. MS: Conceptualization, Investigation, Formal Analysis, Methodology, Writing–original draft, Writing–review and editing. CW: Formal Analysis, Writing–original draft, Writing–review and editing.
The author(s) declare that financial support was received for the research, authorship, and/or publication of this article. BWDB contract CEIP-1/C3/C4 “Long Term Monitoring, Research and Analysis of Bangladesh Coastal Zone (Sustainable Polders Adapted to Coastal Dynamics)” funded the GNSS survey and analysis and participation of all authors. NSF Awards 16-00258 and 17-16909 funded participation of CW. JO-CREWSnet funded participation of MS and page charges.
We would like to thank the Survey of Bangladesh, particularly Debashish Sarker, for assistance with data access. We also thank all of the participants in the fieldwork, Salam Sikder, Shaikh Nahiduzzaman, and Muktidir Sober of the Institute for Water Modeling; Ershadul Mondal of the Survey of Bangladesh; Nahin Rezwan, Md. Saiful Islam, Md. Yeasin Arafath, Md. Wabidur Rahman, Md. Ashik Afroz, Shahriar Kabir Shoaeb, Md. Rakibul Islam, Md. Galib Muttaki of Barishal University; and Masud Rana, Sharmin Akter, Md. Shahadat Hossain Biplab and Sanju Singha of Dhaka University; and Abu Naser Hossain of the Bangladesh Forestry Department. We would also like to thank the reviewers, Tor Törnqvist, Luigi Bruno, and Veronica Rossi whose comments significantly improved the paper.
The authors declare that the research was conducted in the absence of any commercial or financial relationships that could be construed as a potential conflict of interest.
All claims expressed in this article are solely those of the authors and do not necessarily represent those of their affiliated organizations, or those of the publisher, the editors and the reviewers. Any product that may be evaluated in this article, or claim that may be made by its manufacturer, is not guaranteed or endorsed by the publisher.
The Supplementary Material for this article can be found online at: https://www.frontiersin.org/articles/10.3389/feart.2024.1354686/full#supplementary-material
Abidin, H. Z., Andreas, H., Gumilar, I., Fukuda, Y., Pohan, Y. E., and Deguchi, T. (2011). Land subsidence of Jakarta (Indonesia) and its relation with urban development. Nat. Hazards 59, 1753–1771. doi:10.1007/s11069-011-9866-9
Akter, S., Wilson, C. A., Bhuiyan, A. H., Akhter, S. H., Steckler, M. S., and Rana, M. (2024). “Comparison of surface elevation change, vertical accretion & shallow subsidence between polders and the natural Sundarbans of the Ganges-Brahmaputra delta plain,” in Estuaries and coasts, special issue current advances in coastal wetland elevation dynamics.
Allison, M. A., Khan, S. R., Goodbred, S. L., and Kuehl, S. A. (2003). Stratigraphic evolution of the late Holocene Ganges–Brahmaputra lower delta plain. Sediment. Geol. 155 (3-4), 317–342. doi:10.1016/s0037-0738(02)00185-9
Athy, L. F. (1930). Density, porosity, and compaction of sedimentary rocks. Bull. Am. Ass. Petrol. Geol. 14, 1–24. doi:10.1306/3d93289e-16b1-11d7-8645000102c1865d
Auerbach, L., Goodbred, S., Mondal, D., Wilson, C., Ahmed, K. R., Roy, K., et al. (2015). Flood risk of natural and embanked landscapes on the Ganges–Brahmaputra tidal delta plain. Nat. Clim. Change 5, 153–157. doi:10.1038/nclimate2472
Bahr, D. B., Hutton, E. W. H., Syvitski, J. P. M., and Pratson, L. F. (2001). Exponential approximations to compacted sediment porosity profiles. Comput. Geosciences 27, 691–700. doi:10.1016/s0098-3004(00)00140-0
Bain, R. L., Hale, R. P., and Goodbred, S. L. (2019). Flow reorganization in an anthropogenically modified tidal channel network: an example from the southwestern ganges-brahmaputra-meghna delta. J. Geophys. Res. Earth Surf. 124, 2141–2159. doi:10.1029/2018JF004996
Becker, M., Papa, F., Karpytchev, M., Delebecque, C., Krien, Y., Khan, J. U., et al. (2020). Water level changes, subsidence, and sea level rise in the Ganges–Brahmaputra–Meghna delta. Proc. Natl. Acad. Sci. 117 (4), 1867–1876. doi:10.1073/pnas.1912921117
Blum, M. D., and Roberts, H. H. (2009). Drowning of the Mississippi Delta due to insufficient sediment supply and global sea-level rise. Nat. Geosci. 2, 488–491. doi:10.1038/NGEO553
Bomer, E. J., Wilson, C. A., and Elsey-Quirk, T. (2020b). Process controls of the live root zone and carbon sequestration capacity of the Sundarbans Mangrove Forest, Bangladesh. Sci 2 (3), 35. doi:10.3390/sci2020035
Bomer, E. J., Wilson, C. A., Hale, R. P., Hossain, A. N. M., and Rahman, F. M. A. (2020a). Surface elevation and sedimentation dynamics in the Ganges-Brahmaputra tidal delta plain, Bangladesh: evidence for mangrove adaptation to human-induced tidal amplification. Catena 187, 104312. doi:10.1016/j.catena.2019.104312
Brown, S., and Nicholls, R. J. (2015). Subsidence and human influences in mega deltas: the case of the Ganges-Brahmaputra-Meghna. Sci. Total Environ. 527–528, 362–374. doi:10.1016/j.scitotenv.2015.04.124
Cahoon, D. R., Reed, D. J., and Day, J. W. (1995). Estimating shallow subsidence in microtidal salt marshes of the southeastern United States: kaye and Barghoorn revisited. Mar. Geol. 128, 1–9. doi:10.1016/0025-3227(95)00087-F
Carminati, E., and Di Donato, G. (1999). Separating natural and anthropogenic vertical movements in fast subsiding areas: the Po Plain (N. Italy) Case. Geophys. Res. Lett. 26, 2291–2294. doi:10.1029/1999GL900518
Chamberlain, E. L., Goodbred, S. L., Hale, R., Steckler, M. S., Wallinga, J., and Wilson, C. (2020). Integrating geochronologic and instrumental approaches across the Bengal Basin. Earth Surf. Process. Landforms 45, 56–74. doi:10.1002/esp.4687
Chapman, R. E. (1983). “Chapter 3: Compaction of sediment and sedimentary rocks, and its consequences,” in Petroleum geology, developments in petroleum science 16. Editors R. E. Chapman (Amsterdam: Elsevier), 41–65.
DeWit, K., Lexmond, B. R., Stouthamer, E., Neussner, O., Dörr, N., Schenk, A., et al. (2021). Identifying Causes of urban differential subsidence in the Vietnamese Mekong Delta by combining InSAR and field observations. Remote Sens. 13, 189. doi:10.3390/rs13020189
Eaton, R. M. (1993). The rise of Islam and the Bengal frontier, 1204-1760. Berkeley: University of California Press, 192.
Erban, L. E., Gorelick, S. M., and Zebker, H. A. (2014). Groundwater extraction, land subsidence, and sea-level rise in the Mekong Delta, Vietnam. Environ. Res. Lett. 9, 084010. doi:10.1088/1748-9326/9/8/084010
Ericson, J. P., Vörösmarty, C. J., Dingman, S. L., Ward, L. G., and Meybeck, M. (2006). Effective sealevel rise and deltas: causes of change and human dimension implications. Glob. Planet. Chang. 50, 63–82. doi:10.1016/j.gloplacha.2005.07.004
Frederick, B. C., Blum, M., Fillon, R., and Roberts, H.(2018). Resolving the contributing factors to mississippi delta subsidence: Past and present. Basin. Res. 31, 171–190. doi:10.1111/bre.12314
Giosan, L., Syvitski, J., Constantinescu, S., and Day, J. (2014). Climate change: protect the world’s deltas. Nature 516, 31–33. doi:10.1038/516031a
Gluyas, J., and Cade, C. A. (1997). “Prediction of porosity in compacted sands,” in AAPG memoir 69: reservoir quality prediction in sandstones and carbonates. Editors J. A. Kupecz, J. Gluyas, and S. Bloch, 19–27.
Goodbred, S. L., Kuehl, S. A., Steckler, M., and Sarker, M. H. (2003). Controls on facies distribution and stratigraphic preservation in the Ganges-Brahmaputra delta sequence. Sediment. Geol. 155, 301–316. doi:10.1016/S0037-0738(02)00184-7
Grall, C., Steckler, M. S., Pickering, J. L., Goodbred, S., Sincavage, R., Paola, C., et al. (2018). A base-level stratigraphic approach to determining Holocene subsidence of the Ganges–Meghna–Brahmaputra Delta plain. Earth Planet. Sci. Lett. 499, 23–36. doi:10.1016/j.epsl.2018.07.008
Hanebuth, T. J. J., Kudrass, H. R., Linstaedter, J., Islam, B., and Zander, A. M. (2013). Rapid coastal subsidence in the central Ganges–Brahmaputra Delta (Bangladesh) since the 17th century deduced from submerged salt-producing kilns. Geology 41 (9), 987–990. doi:10.1130/G34646.1
Hanebuth, T. J. J., Kudrass, H. R., Zander, A. M., Akhter, H. S., Neumann-Denzau, G., and Zahid, A. (2021). Stepwise, earthquake-driven coastal subsidence in the Ganges–Brahmaputra Delta (Sundarbans) since the eighth century deduced from submerged in situ kiln and mangrove remnants. Nat. Hazards 111, 163–190. doi:10.1007/s11069-021-05048-2
Herring, T. A., King, R. W., Floyd, M. A., and McClusky, S. C. (2018). Introduction to GAMIT/GLOBK release 10.7, 54.
Higgins, S. A., Overeem, I., Steckler, M. S., Syvitski, J. P. M., Seeber, L., and Akhter, S. H. (2014). InSAR measurements of compaction and subsidence in the Ganges–Brahmaputra Delta, Bangladesh. J. Geophys. Res. Earth Surf. 119 (8), 1768–1781. doi:10.1002/2014jf003117
Hoque, M. A., McArthur, J. M., and Sikdar, P. K. (2014). Sources of low-arsenic groundwater in the Bengal Basin: investigating the influence of the last glacial maximum palaeosol using a 115-km traverse across Bangladesh. Hydrogeol. J. 22, 1535–1547. doi:10.1007/s10040-014-1139-8
Jankowski, K. L., Törnqvist, T. E., and Fernandes, A. M. (2017). Vulnerability of Louisiana’s coastal wetlands to present-day rates of relative sea-level rise. Nat. Commun. 8, 14792. doi:10.1038/ncomms14792
Karegar, M. A., Larson, K. M., Kusche, J., and Dixon, T. H. (2020). Novel quantification of shallow sediment compaction by GPS interferometric reflectometry and implications for flood susceptibility. Geophys. Res. Lett. 47, e2020GL087807. doi:10.1029/2020GL087807
Karpytchev, M., Ballu, V., Krien, Y., Becker, M., Goodbred, S., Spada, G., et al. (2018). Contributions of a strengthened early Holocene monsoon and sediment loading to present-day subsidence of the Ganges-Brahmaputra Delta. Geophys. Res. Lett. 45, 1433–1442. doi:10.1002/2017GL076388
Keogh, M. E., Törnqvist, T. E., Kolker, A. S., Erkens, G., and Bridgeman, J. G. (2021). Organic matter accretion, shallow subsidence, and river delta sustainability. J. Geophys. Res. Earth Surf. 126 (12), e2021JF006231. doi:10.1029/2021jf006231
Kominz, M. A., Patterson, K., and Odette, D. (2011). Lithology dependence of porosity in slope and deep marine sediments. J. Sediment. Res. 81, 730–742. doi:10.2110/jsr.2011.60
Kooi, H., and DeVries, J. J. (1998). Land subsidence and hydrodynamic compaction of sedimentary basins. Hydrology Earth Syst. Sci. 2, 159–171. doi:10.5194/hess-2-159-1998
Koster, K., Stafleu, J., Cohen, K. M., Stouthamer, E., Busschers, F. S., and Middelkoop, H. (2018). Three-dimensional distribution of organic matter in coastal-deltaic peat: implications for subsidence and carbon dioxide emissions by human-induced peat oxidation. Anthropocene 22, 1–9. doi:10.1016/j.ancene.2018.03.001
Krien, Y., Karpytchev, M., Ballu, V., Becker, M., Grall, C., Goodbred, S., et al. (2019). Present-day subsidence in the Ganges-Brahmaputra-Meghna delta: eastern amplification of the Holocene sediment loading contribution. Geophys. Res. Lett. 49, 10764–10772. doi:10.1029/2019gl083601
Liu, Y., Liu, J., Xia, X., Bi, H., Huang, H., Ding, R., et al. (2021). Land subsidence of the Yellow River Delta in China driven by river sediment compaction. Sci. Total Environ. 750, 142165. doi:10.1016/j.scitotenv.2020.142165
Mallick, R., Judith, A. H., Lindsey, E. O., Bradley, K. E., Moore, J. D. P., Ahsan, A., et al. (2020). Subduction initiation and the rise of the Shillong plateau. Earth Planet Sci. Lett. 433, 1–11. doi:10.1016/j.epsl.2020.116351
Mallick, R., Lindsey, E. O., Feng, L., Hubbard, J., Banerjee, P., and Hill, E. M. (2019). Active convergence of the India-Burma-Sunda plates revealed by a new continuous GPS network. J. Geophys. Res. Solid Earth 124, 3155–3171. doi:10.1029/2018JB016480
Meckel, T. A., Ten Brink, U. S., and Williams, S. J. (2007). Sediment compaction rates and subsidence in deltaic plains: numerical constraints and stratigraphic influences. Basin. Res. 19, 19–31. doi:10.1111/j.1365-2117.2006.00310.x
Michels, K. H., Kudrass, H. R., Hu, C., Suckow, A., and Wiedicke, M. (1998). The submarine delta of the Ganges-Brahmaputra: cyclone-dominated sedimentation patterns. Mar. Geol. 149, 133–154. doi:10.1016/s0025-3227(98)00021-8
Milliman, J. D., Broadus, J. M., and Gable, F. (1989). Environmental and economic implications of rising Sea Level and subsiding deltas: the nile and bengal examples. Ambio 18, 340–345. Available at: http://www.jstor.org/stable/4313605
Minderhoud, P. S. J., Erkens, G., Pham, V. H., Bui, V. T., Erban, L., Kooi, H., et al. (2017). Impacts of 25 years of groundwater extraction on subsidence in the Mekong delta, Vietnam. Environ. Res. Lett. 12, 064006. doi:10.1088/1748-9326/aa7146
Mitra, S., Priestley, K. F., Borah, K., and Gaur, V. K. (2018). Crustal structure and evolution of the Eastern Himalayan plate boundary system, Northeast India. J. Geophys. Res. Solid Earth 123, 621–640. doi:10.1002/2017JB014714
Oryan, B., Betka, P. M., Steckler, M. S., Nooner, S. L., Lindsey, E. O., Mondal, D., et al. (2023). New GNSS and geological data from the Indo-Burman subduction zone indicate active convergence on both a locked megathrust and the Kabaw Fault. Journ. of Geophy. Res. Solid Earth 128, e2022JB025550. doi:10.1029/2022JB025550
Ostanciaux, É., Husson, L., Choblet, G., Robin, C., and Pedoja, K. (2012). Present-day trends of vertical ground motion along the coast lines. Earth Sci. Rev. 110, 74–92. doi:10.1016/j.earscirev.2011.10.004
Palamenghi, L. (2012). “Tectonic and sea level control on the transport and depositional processes in a siliciclastic sedimentary basin,” in Insights from the ganges-brahmaputra delta, Bengal basin, Bangladesh (Bremen University Dissertation), 147. Available at: http://nbn-resolving.de/urn:nbn:de:gbv:46-00102878-10
Palamenghi, L., Schwenk, T., Spiess, V., and Kudrass, H. R. (2011). Seismostratigraphic analysis with centennial to decadal time resolution of the sediment sink in the Ganges–Brahmaputra subaqueous delta. Cont. Shelf Res. 31 (6), 712–730. doi:10.1016/j.csr.2011.01.008
Passalacqua, P., Goodbred, S., Giosan, L., and Overeem, I. (2021). Stable ≠ Sustainable: delta dynamics versus the human need for stability. Earth’s Future 9. doi:10.1029/2021EF002121
Passalacqua, P., Lanzoni, S., Paola, C., and Rinaldo, A. (2013). Geomorphic signatures of deltaic processes and vegetation: the Ganges-Brahmaputra-Jamuna case study. J. Geophys. Res. Earth Surf. 118 (3), 1838–1849. doi:10.1002/jgrf.20128
Pethick, J., and Orford, J. D. (2013). Rapid rise in effective sea-level in southwest Bangladesh: its causes and contemporary rates. Glob. Planet. Change 111, 237–245. doi:10.1016/j.gloplacha.2013.09.019
Pickering, J. L., Diamond, M. S., Goodbred, S. L., Grall, C., Martin, J. M., Palamenghi, L., et al. (2018). Impact of glacial-lake paleofloods on valley development since glacial termination II: a conundrum of hydrology and scale for the lowstand Brahmaputra-Jamuna paleovalley system. Geol. Soc. Am. Bull. 131, 58–70. doi:10.1130/B31941.1
Pickering, J. L., Goodbred, S. L., Reitz, M. D., Hartzog, T. R., Mondal, D. R., and Hossain, Md.S. (2014). Late Quaternary sedimentary record and Holocene channel avulsions of the Jamuna and Old Brahmaputra River valleys in the upper Bengal delta plain. Geomorphology 227, 123–136. doi:10.1016/j.geomorph.2013.09.021
Raff, J. L., Goodbred, S. L., Pickering, J. L., Sincavage, R. S., Ayers, J. C., Hossain, M. S., et al. (2023). Sediment delivery to sustain the Ganges-Brahmaputra delta under climate change and anthropogenic impacts. Nat. Commun. 14 (1), 2429. doi:10.1038/s41467-023-38057-9
Rennell, R. (1776). An actual survey of the provinces of Bengal, Bahar &c, printed by Andrew Drury, 1 sheet.
Rogers, K., and Overeem, I. (2017). Doomed to drown? Sediment dynamics in the human-controlled floodplains of the active Bengal Delta. Elem. Sci. Anthropocene 5, 66. doi:10.1525/elementa.250
Rogers, K. G., Goodbred, S. L., and Mondal, D. R. (2013). Monsoon sedimentation on the ‘abandoned’ tide-influenced Ganges-Brahmaputra delta plain. Estuar. Coast. Shelf Sci. 131, 297–309. doi:10.1016/j.ecss.2013.07.014
Rojstaczer, S. A., Hamon, R. E., Deverel, S. J., and Massey, C. A. (1991). Evaluation of selected data to assess the causes of subsidence in the Sacramento-San Joaquin delta, California. U.S. Geological Survey Open-File Report 91-1931991. doi:10.3133/ofr91193
Sadler, P. M. (1981). Sediment accumulation rates and the completeness of stratigraphic sections. J. Geol. 89, 569–584. doi:10.1086/628623
Saintilan, N., Kovalenko, K. E., Guntenspergen, G., Rogers, K., Lynch, J. C., Cahoon, D. R., et al. (2022). Constraints on the adjustment of tidal marshes to accelerating sea level rise. Science 377, 523–527. doi:10.1126/science.abo7872
Sarker, M. H., Choudhury, G. A., Akter, J., and Hore, S. K. (2012). Bengal delta not sinking at a very high rate. Daily star (23rd december 2012).
Sclater, J. G., and Christie, P. A. (1980). Continental stretching; an explanation of the post Mid-Cretaceous subsidence of the central North Sea basin. J. Geophys. Res. 85, 3711–3739. doi:10.1029/jb085ib07p03711
Sheldon, N. D., and Retallack, G. J. (2001). Equation for compaction of paleosols due to burial. Geology 29, 247–250. doi:10.1130/0091-7613(2001)029<0247:efcopd>2.0.co;2
Shirzaei, M., Freymueller, J., Törnqvist, T. E., Galloway, D. L., Dura, T., and Minderhoud, P. S. J. (2021). Measuring, modelling and projecting coastal land subsidence. Nat. Rev. Earth Environ. 2, 40–58. doi:10.1038/s43017-020-00115-x
Sincavage, R. (2017). The Holocene sedimentary archive of Sylhet basin, Bangladesh: linking surface processes to the stratigraphic record within a mass balance framework. Vanderbilt University. Available at: https://ir.vanderbilt.edu/handle/1803/12865 PhD dissertation, 348.
Sincavage, R., Goodbred, S., and Pickering, J. (2017). Holocene Brahmaputra River path selection and variable sediment bypass as indicators of fluctuating hydrologic and climate conditions in Sylhet Basin, Bangladesh. Basin Res. 30, 302–320. doi:10.1111/bre.12254
Sincavage, R. S., Paola, C., and Goodbred, S. L. (2019). Coupling mass extraction and downstream fining with fluvial facies changes across the Sylhet basin of the Ganges-Brahmaputra-Meghna delta. J. Geophys. Res. Earth Surf. 124, 400–413. doi:10.1029/2018JF004840
Singh, A., Bhushan, K., Singh, C., Steckler, M. S., Akhter, S. H., Seeber, L., et al. (2016). Crustal structure and tectonics of Bangladesh: new constraints from inversion of receiver functions. Tectonophysics 680, 99–112. doi:10.1016/j.tecto.2016.04.046
Steckler, M. S., Akhter, S. H., and Seeber, L. (2008). Collision of the ganges–brahmaputra delta with the Burma arc: implications for earthquake hazard. Sci. Letts. 273, 367–378. doi:10.1016/j.epsl.2008.07.009
Steckler, M. S., Oryan, B., Wilsan, C. A., Grall, C., Nooner, S. L., Mondal, D. R., et al. (2022). Synthesis of the distribution of subsidence of the lower ganges-brahmaputra delta, Bangladesh. Earth-Science Rev. 224, 103887. doi:10.1016/j.earscirev.2021.103887
Syvitski, J. P. M., Kettner, A. J., Overeem, I., Hutton, E. W. H., Hannon, M. T., Brakenridge, R. G., et al. (2009). Sinking deltas due to human activities. Nat. Geosci. 2 (10), 681–686. doi:10.1038/ngeo629
Syvitski, J. P. M., Vörösmarty, C. J., Kettner, A. J., and Green, P. (2005). Impact of humans on the flux of terrestrial sediment to the global coastal ocean. Science 308, 376–380. doi:10.1126/science.1109454
Teatini, P., Tosi, L., and Strozzi, T. (2011). Quantitative evidence that compaction of Holocene sediments drives the present land subsidence of the Po Delta, Italy. J. Geophys. Res. 116, B08407. doi:10.1029/2010JB008122
Terzaghi, K., and Peck, R. B. (1967). Soil mechanics in engineering practice. 2. New York: Wiley, 729.
Tessler, Z., Vörösmarty, C. J., Grossberg, M., Gladkova, I., Aizenman, H., Syvitski, J. P. M., et al. (2015). Profiling risk and sustainability in coastal deltas of the world. Science 349 (6248), 638–643. doi:10.1126/science.aab3574
Tessler, Z. D., Vörösmarty, C. J., Overeem, I., and Syvitski, J. P. (2018). A model of water and sediment balance as determinants of relative sea level rise in contemporary and future deltas. Geomorphology 305, 209–220. doi:10.1016/j.geomorph.2017.09.040
Törnqvist, T. E., and Blum, M. D. (2024). What is coastal subsidence? Cambridge prisms. Coast. Futur. 2 (2024), e2. doi:10.1017/cft.2024.1
Umitsu, M. (1993). Late quaternary sedimentary environments and landforms in the Ganges Delta. Sediment. Geol. 83, 177–186. doi:10.1016/0037-0738(93)90011-s
Valentine, L., Wilson, C. A., and Rahman, M. (2021). Flood risk of embanked areas and potential use of dredge spoils as mitigation measures in the southwest region of the ganges-brahmaputra-meghna delta, Bangladesh. Earth Surf. Process. Landforms 47, 1073–1088. doi:10.1002/esp.5303
Vernant, P., Bilham, R., Szeliga, W., Drupka, D., Kalita, S., Bhattacharyya, A. K., et al. (2014). Clockwise rotation of the Brahmaputra valley relative to India: tectonic convergence in the eastern himalaya, naga hills, and Shillong plateau. J. Geophys. Res. Solid Earth 119, 6558–6571. doi:10.1002/2014JB011196
Wilson, C. A., and Goodbred Jr, S. L. (2015). Construction and maintenance of the Ganges-Brahmaputra-Meghna delta: linking process, morphology, and stratigraphy. Annu. Rev. Mar. Sci. 7, 67–88. doi:10.1146/annurev-marine-010213-135032
Yuill, B., Lavoie, D., and Reed, D. J. (2009). Understanding subsidence processes in Coastal Louisiana. Jour. of Coas. Res. 54, 23–36. doi:10.2112/SI54-012.1
Keywords: subsidence, Bangladesh, Ganges-Brahmaputra Delta, GNSS, Holocene, deltas, coastal zone
Citation: Steckler MS, Jaman MH, Grall CJ, Goodbred SL, Wilson CA and Oryan B (2024) Contribution of campaign GNSS toward parsing subsidence rates by time and depth in coastal Bangladesh. Front. Earth Sci. 12:1354686. doi: 10.3389/feart.2024.1354686
Received: 12 December 2023; Accepted: 24 May 2024;
Published: 14 June 2024.
Edited by:
Daniela Ruberti, University of Campania Luigi Vanvitelli, ItalyReviewed by:
Luigi Bruno, University of Modena and Reggio Emilia, ItalyCopyright © 2024 Steckler, Jaman, Grall, Goodbred, Wilson and Oryan. This is an open-access article distributed under the terms of the Creative Commons Attribution License (CC BY). The use, distribution or reproduction in other forums is permitted, provided the original author(s) and the copyright owner(s) are credited and that the original publication in this journal is cited, in accordance with accepted academic practice. No use, distribution or reproduction is permitted which does not comply with these terms.
*Correspondence: Michael S. Steckler, c3RlY2tsZXJAbGRlby5jb2x1bWJpYS5lZHU=
Disclaimer: All claims expressed in this article are solely those of the authors and do not necessarily represent those of their affiliated organizations, or those of the publisher, the editors and the reviewers. Any product that may be evaluated in this article or claim that may be made by its manufacturer is not guaranteed or endorsed by the publisher.
Research integrity at Frontiers
Learn more about the work of our research integrity team to safeguard the quality of each article we publish.