 Yongle Ma1
 Lei Wan
95% of researchers rate our articles as excellent or good
Learn more about the work of our research integrity team to safeguard the quality of each article we publish.
Find out more
ORIGINAL RESEARCH article
Front. Earth Sci. , 22 February 2024
Sec. Solid Earth Geophysics
Volume 12 - 2024 | https://doi.org/10.3389/feart.2024.1349634
Unconventional oil and gas reservoirs, especially that in tight formations, contribute great parts to the global energy. During drilling in tight formations, lost circulation was one of the major problems, which can cause large amount of non operation time and millions of losses. In order to migrate the problem, lost circulation materials (LCMs) were used to prevent reopening of the fracture by isolating the fracture tip while the calculation of stress intensity factor (SIF) and fracture width is the key to LCMs design. In this paper, a dual porosity medium flow model suitable for tight formation is established to calculate the pressure distribution in fracture, and the fracture width and fracture reopening pressure (FROP) is then calculated by using the semi-analytical fracture mechanics model. Sensitivity analysis of critical parameters, for example, fracture length, wellbore radius, LCMs permeability, viscosity, wellbore pressure, and two rock-mechanics-related properties are implemented. The fracture width is larger in the formation with large horizontal principal stress anisotropy, low Young’s modulus and Poisson’s ratio. The increase in fracture length, wellbore radius and wellbore pressure also contributes to fracture opening. Meanwhile, we compared the situation before and after fracture plugging and the results emphasize that the fracture reopening is less likely to occur under the conditions of high viscosity and low permeability LCMs. The method proposed in this study can be used to calculate fracture width and FROP, which has potential significant application for lost circulation control in tight formation.
The Oil and Gas industry works based on the safe and efficient extraction of hydrocarbons from underground reservoirs, lost circulation is a common problem in the construction of oil and gas wells. The lost circulation control may hinder production operations in oil and gas wells, which can significantly increase nonproduction costs and time. (Amadi-Echendu and Yakubu, 2014; Albattat and Hoteit, 2019; Zhang et al., 2019; Li et al., 2022; Li et al., 2022; Wan et al., 2023). Fractures, whether natural or hydraulic, can be reopened when the wellbore pressure is higher than the initial fracture pressure, leading to significant mud loss. During lost circulation, with the increase of wellbore pressure, the stress on the natural fracture or induced fracture tip gradually increases. When the fracture tip stress intensity factor (SIF) reaches a critical value (KIC), the fracture will reopen and continue to propagate. The critical value, known as the toughness coefficient, is one of the properties of the formation material, indicating the resistance of the formation to fracture propagation, the toughness coefficient of different strata is not the same. The SIF magnitude is dependent on the fracture surface width, size, and stress distribution. (Mirabbasi et al., 2020).
In general, the lost circulation materials (LCMs) used are a key factor in determining the lost circulation control, injection of commonly available materials into the fracture to reduce pressure or seal fracture (Ashoori et al., 2022). There are many ways to strengthen wellbore, among which there are three main types of fracture reinforcement. a) Fracture propagation resistance: Yili et al. (2014) believe that under the induction of the formation, the LCMs react in the fracture, forming a high-strength structure, isolation wellbore pressure and increasing bearing capacity of formation pressure. (Fuh et al., 1992; van Oort et al., 2011); b) Stress-cage theory: Alberty and Mclean (2004) believe that to balance the wellbore pressure and formation stress field, the stress field at the fracture tip or tangential stress field around the wellbore can be adjusted to effectively control drilling fluid loss. (Aston et al., 2004); c) Fracture closure stress: Loloi et al. (2010) consider the fracture tip to be isolated with LCMs to prevent drilling fluid pressure from reaching the fracture tip, thereby resistance fracture propagation (Dupriest and Koederitz, 2005). Although these techniques and theories have different approaches, they all use LCMs in fracture areas to plug natural and induced fractures. Consequently, it is possible to reduce the fracture pressure because of the isolating action of the LCMs on the fracture. Theoretically, an increase in fracture reopening pressure (FROP) can be achieved as a result of the lower fracture pressure being transferred to the fracture tip to induce fracture propagation. (Feng et al., 2016a; Feng and Gray, 2017). Therefore, it is essential to quickly calculate the fracture geometry and SIF in determining the Fracture Reopening Pressure (FROP) and LCM design. (Qin et al., 2023).
Many scholars have established analytical and numerical models to understand the mechanics of responses before and after fracture plugging. The numerical modeling, such the Cohesive zone model by Kostov et al. (2015), the PKN model by Wang et al. (2018), the finite element model by Feng and Gray. (2016b) and the boundary element model by Liu et al. (2020). Compared to numerical modeling, the analytical/semi-analytical model is more accurate in predicting the fracture aperture and stress intensity factor at different conditions and more computationally efficient. The semi-analytical method has been widely applied to the calculation of the stress intensity factor and fracture width in fracture models (Warren, 1982; Shahri et al., 2014; Shahri et al., 2015; Xu et al., 2017; Xu et al., 2020). Mehrabian and Abousleiman. (2015) and Mehrabian and Abousleiman (2018) presented a linear elastic fracture mechanics based model to calculate the extended drilling margin and also considered the case of multiple fractures. However, these studies do not take into account the effects of time and fluid flow to cause pressure changes in the fracture during fracture propagation. Zhong et al. (2017), (Zhong et al., 2018) considered the influence of drilling time on fracture propagation but believed that fluid pressure drop in fractures was too small to be ignored. Pressure exchange between fractures and formation also greatly affected fracture propagation. Wan et al. (2023) analyzed the influence of fluid flow on fracture propagation in triple porosity medium: LCMs, formation, and mud cake. However, for tight formations (formations permeability ≤ 1 mD), the pressure transfer from wellbore or fracture to formation is slow, and the fracture pressure leakage to formation efficiency is low, as Figure 1. With the decrease of formation permeability, the difference of stress intensity factor (SIF) between the two models becomes small, especially in tight formation, where the difference is negligible. So the effect of mud cake on inhibiting fracture growth is negligible, and considering triple porosity media increases the calculation cost in tight formation too.
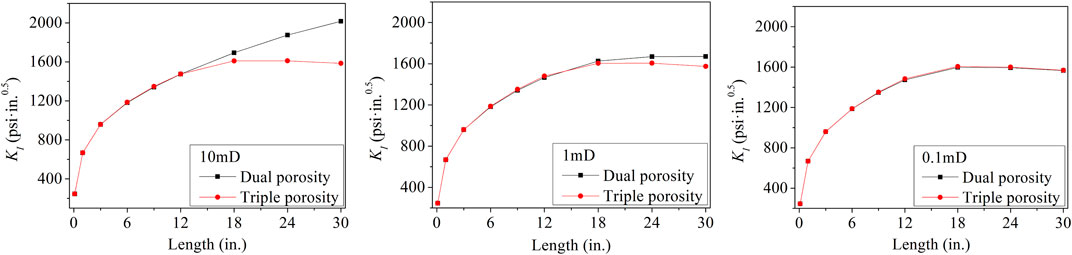
FIGURE 1. The SIF of the dual porosity model and the triple porosity model at different fracture lengths.
In this paper, based on Wan et al. (2023), a dual porosity media model combined with a fracture-mechanics model based on dislocation is established in tight formation. The influence of fluid flow and filtration on fracture width is discussed. The fracture reopening pressure (FROP) is calculated and its influencing factors are analyzed. The model simplifies the influence of other fractures around the wellbore, accurately reproduces the interaction between the plugging zone and the formation and the pressure transfer from well to fracture tip. Compared with other models, the accuracy and efficiency of SIF and fracture width calculation results are improved, and the calculation process of FROP is supplemented for Wan et al. (2023). The model can reasonably design LCMs and calculate FROP, which has important guiding significance for wellbore reinforcement technology that prevents continuous fracture propagation, collapse and leakage around the well.
In the process of using LCMs to plug induced and naturally occurring fractures to prevent further fracture propagation and leakage of a large amount of drilling damage formation, the dual porosity medium for plugging zone (Part of the LCMs plugged in the fracture) and formation matrix in the fracture area can be considered as a system in which fluid flow follows Darcy’s law (Wang et al., 2018), as shown in Figure 2.
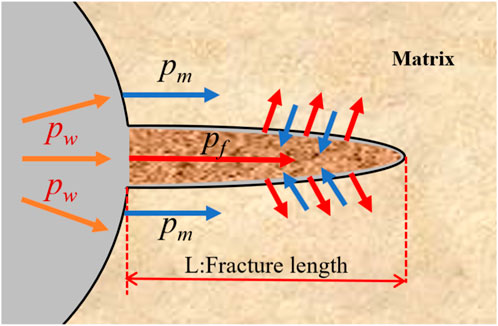
FIGURE 2. Dual porosity medium model for matrix and LCMs.
Assuming that the system of wellbore, plugging zone and formation matrix is quasi-stable, fluid flows into the plugging zone from the wellbore and the wellbore pressure will transfer to the formation matrix, thus forming the pressure difference inside and outside the fracture. We assume that the pressure difference is linear, and establish the following fluid flow model in the dual porosity medium, (See the detailed derivation Wan et al., 2023),
where p is the fluid pressure,
According to Wan et al. (2023), the final stress intensity factor and fracture width distribution are
The distribution function f (tk) can be calculated by a semi-analytical model (Warren, 1982). The model can be Split into two subproblems, shown in Figure 3. Subproblem I without fractures, the tangential stress distribution is given by Kirsch's equation, as Eq. 5:
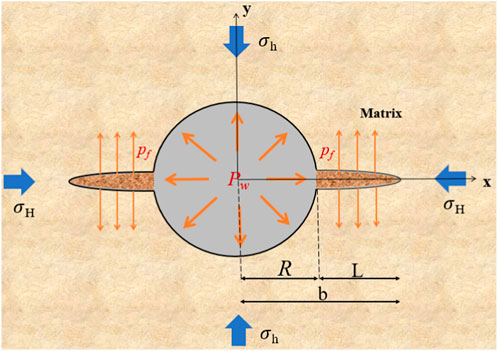
FIGURE 3. The model of the fractures around wellbore.
Subproblem II with fractures, the stress distribution of the fracture surface can be expressed according to the potential of the complex function, as Eq. 6 (Muskhelishvili, 1953; Warren, 1982)
The superimposed gravity generated by the above two subproblems extending the fracture surface is equal to the pressure inside the fracture, and the following equation can be established:
Where G is the shear modulus, v is the Poisson’s ratio and
When the fracture tip stress intensity factor (KI) reaches the fracture toughness (KIC) as well as the wellbore pressure (pw) is adjusted, this wellbore pressure is the fracture reopening pressure (FROP). The steps of solving the FROP coupling model are shown in Figure 4. Solved step by step as follows: a) The finite element software COMSOL was used to solve Eqs 1, 2, the fracture pressure of plugging zone was obtained; b) Using Matlab to solve Eqs 3, 4, the fracture width and fracture tip stress intensity factor (SIF) can be obtained; c) Finally, the fracture reopening pressure (FROP) was determined by comparing the KI to KIC.
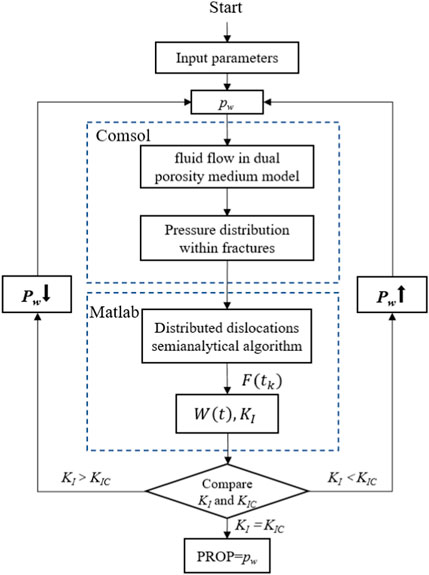
FIGURE 4. Coupling model for solving the fracture reopening pressure (FROP).
As the operation time increases, the fracture pressure in the plugging zone will be more fully transmitted to the fracture tip. If the operation time is unlimited, the pressure distribution in the plugging zone will be equal to the wellbore pressure. In order to verify the accuracy of this model, we increased the operation time and entered the same parameters as Shahri et al. (2014), as shown in Table 1. The results show that the fracture width and stress strength factor are close to those of Shahri. The results of the study are finally consistent, as shown in Figures 5A, B, as in Shahri et al. The FROP calculated results comparison is shown in Figure 5C, the fracture length varies from 3 to 18 in. The black line shows the results of numerical model who Feng and Gray. (2016b) and the red line shows the results of this model. A great match is obtained, and the more the fracture length, lower the FROP.
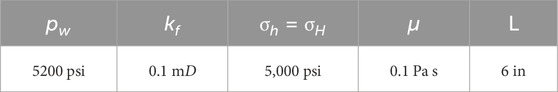
TABLE 1. Input data for validation of the model.
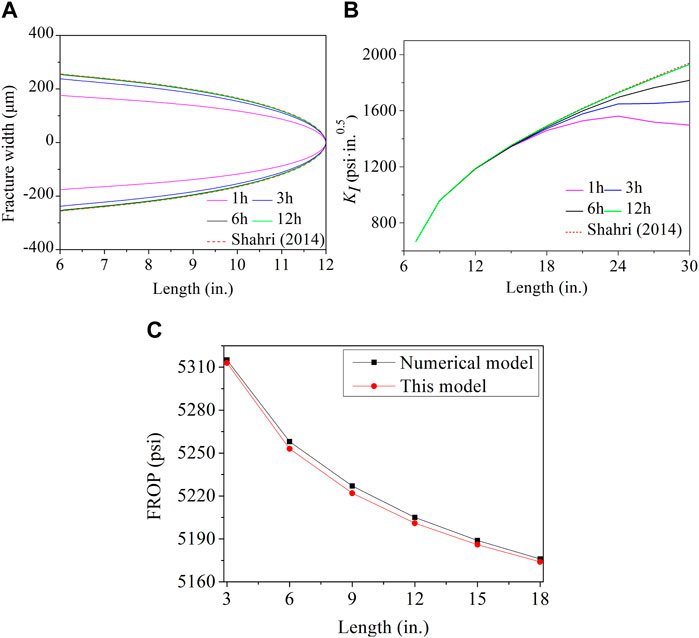
FIGURE 5. (A) Fracture width at different times. (B) Stress intensity factor at different times. (C) FROP at different fracture length.
When the formation permeability is less than 1 mD (km ≤ 1 mD), can be considered a tight formation. In the following, the influence of each parameter on fracture width is studied. Take Table 2 as the basic parameters, keep other parameters unchanged, and change a single variable.
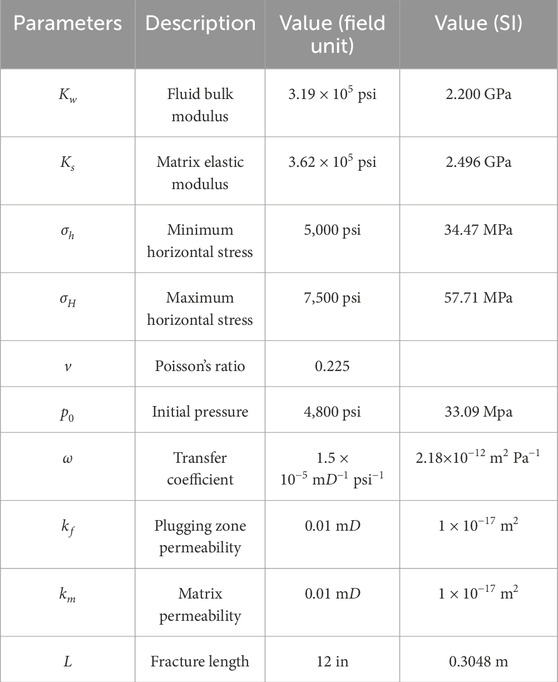
TABLE 2. Input data for base-case.
Before the fracture is sealed, we believe that the fracture pressure is equal to the wellbore pressure (pf = pw). Meanwhile, the influence of some parameters on the fracture morphology before the fracture is sealed is studied as follows:
(a) With the remaining parameters unchanged, the influence of fracture length and wellbore radius length on fracture width is similar, as shown in Figures 6A, B. The fracture width increases with the increase of fracture length or wellbore radius.
(b) Poisson’s ratio and Young’s modulus, two rock mechanics parameters, also have a certain influence on fracture width, as shown in Figures 6C, D. The influence of Poisson’s ratio on width is small, and the fracture width decreases with the increase of Poisson’s ratio. On the other hand, the effect of Young’s modulus on the fracture width is more significant, and the fracture width decreases with the increase of Young’s modulus.
(c) The semi-analytical solutions simulate the effects of stress anisotropy and wellbore pressure (pw) on fracture width, as shown in Figures 6E, F. The fracture width increases significantly with the increase of stress anisotropy, and the fracture width also increases significantly with the increase of wellbore pressure (pw).
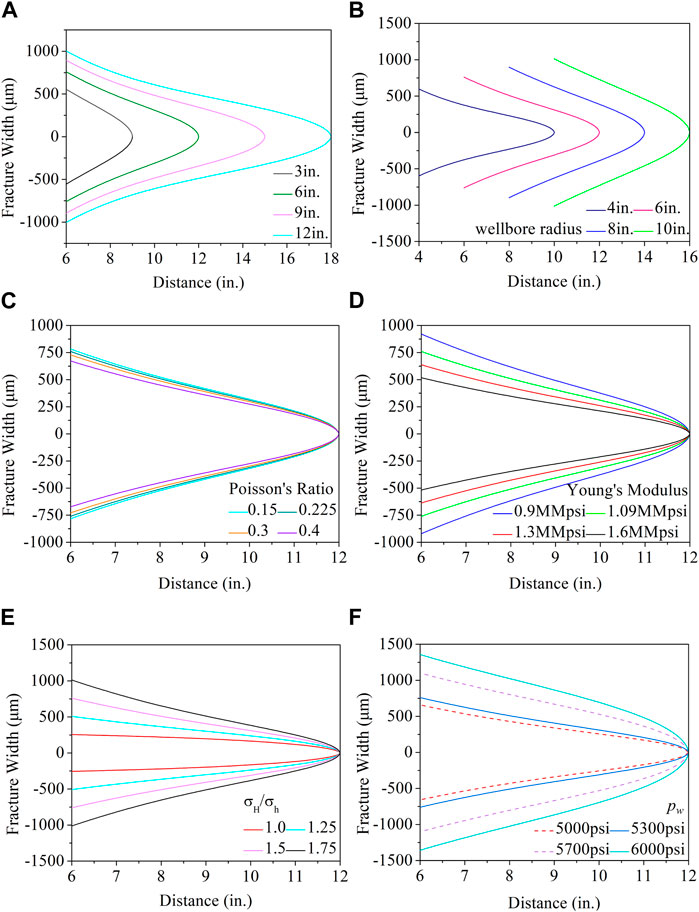
FIGURE 6. The influence of fracture length (A), wellbore radius (B), Poisson’s ratio (C), Young’s modulus (D), stress anisotropy (E), and wellbore pressure (F) on fracture width before plugging, respectively.
These rules are the same as most studies, which further verifies the accuracy of our model.
After LCMs plugging, the fluid flow from the wellbore into the fracture is prevented from reaching the fracture tip. In the same period (48 h), with the decrease of plugging zone permeability, the fracture pressure will decrease, resulting in the narrowing of the fracture width, as shown in Figure 7A. LCMs plugging will change the influence of some parameters mentioned above. For example, with the increase of fracture length, LCMs filling will also increase, further delaying the time of pressure transfer from the wellbore to the fracture tip. As shown in Figure 7B, the fracture width changes with the fracture length after the LCMs with kf = 0.01 mD is plugged, and the fracture mouthing will first increase and then decrease, which is different from the change before the fracture is plugged. At the same time, it also shows that when the plugging distance is long enough, the fracture mouthing can be suppressed.
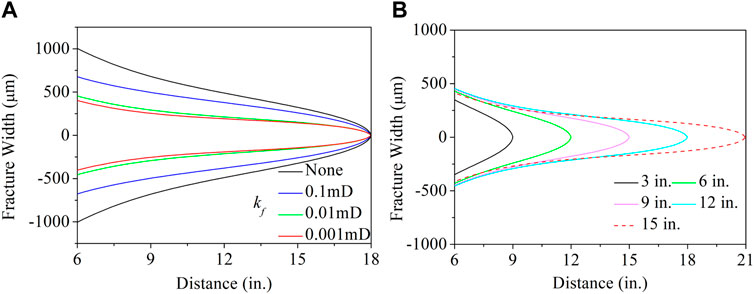
FIGURE 7. (A) and (B) are the influence of LCMs permeability and fracture length on fracture width after plugging, respectively.
The fracture length is set to a fixed value of 12 in., and the change of fracture tip pressure (FIP) and stress intensity factor (SIF) over time is studied. Figures 8, 9A shows that FIP and SIF change over time when the pw = 5,300 psi under different plugging zone permeability. As mentioned above, FIP and SIF decrease with the decrease of plugging zone permeability. For example, when kf = 0.001 mD and 48 h, FIP just reached 5,100 psi, and kf = 0.1 mD, FIP reached nearly 5,300 psi as early as 12 h, where the SIF change law is like FIP. As shown in Figures 8, 9B, FIP and SIF change with time when the wellbore pressure is 5,200 psi under different fluid viscosities. The time increases with the viscosity increases for the fluid to reach the fracture tip, while reducing the fracture tip stress intensity factor. For example, at 48 h, the two viscosity conditions of maximum and minimum can make the SIF difference reach more than 300 psi.
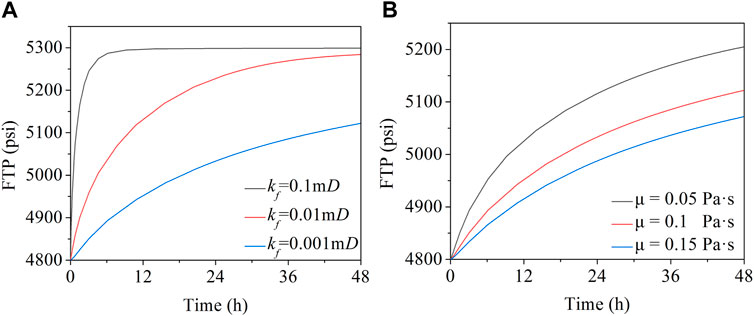
FIGURE 8. (A) and (B) are the effects of plugging zone permeability and mud viscosity on fracture tip pressure (FIP), respectively.
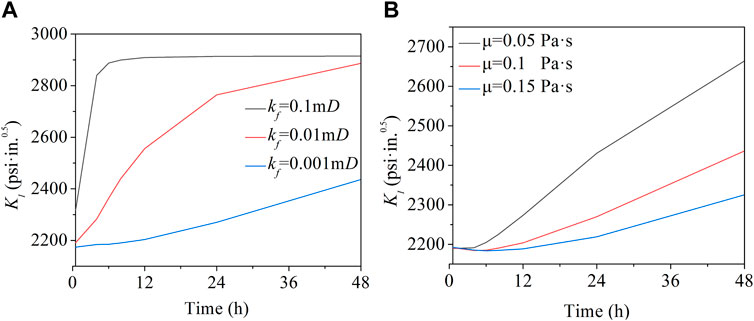
FIGURE 9. (A) and (B) are the effects of plugging zone permeability and mud viscosity on fracture tip stress intensity factor (KI), respectively.
As mentioned in Section 2, if the stress intensity factor (SIF) under different conditions is calculated, the fracture reopening pressure (FROP) can be determined by comparing KI and KIC. As shown in Figure 10, with the increase of wellbore pressure, the SIF also increases, and in the process, the FROP under different formation conditions (different KIC) can be calculated. At the same time, the influence of different parameters on the FROP can also be understood. Figure 10A shows the influence of different plugging zone permeability on the FROP when KIC = 2000 psi. Reduced the plugged zone permeability, delayed the time of wellbore pressure transfer to the fracture tip and reduced the fracture tip SIF. So, the FROP increases with the decrease of plugging zone permeability. On the other hand, Figure 10B shows the influence of different fluid viscosity on the FROP when KIC = 2,400 psi. The increase in fluid viscosity reduces the pressure transfer time and decrease the fracture tip SIF at, the results that the FROP increases with the increase of viscosity.
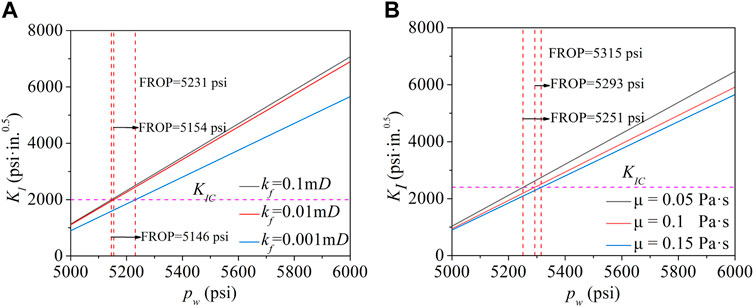
FIGURE 10. (A) and (B) are the effects of plugging zone permeability and mud viscosity on fracture reopening pressure (FROP), respectively.
In this paper, considering that the effect of mud cake on the tight formation is negligible, the three-pore medium model was simplified to be dual porosity model, combined with the semi-analytical fracture mechanics model to calculate the fracture width and fracture reopening pressure (FROP) in tight formations. The model parameterization studies before and after the use of LCMs were performed, and the following conclusions were drawn:
(1) In the formation with large horizontal principal stress anisotropy, low Young’s modulus and Poisson’s ratio, the fracture width is larger. Wellbore radius and pressure is another factor influence the fracture width, and the increase of fracture width occurs in conditions with higher wellbore radius and pressure.
(2) Before plugging, the increase in fracture length contributes to fracture opening. After plugging, more fracture length induces more pressure isolation in fracture tip and can inhibit the fracture propagation
(3) The fluid viscosity and LCMs permeability are major factors in determining the effect of pressure transfer to the fracture tip, and higher fluid viscosity and lower LCMs permeability reduce the FIP and SIF, thus increasing the FROP.
The original contributions presented in the study are included in the article/Supplementary material, further inquiries can be directed to the corresponding authors.
YM: Writing–original draft, Writing–review and editing. LW: Writing–original draft. WH: Writing–review and editing. QX: Writing–review and editing.
The author(s) declare financial support was received for the research, authorship, and/or publication of this article. This work was supported by the CNPC’s Science and Technology Projects (2021DJ4903).
Authors YM and WH were employed by Bo-Xing Division of CNPC Offshore Engineering Company Limited.
The remaining authors declare that the research was conducted in the absence of any commercial or financial relationships that could be construed as a potential conflict of interest.
All claims expressed in this article are solely those of the authors and do not necessarily represent those of their affiliated organizations, or those of the publisher, the editors and the reviewers. Any product that may be evaluated in this article, or claim that may be made by its manufacturer, is not guaranteed or endorsed by the publisher.
FIP, Fracture tip pressure; FROP, Fracture reopening pressure; LCMs, Lost circulation materials; SIF, Stress intensity factor.
Albattat, R., and Hoteit, H. Modeling yield-power-law drilling fluid loss in fractured formation. J. Petroleum Sci. Eng., 2019, 182: 106273. doi:10.1016/j.petrol.2019.106273
Alberty, M. W., and McLean, M. R. (2004). A physical model for stress cages. SPE. doi:10.2118/90493-MS
Amadi-Echendu, J., and Yakubu, A. E. (2014). Asset operations: non-productive times during oil well drilling[C]//Proceedings of the 7th World Congress on Engineering Asset Management (WCEAM 2012). Cham: Springer International Publishing.
Ashoori, S., Bahari Moghadam, M., Nazemi, R., Nooripoor, V., and Ahmadabadi, M. Dynamically evaluating the performance of naturally occurring additives to control lost circulation: on the effect of lost circulation material type, Particle-Size Distribution, and Fracture Width. SPE J., 2022, 27(05): 2590–2612. doi:10.2118/209620-PA
Aston, M. S., Alberty, M. W., McLean, M. R., de Jong, H. J., and Armagost, K. (2004). Drilling fluids for wellbore strengthening. OnePetro. doi:10.2118/87130-MS
Dupriest, F. E., and Koederitz, W. L. (2005). Maximizing drill rates with real-time surveillance of mechanical specific energy. SPE. doi:10.2118/92194-MS
Feng, Y., and Gray, K. E. A parametric study for wellbore strengthening. J. Nat. Gas Sci. Eng., 2016b, 30: 350–363. doi:10.1016/j.jngse.2016.02.045
Feng, Y., and Gray, K. E. Review of fundamental studies on lost circulation and wellbore strengthening. J. Petroleum Sci. Eng., 2017, 152: 511–522. doi:10.1016/j.petrol.2017.01.052
Feng, Y., Jones, J. F., and Gray, K. E. (2016a). A review on fracture-initiation and-propagation pressures for lost circulation and wellbore strengthening. SPE Drill. Complet. 31 (02), 134–144. doi:10.2118/181747-PA
Fuh, G. F., Morita, N., Boyd, P. A., and McGoffin, S. J. (1992). A new approach to preventing lost circulation while drilling. SPE. doi:10.2118/24599-MS
Kostov, N., Ning, J., Gosavi, S. V., Gupta, P., Kulkarni, K., and Sanz, P. (2015). Advanced drilling induced fracture modeling for wellbore integrity prediction. OnePetro. doi:10.2118/174911-MS
Li, J., Qiu, Z., Zhong, H., Zhao, X., and Huang, W. (2020c). Coupled CFD-DEM analysis of parameters on bridging in the fracture during lost circulation. J. Petroleum Scien Eng. 184, 106501. doi:10.1016/j.petrol.2019.106501
Li, J., Qiu, Z., Zhong, H., Zhao, X., Liu, Z., and Huang, W. Effects of water-based drilling fluid on properties of mud cake and wellbore stability. J. Petroleum Sci. Eng., 2022, 208: 109704. doi:10.1016/j.petrol.2021.109704
Liu, Y., Chen, P., Wu, B., Ma, T., Zhang, X., et al. Mechanics of hydraulic-fracture growth from a wellbore intersecting natural fractures. SPE J., 2020, 25(02): 646–661. doi:10.2118/198890-PA
Loloi, M., Zaki, K. S., Zhai, Z., et al. (2010). “Borehole strengthening and injector plugging–the common geomechanics thread,” in SPE North Africa Technical Conference and Exhibition, USA, February 14 2010 (SPE). doi:10.2118/128589-MS
Mehrabian, A., and Abousleiman, Y. N. (2015). Gassmann equations and the constitutive relations for multiple-porosity and multiple-permeability poroelasticity with applications to oil and gas shale. Int. J. Numer. Anal. Methods Geomechanics 39 (14), 1547–1569. doi:10.1002/nag.2399
Mehrabian, A., and Abousleiman, Y. N. (2018). Theory and analytical solution to Cryer's problem of N-porosity and N-permeability poroelasticity. J. Mech. Phys. Solids 118, 218–227. doi:10.1016/j.jmps.2018.05.011
Mirabbasi, S. M., Ameri, M. J., Biglari, F. R., and Shirzadi, A. (2020). Thermo-poroelastic wellbore strengthening modeling: an analytical approach based on fracture mechanics. J. Petroleum Sci. Eng. 195, 107492. doi:10.1016/j.petrol.2020.107492
Muskhelishvili, N. I. (1953). Some basic problems of the mathematical theory of elasticity. Groningen: Noordhoff.
Qin, D., Gao, W., Zhang, S., Cui, X., Chen, H., Yang, P., et al. (2023). In situ composite of graphene oxide in polyacrylamide to enhance strength of hydrogel with polyethyleneimine as crosslinker. Geoenergy Sci. Eng. 231, 212304. doi:10.1016/j.geoen.2023.212304
Shahri, M. P., Oar, T., Safari, R., Karimi, M., and Mutlu, U. (2014). Advanced geomechanical analysis of wellbore strengthening for depleted reservoir drilling applications. OnePetro. doi:10.2118/167976-MS
Shahri, M. P., Oar, T. T., Safari, R., Karimi, M., and Mutlu, U. (2015). Advanced semianalytical geomechanical model for wellbore-strengthening applications. Spe J. 20 (06), 1276–1286. doi:10.2118/167976-PA
Van Oort, E., Friedheim, J., Pierce, T., and Lee, J. (2011). Avoiding losses in depleted and weak zones by constantly strengthening wellbores. SPE Drill. Complet. 26 (04), 519–530. doi:10.2118/125093-PA
Wan, L., Gao, H., Zhang, S., Cui, X., Chen, H., Xing, Q., et al. (2023). Effects of fluid flow in triple porosity medium on fracture width and its propagation during lost circulation control. Geoenergy Sci. Eng. 230, 212281. doi:10.1016/j.geoen.2023.212281
Wang, J., Elsworth, D., and Denison, M. K. (2018). Hydraulic fracturing with leakoff in a pressure-sensitive dual porosity medium. Int. J. Rock Mech. Min. Sci. 107, 55–68. doi:10.1016/j.ijrmms.2018.04.042
Warren, W. E. (1982). The quasi-static stress field around a fractured well bore. Int. J. Fract. 18, 113–124. doi:10.1007/BF00019636
Xu, C., Kang, Y., You, L., and You, Z. (2017). Lost-circulation control for formation-damage prevention in naturally fractured reservoir: mathematical model and experimental study. SPE J. 22 (05), 1654–1670. doi:10.2118/182266-PA
Xu, C., Xie, Z., Kang, Y., Yu, G., You, Z., You, L., et al. (2020). A novel material evaluation method for lost circulation control and formation damage prevention in deep fractured tight reservoir. Energy 210, 118574. doi:10.1016/j.energy.2020.118574
Yili, K., Chengyuan, X. U., Long, T., and Li, S. (2014). Constructing a tough shield around the wellbore: theory and method for lost-circulation control. Petroleum Explor. Dev. 41 (4), 520–527. doi:10.1016/S1876-3804(14)60061-6
Zhang, S., Wang, H., Qiu, Z., Cao, W., Huang, H., and Chen, Z. (2019). Calculation of safe drilling mud density window for shale formation by considering chemo-poro-mechanical coupling effect. Petroleum Explor. Dev. 46 (6), 1271–1280. doi:10.1016/S1876-3804(19)60280-6
Zhong, R., Miska, S., and Yu, M. (2017). Modeling of near-wellbore fracturing for wellbore strengthening. J. Nat. Gas Sci. Eng. 38, 475–484. doi:10.1016/j.jngse.2017.01.009
Keywords: fracture reopening pressure, lost circulation, fluid flow, dislocationbased fracture mechanics, dual porosity medium
Citation: Ma Y, Wan L, Hou W and Xing Q (2024) Geomechanical analysis of lost circulation control in tight formations. Front. Earth Sci. 12:1349634. doi: 10.3389/feart.2024.1349634
Received: 05 December 2023; Accepted: 01 February 2024;
Published: 22 February 2024.
Edited by:
Tianshou Ma, Southwest Petroleum University, ChinaReviewed by:
Yang Liu, Southwest Petroleum University, ChinaCopyright © 2024 Ma, Wan, Hou and Xing. This is an open-access article distributed under the terms of the Creative Commons Attribution License (CC BY). The use, distribution or reproduction in other forums is permitted, provided the original author(s) and the copyright owner(s) are credited and that the original publication in this journal is cited, in accordance with accepted academic practice. No use, distribution or reproduction is permitted which does not comply with these terms.
*Correspondence: Lei Wan, czIxMDQwODU3MDMyQHNtYWlsLmNjenUuZWR1LmNu; Qinze Xing, MjY0NjIxNzE4OUBxcS5jb20=
Disclaimer: All claims expressed in this article are solely those of the authors and do not necessarily represent those of their affiliated organizations, or those of the publisher, the editors and the reviewers. Any product that may be evaluated in this article or claim that may be made by its manufacturer is not guaranteed or endorsed by the publisher.
Research integrity at Frontiers
Learn more about the work of our research integrity team to safeguard the quality of each article we publish.