 Minan Yang1,2
 Xin Li
94% of researchers rate our articles as excellent or good
Learn more about the work of our research integrity team to safeguard the quality of each article we publish.
Find out more
ORIGINAL RESEARCH article
Front. Earth Sci. , 29 January 2024
Sec. Geoscience and Society
Volume 12 - 2024 | https://doi.org/10.3389/feart.2024.1349398
This study is grounded in the coordinated development of the “transportation-urban vitality” coupling in county-level spaces within urban agglomerations. The research object is the Lanzhou–Xining urban agglomeration, a typical western region in China. The interactive relationship between the transportation network of county-level cities within the urban agglomeration and urban vitality is selected, and the vitality evaluation model and spatial syntax model are used to measure the functional vitality, socioeconomic vitality, and transportation network accessibility of the urban agglomeration. On this basis, the evolution characteristics of the coupling coordination level between the transportation network and the urban vitality of the Lanzhou–Xining urban agglomeration are studied. The research found that over the past decade, the transportation network accessibility of the Lanzhou–Xining urban agglomeration and the vitality of the nodal cities have significantly increased. However, the internal development of the urban agglomeration needs to be more balanced. The dual core-driven urban agglomeration has formed a distinct “ridge line” connection, but the polarization phenomenon caused by the “core-periphery” structure is still prominent. The coupling coordination level of spatial development in the county-level space of the Lanzhou–Xining urban agglomeration varies greatly, with approximately 80% of the county-level cities still in a state of imbalance, leading to a mismatch between the transportation network and urban vitality of the Lanzhou–Xining urban agglomeration. This research result is worthy of deep reflection by city managers and participants on the development path of urban agglomerations formed by “weak-weak” alliances.
Urban agglomerations are significant for promoting regional coordinated development and exploiting the effects of clustering. As the most dynamic economic units today, urban agglomerations play a crucial role in global competition (Zhou, 2021). The Lanzhou–Xining urban agglomeration is the most essential cross-provincial urban agglomeration in the inland western part of China. It uniquely promotes the coordinated development of central and western China and provides clustering advantages. In 2018, the Chinese government officially approved the “Lanzhou-Xining Urban Agglomeration Development Plan” (O'Brien, 2021). The establishment of the Lanzhou–Xining urban agglomeration has played a significant role in promoting China’s great Western development, regional economic growth, and regional coordinated development. However, influenced by geographical and environmental conditions and difficult domestic and international economic situations, the Lanzhou–Xining urban agglomeration faces many non-coordination problems in socioeconomic development and the development of core cities. This includes issues such as rapid urban expansion with incomplete infrastructure, creation of industrial clusters with a lack of core technology (You and Yang, 2017; Tong et al., 2020), breakthroughs in administrative barriers (Tong and Wei, 2018), and “darkness under the lamp” (Z. Liu et al., 2022; Waldner and Smith, 2015).
On the other hand, with the rapid increase in the population size in the core cities in recent years, the highly concentrated population and resources have not only brought unprecedented development space for cities but have also generated urban problems such as transportation congestion, low-quality expansion, and imbalance between jobs and residences. It is urgent to explore the high-quality, coordinated development model of core cities from the perspective of the whole urban agglomeration and to call for the creation of vibrant and sustainable urban spaces (Niu et al., 2020). In addition, as the practical main body of urban agglomeration development, cities are the primary arena for regional socioeconomic activities (Fang, 2015; Tan, 2017). Exploring the interactive relationship and coordinated optimization mechanism of spatial elements of node cities can enhance urban quality from the perspective of spatial coordination, activate the endogenous power of high-quality development of urban agglomerations, form the core competitiveness of leading the orderly coordination of socioeconomic activities, and promote the leading role of “vitality poles” in the coordinated development of urban agglomerations.
Ever since Jacob proposed the concept of urban vitality diversity, many studies have shown that the “diversity” of the transportation network environment and urban vitality are closely related (Row, 1962; Sung and Lee, 2015). Xia et al. (2022) reported that the number, location, and connection with other transportation networks of transportation routes and hubs are vital issues for their role in improving regional resource element mobility and extensive economic impact (Li et al., 2022; Xia et al., 2022). In fact, at the level of urban agglomerations, transportation accessibility (Xinsheng et al., 2011; Li et al., 2021), public policies, land use (Still and Simmonds, 2000), and other transportation elements have heterogeneous characteristics. A study on the urban agglomeration in the middle reaches of the Yangtze River in China found that the constraints of transportation infrastructure on the integration of resources and economy in urban agglomerations have promoted the complementary advantages of cities (Yang et al., 2021; Ren et al., 2022). The close connection between the transportation network and the economy and industries has formed the layered structure of the urban network, which is conducive to the industrial development of the regional division of labor cooperation (Sun et al., 2015; Nundy et al., 2021). However, the development differences in central and western China are significant at the current stage. The driving role of transportation infrastructure investment in western cities on trade logistics and expanding domestic demand is less than that of eastern urban agglomerations (Lan et al., 2020; Z; Liu et al., 2022; Nistor and Popa, 2014). It is necessary to break through policy barriers and implement the coordinated optimization of transportation and industrial structure to achieve the harmonious development of transportation, nature, and socioeconomy (Chen and Haynes, 2017; Jin et al., 2020; Si et al., 2021).
Various studies have explored the impact of transportation network development on regional urban vitality and socioeconomics, ecological resilience, and spatial structural changes (Kim et al., 2002; Wilkinson et al., 2012; Cui et al., 2019). Other studies have examined the coupling relationship between the spatial characteristics of the transportation network and urban vitality. From the perspective of the urban agglomeration region, the transportation network is the carrier of resource element flow, and spatial accessibility directly affects the formation and development of local vitality spaces. Some scholars (Yue et al., 2021) have compared the monocentric and polycentric vitality models of Ho Chi Minh City and Shanghai, finding that broad grid roads have reduced their urban vitality. Findlay and Sparks (2009) found that urban roads provide a place for such activities. The transportation network provides this physical space with fluid characteristics and accommodates the diversity of different functions (Zhang et al., 2023). Enhancement of urban vitality will drive the development of external circulation industries, and external mobility will act on urbanization construction and domestic demand. In addition, transportation network spaces such as architectural spaces (Yue et al., 2021), walking spaces (Du et al., 2015), subway passages (Lunecke and Mora, 2018), and transportation hubs (Yufei et al., 2020) are also important factors affecting urban vitality. However, as the polarization phenomenon has been brought about by the generalization of population expansion in core cities, the population loss in small towns and the lack of development momentum become increasingly prominent, and how to construct and optimize the sustainable spatial structure of urban agglomerations has become a hotspot and difficult research issue. Some scholars have begun to explore the impact mechanism of urban transportation network spatial change rules and urban vitality from the dual perspective of internal unity and external differences in the transportation network (Langford et al., 2008; Liang et al., 2021). More scholars believe that the coordinated development of urban agglomerations needs to be based on the experience of social fairness and residents’ happiness. The coordination of multiple elements, such as spatial population density, accessibility, and the built environment, can effectively activate the vitality of the urban agglomeration (Swisher IV, 2017; Elvidge et al., 2021; Zhang et al., 2023). However, most studies are qualitative case analyses due to the limited availability of such detailed and practical data.
A large amount of research on the relationship between transportation networks and urban vitality has been observed through reviewing of the existing literature. The current focus is mainly on two levels: macro and micro. First, at the macro level, transportation networks have impacted the flow efficiency of industries, economies, and resource elements in urban agglomerations. However, various factors have had diverse impacts on urban vitality due to their characteristics. Second, the material and site attributes of the transportation network space at the micro level have promoted the coordinated interaction of urban space, especially the impacts of accessibility, spatial form, and the built environment, which are particularly evident. However, these studies are often conducted from a single perspective, and there is still a lack of research on the concentration and coupling relationship of the role of transportation network accessibility on the socioeconomic and functional characteristics of urban agglomerations. The reason is that only some scholars can incorporate macro and micro urban vitality into the same indicator system to construct vitality evaluation indicators and quantitatively analyze their spatiotemporal coupling characteristics through long time-series data. In addition, existing studies have found that both transportation accessibility and transportation network density positively promote urban vitality at the city scale. Therefore, when the research area is expanded to the level of urban agglomerations, how the transportation network affects the mechanism of urban vitality and the coupling coordination characteristics between the transportation network and urban vitality are worth further exploration.
This article aims to answer the following questions: what are the spatiotemporal performance characteristics of urban agglomeration vitality and transportation networks in Northwest China and whether transportation infrastructure development is coupled and coordinated with urban vitality. To solve this problem, we use multivariate data to analyze the transportation and urban vitality of China’s inland urban agglomerations and propose an evaluation method based on the coupling of urban vitality of land transportation to explore the interaction mechanism between transportation and node urban vitality of Lanzhou–Xining urban agglomerations. Section 2 provides a brief overview of the study area and methodology used in this paper. Section 3 provides the analysis of the evaluation results of the coupled relationship between transportation network accessibility and urban vitality in the Lancashire urban agglomeration. We conclude the paper by discussing the study from several perspectives and providing conclusions.
The Lanzhou–Xining urban agglomeration is located in the center of inland China, with a total area of 97,500 square kilometers. As of 2021, the regional GDP was 664.8 billion yuan, with a resident population of 13 million (O'Brien, 2021). It is a typical “weak-weak” alliance-type urban agglomeration. The urbanization rates of Gansu and Qinghai are 48.49% and 55.52%, respectively, which have yet to reach the national average. As of 2021, the GDP of the Lanzhou–Xining urban agglomeration was 664.8 billion yuan, and the per capita GDP was 51,139 yuan, only 63% of the national level, indicating that the overall development level of the Lanzhou–Xining urban agglomeration is not high. In addition, the Lanzhou–Xining urban agglomeration lags in the construction of infrastructure such as transportation, information, and water conservancy, the backbone structure of the road network is of low standard, the intercity network is not sound, and the intensity of external connections is low. As of the end of 2021, the total length of the road network in the Lanzhou–Xining urban agglomeration had reached more than 60,000 km, with a network density of 0.78 km/square kilometer, slightly higher than the national average but still far behind the Chengdu–Chongqing urban agglomeration and the Guanzhong Plain urban agglomeration in the west.
This article uses the range of the Lanzhou–Xining urban agglomeration defined in the “Development Plan of the Lanzhou-Xining Urban Agglomeration” issued by the National Development and Reform Commission and the Ministry of Housing and Urban–Rural Development in 2018 as the research area (Figure 1). The study focuses on 39 counties in the region, i.e., 20 counties in three cities and one prefecture in Gansu Province and 19 counties in two cities and three prefectures in Qinghai Province.
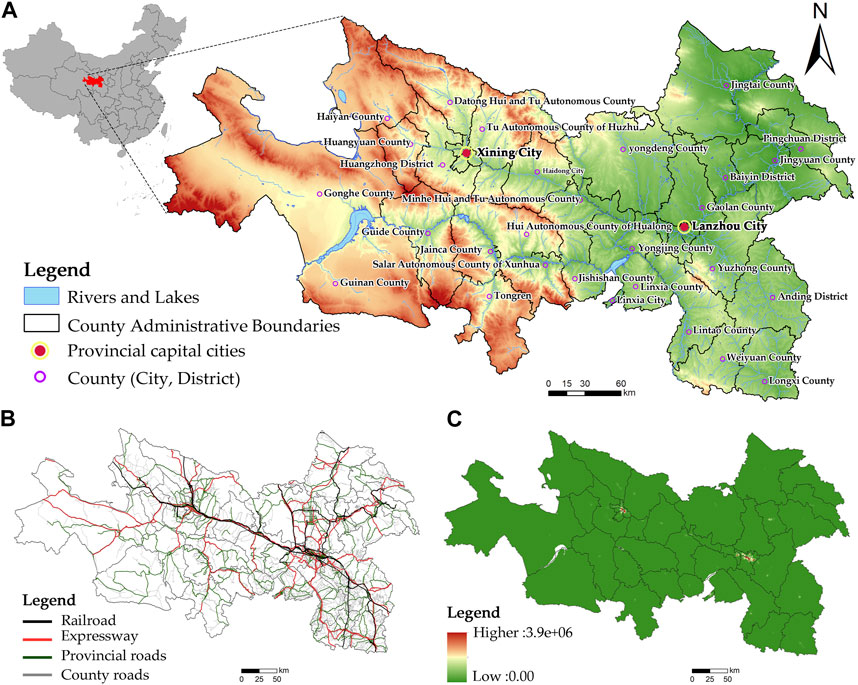
FIGURE 1. Location and layout of Lanzhou–Xining urban agglomeration. (A) Location and topography; (B) integrated transportation network; (C) nighttime light distribution.
The road transportation network data and rail transportation network data used in this article were obtained from the National Basic Geographic Information Database Feature Data of the National Basic Geographic Information Data Center (http://kmap.ckcest.cn/nationwideMap/index, accessed on 15 May 2022), the historical data of the OpenStreetMap website (https://www.openhistoricalmap.org/, accessed on 15 May 2022) (Zhang et al., 2015). The data from 2012 to 2015 are obtained from the National Basic Geographic Information Database Topographic Feature Data 1:250,000 Data Set; 2018 & 2021 data from OSM website vector map data. We divided the data into four types based on the type of data: highways, provincial roads, county roads, and railroads.
Point of interest (POI) data represent the point-like data of natural geographic entity spaces. It generally includes information such as name, category, and geographic coordinates (Chen et al., 2002; Wang et al., 2021). It is a new type of spatial data source that can intuitively reflect the distribution of various facilities and human socioeconomic activities. The POI data used in this study are provided by East China Normal University (2012–2017) and Peking University (2018), collected from big data platforms. The total amounts of POI data (http://sdsp.ecnu.edu.cn/data/, accessed on 5 August 2022, and https://opendata.pku.edu.cn, accessed on 10 August 2022) in 2012, 2015, 2018, and 2021 are 151,400, 264,200, 355,700, and 532,900, respectively. They include 11 types: healthcare, leisure and entertainment, life services, company business, transportation services, automotive services, finance, shopping, accommodation, and education services. These POI types reflect four basic activities of urban residents: living, working, commuting, and entertainment.
The nighttime light data used in this study are the NPP/VIIRS nighttime remote sensing image data. The data were obtained from the National Environmental Information Center Earth Observation Group under the NOAA (https://www.ngdc.noaa.gov.html, accessed on October 8), and the study selected the second version of the annual synthetic data for 2012–2021 (Chen et al., 2019). Unlike the first version, the second version has undergone preliminary noise reduction and “fire stone” processing with higher quality.
The population density data used in this article were obtained from the WorldPop website (https://www.worldpop.org, accessed on July 1st), a global high-resolution population project (Ma et al., 2014). The spatial resolution of the data is approximately 100 m, and this study selected data from 2012 to 2020. Other statistics were obtained from the “China City Statistical Yearbook,” “China County Statistical Yearbook,” “Gansu Provincial Statistical Yearbook,” “Qinghai Provincial Statistical Yearbook,” and statistical bulletin data from various counties and districts.
The data preprocessing and process used in this paper are shown in Figure 2. First, we project the collected data to the same geospatial coordinate system, and ArcGIS software is used for cropping to obtain the vector data as the primary dataset for analysis. Then, the 500-m resolution raster is resampled, and the obtained data are incorporated into the same function to carry out kernel density analysis of the data concerning the method of kernel density analysis of POI data for preprocessing (Zhao et al., 2019): for rasters, less than 0 are assigned a value of 0, and the maximum value is used as an indicator parameter of urban vitality after calibrating the data of the previous year according to the principle that the previous year is not higher than the current year.
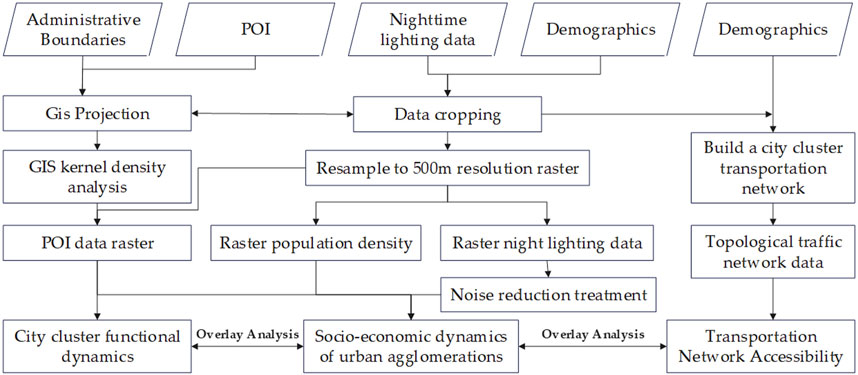
FIGURE 2. Data preprocessing and flowchart.
This paper draws on the POI data sideloading method of urban vitality based on population density data weighting proposed in the literature to measure the vitality of urban functional facilities. With the help of the ArcGIS map algebra tool superimposed on population density data, the raster data of functional facility vitality of Lanzhou–Xining urban agglomeration are obtained (Bagan and Yamagata, 2015). The urban functional vitality formula is as follows:
where
To more intuitively represent the specific data and changes in the vitality of functional facilities in each county, this study chooses the statistics of urban vitality intensity to characterize the vitality of functional facilities in counties and districts. The intensity of urban vitality refers to the overall strength of urban vitality within a given region, which we portray in this study as the total functional facility vitality.
People are the producers of urban vitality, and the essence of urban vitality is in gathering people and their continuous activities in space. A densely distributed population is the prerequisite and the most direct characterization of a city’s vitality. This paper calculates the neighborhood population density based on population grid data to characterize population vitality (Xu, 2021). Population data and nighttime lighting data complement each other in characterizing the socioeconomic vitality of the city.
where
In this study, we have chosen to characterize the level of socioeconomic vitality of the district and county by the sum of socioeconomic vitality scales. The calculation formula is
where
The comprehensive urban vitality can comprehensively reflect the urban agglomeration’s development level and facilitate the calculation of the subsequent coupling coordination. We adopt the level of comprehensive urban vitality to evaluate the developmental state of urban vitality in the urban agglomeration, and the calculation formula is as follows:
where
As shown in Figure 3, when we preprocessed the road and rail transportation network data, we found that the two network layers were not directly connected. The road network nodes is often located at the road intersection, while the railroad transportation station is mainly close to the road section. Therefore, we take the railroad transportation station as the node and the neighboring road transportation edge to construct a new topological transportation network node to realize the connection between the road transportation network and the rail network. On this basis, we constructed a topological land transportation network in the Lanzhou–Xining urban agglomeration, and we analyzed the centrality of the urban agglomeration transportation network with the help of the Spatial Design Network Analysis (sDNA) tool (Jin et al., 2017; Gao et al., 2022).

FIGURE 3. Schematic diagram of urban agglomeration transportation topology network model construction: (A) road traffic network; (B) railway network; (C) topological Traffic Network.
Proximity represents the degree of difficulty for a road network to reach the rest of the road networks within the search radius, and road networks with high proximity usually have higher topological integration ability and centrality, and the corresponding traffic flow is also higher. Comparative studies have advanced the selection of network quantity penalized by Distance (NQPD) to measure proximity metrics (Cooper and Chiaradia, 2020; Ma, 2020) because the formula considers both the quality and quantity of the network. The proximity NQPD formula is as follows:
where
The penetration degree mainly refers to the probability of traffic flow through a section of a road within the coverage of the search radius, and the higher its value, the stronger the accessibility to the road section. Different from the traditional spatial syntax, the total number of nodes within the search radius is used in the sDNA model to standardize the parameters and obtain the two-phase betweenness (TPBt) parameter, which is used to measure the network’s traffic carrying capacity and passability (Kang, 2017; Wu et al., 2023). The calculation formula is as follows:
where
The coupling degree is used to indicate the degree of association between parts within or between systems (Sarkar et al., 2015).
where
In some cases, the coupling degree cannot reflect the synergistic effect of the land transportation network and node urban vitality level. Therefore, we adopt the coordination degree model to determine the degree of the coupling coordination development of transportation and economy.
where
Referring to the existing studies on the coupled and coordinated development division method (Xing et al., 2019; Du et al., 2022), the coupling coordination type of the transportation network and urban vitality is classified as shown in Table 1 below.

TABLE 1. Classification of coupling coordination types.
The vitality of urban facilities in the Lanzhou–Xining urban agglomeration has generally improved over the past decade. However, the overall vitality level in the urban agglomeration could be higher. In 2012, the vitality of the urban functional facility in the Lanzhou–Xining urban agglomeration was 0.023, and it reached 0.094 in 2021, an increase of 75.61%. The maximum values of functional facility vitality in 2012, 2015, 2018, and 2021 were 0.255, 0.561, 0.741, and 0.999, respectively, and the minimum values were 0.0001, 0.0003, 0.0005, and 0.0004, respectively. The level of facility vitality in the county-level space inside the urban agglomeration varied greatly each year, showing an uneven distribution of facilities, and the internal polarization phenomenon continued, which may be a reason affecting the unbalanced development within the Lanzhou–Xining urban agglomeration. From the point of view of the average value, the average values of functional facility vitality were 0.0023, 0.0048, 0.0062, and 0.0094, respectively. As of 2021, the functional facility vitality still did not exceed 0.1, indicating the value in the past 10 years. However, the number and distribution of facilities in the county-level areas within the urban agglomeration have significantly increased. The vitality has significantly improved, but the overall functional facility vitality is still low, and the scale effect is not apparent. Compared with the urban agglomerations in eastern China, the Lanzhou–Xining urban agglomeration is still in the lower-vitality interval.
Figure 4 shows the spatiotemporal distribution of the functional vitality of county-level spaces in the urban agglomeration from 2012 to 2021. We have classified the vitality scale into five categories according to the level of vitality values: low vitality (vitality value <0.05), lower vitality (vitality value between 0.1 and 0.15), medium vitality (vitality value between 0.15 and 0.2), higher vitality (vitality value between 0.2 and 0.25), and high vitality (vitality value >0.25). In 2012, only one area had higher vitality in the Lanzhou–Xining urban agglomeration, i.e., the Chengguan District of Lanzhou City (T = 0.255). By 2021, the number of high-vitality areas increased to 5, namely, the Chengguan District of Lanzhou City (T = 1.000), Qilihe District (T = 0.530), Chengdong District of Xining City (T = 0.453), Chengxi District, and Chengzhong District (T = 0.360). These areas are mainly concentrated in the two provincial capitals, indicating that Lanzhou and Xining, the two provincial capitals, have long been the gathering areas of regional population and economy, forming two prominent high-vitality centers. The vitality scale difference with the surrounding cities is significant, further verifying the characteristics of the polarization phenomenon within the urban agglomeration. In addition, from the perspective of the districts and counties under the jurisdiction of the two core cities, the scale of urban functional facility vitality in Lanzhou City is overall higher than that in Xining City.
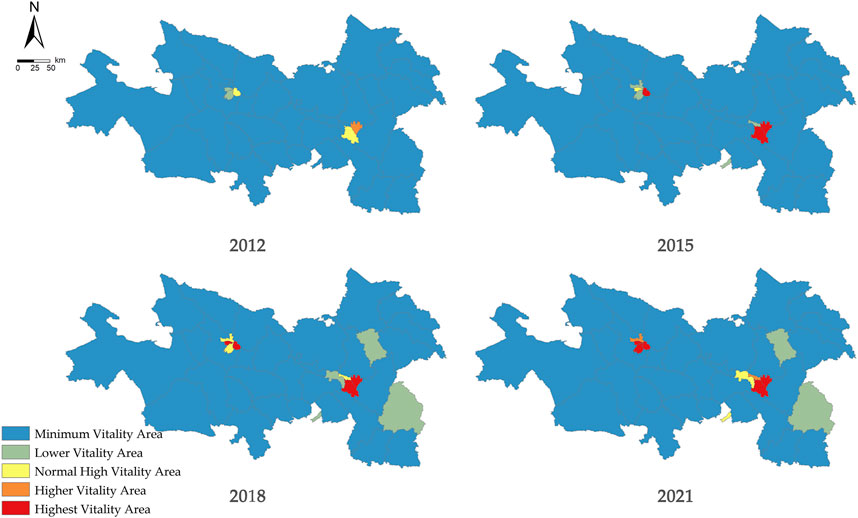
FIGURE 4. Spatial and temporal distribution of functional facility vitality intensity in the Lanzhou–Xining urban agglomeration.
Analyzing the distribution of low-vitality areas in the county-level space of the Lanzhou–Xining urban agglomeration from 2012 to 2021, the numbers of low-vitality county-level spaces are 34, 31, 28, and 28, respectively. The total number has decreased from 87% to 72%, indicating that the region’s overall facility distribution and quantity are constantly improving. In recent years, with the continuous implementation of China’s new urbanization and industrial upgrading, especially Linxia City (increased from 0.022 to 0.12), Baiyin District of Baiyin City (increased from 0.02 to 0.08), and Anding District of Dingxi City (increased from 0.03 to 0.08), the facility vitality has been significantly improved, with an average annual growth rate of over 43%. These areas have played a gathering-and-driving effect in developing county-level spaces in urban agglomerations and may become new centers for facility distribution and population aggregation. For “weak-weak” alliance-type urban agglomerations with extremely unbalanced development, these new centers must allocate regional facilities reasonably and guide functional displacement distribution reasonably to avoid the impact of existing high-vitality cores and grow into new vitality centers.
Overall, the average socioeconomic vitality values of the Lanzhou–Xining urban agglomeration in 2012, 2015, 2018, and 2021 were 0.114, 0.116, 0.129, and 0.138, respectively. The average growth rate was over 7%, higher than the national average, but the vitality is still relatively low. However, as shown in Figure 5, the high-vitality areas are mainly concentrated in the county-level spaces under the jurisdiction of Lanzhou City and Xining City, and they still show a “core-periphery” distribution feature in space, forming two core high-vitality clusters in Lanzhou and Xining. The difference is that the spatial distribution of socioeconomic vitality is more concentrated and gradually extends to peripheral county towns. This indicates that when the population and economy in the core cities within the urban agglomeration reach a particular scale, they will expand and extend to peripheral county-level spaces. Since 2015, the socioeconomic vitality of Pingchuan District and Yuzhong County in Baiyin City, Gansu Province, and Datong County and Huangzhong County in Qinghai Province, which are around the two core cities of Lanzhou and Xining, has increased significantly. They have gradually formed an economic circle that expands outward from the core cities. In addition, the average growth rate of socioeconomic vitality in Ledu District and Ping’an District of Haidong City, Huxiang County, Minhe County, Honggu District of Lanzhou City, and Yongdeng County, which are between the “dual-core” cities of Lanzhou and Xining, is over 20%, providing a basis for the integration of the urban agglomeration. Despite this, we found that the number of cities with higher vitality levels in the Lanzhou–Xining urban agglomeration accounts for only approximately 10% of the total; the number of low-vitality cities is the most, accounting for approximately 86% of the total; and the number of cities in the medium-vitality level is only approximately 7%. It is clear that core cities mainly dominate urban vitality in the Lanzhou–Xining urban agglomeration, and the contradictions of unbalanced socioeconomic development are still prominent. Yongjing County and Gaolan County, close to Lanzhou City, had socioeconomic vitalities of only 0.027 and 0.042 in 2021, respectively, belonging to extremely low-vitality areas. From this, we can surmise that the phenomenon of “lights out” in urban agglomerations will continue for small towns that do not have the advantage of infrastructure and industry. The continuation of this phenomenon is likely to lead to the return of small towns to poverty or their gradual devouring by large cities.
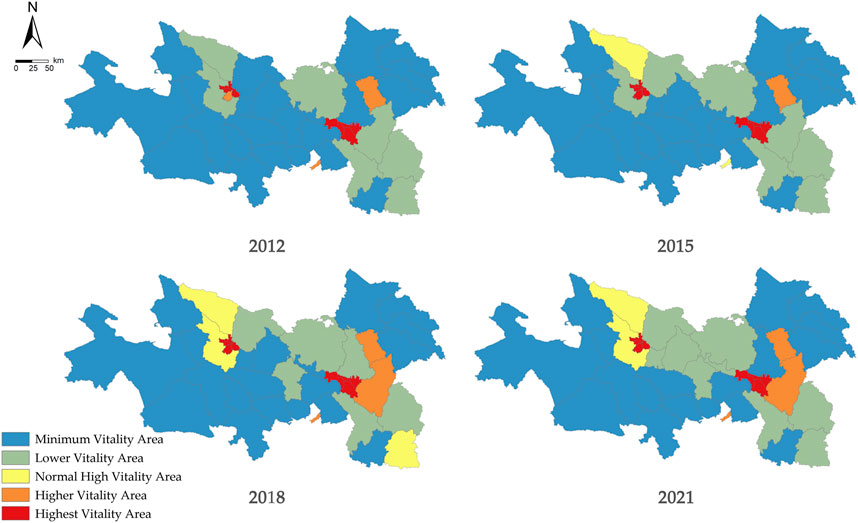
FIGURE 5. Spatiotemporal characteristics of socioeconomic vitality intensity in the Lanzhou–Xining urban agglomeration.
Comparing the functional vitality of the urban agglomeration, the socioeconomic vitality of the Lanzhou–Xining urban agglomeration shows a more concentrated distribution feature in space, which also conforms to the general law of socioeconomic development. County-level spaces around big cities will be gradually driven to form clusters of a particular scale. The formation of a dual-core metropolitan area has effectively avoided the “one city dominates” siphon effect formed by a single-core city, which is conducive to the Lanzhou–Xining urban agglomeration forming a “dual-core” to “multi-core” dispersion and then producing a trickle-down effect, achieving overtaking on a curve.
Figure 6 shows the changes in the vitality of urban agglomeration facilities, socioeconomic vitality, and comprehensive vitality in the Lanzhou–Xining urban agglomeration from 2012 to 2021. We find that urban agglomeration dynamism has been increasing over the last decade. Linear regression found that the comprehensive growth rate was 0.85%, and R2=0.083, indicating that the comprehensive vitality of the Lanzhou–Xining urban agglomeration is in the growth stage. By 2021, the comprehensive vitality value was 0.138, which is generally at a low-vitality level, and the vitality level of county-level towns is generally not high.
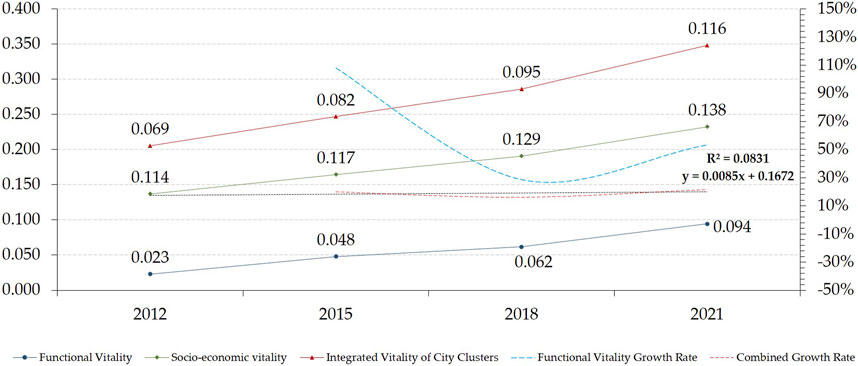
FIGURE 6. Spatiotemporal characteristics of socioeconomic vitality intensity in the Lanzhou–Xining urban agglomeration.
Looking at the vitality distribution of county-level towns, whether it is the functional vitality of the urban agglomeration or socioeconomic vitality, there is a considerable gap between the vitality level of the core cities and other cities in the region, the polarization phenomenon is prominent, and the hierarchical structure is clear. The number of high-vitality areas increased from 3 in 2012 to 8 in 2021. Areas with high levels of urban vitality are located in the central urban areas of the two core cities of Lanzhou and Xining. The number of cities with higher vitality levels decreased from 4 in 2012 to 1. Anning District and Xigu District of Lanzhou City and Chengdong District and Chengzhong District of Xining City are high-vitality areas. The newly added high-vitality area is the only one in Linxia City. The number of towns in the low-vitality level accounts for 86% of the total because the urban vitality structure is constrained by factors such as administrative hierarchy, and there is an obvious disconnection caused by the low degree of synergism between the vitality of towns in the county. Therefore, improving the vitality level of the peripheral towns of the Lanzhou–Xining urban agglomeration will remain a top priority in breaking the urban–rural dichotomy and guiding the synergistic development of the inner urban agglomeration.
Figure 7 shows the curve of the change in the transportation network density of the Lanzhou–Xining urban agglomeration. We found that the density of the transportation network has significantly increased. Density growth mainly occurred in 2012–2018 and 2018–2021. From 2012 to 2018, the overall density of the Lanzhou–Xining urban agglomeration multiplied, with an average growth rate exceeding 30%, among which Anning District of Lanzhou City, Chengdong District, and Chengzhong District of Xining City had the highest growth rate in overall density the fastest. After 2018, with the completion of large-scale infrastructure construction in China and changes in population growth, the national policy support for transportation infrastructure was also adjusted, and the transportation network of the Lanzhou–Xining urban agglomeration entered a stage of connotative development. In this stage, the transportation network density growth rate slowed down.
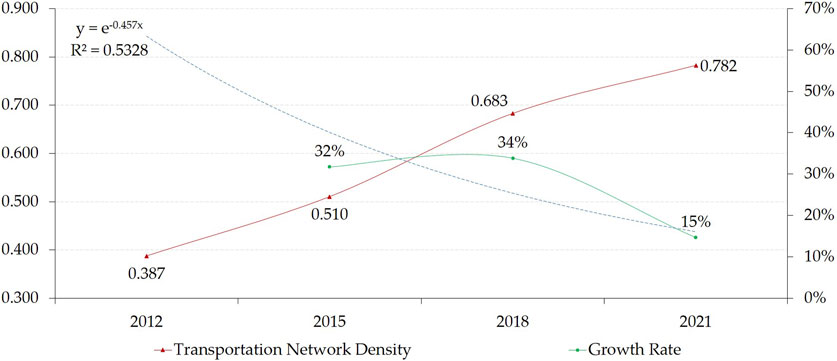
FIGURE 7. Evolutionary trend of land transportation network density in the Lanzhou–Xining urban agglomeration.
Overall, the transportation network density of the Lanzhou–Xining urban agglomeration is at a medium-to-low level, and the overall network density in 2021 was 0.68 km/km2, slightly lower than that of the national urban agglomeration transportation network. From a spatial distribution perspective, areas with higher transportation network density are mainly distributed in the central areas of Lanzhou and Xining. Counties such as Linxia present a radial network structure that expands outward from the concentrated distribution. The transportation network density of the Lanzhou–Xining urban agglomeration presents a “strong east and weak west” situation in space. In 2012, the transportation network density in the northwest and southeast was higher and decreased outward from its core, forming a “valley” in the transition area from the central to the northeast and southwest. Compared with 2012, after 2018, areas with high transportation network density were mainly located along the “dumbbell-shaped development axis” between Lanzhou and Xining and decrease to the southeast and northwest from the central axis.
Figure 8A shows the degree of attraction of county-level towns in the urban agglomeration to the surrounding town population. Towns with high proximity in the transportation network of the Lanzhou–Xining urban agglomeration are mainly concentrated in the central areas of Lanzhou and Xining, forming two evident “dual cores.” After 2015, with the construction of the Lanzhou–Xinjiang Railway, Lanzhou–Chongqing Railway, West Chengdu Railway, Lianyungang–Horgos Expressway, and G75, the density of the transportation network has increased. By 2021, the overall network of the urban agglomeration has formed a “dual-core multi-node” spatial structure. The transportation network accessibility of county-level towns such as Lanzhou New Area, Yongdeng County, and Pingchuan District of Baiyin City has continuously increased.

FIGURE 8. Spatial and temporal distribution of land transportation network accessibility in the Lanzhou–Xining urban agglomeration: (A) spatial distribution of transportation network proximity; (B) spatial distribution of transportation network penetration.
Furthermore, by looking at the probability of population and resource flow in the urban agglomeration, as shown in Figure 8B, the mainline highways and railways between Lanzhou and Xining, the two core cities, have become the “backbone” of resource flow in the Lanzhou–Xining urban agglomeration. This line connects the central urban areas of Lanzhou and Xining and the intermediate Haidong City and Minhe County to form the primary transportation corridor of the urban agglomeration, extending to both ends. After 2015, Haiyan County, Yuzhong County, and Anding District also joined this “backbone,” indicating that the external contacts and transportation attractiveness of the Lanzhou–Xining urban agglomeration have improved. At the same time, the north–south routes connecting the core cities also formed two secondary transportation corridors, indicating that with the improvement of the transportation network, the connections between county-level towns within the urban agglomeration and the core cities have become more intimate.
Figure 9 shows the changing trend of the accessibility of the transportation network and the comprehensive vitality of cities in some county-level towns of the Lanzhou–Xining urban agglomeration. Overall, the transportation network and the urban vitality system have maintained a steady upward trend, indicating that the two systems maintain a synergistic development trend. However, compared to the urban vitality system, the transportation network system develops faster, and the overall level of the transportation network system is higher than that of the urban vitality system. With time, the gap between the two systems is expanding further. Over the 10 years from 2012 to 2021, the transportation network and urban vitality systems in the 39 counties and districts in the Lanzhou–Xining urban agglomeration region showed a synergistic and upward development trend. In particular, after 2015, the transportation network systems and urban vitality systems in the counties and districts have been rapidly improved, especially the development of the transportation network system. This is particularly evident in Anning District, Chengguan District, Yongdeng County of Lanzhou, Chengbei District, Chengdong District, and Chengxi District of Xining, among others.
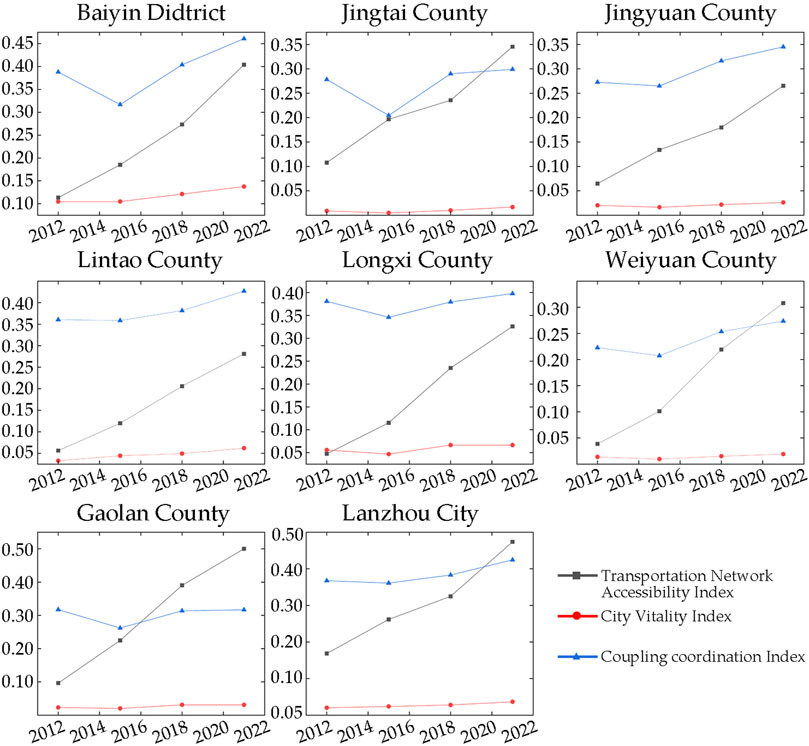
FIGURE 9. Evolutionary trend of the coupling coordinated evolution of the transportation network and urban vitality in counties and districts.
The calculation results of the coupling coordination degree are shown in Table 2. The coupling degree of the county-level city transportation network and urban vitality in the Lanzhou–Xining urban agglomeration increased from 0.586 in 2012 to 0.635 in 2021, indicating that the transportation network in the Lanzhou–Xining urban agglomeration promoted the development of urban vitality. The coordination degree increased from 0.314 in 2012 to 0.399 in 2021, an increase rate of approximately 17%, showing an upward trend, indicating that the synergistic development between the transportation network and urban vitality in the Lanzhou–Xining urban agglomeration is gradually improving. However, it is still in a stage of slight imbalance. From the perspective of long-term trends, the coupling coordinated relationship between transportation and urban vitality is gradually transitioning from uncoordinated development to transformational development. However, a more significant gap in coordinated development must still be addressed.
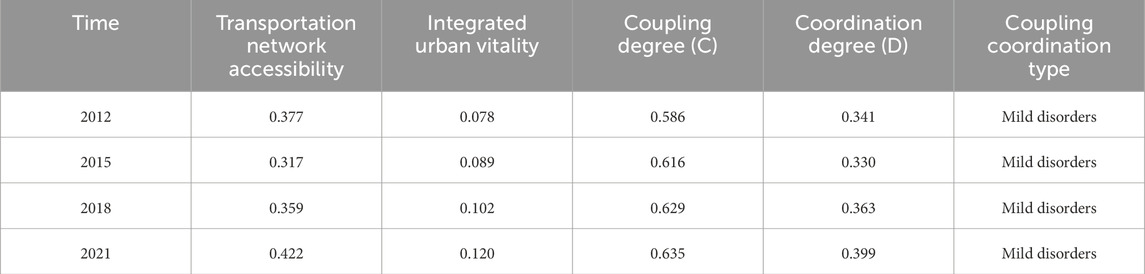
TABLE 2. Results of the coupling coordination degree of transportation network accessibility and urban vitality in counties of the Lanzhou–Xining urban agglomeration.
This study focuses on the coordinated development within urban agglomerations, using POI and nighttime light data to measure the facility vitality and socioeconomic vitality of county-level towns in the urban agglomeration, objectively reflecting the socioeconomic development of the urban agglomeration. We construct an evaluation index system for the interactive relationship between transportation and vitality in county-level towns in urban agglomerations to explore the coupling coordination relationship between transportation network accessibility and urban vitality in the Lanzhou–Xining urban agglomeration. However, urban vitality is related to the development issues of each county-level town within the urban agglomeration; especially factors such as rank, location, population, and environment affect the formation and sustainability of urban vitality (Nistor and Popa, 2014; Li et al., 2022; Zhang et al., 2023). Most studies believe that transportation network accessibility promotes the development of urban agglomerations, but some studies also believe that increased investment in transportation infrastructure is a factor that exacerbates polarization within urban agglomerations (He et al., 2018; Du et al., 2022). The economic and resource advantages of core cities, such as employment, schooling, and medical care, have led to a large amount of population and resources gathering in core cities, resulting in the unbalanced development of county-level towns in urban agglomerations (Gauthier, 1968). This study measures the degree of coupling coordination through 10 years of data. We hope to promote the balanced development of county-level towns in the urban agglomeration through the interaction of “context” and “matrix.” This balance and coordination are not limited to the movement of population and the distribution of resources. More importantly, after the core cities develop to a particular stage, they “feedback” the peripheral small towns, which can achieve the orderly flow of resources between the core cities and small towns.
On the other hand, technological innovation (Cascetta et al., 2020), industrial structure (Xiong et al., 2021), cultural heritage (Chen et al., 2022), land use (Still and Simmonds, 2000), and policy factors (Chen et al., 2018) are also important indicators of the facility function and socioeconomic vitality of urban agglomerations, which are of practical significance for measuring the development of urban agglomerations. In addition, the Chinese government has strongly advocated new urbanization and rural revitalization in recent years, providing policy support for the vitality shaping of county-level towns. Future research can pay more attention to the vitality of county-level towns by constructing fair and efficient facilities and service configurations to improve the coordinated development of transportation and socioeconomics in county-level towns.
This study contributes to the existing research in several ways. First, our study extends the research on urban vitality from the micro-urban level to the urban-agglomeration level. Second, by introducing POI, nighttime light, and population data, our study expands on previous studies that used a single indicator to represent urban vitality. Third, our study examines the dynamic evolution of the accessibility of the urban agglomeration transportation network and urban vitality over time. It analyzes the symbolic characteristics of various aspects of urban development rather than treating it as a static phenomenon. In addition, it is widely recognized that urban agglomeration transportation impacts various aspects such as socioeconomics, culture, and industry (Montgomery, 1995; Yang et al., 2021). However, there needs to be clear quantitative research on whether the construction and development of transportation infrastructure under the perspective of urban agglomerations is coupled and coordinated with the formation of urban vitality. We have supplemented this point in our study (Zhang et al., 2020; Makkonen and Kahila, 2021).
Despite our thorough research on the coupling relationship between the transportation network and urban vitality in urban agglomerations, certain limitations still exist:
1. In constructing the urban vitality evaluation system, our study only considers parameters related to urban development, needing more consideration of factors such as the urban ecological environment and quality. The natural feelings of urban residents, as the city’s main body, toward the city’s built environment are also a direction for our study to evaluate urban vitality.
2. Due to data collection constraints, this study only uses POI and nightlight data, making it difficult to measure the population mobility trend within the urban agglomeration. Future studies can add data reflecting spatial mobility in urban agglomerations, such as mobile phone signal data, ticket purchase data, and highway traffic flow data, to more accurately depict the quality of vitality.
3. This study only measures the coupling degree of the transportation network and urban vitality. However, it is difficult to objectively reflect the impact and role of transportation network accessibility on urban vitality.
In future research, the mechanism of transportation network accessibility indicators affecting urban vitality can be revealed through models such as spatial autocorrelation, providing policy guidance for better serving urban planning.
This study uses multi-source data to measure the urban vitality and transportation network of the Lanzhou–Xining urban agglomeration, based on the evaluation indicators of urban vitality and land transportation network; constructs a coupling coordination evaluation system of the land transportation network and urban vitality; and explores its spatiotemporal coupling characteristics. We found that
(1) The high-value areas of the density and accessibility of the land transportation network in the Lanzhou–Xining urban agglomeration are mainly distributed east of the Lanzhou–Xining transportation line. From 2012 to 2021, both the density and accessibility of the transportation network within the Lanzhou–Xining urban agglomeration had greatly improved, and a “ridge line” has formed along the Lanzhou–Xining line. This ridge line has the highest transportation accessibility and urban vitality within the agglomeration. However, it also acts as a “watershed” that restricts the development of the dual-city metropolitan area toward a multi-centered network.
(2) The urban vitality of the Lanzhou–Xining urban agglomeration is generally low, mainly reflected in the high proportion of low-vitality cities and the small distribution range of high-vitality cities. The development of cities is not balanced, and the phenomenon of polarization of urban vitality is particularly prominent, with a significant “core-edge” structure. The two “strong cores” of Lanzhou and Xining have much higher vitality indexes than other cities in the urban agglomeration.
(3) The coupling characteristics of the transportation network development and urban vitality of the Lanzhou–Xining urban agglomeration are not prominent and are still in a significant state of imbalance. As of 2021, only some counties and districts of the core cities within the Lanzhou–Xining urban agglomeration have entered the coordination stage. Other counties and districts are still in a state of imbalance, and the development of the transportation network needs to catch up to the level of urban vitality. The role of the land transportation network in enhancing urban vitality has yet to emerge.
Our research expands on the existing studies on urban agglomeration vitality by dynamically examining different aspects of urban vitality and development rather than discussing urban vitality from a static perspective against a broad backdrop. Investigating the coupling coordination relationship between the transportation network and urban vitality in urban agglomerations can provide new insights into the coordinated development of multiple elements within urban agglomerations. In addition, urban vitality may be affected by factors such as regional environmental quality, population mobility, economic development, and regional public service allocation, which directly or indirectly affect the economic, demographic, and social vitality of urban agglomerations. Future research might explore the different spatial elements affecting the development of urban agglomerations through the fusion perspective of multivariate data.
The original contributions presented in the study are included in the article/Supplementary Material; further inquiries can be directed to the corresponding author.
MY: conceptualization, funding acquisition, methodology, project administration, validation, writing–original draft, and writing–review and editing. YQ: conceptualization, funding acquisition, project administration, writing–review and editing, and supervision. XL: validation, visualization, and writing–review and editing. ZL: data curation, software, visualization, and writing–original draft. JZ: data curation, supervision, and writing–review and editing.
The author(s) declare financial support was received for the research, authorship, and/or publication of this article. This research was funded by the Social Science Foundation of Gansu (2021YB058), the Natural Science Foundation of Gansu Province (23JRRA904), the Gansu Provincial Department of Science and Technology: Natural Science Foundation (Outstanding Doctoral Students) Project (23JRRA906), the National Social Science Foundation of China (15BJY037; 14CJY052), “Double-First Class” Major Research Programs, Educational Department of Gansu Province (GSSYLXM-04), the Gansu Province Key R&D Program-Industry (21YF5GA052), the Gansu Higher Educational Institutions Industry Support Program (2021CYZC-60), and Lanzhou Jiaotong University–Tianjin University Joint Innovation Fund project (2021057).
The authors thank the editor and reviewers for their valuable insights and suggestions.
The authors declare that the research was conducted in the absence of any commercial or financial relationships that could be construed as a potential conflict of interest.
All claims expressed in this article are solely those of the authors and do not necessarily represent those of their affiliated organizations, or those of the publisher, the editors, and the reviewers. Any product that may be evaluated in this article, or claim that may be made by its manufacturer, is not guaranteed or endorsed by the publisher.
Bagan, H., and Yamagata, Y. (2015). Analysis of urban growth and estimating population density using satellite images of nighttime lights and land-use and population data. GIScience Remote Sens. 52 (6), 765–780. doi:10.1080/15481603.2015.1072400
Cascetta, E., Cartenì, A., Henke, I., and Pagliara, F. (2020). Economic growth, transport accessibility and regional equity impacts of high-speed railways in Italy: ten years ex post evaluation and future perspectives. Transp. Res. Part A Policy Pract. 139, 412–428. doi:10.1016/j.tra.2020.07.008
Chen, J., Li, J., He, J., and Li, Z. (2002). Development of geographic information systems (GIS) in China: an overview. Photogrammetric Eng. remote Sens. 68 (4), 325–332.
Chen, Y., Xi, M., Liao, K., and Wang, F. (2018). The relationship between economic growth and the development of industrial cluster and city group. Int. J. Technol. Policy Manag. 18 (2), 155–163. doi:10.1504/ijtpm.2018.092297
Chen, Z., Dong, B., Pei, Q., and Zhang, Z. (2022). The impacts of urban vitality and urban density on innovation: evidence from China's Greater Bay Area. Habitat Int. 119, 102490. doi:10.1016/j.habitatint.2021.102490
Chen, Z., and Haynes, K. E. (2017). Impact of high-speed rail on regional economic disparity in China. J. Transp. Geogr. 65, 80–91. doi:10.1016/j.jtrangeo.2017.08.003
Chen, Z., Yu, B., Ta, N., Shi, K., Yang, C., Wang, C., et al. (2019). Delineating seasonal relationships between Suomi NPP-VIIRS nighttime light and human activity across Shanghai, China. IEEE J. Sel. Top. Appl. Earth Observations Remote Sens. 12 (11), 4275–4283. doi:10.1109/jstars.2019.2916323
Cooper, C. H., and Chiaradia, A. J. (2020). sDNA: 3-d spatial network analysis for GIS, CAD, Command Line and Python. SoftwareX 12, 100525. doi:10.1016/j.softx.2020.100525
Cui, X., Fang, C., Wang, Z., and Bao, C. (2019). Spatial relationship of high-speed transportation construction and land-use efficiency and its mechanism: case study of Shandong Peninsula urban agglomeration. J. Geogr. Sci. 29, 549–562. doi:10.1007/s11442-019-1614-1
Du, P., Wang, Z., and Gamburg, E. (2015). Tall buildingd as extensions of urban infrastructure and vitality. CTBUH J. 4, 46–51.
Du, Q., Wang, X., Li, Y., Zou, P. X., Han, X., and Meng, M. (2022). An analysis of coupling coordination relationship between regional economy and transportation: empirical evidence from China. Environ. Sci. Pollut. Res. 29 (23), 34360–34378. doi:10.1007/s11356-022-18598-0
Elvidge, C. D., Zhizhin, M., Ghosh, T., Hsu, F.-C., and Taneja, J. (2021). Annual time series of global VIIRS nighttime lights derived from monthly averages: 2012 to 2019. Remote Sens. 13 (5), 922. doi:10.3390/rs13050922
Fang, C. (2015). Important progress and future direction of studies on China’s urban agglomerations. J. Geogr. Sci. 25, 1003–1024. doi:10.1007/s11442-015-1216-5
Findlay, A., and Sparks, L. (2009). Literature review: policies adopted to support a healthy retail sector and retail led regeneration and the impact of retail on the regeneration of town centres and local high streets.
Gao, Q., Peng, S., Lu, X., and Yin, Y. (2022). “Evaluation of the economic vitality of the nine cities and prefectures in Guizhou Province based on the entropy weight-TOPSIS method. 2022 IEEE 6th Information Technology and Mechatronics Engineering Conference (ITOEC), Gauthier, H. L. (1968). Transportation and the growth of the Sao Paulo economy,” in Transport and development (Springer), 167–189.
He, Q., He, W., Song, Y., Wu, J., Yin, C., and Mou, Y. (2018). The impact of urban growth patterns on urban vitality in newly built-up areas based on an association rules analysis using geographical big data. Land Use Policy 78, 726–738. doi:10.1016/j.landusepol.2018.07.020
Hillier, B., Leaman, A., Stansall, P., and Bedford, M. (1976). Space syntax. Environ. Plan. B Plan. Des. 3 (2), 147–185. doi:10.1068/b030147
Jin, X., Long, Y., Sun, W., Lu, Y., Yang, X., and Tang, J. (2017). Evaluating cities' vitality and identifying ghost cities in China with emerging geographical data. Cities 63, 98–109. doi:10.1016/j.cities.2017.01.002
Jin, Y., Liu, Y., and Feng, Q. (2020). Evaluation of urban economic vitality based on principal component analysis. Front. Soc. Sci. Technol. 2 (5).
Kang, C.-D. (2017). Measuring the effects of street network configurations on walking in Seoul, Korea. Cities 71, 30–40. doi:10.1016/j.cities.2017.07.005
Kim, T. J., Ham, H., and Boyce, D. E. (2002). Economic impacts of transportation network changes: implementation of a combined transportation network and input-output model. Pap. Regional Sci. 81 (2), 223–246. doi:10.1007/s101100100101
Lan, F., Gong, X., Da, H., and Wen, H. (2020). How do population inflow and social infrastructure affect urban vitality? Evidence from 35 large-and medium-sized cities in China. Cities 100, 102454. doi:10.1016/j.cities.2019.102454
Langford, M., Higgs, G., Radcliffe, J., and White, S. (2008). Urban population distribution models and service accessibility estimation. Comput. Environ. Urban Syst. 32 (1), 66–80. doi:10.1016/j.compenvurbsys.2007.06.001
Li, X., Li, Y., Jia, T., Zhou, L., and Hijazi, I. H. (2022). The six dimensions of built environment on urban vitality: fusion evidence from multi-source data. Cities 121, 103482. doi:10.1016/j.cities.2021.103482
Li, X., Qian, Y., Zeng, J., Wei, X., and Guang, X. (2021). The influence of Strip-City street network structure on spatial vitality: case studies in Lanzhou, China. Land 10 (11), 1107. doi:10.3390/land10111107
Liang, Y., Song, W., and Dong, X. (2021). Evaluating the space use of large railway hub station areas in Beijing toward integrated station-city development. Land 10 (11), 1267. doi:10.3390/land10111267
Liu, H., Gou, P., and Xiong, J. (2022). Vital triangle: a new concept to evaluate urban vitality. Comput. Environ. Urban Syst. 98, 101886. doi:10.1016/j.compenvurbsys.2022.101886
Lunecke, M. G. H., and Mora, R. (2018). The layered city: pedestrian networks in downtown Santiago and their impact on urban vitality. J. Urban Des. 23 (3), 336–353. doi:10.1080/13574809.2017.1369869
Ma, F. (2020). Spatial equity analysis of urban green space based on spatial design network analysis (sDNA): a case study of central Jinan, China. Sustain. Cities Soc. 60, 102256. doi:10.1016/j.scs.2020.102256
Ma, T., Zhou, C., Pei, T., Haynie, S., and Fan, J. (2014). Responses of Suomi-NPP VIIRS-derived nighttime lights to socioeconomic activity in China’s cities. Remote Sens. Lett. 5 (2), 165–174. doi:10.1080/2150704x.2014.890758
Makkonen, T., and Kahila, P. (2021). Vitality policy as a tool for rural development in peripheral Finland. Growth change 52 (2), 706–726. doi:10.1111/grow.12364
Montgomery, J. (1995). Editorial urban vitality and the culture of cities. London, England: Taylor and Francis. 10, pp. 101–110.
Niu, F., Yang, X., and Wang, F. (2020). Urban agglomeration formation and its spatiotemporal expansion process in China: from the perspective of industrial evolution. Chin. Geogr. Sci. 30, 532–543. doi:10.1007/s11769-020-1094-3
Nundy, S., Ghosh, A., Mesloub, A., Albaqawy, G. A., and Alnaim, M. M. (2021). Impact of COVID-19 pandemic on socio-economic, energy-environment and transport sector globally and sustainable development goal (SDG). J. Clean. Prod. 312, 127705. doi:10.1016/j.jclepro.2021.127705
O'Brien, J. (2021). Regional planning in China: the lanzhou-xining urban cluster plan and development outcomes. Washington, D.C., United States: Georgetown University.
Ren, Y., Tian, Y., and Xiao, X. (2022). Spatial effects of transportation infrastructure on the development of urban agglomeration integration: evidence from the Yangtze River Economic Belt. J. Transp. Geogr. 104, 103431. doi:10.1016/j.jtrangeo.2022.103431
Row, A. T. (1962). The death and life of great american cities. The Modern Library, New York, United States: JSTOR.
Sarkar, C., Webster, C., Pryor, M., Tang, D., Melbourne, S., Zhang, X., et al. (2015). Exploring associations between urban green, street design and walking: results from the Greater London boroughs. Landsc. Urban Plan. 143, 112–125. doi:10.1016/j.landurbplan.2015.06.013
Si, L., Wang, J., Yang, S., Yang, Y., and Zhang, J. (2021). Urban green development towards sustainability in northwest China: efficiency assessment, spatial-temporal differentiation characters, and influencing factors. Complexity 2021, 1–19. doi:10.1155/2021/6630904
Still, B., and Simmonds, D. (2000). Parking restraint policy and urban vitality. Transp. Rev. 20 (3), 291–316. doi:10.1080/014416400412823
Sun, Q., Tang, F., and Tang, Y. (2015). An economic tie network-structure analysis of urban agglomeration in the middle reaches of Changjiang River based on SNA. J. Geogr. Sci. 25, 739–755. doi:10.1007/s11442-015-1199-2
Sung, H., and Lee, S. (2015). Residential built environment and walking activity: empirical evidence of Jane Jacobs’ urban vitality. Transp. Res. Part D Transp. Environ. 41, 318–329. doi:10.1016/j.trd.2015.09.009
Swisher IV, S. N. (2017). Reassessing railroads and growth: accounting for transport network endogeneity.
Tan, M. (2017). Uneven growth of urban clusters in megaregions and its policy implications for new urbanization in China. Land Use Policy 66, 72–79. doi:10.1016/j.landusepol.2017.04.032
Tong, H., Shi, P., Luo, J., and Liu, X. (2020). The structure and pattern of urban network in the Lanzhou-Xining urban agglomeration. Chin. Geogr. Sci. 30, 59–74. doi:10.1007/s11769-019-1090-7
Tong, T., and Wei, Z. (2018). “Study on the coupling development of urban agglomerations and industry clusters in the perspective of spatial flow-take 4 provinces in Western China as an example,” in 2018 26th International Conference on Geoinformatics.
Waldner, L., and Smith, R. M. (2015). The great defection: how new city clusters form to escape county governance. Public Adm. Q., 170–219.
Wang, R., Wan, B., Guo, Q., Hu, M., and Zhou, S. (2017). Mapping regional urban extent using NPP-VIIRS DNB and MODIS NDVI data. Remote Sens. 9 (8), 862. doi:10.3390/rs9080862
Wang, Z., Ma, D., Sun, D., and Zhang, J. (2021). Identification and analysis of urban functional area in Hangzhou based on OSM and POI data. PLoS one 16 (5), e0251988. doi:10.1371/journal.pone.0251988
Wilkinson, S. M., Dunn, S., and Ma, S. (2012). The vulnerability of the European air traffic network to spatial hazards. Nat. hazards 60, 1027–1036. doi:10.1007/s11069-011-9885-6
Wu, C., Zhao, M., and Ye, Y. (2023). Measuring urban nighttime vitality and its relationship with urban spatial structure: a data-driven approach. Environ. Plan. B Urban Anal. City Sci. 50 (1), 130–145. doi:10.1177/23998083221108191
Xia, C., Zhang, A., and Yeh, A. G. (2022). The varying relationships between multidimensional urban form and urban vitality in Chinese megacities: insights from a comparative analysis. Ann. Am. Assoc. Geogr. 112 (1), 141–166. doi:10.1080/24694452.2021.1919502
Xing, L., Xue, M., and Hu, M. (2019). Dynamic simulation and assessment of the coupling coordination degree of the economy–resource–environment system: case of Wuhan City in China. J. Environ. Manag. 230, 474–487. doi:10.1016/j.jenvman.2018.09.065
Xinsheng, S., Xiaoxiao, W., and Zhang, L. (2011). Node importance evaluation method for highway network of urban agglomeration. J. Transp. Syst. Eng. Inf. Technol. 11 (2), 84–90. doi:10.1016/s1570-6672(10)60115-8
Xiong, G., Cao, X., Hamm, N. A., Lin, T., Zhang, G., and Chen, B. (2021). Unbalanced development characteristics and driving mechanisms of regional urban spatial form: a case study of Jiangsu Province, China. Sustainability 13 (6), 3121. doi:10.3390/su13063121
Xu, M. (2021). “A study on spatial distribution characteristics of city hotels based on GIS method: a date analysis based on POI data of Zhejiang hotels,” in 2021 International Conference on E-Commerce and E-Management (ICECEM).
Yang, J., Cao, J., and Zhou, Y. (2021). Elaborating non-linear associations and synergies of subway access and land uses with urban vitality in Shenzhen. Transp. Res. Part A Policy Pract. 144, 74–88. doi:10.1016/j.tra.2020.11.014
You, H., and Yang, X. (2017). Urban expansion in 30 megacities of China: categorizing the driving force profiles to inform the urbanization policy. Land Use Policy 68, 531–551. doi:10.1016/j.landusepol.2017.06.020
Yue, W., Chen, Y., Thy, P. T. M., Fan, P., Liu, Y., and Zhang, W. (2021). Identifying urban vitality in metropolitan areas of developing countries from a comparative perspective: Ho Chi Minh City versus Shanghai. Sustain. Cities Soc. 65, 102609. doi:10.1016/j.scs.2020.102609
Yufei, Z., Jiawen, Y., Jiangping, Z., Peiling, Z., and Haitao, L. (2020). Evaluating vitality of metro station service area with heat map: a case study on shenzhen subway. Beijing Da Xue Xue Bao 56 (5), 875–883.
Zhang, P., Zhao, Y., Zhu, X., Cai, Z., Xu, J., and Shi, S. (2020). Spatial structure of urban agglomeration under the impact of high-speed railway construction: based on the social network analysis. Sustain. Cities Soc. 62, 102404. doi:10.1016/j.scs.2020.102404
Zhang, T., Qiu, Y., Ding, R., Yin, J., Cao, Y., and Du, Y. (2023). Coupling coordination and influencing factors of urban spatial accessibility and economic spatial pattern in the New Western Land-Sea Corridor. Environ. Sci. Pollut. Res. 30 (19), 54511–54535. doi:10.1007/s11356-023-26121-2
Zhang, Y., Li, X., Wang, A., Bao, T., and Tian, S. (2015). Density and diversity of OpenStreetMap road networks in China. J. Urban Manag. 4 (2), 135–146. doi:10.1016/j.jum.2015.10.001
Zhao, M., Zhou, Y., Li, X., Cao, W., He, C., Yu, B., et al. (2019). Applications of satellite remote sensing of nighttime light observations: advances, challenges, and perspectives. Remote Sens. 11 (17), 1971. doi:10.3390/rs11171971
Keywords: Lanzhou–Xining urban agglomeration, transportation network, transportation–urban vitality coupling, collaborative optimization, mismatch and imbalance
Citation: Yang M, Qian Y, Li X, Liu Z and Zeng J (2024) Dynamic coupling between transportation networks and urban vitality in the Lanzhou–Xining urban agglomeration. Front. Earth Sci. 12:1349398. doi: 10.3389/feart.2024.1349398
Received: 04 December 2023; Accepted: 08 January 2024;
Published: 29 January 2024.
Edited by:
Haimeng Liu, Chinese Academy of Sciences (CAS), ChinaReviewed by:
Sanwei He, Zhongnan University of Economics and Law, ChinaCopyright © 2024 Yang, Qian, Li, Liu and Zeng. This is an open-access article distributed under the terms of the Creative Commons Attribution License (CC BY). The use, distribution or reproduction in other forums is permitted, provided the original author(s) and the copyright owner(s) are credited and that the original publication in this journal is cited, in accordance with accepted academic practice. No use, distribution or reproduction is permitted which does not comply with these terms.
*Correspondence: Yongsheng Qian, cWlhbnlvbmdzaGVuZ0BtYWlsLmx6anR1LmNu
Disclaimer: All claims expressed in this article are solely those of the authors and do not necessarily represent those of their affiliated organizations, or those of the publisher, the editors and the reviewers. Any product that may be evaluated in this article or claim that may be made by its manufacturer is not guaranteed or endorsed by the publisher.
Research integrity at Frontiers
Learn more about the work of our research integrity team to safeguard the quality of each article we publish.