 Taru F. A. Koivusalo
 Pavla Dagsson-Waldhauserová
 Maria Gritsevich
 Jouni Peltoniemi
94% of researchers rate our articles as excellent or good
Learn more about the work of our research integrity team to safeguard the quality of each article we publish.
Find out more
BRIEF RESEARCH REPORT article
Front. Earth Sci., 26 July 2024
Sec. Atmospheric Science
Volume 12 - 2024 | https://doi.org/10.3389/feart.2024.1348082
This article is part of the Research TopicAtmosphere – Cryosphere Interaction in the Arctic, at High Latitudes and Mountains with Focus on Transport, Deposition and Effects of Dust, Black Carbon, and other Aerosols - Volume IIView all 4 articles
It is increasingly recognized that light-absorbing impurities (LAI) deposited on snow and ice affect their albedo and facilitate melting processes leading to various feedback loops, such as the ice albedo feedback mechanism. Black carbon (BC) is often considered the most important LAI, but some areas can be more impacted by high dust emissions. Iceland is one of the most important high latitude sources for the Arctic due to high emissions and the volcanic nature of the dust. We studied optical properties of volcanic dust from Iceland and Chile to understand how it interacts with the Sun’s radiation and affects areas of deposition as LAI. Optical properties of dust samples were measured at the laboratory of the Finnish Geospatial Research Institute (FGI) using the latest setup of the FGI’s goniospectrometer. We found that, depending on the particle size, the albedo of dry volcanic dust on the visible spectrum is as low as 0.03, similar to that of BC, and the albedo decreases with increasing particle size. Wet dust reduces its albedo by 66% compared to dry sample. This supports the comparability of their albedo reducing effects to BC as LAIs, and highlights their significant role in albedo reduction of snow and ice areas. The potential use of the results from our measurements is diverse, including their use as a ground truth reference for Earth Observation and remote sensing studies, estimating climate change over time, as well as measuring other ecological effects caused by changes in atmospheric composition or land cover.
Arctic regions are experiencing disproportionate impacts from climate change, primarily attributable to Arctic amplification. High-latitude areas are witnessing temperature increases at twice the global average (IPCC, 2019; IPCC, 2021), with some estimates suggesting a rate up to four times faster than the rest of the globe (Rantanen et al., 2022). The vulnerability of Arctic areas and ecosystems to climate change is heightened, where even a relatively modest initial warming can trigger cascading events, such as the albedo feedback mechanism. This mechanism forms a positive feedback loop, with increased warming leading to the reduction of snow and ice areas, subsequently decreasing albedo and increasing absorbed radiation. This, in turn, intensifies the melting process (Wittmann et al., 2017).
Light-absorbing impurities (LAIs), such as dust, have a notable impact on the surface albedo, snow properties, and snowmelt (Meinander et al., 2016). The retreat of snow cover and ice exposes more erodible sediment, leading to increased dust emissions. This paper focuses on natural volcanic dust as a specific type of LAI, though it is important to note that LAIs are also emitted from anthropogenic sources. Previous research indicates that certain volcanic particles share thermal and optical properties with anthropogenic black carbon (BC) (Arnalds et al., 2016; Yoshida et al., 2016; Boy et al., 2019; Zubko et al., 2019). Significantly, Icelandic volcanic dust and black carbon were found to have similar impacts on the albedo of snow, emphasizing their comparable influence (Peltoniemi et al., 2015; Wittmann et al., 2017; Dagsson-Waldhauserova and Meinander, 2019; Gritsevich et al., 2020).
In some regions globally, high dust emissions result in dust becoming the dominant LAI, reducing snow albedo (Svensson et al., 2018). Given that snow and ice possess a high albedo, even a small amount of deposited dust can significantly decrease albedo, leading to substantial changes in radiative forcing, increased warming, and accelerated snowmelt (Wittmann et al., 2017). Additionally, impurities in snow alter snow grain size and density, further impacting albedo and the melting process (Meinander et al., 2014).
Icelandic dust, characterized by its volcanic origin and subsequent dark appearance, absorbs shortwave and near-infrared radiation from the Sun more effectively than mineral dust from other major deserts. Unlike other mineral dusts, Icelandic dust likely induces positive radiative forcing (Baldo et al., 2020). The observed “clumping mechanism” on snow, where Icelandic silty material with fine particles forms larger particles, accelerates snowmelt (Dagsson-Waldhauserova et al., 2015a).
Iceland has the largest areas susceptible to severe aeolian erosion compared to other Arctic or European areas, which act as active sources of windblown dust (Arnalds et al., 2016). The extent of deserts in Iceland is about 43,000 km2, with volcaniclastic sandy desert covering around 20,000–22 000 km2 (Arnalds et al., 2016). Of the 22,000 km2 of volcaniclastic sandy desert, 15,000 km2 consists of areas of severe or very severe erosion (Arnalds et al., 2016). These areas are expected to grow in the future due to glacial retreat and reduction in snow cover extent and duration, revealing more erodible ground and consequently increasing the magnitude and frequency of dust events (Arnalds et al., 2016; Baddock et al., 2016; Crocchianti et al., 2021; Meinander et al., 2022). The largest high-latitude dust emissions measured were caused by strong storms and dust events. Dagsson-Waldhauserova et al. (2014b), investigated long-term weather dust observations showing that in a year there are 135 dust days or days with dust events in Iceland. Arnalds et al. (2016) stated that an estimated 30–40 million tons of dust emissions is produced in Iceland annually. Dust suspended in the atmosphere can be transported thousands of kilometers and Icelandic dust has been found in Svalbard, Greenland, and Europe (Arnalds et al., 2016; Moroni et al., 2018; Dordevic et al., 2019; Cvetkovic et al., 2022). Bullard et al. (2016) lists Iceland as one of the main active high-latitude dust source regions in the northern hemisphere. Overall, about 1%–5% of the global dust emissions originate form high-latitude sources and of the dust deposited on snow- and ice-covered Arctic areas approximately 57% comes from high latitude sources (Bullard et al., 2016; Groot Zwaaftink et al., 2016; Meinander et al., 2022).
Because of the large dust source areas, high emissions, frequency of dust events, transport potential, and the nature of the dark light-absorbing particles, Icelandic dust has the potential to have large impacts on the Arctic environment making Iceland one of the most important dust sources for the Arctic. It can also have an indirect effect on climate due to the effects on the surface albedo of glaciers, sea ice and snow-covered areas. Most of the climate models do not consider regional climate impacts of dust or snow albedo changes in the Arctic and thus end up underestimating the climate impacts of high-latitude dust (Kylling et al., 2018).
The comparability of BC and dark volcanic dust as LAIs has been previously suggested. This study aims to bolster this assertion by comparing the albedo measurements of volcanic samples with the albedo of black carbon documented in existing scientific literature. Based on our earlier modelling and measurement results (Wilkman et al., 2016; Zubko et al., 2016; Zubko et al., 2019; Gritsevich et al., 2020) it was anticipated that volcanic dusts possess sufficient light-absorbing capacity to indeed be comparable to BC in terms of their climatic impacts. However, it is also important to consider the difference in their particle size ranges. BC particles are smaller compared to the larger dust particles. The smaller particle size of BC may allow it to stay suspended in the atmosphere for a longer time and possibly travel further, whereas larger particles usually deposit quicker and can have more localized impacts. Given the substantial emissions from the volcaniclastic sandy deserts of Iceland, it is plausible that the impact of volcanic dust may surpass that of BC in specific regions. Furthermore, samples of volcanic sand from Chile were concurrently measured to enhance our understanding and variability of the optical properties of volcanic dust.
In this study, we conducted measurements of the optical properties of volcanic sand and dust particles, utilizing samples from both Iceland and Villarica area in Chile. The objective was to understand their potential impact on the surfaces they settle on and to determine the comparability of effects induced by these volcanic dust particles to BC as LAIs. This investigation specifically delved into the influence of particle-size distribution and moisture content on the albedo of the samples. Moreover, a microscopic examination of the volcanic particles was conducted to gain insights into their physical properties that could potentially influence their re-suspension and transport potential. Although the transport behavior was not directly investigated in this study, our previous extensive experience with modeling atmospheric transport of solid particles with masses >0.3 g (Moilanen et al., 2021) can be utilized for discussion purposes. Additional studies focusing specifically on the transport behavior of volcanic dust particles would be beneficial for further understanding their long-term dynamics in the atmosphere.
The samples were collected in Iceland in 2016 and 2022, and in Chile in 2019. Prior to measurements the samples were sieved through a set of laboratory sieves with mesh sizes 500 μm, 250 μm and 125 µm. Laboratory measurements of the volcanic sand and silt samples were conducted at the Finnish Geospatial Research Institute (FGI) in Espoo, Finland, using the FGI goniospectrometer described in (Peltoniemi et al., 2022).
The Icelandic volcanic sand was collected from the Mýrdalssandur outwash plain in South Iceland in March 2016. The material originates from the Mýrdalsjökull glacier, transported by glaciofluvial processes and deposited to the outwash plain. Because of the wind conditions the material has possibly been re-suspended and mixed over time, and so some of the finer silt-sized material may have been removed from the site by aeolian processes. The newest volcanic samples, named and subsequently referred to as NS1-NS4 were collected in Mýrdalssandur on 24 August 2022. As the laboratory measurements were conducted in the beginning of September 2022 soon after the samples were collected, the samples still contained some moisture making them appear darker visually to the eye and in the measurements. These samples were left to dry and measured again as dry samples. These 2022 samples were not sieved due to the amount of sample material available. Based on visual evaluation, their particle size distribution is similar to the 2016 Mýrdalssandur samples. Zubko et al. (2016) have pictured and analyzed samples from the same Mýrdalssandur dust source area, estimating a particle size range of 140–1,300 µm with 20% of particles from the total volume being smaller than 140 µm for their samples. As the samples described in Zubko et al. (2016) were collected in 2012 it should be kept in mind that some differences in the particle size distribution are likely as the area has been affected by natural processes such as wind or the eruption events of 2010 and 2011.
The glaciogenic silt sample was collected from Múlakvísl, a glacial river 10 km from the Mýrdalsjökull glacier and it is brighter than the volcanic sand samples. Silt and clay sediments typically consist of fine particles, which are easily suspended and re-suspended with the potential to be transported over thousands of kilometers (Arnalds et al., 2016; Moroni et al., 2018; Moroni et al., 2024). This sample consists mainly of silt and some clay-sized particles and is further described in Peltoniemi et al. (2015).
The volcanic samples from Chile were collected at Llaima volcano in the Central Volcanic Zone of the Andes in July 2019 (Gritsevich et al., 2020). Chile sample 1 was collected from an open area near the volcano on the eastern side slope. The Chile sample 2 was collected near the lake Laguna Quilillo O Verde. Llaima is one of the most active volcanoes in Chile, with its most recent eruptions occurring between 2008 and 2009. Located in the Conguillio national park, the sediment around Llaima volcano is mainly basaltic andesite, which is typical for the Andes. For the exact coordinates of all samples see the Supplementary Material (Supplementary Appendix SA1).
All samples were sieved through a set of laboratory sieves, except the NS1-NS4 and Chile sample 2 due to small amount of the material. The samples were first sieved through an ordinary strainer to separate larger particles before sieving with the laboratory sieve. Each sample thus had subcategories of un-sieved/strained, >500 μm, <500 µm but >250 μm, <250 µm but >125 μm, and the smallest subcategory of only particles <125 µm (Figure 1). Although the 125 µm was the smallest mesh size available, it can be assumed that fine silt and clay sized particles are present in the samples. Approximately 1 dl of each sample was put on a receptacle made from a dark curtain fabric that has been previously measured to have an albedo below 0.03 over the measured wavelength range (Figure 1). The dark and non-reflective fabric was chosen in order to have the least interference possible with the measurements.
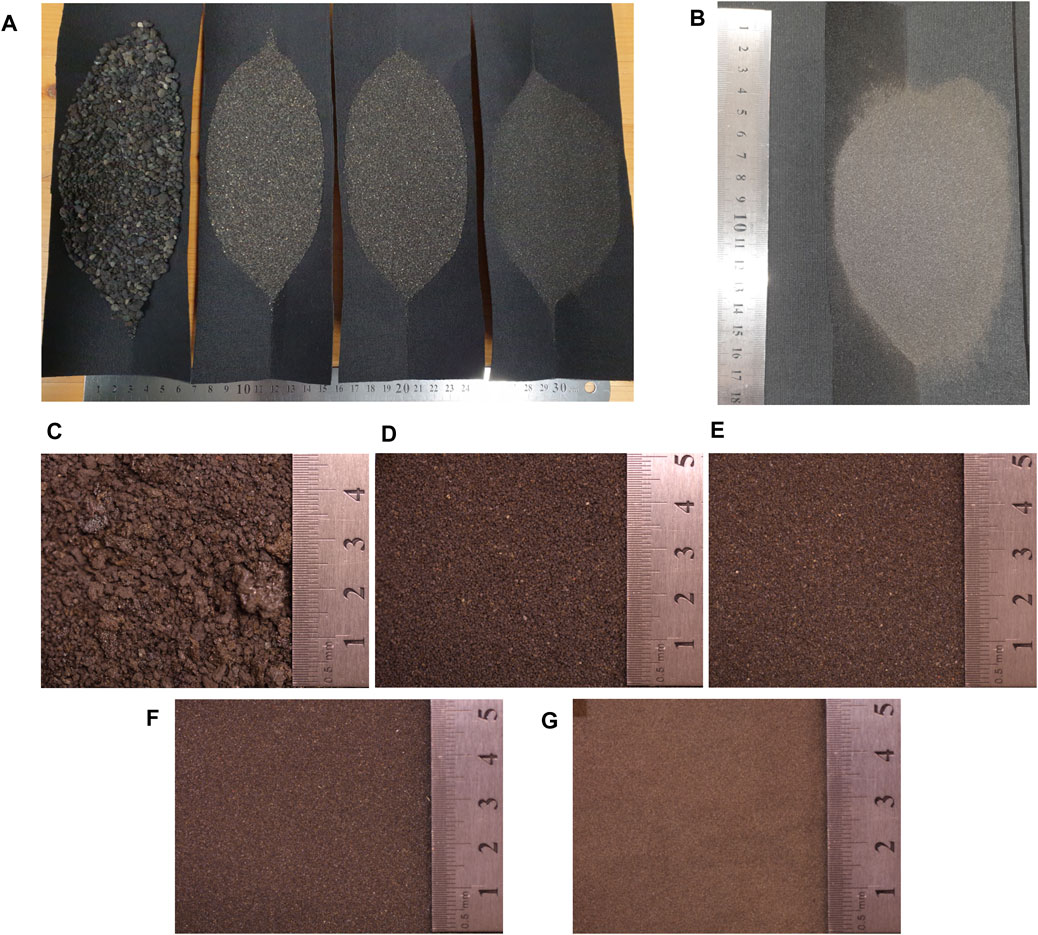
Figure 1. Samples in measurement trays. In (A) Volcanic sand from Iceland 2016 can be seen as un-sieved, >500 μm, >250 µm and >125 µm. In (B) the same sample as in (A) but sieved to <125 µm. In (C–G) from left to right Chile sample 1 un-sieved, >500 μm, >250 μm, >125 μm, <125 µm.
The optical properties measured include the albedo and bidirectional reflectance factor (BRF). BRF is a function that describes the directional dependence of reflected radiance from a surface or a sample, measured from each direction. The bidirectional reflectance factor (BRF) is defined as the ratio of reflected light intensity of a sample surface to an ideal Lambertian surface under identical setup geometry and same illumination conditions (Schaepman-Strub et al., 2006; Peltoniemi et al., 2015). In these measurements a Spectralon® disc was used as the Lambertian reference.
The instrument used was the FGI space goniometer, a system that was built in the Otaniemi laboratory using various motors, optics, arms, and other parts. Peltoniemi et al. (2022) describes the previous FGI goniometer setup well in detail and the operation of the system worked largely the same here, except for the flat sample tray and angular range limited to upper hemisphere. At the base there is the ASD FieldSpec 4 spectroradiometer (Analytical Spectral Devices), connected to sensing optics with a light fiber cable, and to a Raspberry Pi computer which is also connected to multiple motors that allow the movement of the arm with attached optics, rotation of the sample, and rotation of the whole system (Figure 2). The ASD FieldSpec 4 spectroradiometer measures across the full range of solar irradiance spectrum of 350–2,500 nm. The Raspberry Pi tablet has a Linux operating system and the software to control the machine is written in Python. The measurement sequence set for these measurements took approximately 16 min. Separate from the instrument there was also the light source, for the measurements here the light source used was a ThermoOriel QTH lamp with 750 W of power used. The light source, optics and the sample were aligned for the measurement, the room was darkened from any other lights or daylight during the measurements. The measurements were done in the following sequence. Power was turned on for the spectrometer, light source and other electronics, and 30 min were given for the system to allow it to warm up and stabilize. First it was necessary to measure the dark current and the white reference, dark current was measured by closing a manual shutter before the light fiber input to the optics and after this the white reference was measured by placing the Spectralon® white reference disc on the sample tray. Any visible dust or debris was cleaned from the white reference by compressed air when necessary. After measuring the baseline references the sample could be placed on the sample tray and the measurement sequence started. Measurement of one sample took approximately 16 min after which a different sample could be measured directly after, if the measurement conditions had not changed. The motors of the system facilitate the change of the zenith angle by tilting the arm holding the optics and another motor turns the system to a selected azimuth angle. Measurements were repeated only for some of the samples, to manage the project with adequate resources. Measuring volcanic sand sample in a similar setup by Zubko et al. (2016) yielded 0.0007 error in reflectance.
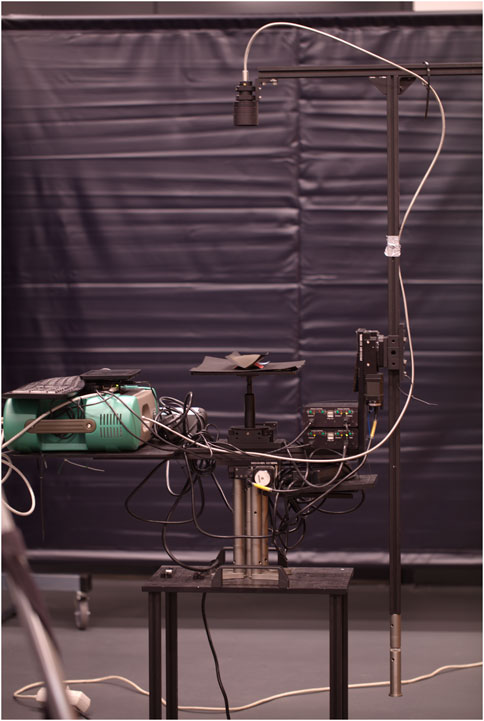
Figure 2. The goniospectrometer at the Finnish Geospatial Research Institute (FGI) laboratory. Green box is the ASD FieldSpec 4 spectroradiometer, on top of it rests the Raspberry Pi computer tablet and a keyboard for the operation of the instrument. At the center of the image, the sample tray with a volcanic sample and directly above it are the measuring optics, connected to the ASD FieldSpec by a light fiber cable.
Samples were also photographed with a high-quality SLR-camera and through a stereomicroscope for close-up images of the material in order to study the physical characteristics of the particles.
The laboratory measurement results are visualized in Figures 3, 4, these figures show graphs depicting the bidirectional reflectance factor (BRF) of the sample based on the zenith angle of the measurement optics in near infrared wavelengths 1,000–1,300 nm where the ASD signal appeared most stable, and the albedo of the sample for different wavelengths. In Figure 3 results of the optical measurements of the 2016 volcanic sample from Mýrdalssandur outwash plain are seen in graphs A) and B), volcanic sand samples from Chile seen in graphs C) and D), and glaciogenic silt sample measurements seen in graphs E) and F). The graphs on the left side of both Figures 3, 4 show the BRF of near infrared at different zenith angles. The graphs on the right side in Figures 3, 4 show the spectral albedo of the samples, or the diffuse reflection to many different directions rather than just reflection towards one specific angle of different wavelengths of light.
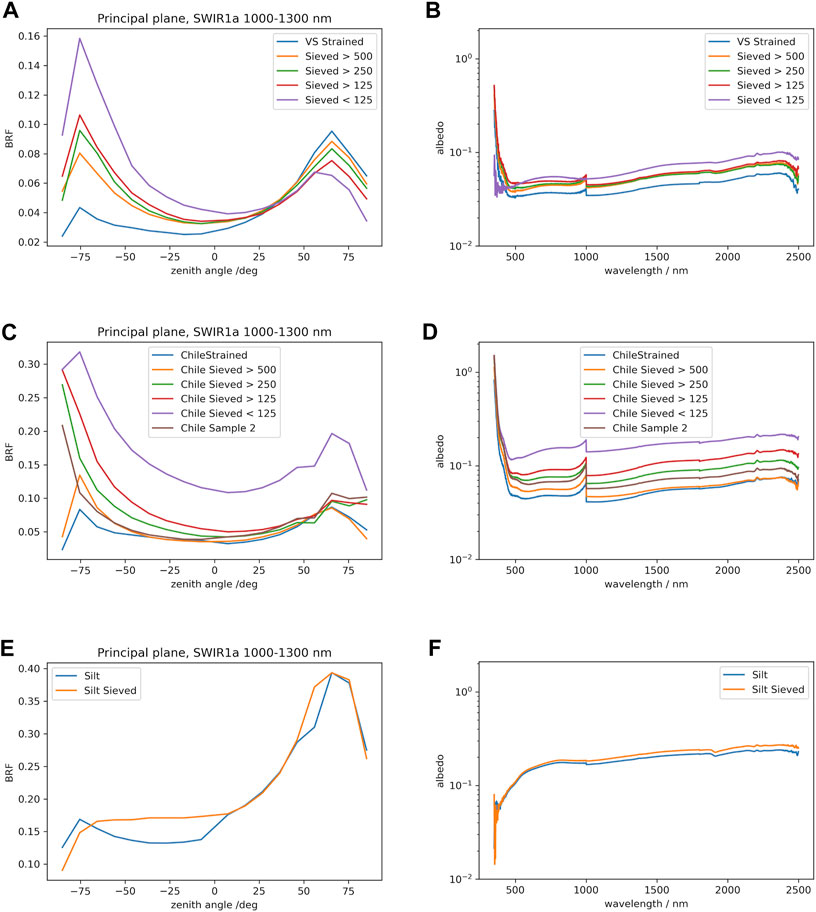
Figure 3. Visualization of optical measurements. Bidirectional reflectance factor (BRF) and albedo measurements of volcanic sand sample from Mýrdalssandur 2016 seen in (A, B), volcanic sand samples from Chile in (C, D), and the glaciogenic silt sample in (E, F). The “VS strained” stands for un-sieved Icelandic 2016 volcanic sand samples, and “Chile strained” is the un-sieved Chile sample 1. Zenith angle on the left side graphs is the angle of measurement optics from zenith (vertical). Because the sensitivity of the VNIR sensor of the ASD gets weaker at ends of the spectral range, there are some possibly spurious peaks near 350 and 1,000 nm. Further, near backscattering we occasionally see the shadow of the sensor.
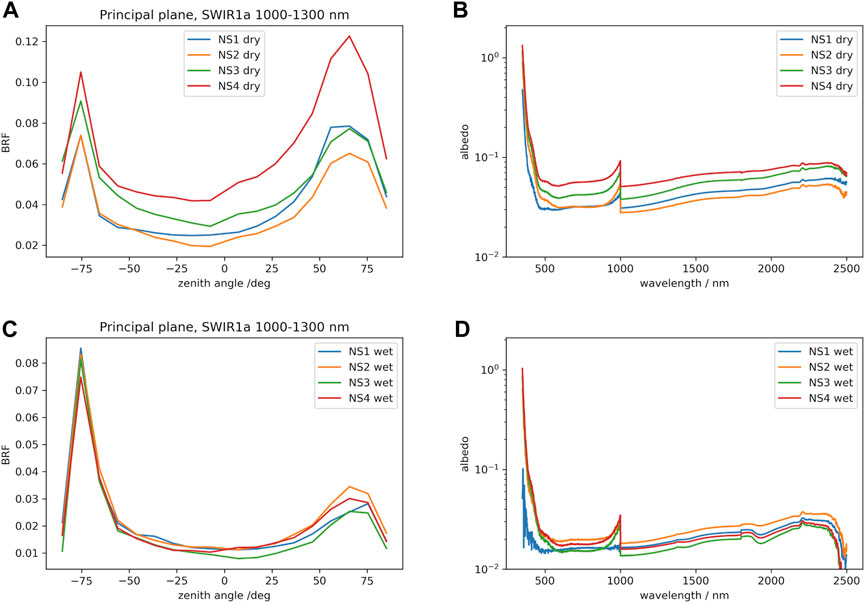
Figure 4. Visualization of optical measurements of NS1-NS4. Bidirectional reflectance factor (BRF) and albedo measurements of volcanic sand samples from Mýrdalssandur 2022. Samples NS1 to NS4 are visualized in the same graphs. The samples NS1-NS4 measured dry in (A) and (B), and wet/moist in (C) and (D). Zenith angle on the left side graphs is the angle of measurement optics from zenith (vertical). Because the sensitivity of the VNIR sensor of the ASD gets weaker at ends of the spectral range, there are some possibly spurious peaks near 350 and 1,000 nm. Further, near backscattering we occasionally see the shadow of the sensor.
In this work, focus is mainly given for the albedo measurement results in the visible spectrum. Albedo of the volcanic sand sample from Mýrdalssandur 2016 is approximately 0.03–0.05 in the visible light spectrum (Figure 3). The results show that the smaller the particle size in the sample, the brighter the sample is. The volcanic sand sample from Iceland from 2016 shows this in both BRF and albedo measurements, but not as clearly as the comparison sample from Chile. The Chile sample 1 is also noticeably brighter than Icelandic volcanic sample as seen from Figure 3. The albedo of the Chile sample 1 is 0.04–0.09 for most of the particle size categories and even higher for the smallest grain size sample (<125 μm, 0.1–0.2). The <125 µm sample of Chile sample 1 has almost as high albedo as glaciogenic silt in the visible spectrum, as seen in the graphs D) and F) in Figure 3. Chile sample 2 was measured untouched without sieving because of the small amount of sample material available. The measurements for Chile Sample 2 are closest to those of Chile Sample 1 in the particle size category >250 μm, which provides an estimate of the particle size distribution of this sample. The glaciogenic silt was initially measured untouched but was sieved and measured again because it had formed clumps. The sieved sample is more uniform, making its measurement likely more accurate.
Figure 4 shows the results of optical measurements of the volcanic samples from Iceland 2022 referred to as NS1-NS4. As the sample material was fresh it still contained some moisture, which is why the samples were measured wet and dry. The NS1 through NS4 were small samples and so they were not sieved but measured as is. From the graphs in Figure 4 it is apparent that the wet samples are very dark, and all appear to have similar optical properties (graphs C and D), but a significant difference is seen when these wet measurements are compared to the dry measurements (graphs A and B). The NS1-NS4 samples were all quite dark even when dry, with an albedo from 0.03 to 0.06 in the visible spectrum. When the NS1-NS4 samples were dry the clear difference in brightness between the samples was observable by eye but when moist this was not as clear. This can be seen in the measurements as well, where the moist samples were all much closer in the BRF and albedo measurements and very different from each other when measured dry. The moist samples were very dark with albedo measurements between 0.01 and 0.02 on the visible spectrum.
Snow and ice have an albedo around 0.7–0.9, with fresh snow’s albedo potentially being almost 1. Loss of snow cover, ice sheets and glaciers have significant impacts on the energy budget of Earth (IPCC, 2021). For the melting processes of snow and ice, an albedo reduction of only 0.01 is significant, but the albedo changes after dust events on icecaps of Iceland are in most cases much higher than this (Wittmann et al., 2017; Gunnarsson et al., 2021). Small changes in snow albedo impact melting but are not necessarily visible to the naked eye. The albedo changes and impacts by LAI on the melt of snow and ice areas can be expected in all high-latitude glacial areas and the scope of dust emissions is expected to become more intense and expansive in the future (Prospero et al., 2012; Meinander et al., 2022; Kavan and Strzelecki, 2023). Even though the dust emissions in Iceland are found to be the highest during spring and summer, deposits of jökulhlaup glacial flood events can cause high dust emission events throughout the year (Dagsson-Waldhauserova et al., 2014b; Nakashima and Dagsson-Waldhauserova, 2019). Jökulhlaup floods are outburst floods characterized by the sudden release of proglacial or subglacial water. These events typically occur when a glacial ice dam holding back a large body of water suddenly fails or when meltwater accumulates rapidly and breaches the ice dam. Jökulhlaups can result in significant downstream flooding, carrying large volumes of sediment and debris along their path.
Up to 4.5 million tons of dust is deposited on the Icelandic glaciers annually (Arnalds et al., 2014). Volcanic dust and ash have been found to have an insulating effect on snow, but most studies focus on large amounts of ash deposited during volcanic eruptions (Driedger, 1980; Dracosics et al., 2016). Often the ash layer can be very thick after volcanic eruptions, but after dust events the dust layer is usually thinner increasing melting (Dracosics et al., 2016; Gunnarsson et al., 2021). During volcanic eruptions the sulfur released to the atmosphere is generally considered to have negative radiative forcing effect, but as it is deposited on snow and ice this is counteracted by the albedo decrease (Wittmann et al., 2017). In addition, volcanic dust is effective in removing the SO2 from the atmosphere (Urupina et al., 2019). The environmental impacts of volcanic eruptions are generally short term, but dust storms provide non-limited supply of LAI on glaciers year-round (Dagsson-Waldhauserova et al., 2014b; Dagsson-Waldhauserova and Meinander, 2019; Butwin et al., 2020; Gunnarsson et al., 2021).
In this study we show that the albedo of Icelandic volcanic sand is very low at 0.03–0.06 and even lower when wet, around 0.01–0.02. The results are comparable to the 0.03 spectral reflectance measured for dry Icelandic volcanic dust with a spectrophotometer in Dagsson-Waldhauserova (2014a) and to the geometric albedo of ∼0.05 reported in Zubko et al. (2019) for a volcanic sand sample from Iceland. The highly absorbing properties of volcanic dust can be compared to BC (Dagsson-Waldhauserova et al., 2018). Dal Farra et al. (2018) measured the spectral reflectance of a BC particle to be around 5% (albedo about 0.05) with their modified Hyperspectral Imaging Microscope Spectrometer (HIMS). The measurements of Icelandic volcanic sand in this study are comparable to the measurements done with an ASD spectrophotometer in Peltoniemi et al. (2015), here BRF of volcanic sand samples in near infrared is found to be at lowest 0.02 and at the highest 0.14 depending on the zenith angle, measurements of Peltoniemi et al. (2015) followed similar directional reflectance. Especially in the case of the dry NS1-NS3 the BRF measurement results are very similar to those in Peltoniemi et al. (2015). The above-mentioned study also measured the same glaciogenic silt sample as was used here, coming to almost identical results in albedo measurement in the visible spectrum. Samples with smaller particles appear brighter than samples with larger particles as evidenced by the results in this study and in Arnalds et al. (2019). Icelandic volcanic dust samples with smaller particle size are still very dark with an albedo around 0.04–0.05 in the visible spectrum. The brightening with different particle sizes occurs in both Icelandic and Chilean samples, but it is significantly more evident in the Chile sample 1 of <125 µm. The brightness of the Chile samples could be influenced by various factors beyond their inherent properties. For instance, the presence of other types of brighter dust mixed in with the volcanic sample or a different parent sediment could contribute to their optical characteristics. Additionally, factors such as surface weathering, mineral composition, and the presence of secondary minerals might also play a role in determining the overall brightness of the samples. The NS1-NS4 samples exhibited a darker appearance when wet, and albedo measurements validated this observation by confirming a decrease in albedo in the visible spectrum from 0.03–0.06 when dry to 0.01–0.02 when wet. Based on these findings, it can be reasonably assumed that dust deposited on snow or ice will darken during melting processes. This darkening effect when wet could be attributed to various factors, such as increased surface reflectance due to water film formation or enhanced light absorption by wet particles. Understanding these dynamics is essential for accurately predicting the impact of dust deposition on snow and ice surfaces and its contribution to accelerated melting processes. Compared to low-latitude dust samples, the absorption of Icelandic dust can be 2–8 times higher between wavelengths of 660 and 950 nm (Baldo et al., 2023).
With an investigation through stereomicroscope, we find that the material of the volcanic samples from Iceland and Chile are mostly volcanic amorphous glass with typical characteristics such as gas bubbles and shard-like shapes, which increase the suspension and transport potential of even quite large particles compared to other mineral particles of the same size (Dagsson-Waldhauserova et al., 2015b). These characteristics can also facilitate suspension of Icelandic dust even during or shortly after wet conditions. Further research is necessary to determine the actual transport potential, size range of such particles in natural conditions. Typically, the long-range transport of particles around 100 µm requires strong and sustained wind conditions. It is documented that Icelandic volcanic dust has been discovered in locations several thousands of kilometers away, such as Svalbard, Ireland, and Serbia (Ovadnevaite et al., 2009; Moroni et al., 2018; Dordvic et al., 2019; Moroni et al., 2024). The high emissions, potential for transport, and the light-absorbing nature of Icelandic volcanic dust make it an integral albedo reducing factor for the Arctic. Globally the estimated deposition of Arctic dust on snow and ice by mass is 70% higher than deposition of BC, and specifically in the Arctic regions the deposition of Arctic dust on snow and ice is 580% higher than BC (Meinander et al., 2022), which highlights the importance of high-latitude dust sources for the Arctic.
Laboratory measurements of the optical and physical properties of volcanic dusts play a crucial role in identifying dust sources and refining climate models to more accurately incorporate the impacts of dust emissions on albedo and regional climate. This contributes to mitigating the risk of underestimating the complex environmental effects of dust on a global scale by accounting for light-absorbing impurities. Our findings hold significance for the validation of remote sensing products and dust (albedo) models. They can aid in the development of new parametrizations for volcanic dust for Moderate Resolution Imaging Spectroradiometer (MODIS) and Cloud-Aerosol Lidar and Infrared Pathfinder Satellite Observations (CALIPSO), as well as retrievals for Infrared Atmospheric Sounding Interferometer (IASI) and Copernicus Atmospheric Monitoring System (CAMS). Additionally, such data is an important input for dust darkness model being developed for Iceland based on the operational Dust Regional Atmospheric Model for Iceland (DREAM_Iceland, Cvetkovic et al., 2022). This model has been adopted by the World Meteorological Organization for the Sand/Dust Storm Warning Advisory Assessment System (WMO SDS WAS), specifically within the framework of the Regional Center for North Africa–Middle East–Europe (NAMEE mode). Such advancements enhance our ability to monitor and forecast dust events accurately, contributing to better environmental management and hazard mitigation efforts.
The albedo of Icelandic volcanic dust samples measured in this study ranges from 0.03 to 0.06 in the visible spectrum, with albedo decreasing as particle size increases. Icelandic volcanic dust samples generally exhibit lower albedo compared to volcanic dust samples from Chile, with some Chilean samples even surpassing the upper bound of 0.06 observed in Icelandic volcanic samples. Furthermore, the albedo of Icelandic volcanic sand samples decreases when wet or moist, reaching values as low as 0.01 to 0.02.
In terms of light-absorbing capacity and potential impact as light-absorbing aerosols (LAI), volcanic dusts are comparable to black carbon (BC). Both Icelandic and Chilean volcanic dusts display morphological characteristics typical of volcanic particles, such as bubbles and shard-like shapes, which enhance their suspension and transport potential in the atmosphere.
Given their transport potential, high emissions, frequency of dust events, and light-absorbing capacity, Icelandic volcanic dust plays a crucial role in reducing albedo on snow and ice surfaces in the Arctic. Consequently, our findings have implications for various fields, including studies on ecological effects resulting from atmospheric composition or land cover changes, remote sensing applications, identification of dust sources, and enhancing climate models’ ability to incorporate the impacts of dust on albedo and regional climate dynamics.
The raw data supporting the conclusion of this article will be made available by the authors, without undue reservation.
TK: Formal Analysis, Investigation, Project administration, Visualization, Writing–original draft. PD-W: Conceptualization, Funding acquisition, Project administration, Resources, Writing–review and editing. MG: Conceptualization, Funding acquisition, Resources, Writing–review and editing. JP: Formal Analysis, Data curation, Methodology, Resources, Software, Visualization, Writing–review and editing.
The author(s) declare financial support was received for the research, authorship, and/or publication of this article. This work was supported by the Academy of Finland project no. 325806 (PlanetS), Czech Science Foundation project 20-06168Y and Orkurannsóknasjóður of the National Power Agency of Iceland.
We thank Jarmo Moilanen and Nataliya Zubko for the help during the work and measurements done at the laboratory of the Finnish Geospatial Research Institute, Outi Meinander (Finnish Meteorological Institute) for collaboration with collection and transport of the 2022 samples, and Aaron Vanderpool (University of California Davis) for his help collecting the volcanic samples from Chile locations.
The handling editor DC declared a past co-authorship with the author PD-W.
The authors declare that the research was conducted in the absence of any commercial or financial relationships that could be construed as a potential conflict of interest.
All claims expressed in this article are solely those of the authors and do not necessarily represent those of their affiliated organizations, or those of the publisher, the editors and the reviewers. Any product that may be evaluated in this article, or claim that may be made by its manufacturer, is not guaranteed or endorsed by the publisher.
The Supplementary Material for this article can be found online at: https://www.frontiersin.org/articles/10.3389/feart.2024.1348082/full#supplementary-material
Arnalds, O., Dagsson-Waldhauserová, P., and Brink, S. (2019). Sandauðnir, sandfok og ryk á Íslandi. II. Áfok og ryk [Sandy areas, sandstorms and dust in Iceland. II. Sand storms and dust]. Náttúrufræðingurinn 89 (3–4), 132–145
Arnalds, O., Dagsson-Waldhauserova, P., and Olafsson, H. (2016). The Icelandic volcanic aeolian environment: processes and impacts—a review. Aeolian Res. 20, 176–195. doi:10.1016/j.aeolia.2016.01.004
Arnalds, O., Olafsson, H., and Dagsson-Waldhauserova, P. (2014). Quantification of iron-rich volcanogenic dust emissions and deposition over the ocean from Icelandic dust sources. Biogeosciences 11 (23), 6623–6632. doi:10.5194/bg-11-6623-2014
Baddock, M., Mockford, T., Bullard, J., and Thorsteinsson, T. (2016). Pathways of highlatitude dust in the North atlantic. Earth Planet. Sci. Lett. 459, 170–182. doi:10.1016/j.epsl.2016.11.034
Baldo, C., Formenti, P., Di Biagio, C., Lu, G., Song, C., Cazaunau, M., et al. (2023). Complex refractive index and single scattering albedo of Icelandic dust in the shortwave part of the spectrum. Atmos. Chem. Phys. 23 (14), 7975–8000. doi:10.5194/acp-23-7975-2023
Baldo, C., Formenti, P., Nowak, S., Chevaillier, S., Cazaunau, M., Pangui, E., et al. (2020). Distinct chemical and mineralogical composition of Icelandic dust compared to northern African and Asian dust. Atmos. Chem. Phys. 20, 13521–13539. doi:10.5194/acp-20-13521-2020
Boy, M., Thomson, E., Navarro, J.-C., Arnalds, O., Batchvarova, E., Bäck, J., et al. (2019). Interactions between the atmosphere, cryosphere and ecosystems at northern high latitudes. Atmos. Chem. Phys. Discuss., 1–82. doi:10.5194/acp-2018-733
Bullard, J. E., Baddock, M., Bradwell, T., Crusius, J., Darlington, E., Gaiero, D., et al. (2016). High-latitude dust in the Earth system. Rev. Geophys. 54 (2), 447–485. doi:10.1002/2016RG000518
Butwin, M. K., Pfeffer, M. A., von Löwis, S., Støren, E. W., Bali, E., and Thorsteinsson, T. (2020). Properties of dust source material and volcanic ash in Iceland. Sedimentology 67 (6), 3067–3087. doi:10.1111/sed.12734
Crocchianti, S., Moroni, B., Dagsson-Waldhauserova, P., Becagli, S., Severi, M., Traversi, R., et al. (2021). Potential source contribution function Analysis of high latitude dust sources over the arctic: preliminary results and prospects. Atmosphere 12, 347. doi:10.3390/atmos12030347
Cvetkovic, B., Dagsson-Waldhauserova, P., Petkovic, S., Arnalds, O., Madonna, F., Proestakis, E., et al. (2022). Fully dynamic high–resolution model for dispersion of Icelandic airborne mineral dust. Atmosphere 13, 1345. doi:10.3390/atmos13091345
Dagsson-Waldhauserova, P. (2014a). Variability, origin and physical characteristics of dust aerosol in Iceland (PhD dissertation). Reykjavik: Faculty of Physical Sciences Agricultural University of Iceland.
Dagsson-Waldhauserova, P., Arnalds, O., and Ólafsson, H. (2014b). Long-term variability of dust events in Iceland (1949–2011). Atmos. Chem. Phys. 14, 13411–13422. doi:10.5194/acp-14-13411-2014
Dagsson-Waldhauserova, P., Arnalds, O., Ólafsson, H., Hladil, J., Skala, R., Navratil, T., et al. (2015a). Snow–dust storm: unique case study from Iceland, March 6–7, 2013. Aeolian Res. 16, 69–74. doi:10.1016/j.aeolia.2014.11.001
Dagsson-Waldhauserova, P., Arnalds, O., Ólafsson, H., Hladil, J., Skala, R. N., Chadimova, L., et al. (2015b). “Optical properties of Icelandic volcanic dust,” in Conference: Electromagnetic and Light Scattering XV 2015, Leipzig, Germany.
Dagsson Waldhauserova, P., Arnalds, O., Olafsson, H., Meinander, O., Hladil, J., Skala, R., et al. (2018). “Snow-Dust Storm phenomenon: a case study from Iceland,” in EGU General Assembly Conference Abstracts, 9332.
Dagsson-Waldhauserova, P., and Meinander, O. (2019). Editorial: atmosphere—cryosphere interaction in the arctic, at high latitudes and mountains with focus on transport, deposition, and effects of dust, black carbon, and other aerosols. Front. Earth Sci. 7, 337. doi:10.3389/feart.2019.00337
Dal Farra, A., Kaspari, S., Beach, J., Bucheli, T., Schaepman, M., and Schwikowski, M. (2018). Spectral signatures of submicron scale light-absorbing impurities in snow and ice using hyperspectral microscopy. J. Glaciol. 64, 377–386. doi:10.1017/jog.2018.29
Dordevic, D., Tosic, I., Sakan, S., Petrovic, S., Duricic-Milankovic, J., Finger, D. C., et al. (2019). Can volcanic dust suspended from surface soil and deserts of Iceland Be transferred to central balkan similarly to african dust (sahara)? Front. Earth Sci. 7. doi:10.3389/feart.2019.00142
Dracosics, M., Meinander, O., Jónsdóttir, T., Dürig, T., de Leeuw, G., Pálsson, F., et al. (2016). Insulation effects of Icelandic dust and volcanic ash on snow and ice. Arabian J. Geosciences 9, 126. doi:10.1007/s12517-015-2224-6
Driedger, C. L. (1980). Effect of ash thickness on snow ablation. Washington: The 1980 Eruptions of Mount St. Helens.
Gritsevich, M., Zubko, N., Vanderpool, A., and Peltoniemi, J. (2020). Optical properties of volcanic dust. Authorea. January 15, 2020. doi:10.1002/essoar.10501836.1
Groot Zwaaftink, C., Grythe, H., Skov, H., and Stohl, A. (2016). Substantial contribution of northern high-latitude sources to mineral dust in the Arctic. J. Geophys. Res. Atmos. 121, 13678–13697. doi:10.1002/2016JD025482
Gunnarsson, A., Gardarsson, S. M., Pálsson, F., Jóhannesson, T., and Sveinsson, Ó. G. B. (2021). Annual and inter-annual variability and trends of albedo of Icelandic glaciers. Cryosphere 15, 547–570. doi:10.5194/tc-15-547-2021
IPCC (2019). IPCC special report on the ocean and cryosphere in a changing climate. Cambridge, UK and New York, NY, USA: Cambridge University Press. doi:10.1017/9781009157964
IPCC (2021). Climate change 2021: the physical science basis. Contribution of working group I to the sixth assessment report of the intergovernmental panel on climate change. Cambridge, UK: Cambridge University Press. doi:10.1017/9781009157896
Kavan, J., and Strzelecki, M. C. (2023). Glacier decay boosts the formation of new Arctic coastal environments—perspectives from Svalbard. Land Degrad. Dev. 34 (12), 3467–3474. doi:10.1002/ldr.4695
Kylling, A., Groot Zwaaftink, C., and Stohl, A. (2018). Mineral dust instantaneous radiative forcing in the arctic. Geophys. Res. Lett. 45, 4290–4298. doi:10.1029/2018GL077346
Meinander, O., Dagsson-Waldhauserova, P., Amosov, P., Aseyeva, E., Atkins, C., Baklanov, A., et al. (2022). Newly identified climatically and environmentally significant high-latitude dust sources. Atmos. Chem. Phys. 22 (17), 11889–11930. doi:10.5194/acp-22-11889-2022
Meinander, O., Dagsson-Waldhauserova, P., and Arnalds, O. (2016). Icelandic volcanic dust can have a significant influence on the cryosphere in Greenland and elsewhere. Polar Res. 35, 31313. doi:10.3402/polar.v35.31313
Meinander, O., Kontu, A., Virkkula, A., Arola, A., Backman, L., DagssonWaldhauserova, P., et al. (2014). Brief communication: light-absorbing impurities can reduce the density of melting snow. Cryosphere 8, 991–995. doi:10.5194/tc-8-991-2014
Moilanen, J., Gritsevich, M., and Lyytinen, E. (2021). Determination of strewn fields for meteorite falls. Mon. Notices R. Astronomical Soc. 503 (3), 3337–3350. doi:10.1093/mnras/stab586
Moroni, B., Arnalds, Ó., Dagsson-Waldhauserová, P., Crocchianti, S., Vivani, R., and Cappelletti, D. M. (2018). Mineralogical and chemical records of Icelandic dust sources upon ny-ålesund (svalbard islands). Front. Earth Sci. 6, 187. doi:10.3389/feart.2018.00187
Moroni, B., Crocchianti, S., Nawrot, A., Dagsson Waldhauserova, P., and Cappelletti, D. (2024). Investigation of Icelandic dust presence in the aerosols collected at hornsund (svalbard, Norwegian arctic) in spring 2019. Atmosphere 15 (3), 322. doi:10.3390/atmos15030322
Nakashima, M., and Dagsson-Waldhauserová, P. (2019). A 60 Year examination of dust day activity and its contributing factors from ten Icelandic weather stations from 1950 to 2009. Front. Earth Sci. 6, 245–252. doi:10.3389/feart.2018.00245
Ovadnevaite, J., Ceburnis, D., Plauskaite-Sukiene, K., Modini, R., Dupuy, R., Rimselyte, I., et al. (2009). Volcanic sulphate and arctic dust plumes over the North Atlantic Ocean. Atmos. Environ. 43 (32), 4968–4974. doi:10.1016/j.atmosenv.2009.07.007
Peltoniemi, J. I., Gritsevich, M., Hakala, T., Dagsson-Waldhauserová, P., Arnalds, Ó., Anttila, K., et al. (2015). Soot on Snow experiment: bidirectional reflectance factor measurements of contaminated snow. Cryosphere 9 (6), 2323–2337. doi:10.5194/tc-9-2323-2015
Peltoniemi, J. I., Zubko, N., Virkki, A. K., Gritsevich, M., Moilanen, J., Roulet, J. C., et al. (2022). Light scattering model for small space debris particles. Adv. Space Res. 70 (10), 2961–2975. doi:10.1016/j.asr.2022.09.022
Prospero, J., Bullard, J., and Hodgkins, R. (2012). High-latitude dust over the North atlantic: inputs from Icelandic proglacial dust storms. Sci. (New York, N.Y.) 335, 1078–1082. doi:10.1126/science.1217447
Rantanen, M., Karpechko, A. Y., Lipponen, A., Nordling, K., Hyvärinen, O., Ruosteenoja, K., et al. (2022). The Arctic has warmed nearly four times faster than the globe since 1979. Commun. earth Environ. 3 (1), 168. doi:10.1038/s43247-022-00498-3
Schaepman-Strub, G., Schaepman, M. E., Painter, T., Dangel, S., and Martonchik, J. V. (2006). Reflectance quantities in optical remote sensing-definitions and case studies. Remote Sens. Environ. 103, 27–42. doi:10.1016/j.rse.2006.03.002
Svensson, J., Ström, J., Kivekäs, N., Dkhar, N. B., Tayal, S., Sharma, V. P., et al. (2018). Light-absorption of dust and elemental carbon in snow in the Indian Himalayas and the Finnish Arctic. Atmos. Meas. Tech. 11 (3), 1403–1416. doi:10.5194/amt-11-1403-2018
Urupina, D., Lasne, J., Romanias, M., Thiery, V., Dagsson-Waldhauserova, P., and Thevenet, T. (2019). Uptake and surface chemistry of SO2 on natural volcanic dusts. Atmos. Environ. 217, 116942. doi:10.1016/j.atmosenv.2019.116942
Wilkman, O., Gritsevich, M., Zubko, N., Peltoniemi, J. I., and Muinonen, K. (2016). Photometric modelling for laboratory measurements of dark volcanic sand. J. Quantitative Spectrosc. Radiat. Transf. 185, 37–47. doi:10.1016/j.jqsrt.2016.08.013
Wittmann, M., Groot Zwaaftink, C. D., Steffensen Schmidt, L., Guðmundsson, S., Pálsson, F., Arnalds, O., et al. (2017). Impact of dust deposition on the albedo of Vatnajökull ice cap, Iceland. Cryosphere 11 (2), 741–754. doi:10.5194/tc-11-741-2017
Yoshida, A., Moteki, N., Ohata, S., Mori, T., Tada, R., Dagsson-Waldhauserová, P., et al. (2016). Detection of light-absorbing iron oxide particles using a modified single-particle soot photometer. Aerosol Sci. Technol. 50 (3), 1–4. doi:10.1080/02786826.2016.1146402
Zubko, N., Gritsevich, M., Zubko, E., Hakala, T., and Peltoniemi, J. I. (2016). Optical measurements of chemically heterogeneous particulate surfaces. J. Quantitative Spectrosc. Radiat. Transf. 178, 422–431. doi:10.1016/j.jqsrt.2015.12.010
Keywords: light-absorbing impurities, dust, volcanic sand, albedo, snow, climate change, cryosphere, optical properties
Citation: Koivusalo TFA, Dagsson-Waldhauserová P, Gritsevich M and Peltoniemi J (2024) Light-absorbing capacity of volcanic dust from Iceland and Chile. Front. Earth Sci. 12:1348082. doi: 10.3389/feart.2024.1348082
Received: 01 December 2023; Accepted: 25 June 2024;
Published: 26 July 2024.
Edited by:
Darius Ceburnis, University of Galway, IrelandReviewed by:
Alexander Mangold, Royal Meteorological Institute of Belgium, BelgiumCopyright © 2024 Koivusalo, Dagsson-Waldhauserová, Gritsevich and Peltoniemi. This is an open-access article distributed under the terms of the Creative Commons Attribution License (CC BY). The use, distribution or reproduction in other forums is permitted, provided the original author(s) and the copyright owner(s) are credited and that the original publication in this journal is cited, in accordance with accepted academic practice. No use, distribution or reproduction is permitted which does not comply with these terms.
*Correspondence: Taru F. A. Koivusalo, dGFydS5rb2l2dXNhbG9AaGVsc2lua2kuZmk=
†Present address: Taru F. A. Koivusalo, Faculty of Science, University of Helsinki, Helsinki, Finland; Faculty of Environmental and Forest Sciences, Agricultural University of Iceland, Reykjavik, Iceland
Disclaimer: All claims expressed in this article are solely those of the authors and do not necessarily represent those of their affiliated organizations, or those of the publisher, the editors and the reviewers. Any product that may be evaluated in this article or claim that may be made by its manufacturer is not guaranteed or endorsed by the publisher.
Research integrity at Frontiers
Learn more about the work of our research integrity team to safeguard the quality of each article we publish.