
94% of researchers rate our articles as excellent or good
Learn more about the work of our research integrity team to safeguard the quality of each article we publish.
Find out more
ORIGINAL RESEARCH article
Front. Earth Sci. , 26 June 2024
Sec. Volcanology
Volume 12 - 2024 | https://doi.org/10.3389/feart.2024.1342468
This article is part of the Research Topic Applications of Machine Learning in Volcanology View all 9 articles
 Pablo Rey-Devesa1,2*
 Joe Carthy3,4
 Manuel Titos3,4
 Janire Prudencio1,2
 Jesús M. Ibáñez1,2
 Carmen Benítez3,4
Introduction: Volcano seismology has successfully predicted several eruptions and includes many reliable methods that have been adopted extensively by volcanic observatories; however, there are several problems that still lack solutions. Meanwhile, the overwhelming success of data-driven models to solve predictive complex real-world problems positions them as an effective addition to the monitoring systems deployed in volcanological observatories.
Methods: By applying signal processing techniques on seismic records, we extracted four different seismic features, which usually change their trend when the system is approaching an eruptive episode. We built a temporal matrix with these parameters then defined a label for each temporal moment according to the real state of the volcanic activity (Unrest, Pre-Eruptive, Eruptive). To solve the remaining problem developing early warning systems that are transferable between volcanoes, we applied our methodology to databases associated with different volcanic systems, including data from both explosive and effusive episodes, recorded at several volcanic scenarios with open and closed conduits: Mt. Etna, Bezymianny, Volcán de Colima, Mount St. Helens and Augustine.
Results and Discussion: This work proposes the use of Neural Networks to classify the volcanic state of alert based on the behaviour of these features, providing a probability of having an eruption. This approach offers a Machine Learning tool for probabilistic short-term volcanic eruption forecasting, transferable to different volcanic systems. This innovative method classifies the state of volcanic hazard in near real-time and estimates a probability of the occurrence of an eruption, resulting in a period from at least hours to several days to forecast an eruption.
Volcanic eruptions are powerful and complex natural phenomena that can cause significant impact to the environment, human lives and infrastructure. Being able to forecast and understand these events is crucial to enable the instigation of preventive measures and to mitigate the associated risks. For decades, the scientific community has been developing reliable volcanic eruption monitoring methods and early warning tools. Volcanoes are dynamic systems with multiple correlated geophysical variables, like seismicity, temperature anomalies, ground deformation or gas emission (Fee et al., 2020; Girona et al., 2021; Angarita et al., 2022; Grapenthin et al., 2022; Torrisi et al., 2022; Shreve et al., 2023). The analysis and interpretation of these time-series remains a difficult task, requiring an interdisciplinary approach.
Between these disciplines, some of the most used tools in warning systems come from volcano seismology. Volcanic processes generate seismic activity that can be recorded as time series and studied to understand how the volcanic system is evolving. Through the extraction of different parameters of this signal, like the energy and the frequency content, several tools have been developed capable of finding possible precursory indicators whenever an eruption is approaching. Some of these methods are based on the study of the temporal evolution of these seismic parameters (Boué et al., 2015; Boué et al., 2016; Caudron et al., 2021; Ardid et al., 2022), while others are based on the classification of different types of seismic signals, that seismologists have been associating to different eruptive processes occurring in the volcano (Chouet and Matoza, 2013; McNutt and Roman, 2015; Girona et al., 2019).
Recently, machine learning (ML) emerged as an interesting and promising tool for pattern recognition and volcanic eruption forecasting (Curilem et al., 2009; Malfante et al., 2018a; Malfante et al., 2018b; Manley et al., 2020). Due to its capability of fast processing, the problem of large databases is being solved, and ML is providing itself to be a robust real-time monitoring tool, allowing continuous surveillance of volcanic processes and a rapid identification of significant changes in volcano-seismic patterns, not evident with traditional methods (Titos et al., 2018a; Manley et al., 2021), as well as improved classification of volcano seismic events associated with different volcanic processes (Titos et al., 2018b; Titos et al., 2019; Tan et al., 2023).
However, ML solutions still have unsolved challenges and limitations (Carniel and Guzmán, 2020; Whitehead and Bebbington, 2021). Performance of ML models depends on both the quality and the size of the available dataset. If the conditions of the volcanic system change abruptly within the training data, or if new volcanic phenomena appear, the classification capability of the model might not be very precise. Another limitation of ML models is that they fail to generate evidence to enable the formulation of an underlying physical model supported by geophysical and geochemical data to explain the results they are obtaining. Thus, human supervision and experts are still needed for interpreting the results obtained at observatories.
Besides these limitations, signal processing techniques have enabled the development of volcanic early warning tools, demonstrating its capability to detect significant changes in volcanic and seismic activity (Rey-Devesa et al., 2023b; Ardid et al., 2022; Caudron et al., 2020; Dempsey et al., 2020). This allows better hazard evaluation policy and protection for the population living in hazardous regions. These techniques take data from multiparametric forecasting systems and can provide a better understanding of the underlying volcanic processes. They have great potential to detect different type of changes in the system, their performance being independent of the type of seismicity recorded (Rey-Devesa et al., 2023a; Steinke et al., 2023).
In this work we show the forecasting potential of a machine learning volcano-independent classification tool based on the temporal evolution of 12 different seismic features, before and after volcanic eruptions. We defined a label associated to the eruptive stage as a function of the volcanic activity recorded on a set of different volcanoes (unrest period, pre-eruptive activity and eruptive volcano). Then we applied signal analysis techniques to the seismic records of these volcanoes in order to extract underlying seismic features. A moving window of 10 minutes was used with an overlap of 50%, generating a vector of features for each window, considering these as temporal units. After this, we associated the volcanic stage label with each temporal unit of the volcanoes studied, each of them with their corresponding values of the seismic features calculated. We used different volcanic systems to test the transferability and universality of the method. The studied volcanoes are associated with different explosive mechanisms, pre-eruptive activities and source processes; we worked with data from Augustine (United States), Mount St. Helens, (United States), Volcán de Colima (Mexico), Mt. Etna (Italy), and two different eruptive periods of Bezymianny (Russia), recorded in 2007 and 2017 respectively. This selection was dependent upon data availability. To make the values obtained for the different volcanoes comparable we normalized them using a z-score normalization. Then we implemented a Neural Network classification model and tested its performance for determining the volcanic stage of the system, based on the values of the seismic features. This model classifies the volcanic state of activity, generating a risk label in near real-time. In addition, it estimates the probability of being in each of the possible states. In this work we have seen that this probabilistic numeric value of having an imminent eruption increases whenever the volcanic eruption is approaching, independently of the volcanic system studied. This allows the surveillance team to consider the temporal evolution of a probabilistic numeric value as a reliable forecasting tool. This machine learning model is straightforward and allows its implementation in small and less powerful devices; the algorithm focusses on Tiny Machine Learning applications, to achieve the minimum of computation power and time required for analysing the data (Immonen and Hämäläinen, 2022).
The results obtained in this work evidence the reliability of this method as an automatic tool capable of forecasting volcanic eruptions with great potential, and it is shown to be transferable to different volcanic systems around the world. The method could be implemented in volcanic observatories with a consideration of not only seismic datasets. We are able to define a volcanic risk alert state in near real-time based on the experience of previous case studies.
Characterizing seismic signals is possible by using a small set of underlying features. Based on the work of Rey-Devesa et al. (2023a), and by using four seismic features (Energy, softened Shannon Entropy, Kurtosis and Frequency Index) most properties of an evolving volcanic system can be understood (Table 1). Traditionally, the energy of the seismicity and the source process of the seismic activity, defined through the waveform and spectrum of the seismic records, were used to understand the behaviour of the volcanic system and characterize its activity (McNutt and Roman, 2015). The study of parameters like Kurtosis and Frequency Index reflects the type of activity present in the volcano; kurtosis characterizes the presence of spectral peaks in temporal series, so impulsive high frequency signals like volcanic tectonic events will induce changes in the Kurtosis values (Cortés et al., 2015); on the other hand, the frequency index indicates changes in the spectral tendency of the signal, so energetic tremor or a swarm of long period events, which are both low frequency signals, will produce a displacement of the Energy content to the lower frequency bands, reflected in the trend of the Frequency Index (Bueno et al., 2019; Rey-Devesa et al., 2023a). In addition, Shannon Entropy is a measure of the uncertainty, or the amount of information, of a dataset, which provides a quantitative value of the predictability of the system; Shannon Entropy decreases whenever the volcanic seismic signals are homogeneous; thus, the changes of a volcano self-organizing prior to an eruption are reflected in a decreasing trend of the temporal evolution of the Shannon Entropy to minimum values (Shannon, 1948; Delgado-Bonal and Marshak, 2019; Rey-Devesa et al., 2023b). With these seismic features, we built a temporal matrix that involves data from several volcanoes; the data correspond to both eruptive and non-eruptive phases, involving seismicity associated to the noise prior of the eruption, the pre-eruptive activity, and the explosions. We want to highlight that we are working with databases from different volcanoes, each one of them with its own type of explosive activity, magma characteristics, source processes, pre-eruptive seismicity and conduit opening (Acocella et al., 2024).
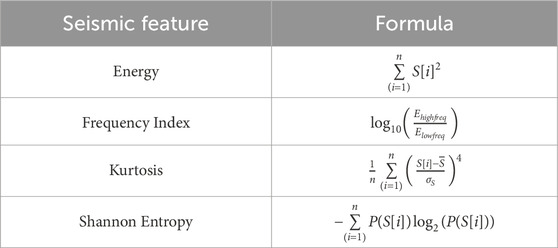
Table 1. Seismic Features and formula used to calculate them.
In Table 1 we can see the formulas used to estimate the values of our features in each window of analysis. Notice that
Several authors have used these set of features among others with the idea of classifying different volcanic-seismic signals (Malfante et al., 2018a; Malfante et al., 2018b; Titos et al., 2018a; Titos et al., 2018b). In this work we use this experience to take a step forward and automatically classify the volcanic alert level, defining three labels of volcanic activity (unrest, pre-eruptive and eruptive) and associating them to the values of these features. We consider as unrest a deviation of the typical background noise, that might or might not prelude an eruption (Phillipson et al., 2013). When the recorded seismic activity increases significatively, reflecting an imminent eruption, we define the pre-eruptive state (or impending eruption). This defines a database useful to compare with new datasets and, based upon that comparison, establish a real-time definition of the volcanic state.
First, we analysed the vertical component of the seismic records associated with each volcanic system separately. We started by preprocessing the signal with a Butterworth bandpass filter to eliminate low frequencies below 1 Hz and high frequencies over 16 Hz. This is done to remove anthropogenic noise, weather condition noise and tidal noise (Almendros et al., 2000). Then we defined a moving window for the analysis, which is displaced along the filtered seismic record. The length of this window was 10 min, since we were working with very large databases, and has an overlap of 50%. We analyse the record of that 10 minutes window and estimate the corresponding value of the four features of interest, then move to the next window and repeat the process. This way, we build a temporal vector for every feature, creating a matrix associated with the temporal evolution of each volcanic system, in which the rows represent the temporal unit and the columns the feature. We want to capture temporal fluctuations and trends in the behaviour of our seismic features; this way, the neural network can learn from the present information, and also from how the signal is changing according to the previous window. This would make our matrix more sensitive to changes that indicate an evolution of the volcanic activity. To make our matrix consistent over time, we also added the first and the second derivates of every feature, so we have 12 parameters in our matrix. The correlation matrix of the used features (Figure 1) shows that there is no redundant information from our four original input variables, which could negatively affect the performance of our model.
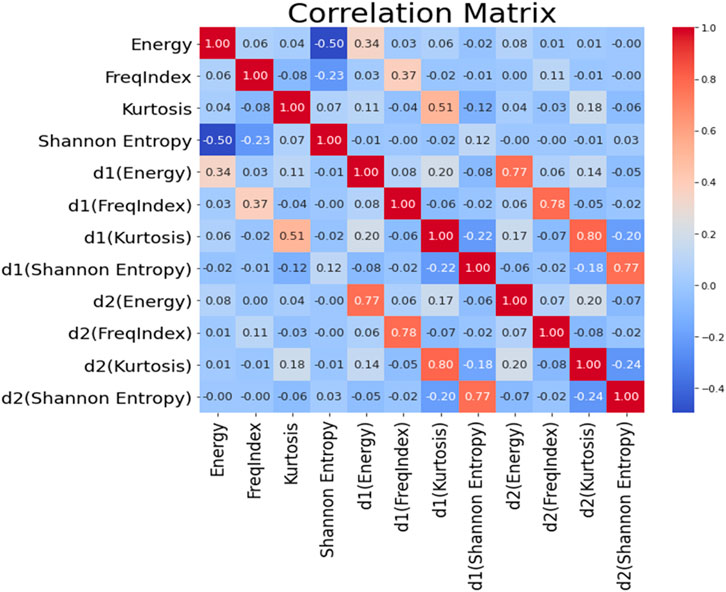
Figure 1. Correlation Matrix showing the relation between the temporal evolution of the 12 different features extracted from the seismic signal and used as the input for the neural network.
Based on the catalogues and the activity during the studied periods, we associated a volcanic stage label to each temporal unit (references in the Databases section). We defined three different labels: unrest, pre-eruptive and eruptive periods.
In order to make this system universal and transferable to every volcano, we built a unique large database involving the temporal matrix of each studied volcano. To ensure comparability among the matrices of different volcanoes, we normalized the temporal evolution values of each feature within its relative volcanic matrix using z-score normalization. This standardization offers several advantages in the context of machine learning analysis. It eliminates scale differences between features, prevents certain features from dominating the analysis, facilitates comparison, and reduces the risk of numerical problems, like convergence difficulties. To test the comparability of the different databases we generated the correlation matrix of the features for each studied volcano and found that all of them exhibit high similarity, both among themselves and to the reference Figure 1 (Supplementary Figure S1). After normalizing the temporal evolution of the features, we assembled the six matrices into a single matrix. We labelled this matrix with the corresponding label for each temporal unit. The full process is described in Figure 2.
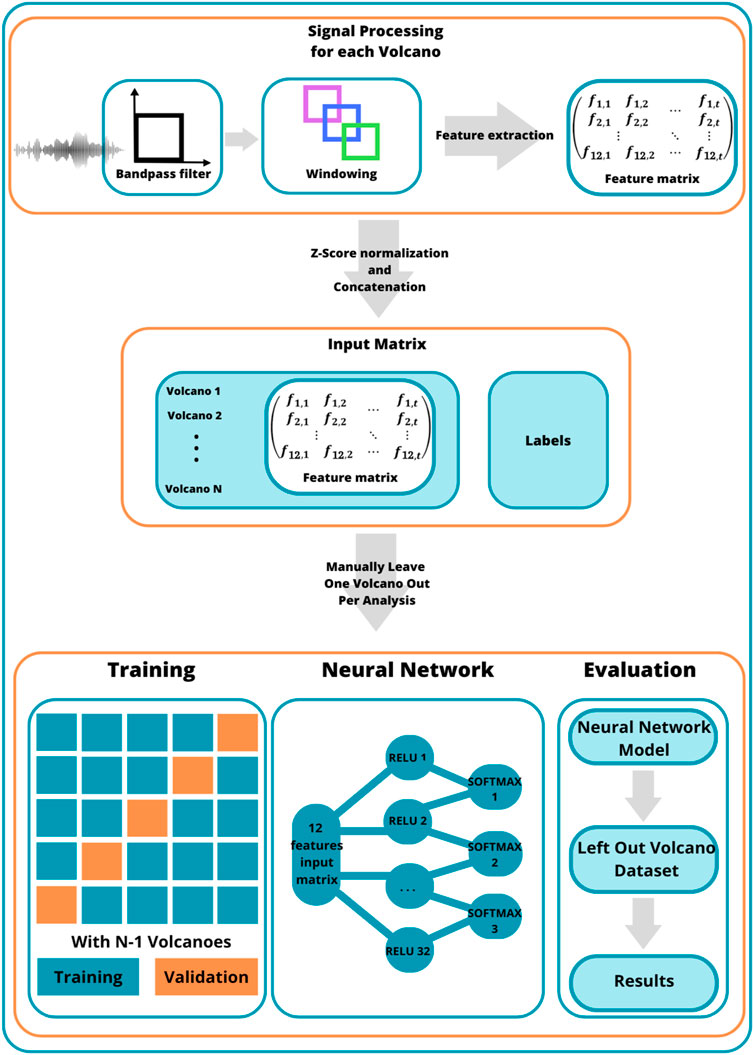
Figure 2. Flowchart of the methodology designed for this analysis. In first place we apply signal processing techniques over the seismic records of each volcanic dataset, creating a matrix with the temporal evolution of the seismic features. We use a z-score normalization for each matrix and create a unique matrix involving all the datasets, which now are comparable. We label this matrix in function of the volcanic state of the system (unrest, pre-eruptive and eruptive). We do the analysis independently for each dataset, so we leave one dataset out every time we run the model. Finally, we create a neural network model with a hidden dense layer of 32 units and a ReLU activation function and a second layer with a softmax function for classification. We use a k-fold cross validation model for the training; each of the 5 iterations use 80% of the data for training and 20% for validation. The model obtained is run over the excluded volcanic dataset.
Volcano seismology advances during last decades have been driven by the improvement of deep learning and machine learning techniques (Benítez et al., 2006; Cortés et al., 2021; Titos et al., 2022), particularly neural networks (Falsaperla et al., 1996; Scarpetta et al., 2005; Titos et al., 2018a; Titos et al., 2018b). Neural Networks are a computational model inspired by the structure of the human brain. These powerful tools have demonstrated exceptional efficacy in identifying underlying patterns and non-linear relationships in complex seismic datasets (Simpson, 1992; Bengio et al., 2007; Deng and Dong, 2014; LeCun et al., 2015), transforming monitoring and forecasting approaches of volcanic eruptions. The integration of higher sampling frequency data and extensive time series has led to more robust predictive models, capable of anticipating changes in volcanic activity with an unprecedented level of detail. These models can analyse raw seismic data in near real-time, identifying anomalous patterns that may indicate imminent eruptive activity. In addition, deep learning techniques have enabled the integration of data from multiple sources, including satellite imagery and volcanic gas measurements, for a holistic assessment of volcanic threat (Shoji et al., 2018; Martínez et al., 2021; Amato et al., 2023).
Our neural network approach is designed with a dense layer of 32 units, followed by a Rectified Linear Unit (ReLU) activation function, used to pass positive values unchanged and convert negative values to zero; this makes the extraction of crucial features easier (Boob et al., 2022). Then, a second dense layer with a softmax function; this function transforms a vector of real values into a vector of probabilities, enabling the classification of the three different volcanic states (Wang et al., 2018). The model compilation uses the categorical cross-entropy loss function to measure the difference between the predicted probability distribution and the actual distributions of the labels, making the training of the model more accurate; we used the Adam optimizer for updating the network weights during training, fine-tuning the model for multi-class classification challenge (Mehta et al., 2019; Mao et al., 2023). We implemented a K-Fold cross-validation model to improve the training and validation method of our analysis (Bengio and Grandvalet, 2003). We selected a specific volcano dataset of our matrix, leaving it out of the training set, and used it after the model was built for evaluating its performance. This process is repeated for each volcano. We used the remaining volcanoes for creating the models. 80% of this remaining dataset was used for training and the 20% for validation, permuting in each one of our 5 K-Fold iterations, ensuring that each part is used for both training and validation.
We have selected data from six eruptive periods associated to five different volcanoes. For each eruptive period we used one seismic station, chosen due to the completeness of the dataset and the distance to the volcanic crater; it has been observed that depending on the magnitude of the eruption, the location of the seismic station is relevant (Rey-Devesa et al., 2023a); we suggest distances below 5 km. Each dataset corresponds to the seismic signal recorded during several days or weeks prior to the eruptive episodes studied. These eruptive periods are: Augustine 2006 (AUH station, managed by Alaska Volcano Observatory); Bezymianny 2007 and 2017 (BELO and BZ01 stations respectively, by Kamchatkan Branch of Geophysical Survey); Volcán de Colima, involving a pyroclastic flow in July 2015 (SOMA station, by Centro Universitario de Estudios Vulcanológicos, University of Colima); Mt. Etna eruptive period in November 2013 (EBEM, by Instituto Nazionale di Geofisica e Vulcanologia); Mount St. Helens 2004 (SHW, by Pacific Northwest Seismic Network, University of Washington). The exact location of the seismic stations can be seen in Rey-Devesa et al., 2023a; Rey-Devesa et al., 2023b. Table 2 shows the classification of the total dataset according to the volcanic stage label and the eruptive period.
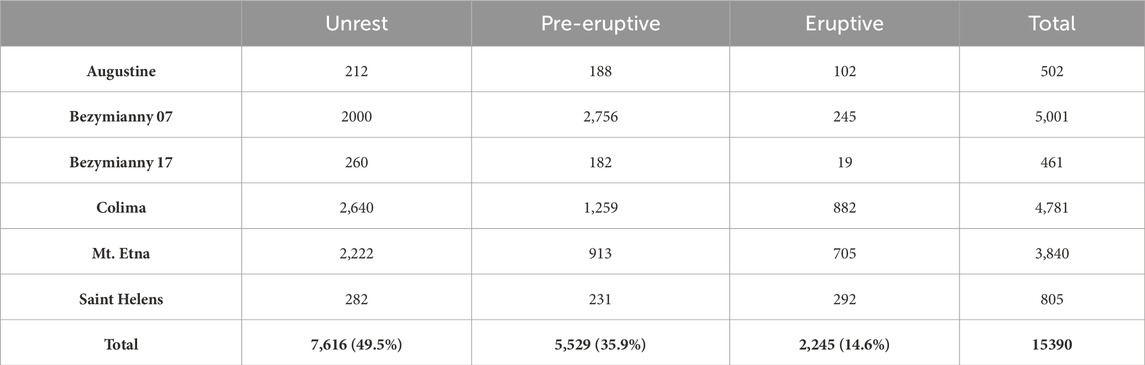
Table 2. Number of data associated with the volcanoes and the eruptive stages.
These volcanoes are representative of different types of volcanic region and eruptions, with and without relevant hydrothermal systems. The case studies are representative of open conduit, like Mt. Etna and Volcán de Colima (Chaussard et al., 2013; Zuccarello et al., 2022), semi-open conduit, like Bezymianny 2007 (West, 2013) and closed conduit systems like Augustine, Bezymianny 2017 and Mount St. Helens (De Angelis et al., 2013; Mania et al., 2019; Schlieder et al., 2022) respectively. Here we describe some differences between the type of eruptive activity, the seismicity generated by the eruptions and the composition of the lavas emitted.
The cases of study involve: a phreatic eruption at Mount St. Helens (De Siena et al., 2014; Gabrielli et al., 2020), pyroclastic flows and VT swarms at Volcán de Colima (Arámbula-Mendoza et al., 2019; Dávila et al., 2019), four episodes of lava fountaining and Strombolian activity at Mt. Etna (Bonaccorso et al., 2014), dome growth activity at Bezimianny (Thelen et al., 2010; Girina et al., 2013; Koulakov et al., 2021) and a Vulcanian eruption at Augustine (Manley et al., 2021; Zhan et al., 2022). In addition, there are variations on the characteristics of the seismicity representing pre-eruptive activity: tremor at Mt. Etna, VT swarms at Bezimianny, and mixed activity at Mount St. Helens (Spampinato et al., 2019; Rey-Devesa et al., 2023a). Moreover, the volcanoes studied are representative of different lava types: basaltic lavas at Mt. Etna (Polacci et al., 2019; Zuccarello et al., 2022), andesitic at Bezymianny (Davydova et al., 2022) and dacitic-rhyolitic at Augustine (Wasser et al., 2021).
In Figures 3–8 we show the temporal evolution of the unrest, pre-eruptive and eruptive state probabilities over time for the six different volcanic databases. Confusion matrices provide a detailed view of the model performance for each volcanic database. In this case, an excellent correspondence is observed between the model predictions and the actual states. The loss and accuracy curves offer crucial insights into the model performance during training. The curves indicate that there is no evidence of overfitting. The loss consistently decreases during training, while accuracy increases, suggesting that the model generalizes well to unseen data. These results are very promising and suggest that the model has effectively captured the characteristic patterns associated with the different eruptive phases of these case studies.
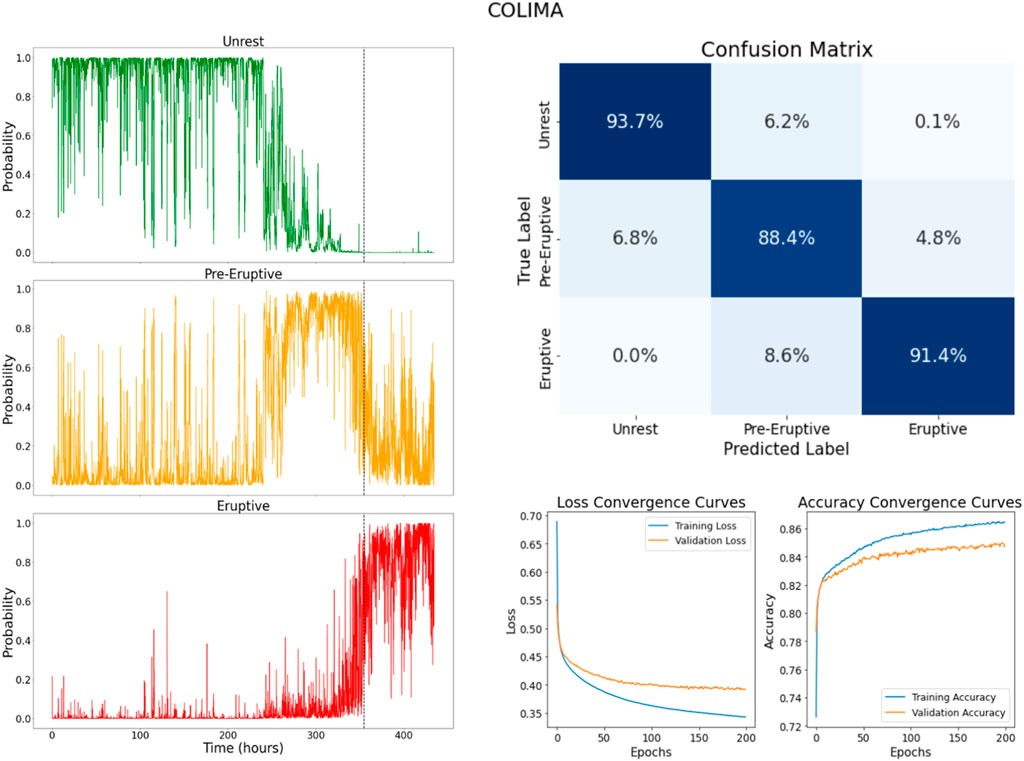
Figure 3. Results of the model for Volcán de Colima dataset. Left: we can see the temporal evolution of the probability of being on each state (green for unrest, yellow for pre-eruptive and red for eruptive); the vertical dashed line represents the onset of the eruption of 11 July 2015. Top right: the confusion matrix of the classification system. Bottom right: the training and validation convergence curves for loss and accuracy, showing that the model is not overfitting.
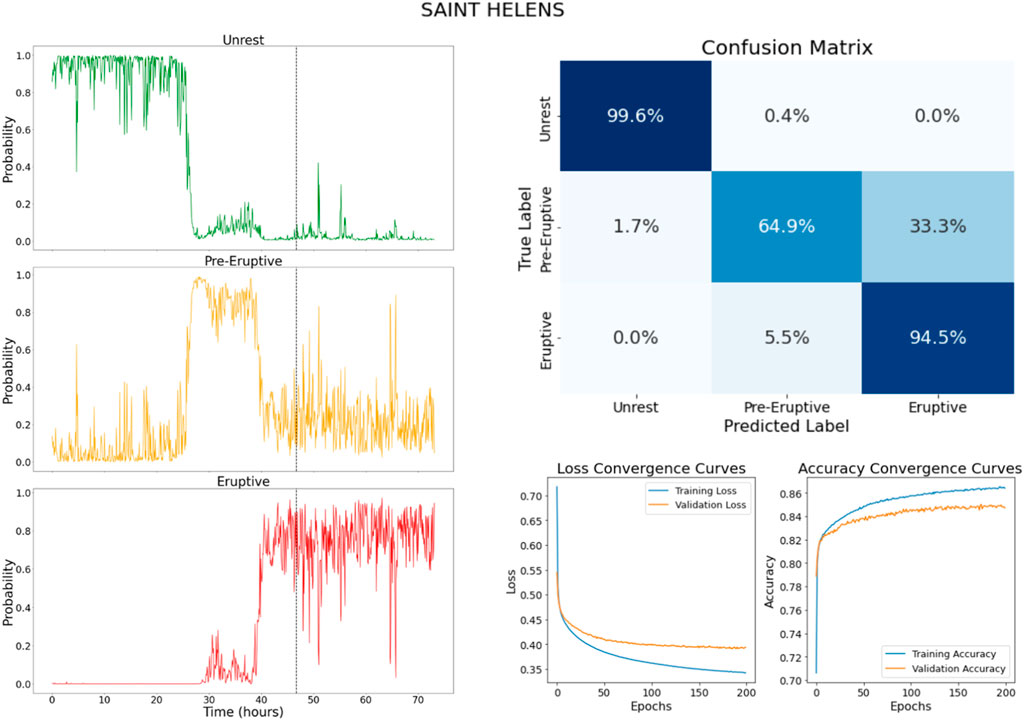
Figure 4. Results of the model for Mount St. Helens volcano dataset. Left: we can see the temporal evolution of the probability of being on each state (green for unrest, yellow for pre-eruptive and red for eruptive); the vertical dashed line represents the onset of the eruption of 01 October 2004. Top right: the confusion matrix of the classification system. Bottom right: the training and validation convergence curves for loss and accuracy, showing that the model is not overfitting.
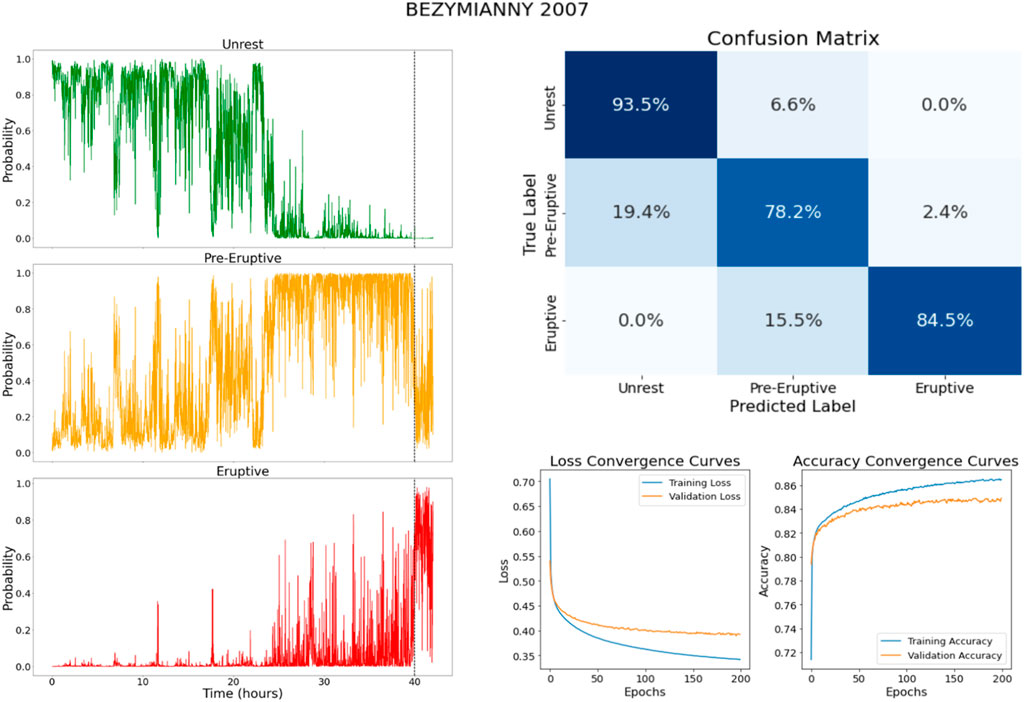
Figure 5. Results of the model for the Bezymianny 2007 dataset. Left: we can see the temporal evolution of the probability of being on each state (green for unrest, yellow for pre-eruptive and red for eruptive); the vertical dashed line represents the onset of the eruption of 14 October 2007. Top right: the confusion matrix of the classification system. Bottom right: the training and validation convergence curves for loss and accuracy, showing that the model is not overfitting.
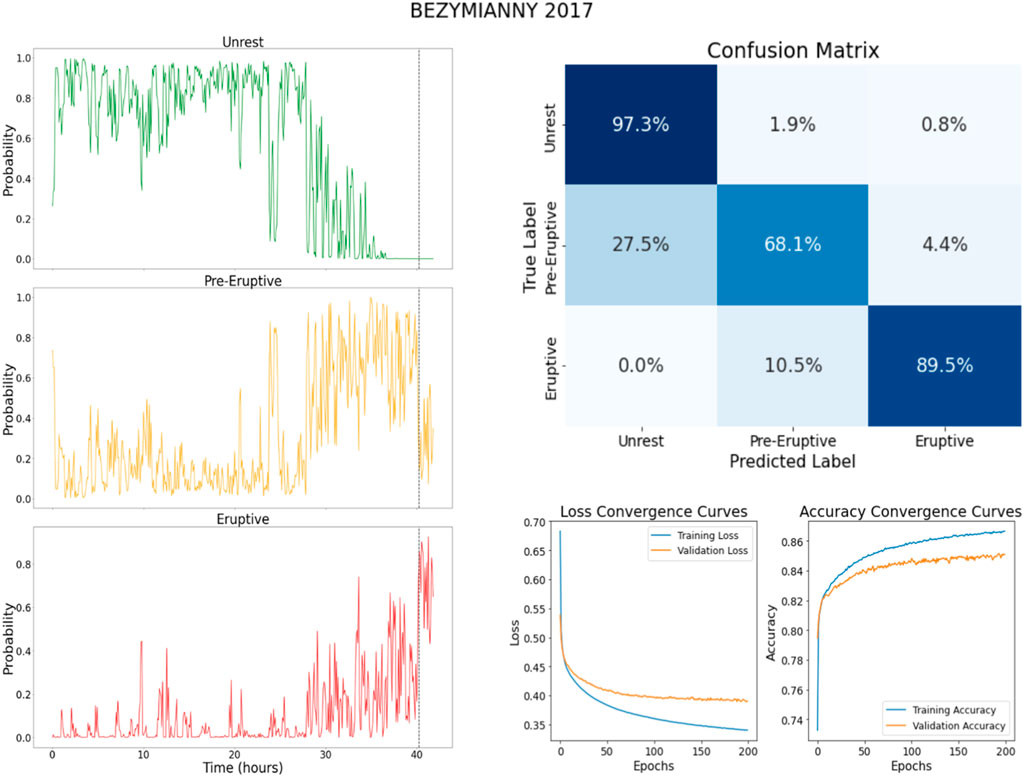
Figure 6. Results of the model for the Bezymianny 2017 dataset. Left: we can see the temporal evolution of the probability of being on each state (green for unrest, yellow for pre-eruptive and red for eruptive); the vertical dashed line represents the onset of the eruption of 20 December 2017. Top right: the confusion matrix of the classification system. Bottom right: the training and validation convergence curves for loss and accuracy, showing that the model is not overfitting.
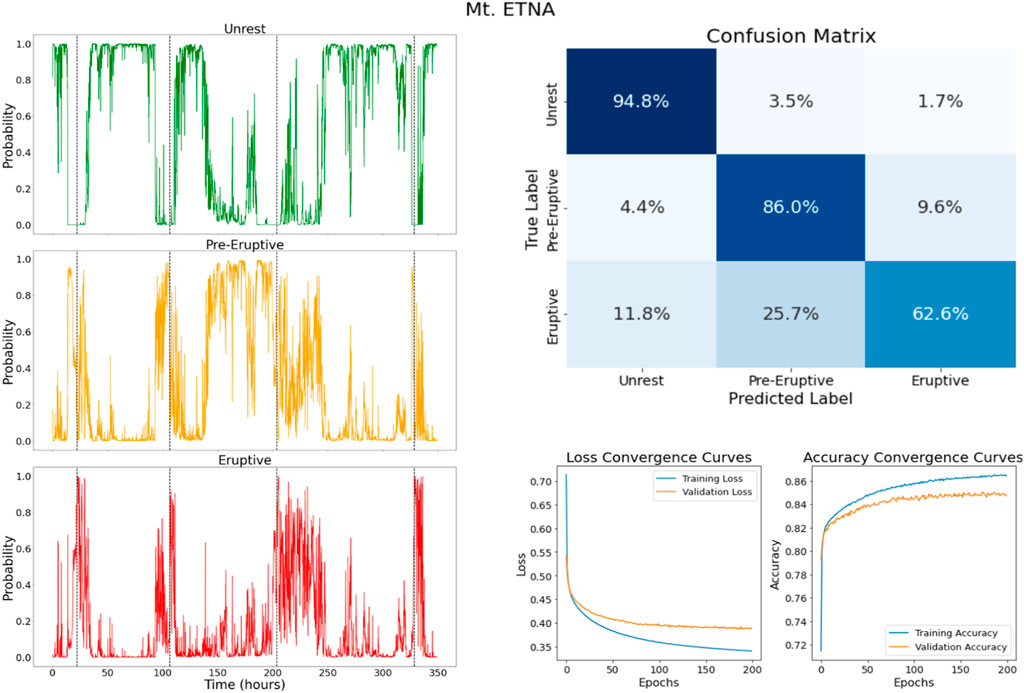
Figure 7. Results of the model for Mt. Etna. Left: we can see the temporal evolution of the probability of being on each state (green for unrest, yellow for pre-eruptive and red for eruptive); every vertical dashed line represents the onset of the eruptive paroxysms of November 2013. Top right: the confusion matrix of the classification system. Bottom right: the training and validation convergence curves for loss and accuracy, showing that the model is not overfitting.
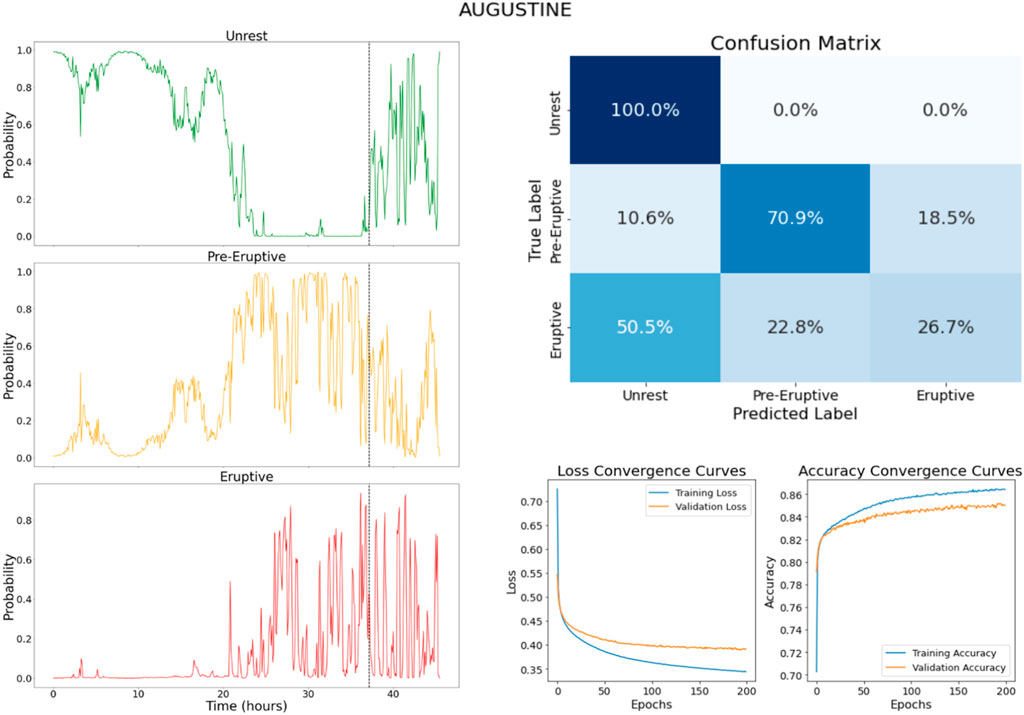
Figure 8. Results of the model for Augustine. Left: we can see the temporal evolution of the probability of being on each state (green for unrest, yellow for pre-eruptive and red for eruptive); the vertical dashed line represents the onset of the eruption of 11 January 2006. Top right: the confusion matrix of the classification system. Bottom right: the training and validation convergence curves for loss and accuracy, showing that the model is not overfitting.
These results show the temporal evolution of the probability of being in each volcanic state (unrest, pre-eruptive and eruptive) for each of the six databases studied. One key observation is that the unrest state is the easiest to determine for the neural network, being almost never confused with other eruptive states. The probability of being in the unrest state remains almost 100% for every case of study when the volcanic systems are in an unrest period. To complement this observation, we applied the model trained with all databases to 1 month of seismic data recorded at Bezymianny during an unrest period in September 2017. These data were not included in our training dataset. The performance was >95% of data interpreted as unrest and the remaining <5% as a pre-eruptive state, which might be due to VT swarms recorded during that period (Titos et al., 2023). We can affirm that our model hardly ever displays false alarms when it comes to determine that the system is in unrest, displaying great robustness.
The results for determining the probability of being in pre-eruptive and eruptive states are also outstanding. However, confusion between states increases slightly when it comes to determine the difference between pre-eruptive or eruptive state scenarios. One case study that stands out is Augustine volcano. This can be explained by considering that a volcanic eruption can evolve, or even be temporarily interrupted, implying that the eruptive state is an unstable scenario. The Augustine eruption combined eruptive paroxysms with intervals of low seismicity and quiescence (Global Volcanism Program, 2006).
We want to highlight an observed characteristic pattern, which is relevant to the development of early warning systems for volcanic eruption forecasting. We observe that the pre-eruptive probability starts to increase days before the eruption, dominating the other categories. This is sufficient to establish in real-time that a certain process is ongoing in the volcanic system. Furthermore, it is particularly interesting to note that before entering the period in which the eruptive state dominates, the probability of that state shows a gradual increase. Notice that our model might confuse the beginning of the pre-eruptive state with the unrest, but not with the eruptive, which hast a probability around 0%; however, when the pre-eruptive state is about to finish, the model might confuse it with the eruptive state, and the unrest state probability decays until 0%.
Upon observing our case studies, we notice that the model determines the beginning of the pre-eruptive state between at least 10–15 h before the beginning of the eruption in the worst case, which is the lava fountains at Mt. Etna, and several days in the best case, like Volcán de Colima or Mount St. Helens; these time intervals calculated for the lava fountains at Mt. Etna complement the results of previous seismicity and infrasound forecasting studies (Ripepe et al., 2018; Rey-Devesa et al., 2023a). Moreover, the methodology determines the eruptive state of the volcanic system in near real-time. Identifying the increasing probability of being in an eruptive state is highlighting the possibility of an imminent eruption; this is a reliable numeric value for affirming the probability of a volcanic eruption to happen in the short-term and would improve the surveillance of a volcanic system and the capability of forecasting an eruption. The probability of being in the eruptive state usually goes up to 80% whenever a volcanic eruption is about to start, demonstrating that the methodology has potential as a universal surveillance tool. This method could allow the team responsible of making choices to take preventive measures, thus reducing the volcanic risk and the impact to the surrounding communities.
The relationship between the duration of the pre-eruptive stage and features like the degree of conduit opening (open, closed, semi-open), or the explosivity of the eruption, is crucial for understanding volcanic eruption dynamics and its forecasting. In closed conduit and semi-open conduit systems, a longer pre-eruptive stage results in significant magma accumulation and pressure buildup, leading to explosive eruptions, as seen with Mount St. Helens in 2004, Augustine in 2006 and Bezymianny in 2007 and 2017. Open conduits typically have shorter pre-eruptive stages, allowing magma to ascend more freely and resulting in effusive eruptions, as observed at Etna in 2013. However, in some cases like Colima in 2014, a prolonged pre-eruptive stage can still be associated with an open conduit situation; this might be induced by the presence of a dome covering the crater of the volcano (Reyes-Dávila et al., 2016). This correlation highlights the results of Acocella et al. (2024), noticing that longer pre-eruptive durations are generally associated with closed conduits and more explosive activity, while shorter durations usually correspond to open conduits and predominantly effusive eruptions.
Efforts to enhance the predictive capabilities of volcanic eruptions have led to the development of sophisticated machine learning applications in volcano seismology. Despite its successes, there remain challenges that require innovative solutions. In this context, data-driven models have emerged as an effective alternative to complement monitoring systems in volcanic observatories. This study introduces a tool designed to establish eruption risk alerts and estimate associated probabilities using a neural network. Signal analysis techniques were applied to seismic records, enabling the extraction of 12 distinct seismic features. These features, typically stable during periods of inactivity, revealed significant trends in the lead-up to eruptive episodes (Rey-Devesa et al., 2023a; b). Through a temporal matrix of parameters linked to the volcanic system and labels corresponding to real states (Unrest, Pre-Eruptive, Eruptive), a robust analytical foundation was established. However, for testing the exportability of the model we needed several databases corresponding to various volcanic systems, including both explosive and effusive eruptive episodes. In this regard, a meticulous analysis of seismic data was conducted in diverse volcanic scenarios: Mount Etna, Bezymianny (2007 and 2017 paroxysms), Volcán de Colima, Mount St. Helens, and Augustine.
We showed the results of the applications of Machine Learning to classify the volcanic alert state based on the behaviour of these features and provide an estimation of the probability of future eruptions. Evaluation was carried out through a neural network approach on the selected volcanoes, using the previously constructed feature databases, demonstrating its transferability by building a model that incorporates data from various case studies. These scenarios represent a diverse set of eruptive activities (explosive and effusive) as well as different seismic precursory patterns (volcano-tectonic events, tremor, mixed activity, etc.) and different conduit systems.
We propose a preliminary tool that can be easily implemented in near real-time at volcanic observatories for complementing the decision-making systems used nowadays for establishing volcanic alerts. The methodology is simple since the features used for training the network have been chosen in a precise way due to the relevant information that they offer about the temporal evolution of the volcanic activity. The extraction of features like Kurtosis and Frequency Index from the continuous seismic signal evaluates the variation of the number of highly impulsive events, like earthquakes, or changes in the frequency band in which the more energetic seismic activity is being recorded, respectively; on the other hand, previous studies on Differential Shannon Entropy give an insight on the role of this statistical parameter as an indicator of the uncertainty of the volcanic state (Rey-Devesa et al., 2023a; b). Thus, this system searches non-linear combinations of these features that allow the classification of three possible states of the volcanic system: Unrest, indicating a deviation from the background noise; Pre-Eruptive, indicating significant changes of the trend of the seismic features calculated that preludes eruptive activity; and the Eruptive state, in which different types of eruptive activity might be ongoing. This approach could be improved including more seismic features in the input matrix.
Our study has been developed in different volcanic scenarios with widely studied eruptive processes. Our neural network approach is not complex; the architecture is provided with 2 dense layers. As the convergence curves show, the model is not overtrained. In the Databases section and Table 2, the number of events and volcanic processes required for the training and for used these experiments are described. During the experiments we have used the 80% of the data for training and the 20% for validation, repeating the procedure 5 times, permuting the data used for each process during the iterations; in every experiment, the database used for evaluation was left out before the training.
The aim of our work is determining the probability of a transition from an apparently quiescence or unrest state of the volcanic system to another state, rather than determining the internal processes of the volcano. Our approximation using statistical features might be not enough for the development of the physical model explaining the underlying processes of the volcanic system. In order to improve the method reliability and performance, the incorporation of real-time datasets of other monitored parameters, like geodesy, gas emissions or temperature measurements would have enormous potential; due to the feasibility of working with the time interval of the windows of analysis, their variety in the sampling frequency is not a problem. Moreover, we have been working with datasets from only one seismic station for every case of study, but to make the methodology more applicable for volcanic observatories it would be interesting to consider training the neural network with data recorded in the largest possible number of available seismic stations at each volcano.
These results represent a step further in the development of effective non-biased volcanic forecasting tools. In addition to this we can offer a quantification of the increasing probability of an eruption as the activity is approaching. The early identification of the pre-eruptive activity offers sufficient time for the decision making before the situation escalates, allowing the application of the appropriate measures in case of a volcanic crisis.
Despite the promising results achieved, we want to acknowledge that the model reliability is associated to the quality and availability of seismic datasets. Thus, human supervision and interpretation of the evolution of the probability is still a crucial step.
In summary, the results of this machine learning approach suggest that the methodology shows great promise as an effective and quantitative method for volcanic eruption forecasting across a variety of volcanic systems.
The datasets analysed for this study can be found in the ZENODO and IRIS network: (https://doi.org/10.5281/zenodo.7732898; https://doi.org/10.5281/zenodo.6821530; https://doi.org/10.5281/zenodo.6849621; https://ds.iris.edu/mda).
PR-D: Conceptualization, Data curation, Formal Analysis, Methodology, Software, Visualization, Writing–original draft, Writing–review and editing. JC: Methodology, Software, Writing–review and editing. MT: Methodology, Software, Writing–review and editing. JP: Writing–review and editing. JI: Funding acquisition, Project administration, Writing–review and editing. CB: Conceptualization, Funding acquisition, Methodology, Project administration, Software, Visualization, Writing–review and editing.
The author(s) declare financial support was received for the research, authorship, and/or publication of this article.
This work has been funded by the Spanish Project PID2022-143083NB-I00, “LEARNING”, funded by MICIU/AEI /10.13039/501100011033 and by FEDER, UE. The authors have been partially funded by the projects PROOF-FOREVER (EUR2022.134044), ALARM (C.EXP. 022.UGR23) and IMPROVE–- Innovative Multi-disciPlinary European Research training netwOrk on VolcanoEs. PR-D was funded by the Ministerio de Ciencia e Innovación del Gobierno de España (MCIN), Agencia Estatal de Investigación (AEI), Fondo Social Europeo (FSE), and Programa Estatal de Promoción del Talento y su Empleabilidad en I+D+I Ayudas para contratos predoctorales para la formación de doctores 2020 (PRE2020-092719). This work has been partially funded by the Spanish Project: PLEC2022-009271 “DigiVolCa”, funded by MCIN/AEI, funded by MCIN/AEI/10.13039/501100011033 and by EU «NextGenerationEU/PRTR», 10.13039/501100011033.
The authors declare that the research was conducted in the absence of any commercial or financial relationships that could be construed as a potential conflict of interest.
All claims expressed in this article are solely those of the authors and do not necessarily represent those of their affiliated organizations, or those of the publisher, the editors and the reviewers. Any product that may be evaluated in this article, or claim that may be made by its manufacturer, is not guaranteed or endorsed by the publisher.
The Supplementary Material for this article can be found online at: https://www.frontiersin.org/articles/10.3389/feart.2024.1342468/full#supplementary-material
Acocella, V., Ripepe, M., Rivalta, E., Peltier, A., Galetto, F., and Joseph, E. (2024). Towards scientific forecasting of magmatic eruptions. Nat. Rev. Earth Environ. 5 (1), 5–22. doi:10.1038/s43017-023-00492-z
Almendros, J., Ibáñez, J. M., Alguacil, G., Morales, J., Del Pezzo, E., La Rocca, M., et al. (2000). A double seismic antenna experiment at Teide volcano: existence of local seismicity and lack of evidences of volcanic tremor. J. Volcan. Geotherm. Res. 103 (1–4), 439–462. doi:10.1016/s0377-0273(00)00236-5
Amato, E., Corradino, C., Torrisi, F., and Del Negro, C. (2023). A deep convolutional neural network for detecting volcanic thermal anomalies from satellite images. Remote Sens. 15 (15), 3718. doi:10.3390/rs15153718
Angarita, M., Grapenthin, R., Plank, S., Meyer, F. J., and Dietterich, H. (2022). Quantifying large-scale surface change using SAR amplitude images: crater morphology changes during the 2019–2020 shishaldin volcano eruption. J. Geophys. Res. Solid Earth 127 (8), e2022JB024344. doi:10.1029/2022JB024344
Arámbula-Mendoza, R., Reyes-Dávila, G., Domínguez-Reyes, T., Vargas-Bracamontes, D., González-Amezcua, M., Martínez Fierros, A., et al. (2019). “Seismic activity associated with Volcán de Colima,” in Volcán de Colima (Berlin, Heidelberg: Springer), 195–218. doi:10.1007/978-3-642-25911-1_1
Ardid, A., Dempsey, D., Caudron, C., and Cronin, S. (2022). Seismic precursors to the Whakaari 2019 phreatic eruption are transferable to other eruptions and volcanoes. Nat. Commun. 13 (1), 2002–2009. doi:10.1038/s41467-022-29681-y
Bengio, Y., and Grandvalet, Y. (2003). No unbiased estimator of the variance of k-fold cross-validation. Adv. Neural Inf. Process. Syst. 16.
Bengio, Y., Lamblin, P., Popovici, D., and Larochelle, H. (2007). “Greedy layer-wise training of deep networks,” in Advances in neural information processing systems (Cambridge, MA: The MIT Press), 153–160.
Benítez, M. C., Ramírez, J., Segura, J. C., Ibanez, J. M., Almendros, J., García-Yeguas, A., et al. (2006). Continuous HMM-based seismic-event classification at deception island, Antarctica. IEEE Trans. Geoscience Remote Sens. 45 (1), 138–146. doi:10.1109/TGRS.2006.882264
Bonaccorso, A., Calvari, S., Linde, A., and Sacks, S. (2014). Eruptive processes leading to the most explosive lava fountain at Etna volcano: the 23 November 2013 episode. Geophys. Res. Lett. 41 (14), 4912–4919. doi:10.1002/2014GL060623
Boob, D., Dey, S. S., and Lan, G. (2022). Complexity of training ReLU neural network. Discrete Optim. 44, 100620. doi:10.1016/j.disopt.2020.100620
Boué, A., Lesage, P., Cortés, G., Valette, B., and Reyes-Dávila, G. (2015). Real-time eruption forecasting using the material Failure Forecast Method with a Bayesian approach. J. Geophys. Res. Solid Earth 120 (4), 2143–2161. doi:10.1002/2014JB011637
Boué, A., Lesage, P., Cortés, G., Valette, B., Reyes-Dávila, G., Arámbula-Mendoza, R., et al. (2016). Performance of the ‘material Failure Forecast Method’ in real-time situations: a Bayesian approach applied on effusive and explosive eruptions. J. Volcanol. Geotherm. Res. 327, 622–633. doi:10.1016/j.jvolgeores.2016.10.002
Bueno, A., Benitez, C., De Angelis, S., Moreno, A. D., and Ibáñez, J. M. (2019). Volcano-seismic transfer learning and uncertainty quanti fication with Bayesian neural networks. IEEE Trans. Geoscience Remote Sens. 58 (2), 892–902. doi:10.1109/tgrs.2019.2941494TGRS.2019.2941494
Carniel, R., and Guzmán, S. (2020). Chapter machine learning in Volcanology: a review. doi:10.5772/intechopen.94217
Caudron, C., Chardot, L., Girona, T., Aoki, Y., and Fournier, N. (2020). Editorial: towards improved forecasting of volcanic eruptions. Front. Earth Sci. 8, 45. doi:10.3389/feart.2020.00045
Caudron, C., Girona, T., Jolly, A., Christenson, B., Savage, M. K., Carniel, R., et al. (2021). A quest for unrest in multiparameter observations at Whakaari/White Island volcano, New Zealand 2007–2018. Earth, Planets Space 73 (1), 195–221. doi:10.1186/s40623-021-01506-0
Chaussard, E., Amelung, F., and Aoki, Y. (2013). Characterization of open and closed volcanic systems in Indonesia and Mexico using InSAR time series. J. Geophys. Res. Solid Earth 118 (8), 3957–3969. doi:10.1002/jgrb.50288
Chouet, B. A., and Matoza, R. S. (2013). A multi-decadal view of seismic methods for detecting precursors of magma movement and eruption. J. Volcanol. Geotherm. Res. 252, 108–175. doi:10.1016/j.jvolgeores.2012.11.013
Cortés, G., Benitez, M. C., García, L., Álvarez, I., and Ibanez, J. M. (2015). A comparative study of dimensionality reduction algorithms applied to volcano-seismic signals. IEEE J. Sel. Top. Appl. Earth Observations Remote Sens. 9 (1), 253–263. doi:10.1109/jstars.2015.2479300
Cortés, G., Carniel, R., Lesage, P., Mendoza, M. Á., and Della Lucia, I. (2021). Practical volcano-independent recognition of seismic events: VULCAN. Ears project. Front. Earth Sci. 8, 616676. doi:10.3389/feart.2020.616676
Curilem, G., Vergara, J., Fuentealba, G., Acuña, G., and Chacón, M. (2009). Classification of seismic signals at Villarrica volcano (Chile) using neural networks and genetic algorithms. J. Volcanol. Geotherm. Res. 180 (1), 1–8. doi:10.1016/j.jvolgeores.2008.12.002
Dávila, N., Capra, L., Ferrés, D., Gavilanes-Ruiz, J. C., and Flores, P. (2019). Chronology of the 2014–2016 Eruptive Phase of Volcán de Colima and Volume Estimation of Associated Lava Flows and Pyroclastic Flows Based on Optical Multi-Sensors. Remote Sens. 11 (10), 1167. doi:10.3390/rs11101167
Davydova, V. O., Shcherbakov, V. D., Plechov, P. Y., and Koulakov, I. Y. (2022). Petrological evidence of rapid evolution of the magma plumbing system of Bezymianny volcano in Kamchatka before the December 20th, 2017 eruption. J. Volcanol. Geotherm. Res. 421, 107422. doi:10.1016/j.jvolgeores.2021.107422
De Angelis, S. H., Larsen, J., and Coombs, M. (2013). Pre-eruptive magmatic conditions at Augustine Volcano, Alaska, 2006: evidence from amphibole geochemistry and textures. J. Petrology 54 (9), 1939–1961. doi:10.1093/petrology/egt037
Delgado-Bonal, A., and Marshak, A. (2019). Approximate entropy and sample entropy: a comprehensive tutorial. Entropy 21 (6), 541. doi:10.3390/e21060541
Dempsey, D. E., Cronin, S. J., Mei, S., and Kempa-Liehr, A. W. (2020). Automatic precursor recognition and real-time forecasting of sudden explosive volcanic eruptions at Whakaari, New Zealand. Nat. Commun. 11 (1), 3562–3568. doi:10.1038/s41467-020-17375-2
Deng, L., and Dong, Y. (2014). Deep learning: methods and applications. Found. Trends Signal Process 7 (3–4), 197–387. doi:10.1561/2000000039
De Siena, L., Thomas, C., Waite, G. P., Moran, S. C., and Klemme, S. (2014). Attenuation and scattering tomography of the deep plumbing system of Mount St. Helens. J. Geophys. Res. Solid Earth 119 (11), 8223–8238. doi:10.1002/2014JB011372
Falsaperla, S., Graziani, S., Nunnari, G., and Spampinato, S. (1996). Automatic classification of volcanic earthquakes by using multi-layered neural networks. Nat. Hazards 13, 205–228. doi:10.1007/bf00215816
Fee, D., Lyons, J., Haney, M., Wech, A., Waythomas, C., Diefenbach, A. K., et al. (2020). Seismo-acoustic evidence for vent drying during shallow submarine eruptions at Bogoslof volcano, Alaska. Bull. Volcanol. 82, 2–14. doi:10.1007/s00445-019-1326-5
Gabrielli, S., Spagnolo, M., and De Siena, L. (2020). Geomorphology and surface geology of Mount St. Helens volcano. J. Maps 16 (2), 585–594. doi:10.1080/17445647.2020.1790048
Girina, O. A. (2013). Chronology of Bezymianny volcano activity, 1956–2010. J. Volcanol. Geotherm. Res. 263, 22–41. doi:10.1016/j.jvolgeores.2013.05.002
Girona, T., Caudron, C., and Huber, C. (2019). Origin of shallow volcanic tremor: the dynamics of gas pockets trapped beneath thin permeable media. J. Geophys. Res. Solid Earth 124 (5), 4831–4861. doi:10.1029/2019JB017482
Girona, T., Realmuto, V., and Lundgren, P. (2021). Large-scale thermal unrest of volcanoes for years prior to eruption. Nat. Geosci. 14 (4), 238–241. doi:10.1038/s41561-021-00705-4
Global Volcanism Program (2006). “Report on augustine (United States),” in Bulletin of the global volcanism network. Editor R. Wunderman (Washington, DC: Smithsonian Institution), 31, 1. doi:10.5479/si.GVP.BGVN200601-313010
Grapenthin, R., Cheng, Y., Angarita, M., Tan, D., Meyer, F. J., Fee, D., et al. (2022). Return from Dormancy: rapid inflation and seismic unrest driven by transcrustal magma transfer at Mt. Edgecumbe (L’úx Shaa) Volcano, Alaska. Geophys. Res. Lett. 49 (20), e2022GL099464. doi:10.1029/2022GL099464
Immonen, R., and Hämäläinen, T. (2022). Tiny machine learning for resource-constrained microcontrollers. J. Sensors 2022, 1–11. doi:10.1155/2022/7437023
Koulakov, I., Plechov, P., Mania, R., Walter, T. R., Smirnov, S. Z., Abkadyrov, I., et al. (2021). Anatomy of the Bezymianny volcano merely before an explosive eruption on 20.12. 2017. Sci. Rep. 11 (1), 1758–1812. doi:10.1038/s41598-021-81498-9
LeCun, Y., Bengio, Y., and Hinton, G. (2015). Deep learning. Nature 521 (7553), 436–444. doi:10.1038/nature14539
Malfante, M., Dalla Mura, M., Mars, J. I., Métaxian, J. P., Macedo, O., and Inza, A. (2018a). Automatic classification of volcano seismic signatures. J. Geophys. Res. Solid Earth 123 (12), 10645–10658. doi:10.1029/2018JB015470
Malfante, M., Dalla Mura, M., Métaxian, J. P., Mars, J. I., Macedo, O., and Inza, A. (2018b). Machine learning for volcano-seismic signals: chal lenges and perspectives. IEEE Signal Process. Mag. 35 (2), 20–30. doi:10.1109/MSP.2017.2779166
Mania, R., Walter, T. R., Belousova, M., Belousov, A., and Senyukov, S. L. (2019). Deformations and morphology changes associated with the 2016–2017 eruption sequence at Bezymianny Volcano, Kamchatka. Remote Sens. 11 (11), 1278. doi:10.3390/rs11111278
Manley, G. F., Mather, T. A., Pyle, D. M., Clifton, D. A., Rodgers, M., Thompson, G., et al. (2021). Machine learning approaches to identifying changes in eruptive state using multi-parameter datasets from the 2006 eruption of Augustine Volcano, Alaska. J. Geophys. Res. Solid Earth 126 (12), e2021JB022323. doi:10.1029/2021JB022323
Manley, G. F., Pyle, D. M., Mather, T. A., Rodgers, M., Clifton, D. A., Stokell, B. G., et al. (2020). Understanding the timing of eruption end using a machine learning approach to classification of seismic time series. J. Volcanol. Geotherm. Res. 401, 106917. doi:10.1016/j.jvolgeores.2020.106917
Mao, A., Mohri, M., and Zhong, Y. (2023). “Cross-entropy loss functions: theoretical analysis and applications,” in Proceedings of the 40 th International Conference on Machine Learning, Honolulu, Hawaii (PMLR), 23803–23828.
Martínez, V. L., Titos, M., Benítez, C., Badi, G., Casas, J. A., Craig, V. H. O., et al. (2021). Advanced signal recognition methods applied to seismo-volcanic events from planchon peteroa volcanic complex: deep neural network classifier. J. S. Am. Earth Sci. 107 (1–12), 103115. doi:10.1016/j.jsames.2020.103115
McNutt, S. R., and Roman, D. C. (2015). “Volcanic seismicity,” in The encyclopedia of volcanoes. 2nd edn, Editor H. Sigurdsson (Amsterdam, Netherlands: Elsevier Inc.), 1011–1034. doi:10.1016/b978-0-12-385938-9.00059-6
Mehta, S., Paunwala, C., and Vaidya, B. (2019). “CNN based traffic sign classification using Adam optimizer,” in 2019 international conference on intelligent computing and control systems (ICCS) (Piscataway, NJ: IEEE), 1293–1298.
Phillipson, G., Sobradelo, R., and Gottsmann, J. (2013). Global volcanic unrest in the 21st century: an analysis of the first decade. J. Volcanol. Geotherm. Res. 264, 183–196. doi:10.1016/j.jvolgeores.2013.08.004
Polacci, M., Andronico, D., de’Michieli Vitturi, M., Taddeucci, J., and Cristaldi, A. (2019). Mechanisms of ash generation at basaltic volcanoes: the case of Mount Etna, Italy. Front. Earth Sci. 7, 193. doi:10.3389/feart.2019.00193
Rey-Devesa, P., Benítez, C., Prudencio, J., Gutiérrez, L., Cortés-Moreno, G., Titos, M., et al. (2023a). Volcanic early warning using Shannon entropy: multiple cases of study. J. Geophys. Res. Solid Earth 128, e2023JB026684. doi:10.1029/2023JB026684
Rey-Devesa, P., Prudencio, J., Benítez, C., Bretón, M., Plasencia, I., León, Z., et al. (2023b). Tracking volcanic explosions using Shannon entropy at Volcán de Colima. Sci. Rep. 13 (1), 9807. doi:10.1038/s41598-023-36964-x
Reyes-Dávila, G. A., Arámbula-Mendoza, R., Espinasa-Pereña, R., Pankhurst, M. J., Navarro-Ochoa, C., Savov, I., et al. (2016). Volcán de Colima dome collapse of July, 2015 and associated pyroclastic density currents. J. Volcanol. Geotherm. Res. 320, 100–106. doi:10.1016/j.jvolgeores.2016.04.015
Ripepe, M., Marchetti, E., Delle Donne, D., Genco, R., Innocenti, L., Lacanna, G., et al. (2018). Infrasonic early warning system for explosive eruptions. J. Geophys. Res. Solid Earth 123 (11), 9570–9585. doi:10.1029/2018jb015561
Scarpetta, S., Giudicepietro, F., Ezin, E. C., Petrosino, S., Del Pezzo, E., Martini, M., et al. (2005). Automatic classification of seismic signals at Mt. Vesuvius volcano, Italy, using neural networks. Bull. Seismol. Soc. Am. 95 (1), 185–196. doi:10.1785/0120030075
Schlieder, T. D., Cooper, K. M., Kent, A. J., Bradshaw, R., and Huber, C. (2022). Thermal storage conditions and origin of compositional diversity of plagioclase crystals in magmas from the 1980 and 2004–2005 eruptions of Mount Saint Helens. J. Petrology 63 (8), egac064. doi:10.1093/petrology/egac064
Shannon, C. E. (1948). A mathematical theory of communication. Bell Syst. Tech. J. 27 (3), 623–656. doi:10.1002/j.1538-7305.1948.tb00917.x
Shoji, D., Noguchi, R., Otsuki, S., and Hino, H. (2018). Classification of volcanic ash particles using a convolutional neural network and probability. Sci. Rep. 8 (1), 8111. doi:10.1038/s41598-018-26200-2
Shreve, T., Zhan, Y., Le Mével, H., Roman, D., and Moussallam, Y. (2023). Two distinct magma storage regions at Ambrym volcano detected by satellite geodesy. Geophys. Res. Lett. 50 (15), e2023GL102925. doi:10.1029/2023GL102925
Simpson, P. K. (1992). “Fundations of neural Network,” in Artificial neural networks, paradigms, applications and hardware implementations. Editor E. Sanchez-Sinencio, and C. Lau (Piscataway, NJ: IEEE Press). 3–24. ISBN 0-87942-289-0.
Spampinato, S., Langer, H., Messina, A., and Falsaperla, S. (2019). Short-term detection of volcanic unrest at Mt. Etna by means of a multi-station warning system. Sci. Rep. 9 (1), 6506–6510. doi:10.1038/s41598-019-42930-3
Steinke, B., Jolly, A. D., Carniel, R., Dempsey, D. E., and Cronin, S. J. (2023). Identification of seismo-volcanic regimes at whakaari/white island (New Zealand) via systematic tuning of an unsupervised classifier. J. Geophys. Res. Solid Earth 128 (3), e2022JB026221. doi:10.1029/2022JB026221
Tan, D., Fee, D., Hotovec-Ellis, A. J., Pesicek, J. D., Haney, M. M., Power, J. A., et al. (2023). Volcanic earthquake catalog enhancement using integrated detection, matched-filtering, and relocation tools. Front. Earth Sci. 11, 1158442. doi:10.3389/feart.2023.1158442
Thelen, W., West, M., and Senyukov, S. (2010). Seismic characterization of the fall 2007 eruptive sequence at Bezymianny Volcano, Russia. J. Volcanol. Geotherm. Res. 194 (4), 201–213. doi:10.1016/j.jvolgeores.2010.05.010
Titos, M., Bueno, A., Garcia, L., and Benitez, C. (2018a). A deep neural networks approach to automatic recognition systems for volcano-seismic events. IEEE J. Sel. Top. Appl. Earth Observations Remote Sens. 11 (5), 1533–1544. doi:10.1109/jstars.2018.2803198JSTARS.2018.2803198
Titos, M., Bueno, A., García, L., Benítez, C., and Segura, J. C. (2019). Classification of isolated volcano-seismic events based on inductive transfer learning. IEEE Geoscience Remote Sens. Lett. 17 (5), 869–873. doi:10.1109/LGRS.2019.2931063
Titos, M., Bueno, A., García, L., Benítez, M. C., and Ibañez, J. (2018b). Detection and classification of continuous volcano-seismic signals with recur rent neural networks. IEEE Trans. Geoscience Remote Sens. 57 (4), 1936–1948. doi:10.1109/TGRS.2018.2870202
Titos, M., García, L., Kowsari, M., and Benítez, C. (2022). Toward knowledge extraction in classification of volcano-seismic events: visualizing hidden states in recurrent neural networks. IEEE J. Sel. Top. Appl. Earth Observations Remote Sens. 15, 2311–2325. doi:10.1109/JSTARS.2022.3155967
Titos, M., Gutiérrez, L., Benítez, C., Rey Devesa, P., Koulakov, I., and Ibáñez, J. M. (2023). Multi-station volcano tectonic earthquake monitoring based on transfer learning. Front. Earth Sci. 11, 1204832. doi:10.3389/feart.2023.1204832
Torrisi, F., Amato, E., Corradino, C., Mangiagli, S., and Del Negro, C. (2022). Characterization of volcanic cloud components using machine learning techniques and SEVIRI infrared images. Sensors 22 (20), 7712. doi:10.3390/s22207712
Wang, M., Lu, S., Zhu, D., Lin, J., and Wang, Z. (2018). “A high-speed and low-complexity architecture for softmax function in deep learning,” in 2018 IEEE asia pacific conference on circuits and systems (APCCAS) (Piscataway, NJ: IEEE), 223–226.
Wasser, V. K., Lopez, T. M., Anderson, K. R., Izbekov, P. E., and Freymueller, J. T. (2021). Multidisciplinary constraints on magma compressibility, the pre-eruptive exsolved volatile fraction, and the H2O/CO2 Molar ratio for the 2006 Augustine eruption, Alaska. Geochem. Geophys. Geosystems 22 (9), e2021GC009911. doi:10.1029/2021GC009911
West, M. E. (2013). Recent eruptions at Bezymianny volcano—a seismological comparison. J. Volcanol. Geotherm. Res. 263, 42–57. doi:10.1016/j.jvolgeores.2012.12.015
Whitehead, M. G., and Bebbington, M. S. (2021). Method selection in short-term eruption forecasting. J. Volcanol. Geotherm. Res. 419, 107386. doi:10.1016/j.jvolgeores.2021.107386
Zhan, Y., Le Mével, H., Roman, D. C., Girona, T., and Gregg, P. M. (2022). Modeling deformation, seismicity, and thermal anomalies driven by degassing during the 2005-2006 pre-eruptive unrest of Augustine Volcano, Alaska. Earth Planet. Sci. Lett. 585, 117524. doi:10.1016/j.epsl.2022.117524
Zuccarello, L., Burton, M. R., Saccorotti, G., Bean, C. J., and Patanè, D. (2013). The coupling between very long period seismic events, volcanic tremor, and degassing rates at Mount Etna volcano. J. Geophys. Res. Solid Earth 118 (9), 4910–4921. doi:10.1002/jgrb.50363
Keywords: volcano seismology, forecasting, deep learning, neural networks, geophysics, signal processing
Citation: Rey-Devesa P, Carthy J, Titos M, Prudencio J, Ibáñez JM and Benítez C (2024) Universal machine learning approach to volcanic eruption forecasting using seismic features. Front. Earth Sci. 12:1342468. doi: 10.3389/feart.2024.1342468
Received: 21 November 2023; Accepted: 30 May 2024;
Published: 26 June 2024.
Edited by:
Nick Varley, University of Colima, MexicoReviewed by:
Mario La Rocca, University of Calabria, ItalyCopyright © 2024 Rey-Devesa, Carthy, Titos, Prudencio, Ibáñez and Benítez. This is an open-access article distributed under the terms of the Creative Commons Attribution License (CC BY). The use, distribution or reproduction in other forums is permitted, provided the original author(s) and the copyright owner(s) are credited and that the original publication in this journal is cited, in accordance with accepted academic practice. No use, distribution or reproduction is permitted which does not comply with these terms.
*Correspondence: Pablo Rey-Devesa, cGFibG9yZEB1Z3IuZXM=
Disclaimer: All claims expressed in this article are solely those of the authors and do not necessarily represent those of their affiliated organizations, or those of the publisher, the editors and the reviewers. Any product that may be evaluated in this article or claim that may be made by its manufacturer is not guaranteed or endorsed by the publisher.
Research integrity at Frontiers
Learn more about the work of our research integrity team to safeguard the quality of each article we publish.