 Matteo Barbini
 Martino Bernard
 Mauro Boreggio
 Vincenzo D’Agostino
 Carlo Gregoretti
- Department Land, Environment, Agriculture and Forestry, University of Padova, Legnaro, Italy
Controlling sediment to reduce debris-flow hazard is generally approached using retention basins that can be closed or have an outlet structure, generally an open check dam. They are usually placed in mild slope zones that allow minimal works for the excavation and the foundation of the outlet structure if present. Recently, it has been shown that the detention of sediments can also be achieved in the high-sloping reaches of debris-flow channels using deposition areas, basins that are open on the downstream side. In this work, we propose an approach for controlling the sediment volume transported by debris flows consisting of a cascade of deposition areas and retention basins. We also include a framework for planning, sizing, and checking the works. Two scenarios are considered, corresponding to the maximum values of the debris-flow peak discharge and volume, respectively. Moreover, the presence or absence of boulders is also considered. For this purpose, a method that evaluates the clogging of a single open check dam as a function of the coarse fraction of the sediment volume is simply extended to the case of multiple dams and implemented in a routing model. The proposed approach is applied along Ru Secco Creek in northeast Italy to defend a resort area and a village hit by a high-magnitude debris flow in 2015. After a careful survey and study, a solution with a combination of deposition areas and retention basins is planned and sized. The validity and performance of the proposed solution are analyzed using debris-flow modeling for two scenarios, considering both the absence and presence of boulders. Most of the sediment volume transported by debris flows is trapped, and a small solid discharge flows downstream of the works.
1 Introduction
Stony debris flows are mixtures of solid material and liquid in near-equal proportions that flow downstream along steep channels and slopes. The solid part mainly comprises sand, gravel, and rocks, with small quantities of lime and clay, resulting in a rheological regime dominated by friction near the bed and collisions within the main body of the flow (Takahashi, 2007; Lanzoni et al., 2017). These flows are typically triggered by the entrainment of large quantities of debris material into abundant runoff generated at the base of rocky cliffs by intense rainstorms. This leads to a surge with a solid head and a more fluid body, which, routing downstream, increases its volume by up to ten times or more through bed erosion (Santi et al., 2008; Navratil et al., 2013; Theule et al., 2015; Reid et al., 2016; Simoni et al., 2020). The debris-flow path can be divided into three reaches: high-sloping, intermediate-sloping, and low-sloping (Rengers et al., 2021; Bernard et al., 2024a). Erosion dominates the first reach, deposition the third, while the second is a transport zone where erosion and deposition nearly balance each other. The occurrence of stony debris-flow phenomena is increasing due to the growth of extreme-precipitation events (Bollschweiler and Stoffel, 2010; Flores et al., 2010) and cliff failure events (Damm and Felderer, 2013; Stoffel et al., 2014; Dreabing and Krautblatter, 2019; Rengers et al., 2020). The former generates the required runoff for substantial sediment mobilization; the latter leads to increased sediment availability. The high destructive power of stony debris flows associated with the large transported sediment volumes, as well as their increased frequency, necessitates effective measures to ensure the safety of the population and promote economic and tourist activities (Thiene et al., 2017; Franceschinis et al., 2020; Musumeci et al., 2021; Strouth and McDougall, 2021). Managing in-channel debris-flow hazards primarily concerns directing the flow along established routes where all or most of the transported sediment volume is trapped or relocating the elements at risk. The former is usually achieved using structural measures.
Trapping sediment volume is commonly achieved through retention basins that intercept the debris-flow channel in intermediate and lower sloping reaches (Zollinger, 1985; Johnson et al., 1991; Piton and Recking, 2016a). Recently, Bernard et al. (2024a) demonstrated the effectiveness of deposition areas, flat basins without berms or embankments on the downstream side placed in the high-sloping reaches of debris-flow channels, for trapping the sediment volume. Hence, this work proposes a strategy for controlling the sediment volume transported by debris flows, combining deposition areas in the high-sloping reach and retention basins in the intermediate and low-sloping reaches of the channels. The sediment management strategy includes two scenarios for the design of a solid–liquid hydrograph and two possible conditions: the absence or presence of boulders. The two scenarios correspond to the maximum values of the debris-flow peak discharge and volume, respectively. The absence or presence of boulders influences the flow through the outlet structure, that is, the blockage or not of the openings and, therefore, both the upstream deposition pattern and the solid-liquid discharge flowing downstream. The proposed strategy is supported by a methodology for positioning, sizing, and checking the works. Following Bernard et al. (2019), both the sizing and performance of the works are evaluated by means of hydraulic modeling. For this purpose, the method proposed by Piton et al. (2022) for computing the blockage of a single open check dam is extended to the case of multiple dams and implemented in a numerical code for the modeling of debris-flow routing. The numerical code is the multi-processor version of that originally developed by Gregoretti et al. (2019).
The proposed approach is applied to mitigate the debris-flow hazard on Ru Secco Creek in the Northeast Italian Alps. A massive rockfall occurred in November 2014 on the cliff of Mount Antelao, resulting in a significant debris deposit on a sloping plateau. In August 2015, following a high-intensity storm, the runoff hit the deposit and generated a high-magnitude debris flow (approximately 110,000 m3 of mobilized sediment) that impacted a resort area, causing fatalities and damages (Gregoretti et al., 2018). The current presence of hundreds of thousands m3 of debris on the plateau poses a threat to the valley beneath it, proving the need for structural countermeasures. Priority work carried out just after the event proved insufficient for mitigating the debris-flow hazard. Therefore, a more detailed plan of work for controlling the debris flow has been elaborated according to the proposed approach.
The paper is organized as follows: Section 2 discusses the materials and methods, covering the study site, priority works, and the models used for simulating runoff and debris-flow routing. Section 3 introduces the alternative sediment management strategy, while Section 4 presents the framework for planning, sizing, and checking the works, including the two scenarios. Section 5 outlines the application of the sediment management strategy in the planning of the control works at the study site, while Section 6 evaluates the corresponding mitigative effects. Finally, Section 7 discusses the results, and Section 8 presents some conclusions.
2 Material and methods
2.1 Study site and the event of 4 August 2015
Ru Secco Creek is located in the Venetian Dolomites (Northeastern Italy) and flows from east to west between the northwestern slopes of Mount Antelao (the second highest mountain of the Dolomites, 3,264 m a.s.l.) on the south side and the scree at the base of a rocky amphitheater formed by the cliffs from Punta Taiola peak (2,480 m a.s.l.) and Cima Scotter top (2,800 m a.s.l.) on the north side (Figure 1 and Supplementary Figure S1). This basin lies just north of the Rovina di Cancia basin, which experiences periodic debris-flow activity (Simoni et al., 2020). The cliffs are formed by calcareous-dolomitic rocks belonging to the Dolomia Principale formation and the overlaying Calcari Grigi. Both the scree and the wooded parts are mainly composed of calcareous detritus. Further details on the geological setting are provided by Gatter et al. (2018).
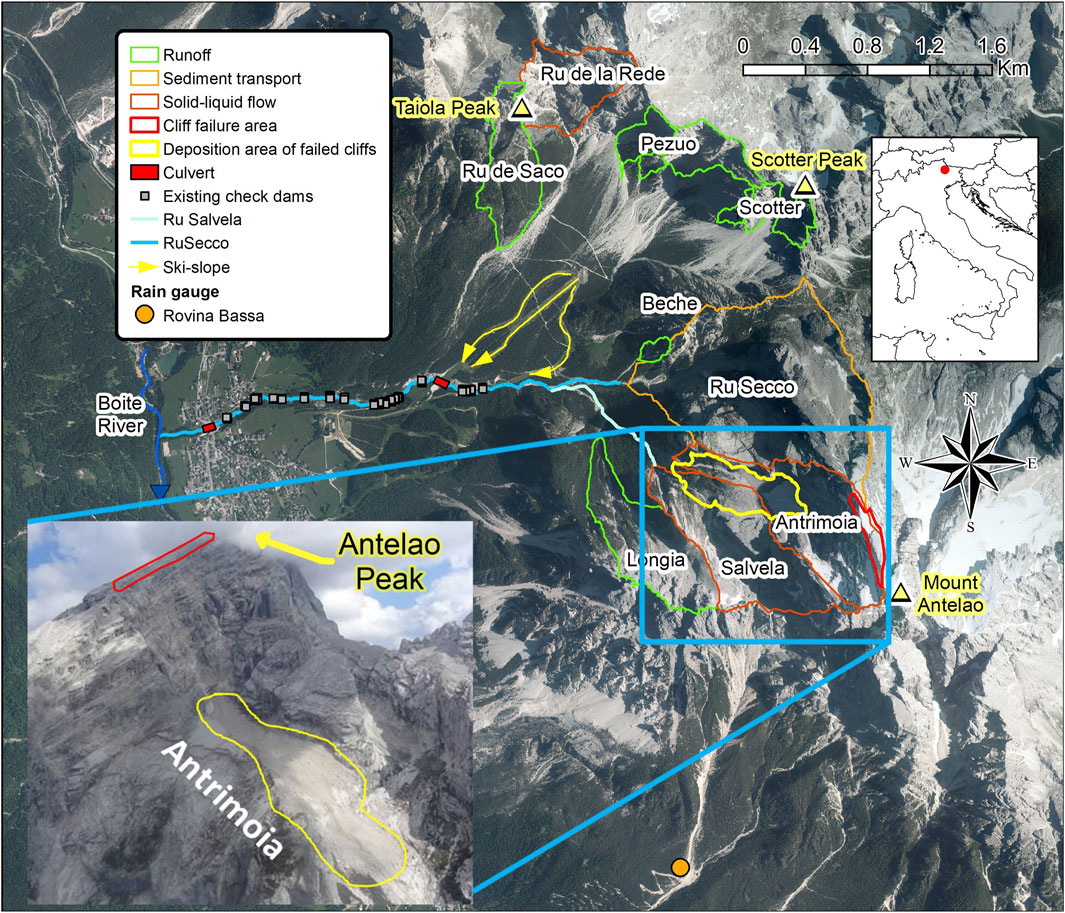
Figure 1. Aerial view of the Ru Secco basin with all the sub-basins supplying liquid (green contours) and solid–liquid (red contours) flow onto the slopes where Ru Secco Creek is incised. The inset shows the cliff of Mount Antelao where the rockslide occurred (the red line marks the failed area, and the yellow line marks the debris deposit on the Vallone d’Antrimoia sloping plateau).
In the past, debris flows usually occurred on the right side of Ru Secco Creek (i.e., the north side) along the channels incised on the scree at the base of cliffs where rocky chutes deliver runoff (Supplementary Figure S1). A series of solid-body check dams built in the 1960s to stabilize the creek bed and prevent erosion are clearly visible in Supplementary Figure S1. The series of dams starts 200 m downstream of the mouth of the tributary Ru Salvela Creek and ends just upstream of the village, where Ru Secco Creek is conveyed through a culvert upstream of its confluence with the Boite River, which flows along the valley bottom (Figure 1). In the 1980s, a resort area was built with the departure station of a chairlift on the left side of Ru Secco Creek, and ski slopes were built on its right side. The creek was culverted in this zone to allow passage from the ski slopes to the chairlift station. On 12 November 2014, a large rockslide detached from the top of Mount Antelao (Figure 1), resulting in a debris avalanche that partly stopped on the Antrimoia sloping plateau and partly channeled along Ru Salvela Creek, reaching its confluence with Ru Secco Creek where it halted (Gatter et al., 2018; Gregoretti et al., 2018). The Antrimoia sloping plateau lies at the foot of the northern cliffs of Mount Antelao. Ru Salvela Creek is a tributary of Ru Secco Creek originating at the base of the downstream border of the Antrimoia sloping plateau (Figure 1). When clearing operations of the large debris deposit at the confluence were ongoing, a very high-intensity storm hit Mount Antelao on 4 August 2015. This storm resulted in abundant runoff that impacted the debris deposit of Vallon d’Antrimoia, triggering a debris flow. The debris flow descended from Vallon d’Antrimoia, routed over the deposit of the 2014 rockslide lying on Ru Salvela Creek, entraining tens of thousands of cubic meters of sediments, and channeled along Ru Secco Creek, reaching the culvert at the chairlift (Supplementary Figure S2). The boulders of the debris-flow front obstructed the culvert inlet, causing the deposit of the flowing mass (Panels A and C of Supplementary Figure S2) until it overflowed on the left side and inundated the chairlift area. Here, the surge destroyed the station and parked cars, resulting in three fatalities. The debris flow re-channeled along Ru Secco Creek and reached the culvert upstream of the village, partially clogging it, overflowing the surrounding area, and causing damages. Details on the debris-flow routing are provided in Gregoretti et al. (2018), which estimated a volume of entrained sediments of approximately 110,000 m3, 52,500 of which were from the Antrimoia inclined plateau and 35,500 from Ru Salvela Creek. These volumes were estimated by subtracting the post-event digital elevation model (DEM) from the pre-event one. A volume of terrain belonging to the deposit of the November 2014 rockslide on the upper part of Ru Salvela Creek was sampled in August 2019. Volumetric and weight laboratory measurements after drying showed a dry sediment concentration, c∗ = 0.59. Grain-size analysis carried out using the frequency-by-weight method revealed a dominant coarse fraction (diameter size larger than 2 mm) of about 85%, followed by sand (diameter between 2 mm and 0.063 mm) with a percentage of 14% and silt-clay with a percentage of 1%. These results are similar to those obtained in the same area by Simoni et al. (2020) and Gregoretti et al. (2018) on the neighboring debris-flow sites of Rovina di Cancia and Chiapuzza, respectively. The dominance of the coarse fraction and the negligible presence of silt and clay indicate that grain collision controls the rheology of debris flows, which are of the stony type (Takahashi, 2007), as were those occurring at Chiapuzza (Gregoretti et al., 2018) and Rovina di Cancia (Bernard et al., 2019).
2.2 Priority works
Just after the event, priority works were carried out to diminish the volume of sediments entrainable by debris flows on Ru Salvela Creek and restore Ru Secco Creek down to the chairlift culvert (Supplementary Figure S3). Two deposition areas were built on Ru Salvela Creek, and another one was built at the confluence between Ru Salvela and Ru Secco Creeks (Supplementary Figure S3A). The Ru Secco Creek bed was cleared of sediments, and the reach from a point 150 m downstream of the mouth of Ru Salvela Creek to the chairlift culvert was protected using riprap on the banks and boulders set in a concrete casting on the bottom. A small channel, 2 m wide and 1 m high, was built over the culvert (Supplementary Figure S3B). Such priority works show the following inadequacies:
1. The deposition areas are small and do not fully intercept the debris-flow path because they are displaced on its right;
2. The left parts of the two upper deposition areas have been incised during runoff events that occurred after construction;
3. The channel built over the culvert at the chairlift is too small.
The small extension of the deposition areas and their displacement aside the flow path prevents the trapping of large sediment volumes. This drawback is worsened by the incision caused by runoff erosion on the left side of the deposition areas that divert the debris flow from them. The small channel over the culvert is not able to convey the debris-flow discharge after the clogging of the culvert by boulders of the debris-flow front, as occurred during the event of 4 August 2015 (Supplementary Figure S2C), and the resort area is still threatened by more debris-flow inundation. The insufficiency of the preliminary works and the potential threat of the sediment stored on the Antrimoia Plateau make the planning of new works a priority.
2.3 Hydrological model
The event-based hydrological model of Gregoretti et al. (2016a) was designed to simulate the hydrological response of headwater rocky basins. It simulates the infiltration excess and interflow contributes by means of a simplified Horton law and SCS method, respectively. In detail, direct runoff is computed for each pixel of the basin (i − fc) when the rainfall intensity, i, is larger than the infiltration rate fc, or by the curve number method of the Soil Conservation Service (SCS-CN), when i < fc. Runoff is routed to the channel network along the steepest slope direction, with slope velocities that are constant but different for each land use. Along the channel network, runoff is propagated to the watershed outlet using the matched diffusivity kinematic model of Orlandini and Rosso (1996). The parameters of the model are the curve number CN, the infiltration rate fc, the slope velocity US, and the Gauckler–Strickler coefficient KS. The values of the parameters obtained after calibrating the model through the comparison of the simulated discharges with those measured at the outlet of the rocky channel at Fiames are shown in Table 1. The unique changing parameter is the infiltration rate that, in the case of rocks, linearly depends on the 2-day previous rainfall depth Bernard and Gregoretti (2021). This model can reproduce the peak hydrological response at the base of rocky cliffs.
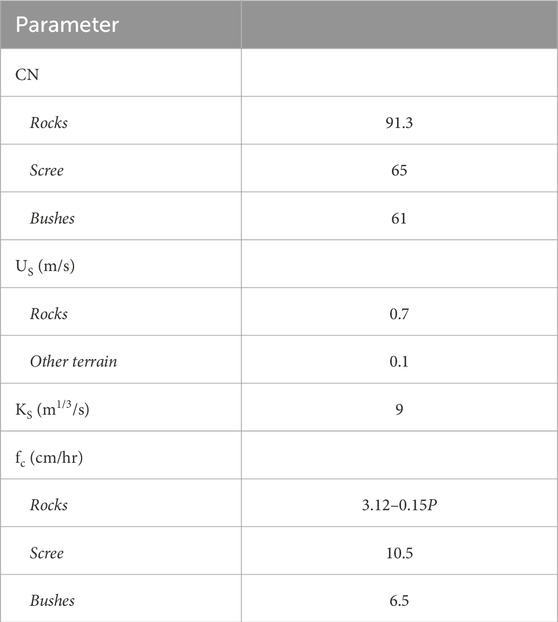
Table 1. Calibrated parameters of the hydrological model according to Bernard and Gregoretti (2021). The relationship for evaluating the Hortonian infiltration fc is effective only for AMC I events. P denotes the cumulated precipitation that fell in the 2 days preceding the event (expressed in mm).
2.4 Routing model
The model for stony debris-flow routing is that of Gregoretti et al. (2019), modified by Bernard et al. (2019), for simulating flow over non-erosive surfaces (entrainment is allowed only for previously deposited sediments). It is a bi-phase, raster-based model that implements the kinematic approximation for the momentum equations. The parameters of the model are the conductance coefficient, C, that controls the flow resistance, and the limit values of the bed-slope angle θ and flow velocity V, below and above which, deposition (θLIM−D, ULIM−D) and entrainment (θLIM−E, ULIM−E) can occur, respectively. The friction law is based on the conductance coefficient, C, that is the ratio of the mean flow velocity to the shear stress and corresponds to a grain-collision-dominated rheology. This model well reproduces both the deposition-erosion pattern and the routing times of three occurred debris-flow events (including that of 4 August 2015 on Ru Secco Creek) using physically-based values of the parameters: C = 5, θLIM−D = 14°, ULIM−D = 1 m/s, θLIM−E = 16°, and ULIM−E = 1.8 m/s (Gregoretti et al., 2016b; 2018; 2019). The sensitivity analysis carried out by Gregoretti et al. (2019) also shows that when changing the values of the parameters in a physically acceptable interval (3
The model was modified to take into account the algorithm proposed by Piton et al. (2022) concerning the mechanical clogging of check-dam openings by boulders transported in a debris flow, as discussed in Subsection 4.3.3. For each time step, the solid–liquid volume in each opening is evaluated and used to compute the maximum potential number of boulders passing through the opening. When two or more boulders with a cumulative diameter larger than the opening width are present, the opening is considered clogged to a height equal to the diameter of the widest boulder. In such cases, the sediment volume of the debris flow in the blocked opening is instantaneously deposited and considered non-erodible. If the deposition depth is lower than the diameter of the coarsest boulder, the missing solid volume is deposited in subsequent time steps. Additionally, the routing algorithm of the model was modified for multi-processor use to reduce simulation duration. Specifically, the OpenMP library (Hermans, 2011) is implemented for parallel execution of operations. Parallel execution not only reduces simulation duration but also alters the sequence of operations, resulting in a slight difference in approximation due to the randomization of operations. Analysis comparing parallel and serial simulations shows that the randomization of operations affects the final results by less than 4%.
3 An alternative approach for sediment control
The management of in-channel debris-flow hazards aims to prevent inundations caused by direct impacts, overflow due to exceeded channel capacity, or avulsions caused by deposits along the flow path or interactions with civil works such as bridges or barriers. The first case arises when the channel ends just upstream of inhabited areas, while the others can occur even when the channel traverses them. Therefore, securing a location relies on structural measures or relocating elements at risk elsewhere. Structural measures, as outlined by Hübl (2018), have two objectives: erosion control, that is, reducing debris-flow occurrence and magnitude, and event management, composed of sediment control, and flow guidance, that is, the sediment interception and detention and the flow direction away from inhabited locations and infrastructures. The erosion control is achieved by limiting runoff and erosion (e.g. diversion channels for runoff, slope and bed consolidation works). The sediment control by reducing peak discharge and trapping sediment (e.g. debris-flow breakers and sediment detention basins respectively). The flow guidance by means of conveyance and deflection structures.
Erosion control may not always be feasible and may have limited efficacy in reducing the volume of sediment transported by debris flows, whereas sediment control assumes greater importance. Common methods for sediment control include the more recent deposition areas (our proposal) and the retention basins (Figure 2). The former are placed in the high-sloping reach of debris-flow channels dominated by erosion processes. The latter are situated in the intermediate reach where a balance between erosion and deposition occurs, and in the low-sloping reach, which is dominated by deposition. Figure 2 shows an example of works based on the reach’s slope. Deposition areas are flat basins without berms or embankments on the downstream side, where significant deposition occurs due to the flatness of the bottom. They are ideally located in the upper part of the basin downstream of the fan apex where the debris-flow channel is not more confined between slopes or cliffs, preferably in locations where the surge has reached a debris-flow mature condition, and minimal excavation is required. Typically, this occurs just upstream of the transition between high and intermediate-sloping reaches of debris-flow channels. Retention basins are basins with ending embankments that provide retention effects, with or without an outlet structure, often an open-type check dam. Ideally, they should have a pear shape because a progressive enlargement with an ending narrow outlet side tends to maximize sedimentation (Zollinger, 1985; VanDine, 1996; Piton and Recking, 2016a). The position of a retention basin is contingent upon terrain morphology, with an optimal location being at a channel restriction or at the end of enlarged floodplains, which permits maximizing basin volume while limiting excavation. Additionally, it should be laterally confined by slopes to prevent flow avulsion that could bypass it (Mark, 2017). Avulsion occurs when the flow path traverses unconfined or partially confined areas (de Haas et al., 2019; Zubrycky et al., 2021). The blocking action of sectional dams or flexible barriers placed in the high-sloping reach, for reducing the peak solid-liquid discharge, determines also a small retention volume behind them (Figure 2).
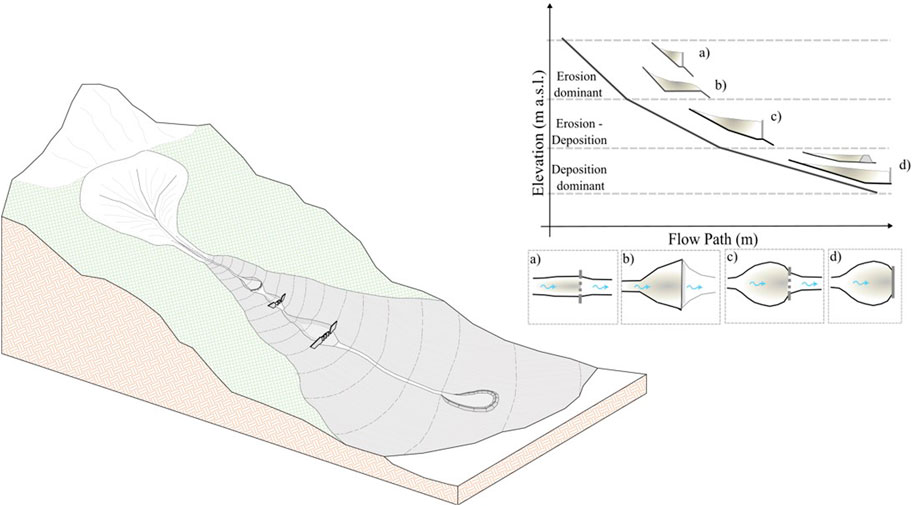
Figure 2. Example of control works in the function of the channel bed slope: a deposition area and a sectional dam in the high-sloping reach of the debris-flow channel, followed by a retention basin with an open check dam in the intermediate-sloping reach, and a closed retention area in the low-sloping reach.
Building retention basins in high-sloping reaches or deposition areas in intermediate and low-sloping reaches is not advantageous. In the first case, the space available for the sediment deposition is not high and significatively reduced by the presence of the downstream berm. Moreover, significant efforts are required for construction, particularly massive foundation works to prevent undermining caused by downstream regressive erosion, as well as the considerable resources for maintaining the downstream embankment and outlet structure. Finally, there is a pronounced risk of failure during high-magnitude events (Xu et al., 2012; Hübl, 2018; Baggio et al., 2021). In the second case, the stored sediment volume is smaller than that of a retention basin because the deposition surface starts at the bottom of the downstream edge rather than at a higher altitude provided by the retention effect of the embankment. Thus, a sediment management strategy involving sediment control from the upper part of the basin is proposed, using a cascade of deposition areas in high-sloping reach and retention basins in intermediate and low-sloping reaches. Reducing the sediment volume transported by the debris flow in the high-sloping reach has two positive effects: it decreases the intensity of the debris flow and thus its erosive power during its routing (Remaitre et al., 2008), and it stops small- to medium-magnitude debris-flow events, focusing restoration works on the upper part of the basin rather than along the entire flow path. Conversely, other works in the high-sloping reach, such as barriers, solid-body check dams, and flexible nets, which primarily serve for bed consolidation and slope stabilization (Chanson, 2004; Wang and Kondolf, 2014; Piton et al., 2017), do not significantly reduce the sediment volume unless immediately after their construction (Bernard et al., 2024a).
Morphology determines the possible positions, while the sediment volume determines the number of works and their size. For an open check dam, the size depends on the value of peak discharge, while for a sediment detention basin it depends on the sediment volume. This leads to two scenarios for the design event: debris flows with the maximum values of peak discharge and volume (MPD and MV scenarios, respectively).
4 Framework for planning the control works according to the new approach
The framework for planning, sizing, and checking the control works according to the proposed approach is schematically shown in the flowchart of Figure 3 and comprises the following steps:
1. Collection of historical data (rainfall, surveys, dates of occurrences, volumes of transported sediment, and areas affected by previous events), field and topographical surveys.
2. Determination of the triggering areas or zones where debris flow is well-developed (mature debris flow), with the relative hydrological sub-basins, source areas, and sediment availability.
3. Morphological analysis to determine flow paths, channel segmentation, and related features.
4. Assessment of the potential hazard of debris flows and planning of the control works (locations and typology) by combining historical data of debris-flow events and the outcomes from the previous two steps.
5. Hydrological study and modelling to determine the depth-duration frequency curve, the design rainfalls, and the corresponding runoff hydrographs for the two scenarios (MPD and MV).
6. Determination of the solid–liquid hydrographs corresponding to the two scenarios (MPD and MV).
7. Sizing the works using the sediment volume from the solid–liquid hydrographs and preliminary routing simulations.
8. Checking the performance of the works using hydraulic modeling, considering both the presence and the absence of boulders.
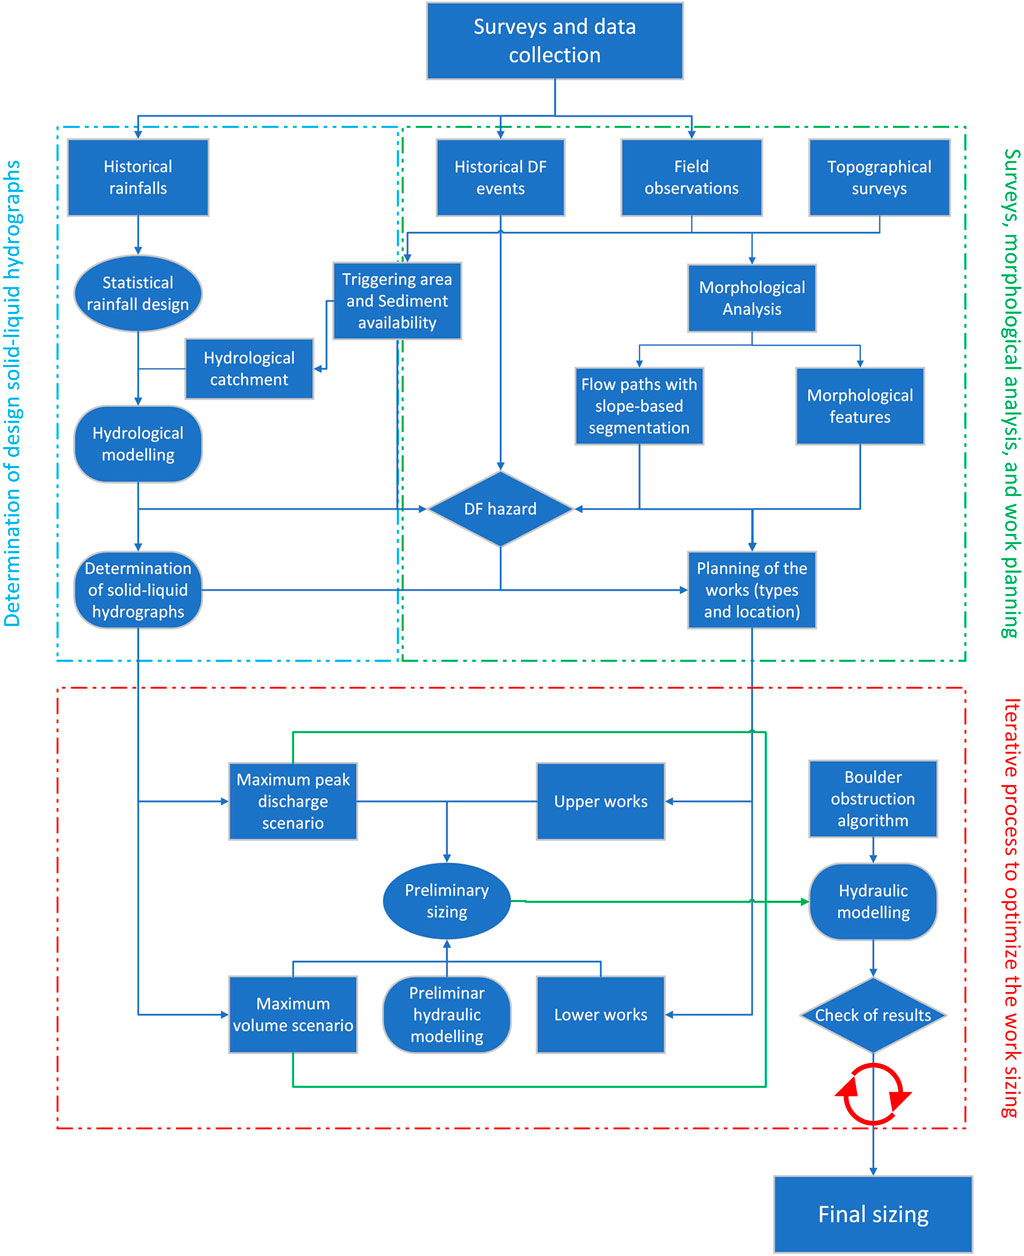
Figure 3. Workflow schematizing the framework for planning, sizing, and checking of control works to mitigate debris-flow hazards.
The first step entails the collection of data on previous debris-flow events, rainfall, old topographical data and field surveys, as well as direct field and topographical surveys. The second step provides the identification of source areas including an estimate of sediment availability, initiation areas, or zones of formation of a well-developed solid–liquid surge if the morphological complexity prevents identifying a well-defined initiation area, achieved by the in-time analysis of areal photos, differences of DEMs (DoD) when DEMs (Digital Elavation Model) of different years are available, as well as the direct survey. The third step is the morphological analysis based on the old and recent surveys. It provides the flow paths, their slope-based segmentation, and the morphological features. The fourth step is composed of two phases. The first phase provides the hazard assessment, combining the inundation map of the occurred events (first step) with the sediment availability (second step) and flow paths (third step), which identify the need for mitigating works. This phase is the premise for planning any control works as well as any risk evaluation (Strouth and McDougall, 2021) (if a risk evaluation is required). The second phase combines the analysis of the flow paths, their slope-based segmentation and the morphological features identified in the third step to detect the typology and location of all the possible works. The fifth step is also composed of two phases. The first one entails the determination of the depth-duration frequency (DDF) curve corresponding to the selected return period by frequency analysis of rainfall data collected in the first step, while the second one provides the design rainfalls and the corresponding runoff hydrographs for the two scenarios by means of hydrological modeling of runoff at the initiation areas or the zones where the surge is well developed (identified at the second step). The sixth step is the determination of the solid–liquid hydrographs corresponding to the two scenarios, combining the runoff hydrographs determined at the previous step with of sediment volume. The seventh step is the sizing of the works based on an estimate of the sediment volume, that is, the design sediment volume. This corresponds to that of the solid–liquid hydrograph corresponding to the MPD scenario if the works are close to the triggering areas. Otherwise it is based on preliminary routing simulations corresponding to the MV scenario if the works are far from the triggering areas. The last step is checking the work performance through the analysis of the deposit-erosion pattern and solid–liquid hydrographs provided by the routing simulations corresponding to the two scenarios, with and without the presence of boulders. The works should trap the design sediment volume without overflowing the embankments, and the solid concentration of the flow downstream from the works should be lower than the maximum value that the channel can convey without causing damage. For the routing simulations, two-dimensional models (Armanini et al., 2009; Hussin et al., 2012; Frank et al., 2015; Gregoretti et al., 2019) or three-dimensional models (Pudasaini and Mergili, 2019) capable of simulating deposition and erosion processes should be used. The details of the design scenarios, rainfall, solid–liquid hydrographs, and sizing of the works are presented below.
4.1 The design scenarios
The design scenarios concern the conditions that yield the maximum values of debris-flow peak discharge and volume. The solid–liquid peak discharge provides the highest surface level and maximum basal stress. The maximum flow surface must remain within the channel banks or check-dam openings. Usually, the maximum basal stress leads to greater erosion on the natural bed (Stock and Dietrich, 2006; Hsu et al., 2008; Medina et al., 2008), although field observations may not consistently support this claim (Berger et al., 2011; McCoy et al., 2012), and can potentially cause surface damage to works (Bernard et al., 2019). Debris-flow volume ideally should be entirely or mainly trapped in the deposition areas and retention basins positioned along the flow path.
The experiments conducted by Lanzoni et al. (2017) and Takahashi (2007) indicate that the equilibrium solid concentration, that is, the transport capacity, increases with the bed slope. The experiments performed by Christian (1999) and reported by Gregoretti et al. (2018), along with those of Lanzoni et al. (2017), also demonstrate that the surge velocity increases with the triggering liquid discharge. Because the sediment concentration depends on the bed slope, the increase in surge velocity implies a rise in solid discharge, thereby elevating the entrainment rate. Consequently, solid discharge is governed by runoff discharge for a fixed bed slope; hence, there is a correspondence between solid–liquid peak discharge and runoff peak discharge. Similarly, the debris-flow volume relies on the volume of runoff hydrograph contributing to debris flow VCR; a larger volume results in greater sediment transport. VCR is the portion of the runoff hydrograph with the discharge values exceeding the fixed threshold discharge for generating debris-flow events (Bennet et al., 2014; Gregoretti et al., 2016b). This approach finds indirect support from Rosatti et al. (2019), who indicate that only a portion of excess rainfall volume contributes to debris flow. VCR increases with the hyetograph duration until the average runoff discharge approaches the value of the threshold discharge for debris-flow generation, after which it diminishes. The solid–liquid hydrographs for the two scenarios are determined by using the procedure outlined below.
4.1.1 Design rainfall and runoff hydrograph
The design rainfalls are those maximizing the peak runoff discharge and the runoff volume contributing to the debris flow. They are obtained using a DDF curve. This curve depends on the return period and on the technique used to determine the distribution of the maxima values of the rainfall depths. The design return period depends on the type of work, and it could be influenced by the presence of inhabited areas or factories in the threatened area. In the absence of specific rules of the technical law, the use of the largest return period required for the design of the hazard map (in Italy, it is 300 years) is suggested. In the absence of studies that assess the impact of climate change on extreme precipitation events, a technique for determining the distribution of maxima that indirectly takes it into account is suggested. For this reason, we propose the peak over threshold (POT) technique that considers all the values exceeding a threshold (Pickands, 1975; Davison and Smith, 1990). Using values that exceed a threshold allows considering all the intense precipitation events that occurred in the observation period, hence capturing the increased frequency of the extreme precipitation triggering debris-flow phenomena. The definition of the threshold is explained in the Supplementary Material.
The rainfall providing the maximum value of the peak runoff discharge is rainfall with a duration close to the concentration time of the headwater basin with the outlet at the triggering area. Providing the maximum value of the runoff contributing volume to the debris flow has a much longer duration, about one order or more. Prenner et al. (2019) distinguished two different triggering rainfalls: short-duration storms and long-lasting rainfalls. However, they did not provide some quantitative information about the duration and intensity because they analyzed daily precipitation. Finally, the rainfall maximizing the peak runoff discharge is searched by simulating runoff corresponding to a constant-intensity rainfall with a duration that starts from 5–20 min and is progressively increased with a step size of 1 min. In fact, the hydrologic response of headwater watersheds, despite the differences embodied by the variety of geological and morphological contexts, occurs in a few tens of minutes or less (Kean et al., 2012). Once the rainfall duration of constant intensity that maximizes the peak runoff discharge is determined, the design rainfall hyetograph is built using the progressive precipitation increments, that is, the difference in the depths of successive time intervals following the alternating blocks method. The increment of 1 min that has the maximum value is posed in the central time step position, and the other increments are positioned in descending order alternately on the right and left. The rainfall that maximizes the volume of runoff contributing to debris flow VCR is assumed to have constant intensity because it has a long duration, and the influence of some isolated peaks of intensity on runoff is generally negligible. An example of such precipitation occurred in the Gares Valley during the VAIA storm that hit Northeast Italy and Southeast Austria at the end of October 2018 (Giovannini et al., 2021). It was characterized by a core of 5 hours with high intensity, which corresponds to the entrainment of approximately 700,000 cubic meters of sediments along 36 debris-flow channels. The rainfall that maximizes VCR is searched progressively, increasing the duration of the rainfall until the computed value of VCR, starts to decrease (see Figure 4A). Supplementary Figure S4 shows the runoff hydrographs corresponding to the constant-intensity and alternate block hyetographs obtained by the same DDF: the one corresponding to the alternate block hyetographs has a much larger peak value.
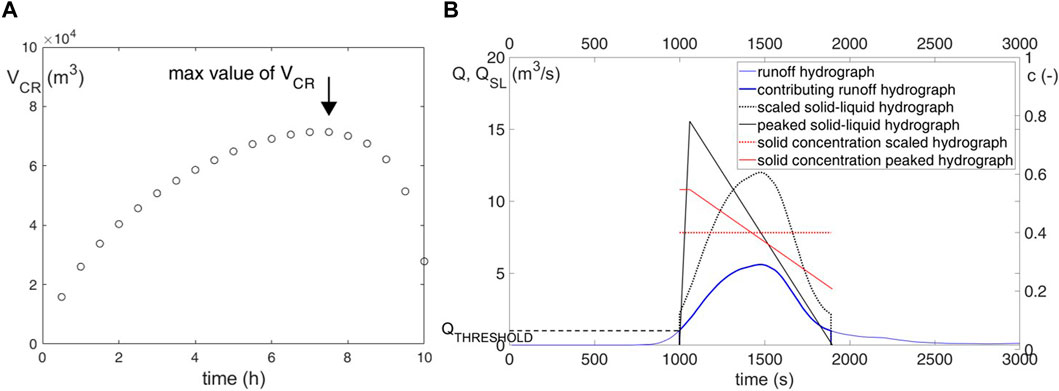
Figure 4. Runoff volume contributing to debris flow, VCR, versus the rainfall duration (A). Hydrographs of runoff, runoff contributing to debris flow with the scaled and peaked solid–liquid hydrographs, and the corresponding solid concentrations (B).
4.1.2 Design solid–liquid hydrograph
Two types of solid–liquid hydrographs are introduced: the first corresponds to the initiation phase when only a solid–liquid front is formed with a mainly liquid body behind it; the flow is hyperconcentrated. The second corresponds to an already-formed solid–liquid surge. The data from the Rovina di Cancia monitoring station show an overlap between modeled runoff hydrographs corresponding to previous debris-flow events and the observed depth hydrograph when the surge is in formation and the debris flow is not yet fully developed (Bernard et al., 2024b). Therefore, in the first case, it is assumed that the shape of the solid–liquid hydrograph is the same as that of the runoff hydrograph, uniformly scaled by the entrained sediment volume:
where QSL and Q are the solid–liquid and runoff (values over the threshold) discharges, respectively, and VSL is the solid–liquid volume. The volume, VSL, can be provided by the following equation:
where VSED is the sediment volume, the sum of the solid volume corresponding to the sediments with the liquid volume filling the voids because when a debris flow occurs, the soil is likely to be saturated (Hungr et al., 2001; Gregoretti and Dalla Fontana, 2008). The volume VSED can be expressed either as a function of the volume of the solid phase VS or as a function of the solid concentration, c:
where c and c∗ are the volumetric solid concentration of flow and the dry bed, respectively. Substituting the term VSED in Eq. 2 with the third member of Eq. 3 and rearranging it yields the following:
The third term of Eq. 5, or second term of Eq. 4 represents the proportionality between the solid-liquid and runoff discharges and volumes. In the second case, the surge is formed, and the hydrograph has a peaked shape with a peak discharge much larger than the peak runoff discharge (Takahashi, 2007). The peaked shape depends on the slowdown effect due to the extraction of momentum from runoff due to the acceleration of the entrained solid material. The slowdown becomes relevant when the quantity of entrained debris is large so that it also stops the runoff arriving from behind and forms a solid–liquid front. In such a case, the solid–liquid design hydrograph is that proposed by Gregoretti et al. (2019) with a triangular shape. The peak discharge QP is computed through the relationship of Lanzoni et al. (2017):
where Q0 is the formative runoff peak discharge and cF is the volumetric solid concentration of the solid–liquid front. The factor 0.75 reflects the contribution of the liquid discharge to the liquid queue of the debris flow. The value of cF can be computed through the relationship proposed by Takahashi (2007) and updated by Lanzoni et al. (2017):
where ρf and ρs are the densities of the liquid and solid phases, θ is the bed-slope angle, and φqs is the quasi-static friction angle. Another relationship for cF is proposed by Lien and Tsai (2003). The hydrograph is determined by assuming a rising limb of 1 min with the duration provided by 2VSL/QP. In the case of very high bed slopes, the relationships of Lanzoni et al. (2017) and Lien and Tsai (2003) are not applicable, and the maximum value of cF: 0.9c∗ according to Takahashi (2007) can be assumed. Figure 4B shows an example of the two solid–liquid hydrographs, including the behavior of the solid component.
The estimation of solid concentration, c, is essential because it provides the peak discharge value for scaled hydrographs and sediment volume for both peaked and scaled hydrographs, influencing the erosion–deposition pattern. Therefore, its estimate should prioritize reliability, focusing solely on the erosion upstream of the hydrograph inlet position. To achieve this, we outline three hydrograph inlet positions: (I) directly at the base of rocky cliffs, (II) downstream of rocky cliffs, and (III) well downstream of the initiation area (Figure 5A). Case (I), occurs when a debris-flow channel originates at the base of a cliff and incises an erodible slope. Case (II) occurs in two situations: when a debris-flow channel originates at the base of converging slopes with the inlet position at its head (a), downstream of the channel-head when it becomes erodible, or when debris deposits from local cliff or bank failures are present (b). Case (III) arises when there are multiple debris-flow initiation areas and the morphological complexity hinders the identification of an unique initiation area. This could occur when debris flows starts in different locations (IIIa) or in case of very large deposits and runoff impacts it at different points (IIIb), so that the inlet position is positioned downstream of the complex area. An example of case (IIIa) is the Fiames Pezzories basin where a debris-flow channel starts at the base of a cliff and its upper reach is continously supplied of liquid and solid-liquid flows by two parallel cliffs for which another triggering area is detected at the end of the parallel cliffs (Gregoretti and Dalla Fontana, 2008). The three positions (I, II and III) correspond to the cases of debris-flow initiation (i.e. the beginning of sediment entrainment), debris-flow formation and nearly developed debris flow. In case (I), c is assumed to be zero for both scenarios (i.e. the input is the runoff hydrograph). In the cases II and III, the value of c is estimated using sediment volume data from previous events, when available, or through geomorphic considerations and empirical relationships. If data of previous events are available, the value of c is calculated as c*VSED/(VCR + VSED), where VCR comes from the runoff simulation of the previous event, and VSED is the net sediment volume entrained upstream of the hydrograph position. Without data, c depends on the case and scenario. For the maximum peak discharge scenario, in Case (II), the value of c ranges from 0.1 to 0.2 depending on the surveyed source areas, while in Case (III), c should approximate the potential entrainable sediment volume corresponding to that position of the flow path. This is achieved following the procedure shown in Annex I of the Flood Risk Management Plans (European Flood Directive 2007/60/EC) of the Eastern Alps River Basin Authority that uses the relationship of Marchi et al. (2019), as explained in the Supplementary Material. The scenario with the maximum peak discharge has a larger entrainment rate due to the higher runoff discharge, so that the solid concentration is smaller in the maximum volume scenario. Therefore, in Case (II), the values of c is half of those in the MPD scenario, while in Case (III), we can assume c = 0.3. In the cases I and II the debris flow is not yet fully developed and the shape of the solid-liqui hydrograph is the scaled hydrograph provided by Eq. 5. In case III, the peaked hydrograph is used for the MPD scenario, while the scaled hydrograph for the MV scenario, because, the solid–liquid hydrograph of the MPD scenario concerns a mature debris flow, while that of the MV scenario represents an immature debris flow or a hyperconcentrated flow. The computation of c for both scenarios and the type of hydrograph is outlined in the flowchart of Figure 5B. The identification of hydrograph positions and their consequences on the determination of c underscore the essential role played by field surveys. The peak time of the solid–liquid hydrograph is assumed to be that of the peak of the corresponding runoff hydrograph. In fact, the comparison between simulated runoff hydrographs and observed solid–liquid hydrographs at the monitored debris-flow site of Rovina di Cancia shows a lag time falling within the range of [−2.5,1.5] minutes (Bernard et al., 2024b). In the presence of multiple headwater basins providing solid–liquid or liquid flows, the rainfall duration corresponds to the runoff hydrograph of the headwater basin where the debris flow with the largest sediment volume initiates.
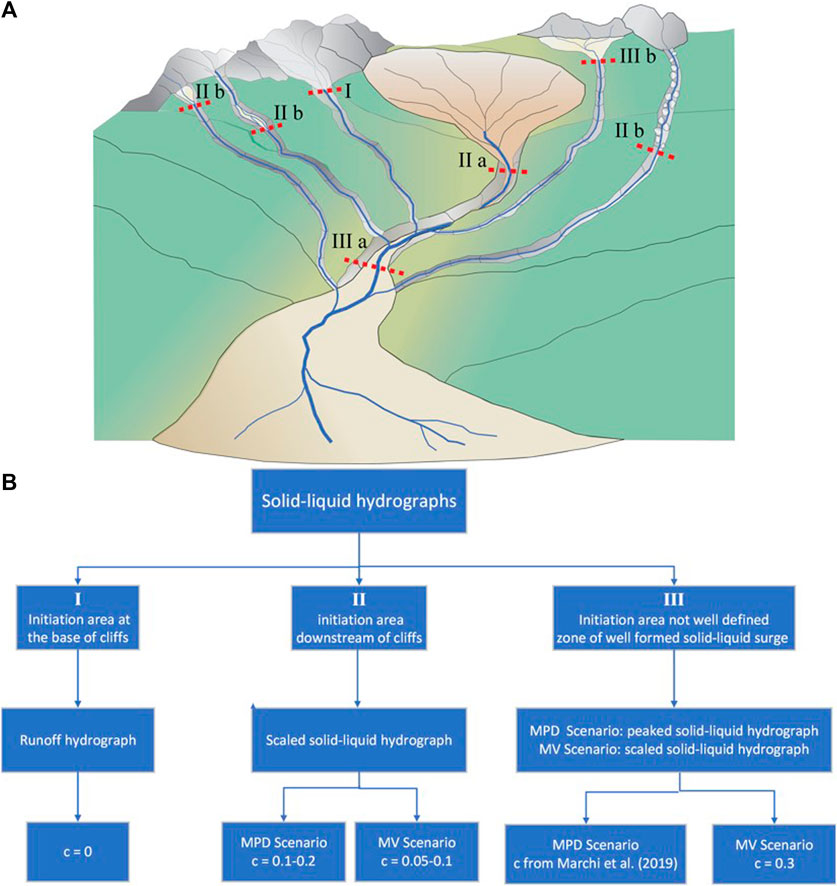
Figure 5. Geomorphological scheme for the inlet position of the solid–liquid hydrographs (A) and the corresponding flowchart for identifying the hydrograph type and the estimation of c (B).
4.2 Planning the works
Planning the works, involving the identification of typology, location, and quantity, is derived from combining the results of the morphological analysis with the sediment volume corresponding to the solid–liquid hydrograph. The analysis of flow paths identifies interception points of the debris flow, while their slope-based segmentation and morphological feature analysis determine the type and location of the works. Specifically, deposition areas are identified in the high-sloping reach of the channel dominated by the erosion (Figure 2) and preferably just upstream of the intermediate-sloping reach; retention basins with an outlet structure are placed in the lower reaches, preferably upstream of a restriction or at the end of large floodplains; retention basins without outlet structures are preferably located in the lower sloping zone of the basin. The sediment volume corresponding to the solid–liquid phase can provide a rough estimate of the total sediment volume to be trapped. Analyzing the location allows for a broad estimation of the design sediment volume to assign to each work that, after considering the cost analysis for each work, including maintenance, permits establishing the required works among the options identified by the morphological analysis. The total sediment volume to be trapped is selected according to the maximum value between the two scenarios of the sediment volume transported by the debris flow at the locations where the works are to be built. The scenario corresponding to the maximum debris-flow volume represents the maximum potential entrainable sediment volume due to the larger value of VCR. However, the solid–liquid hydrograph of this scenario is characterized by lower values of discharge and solid concentration (see Figure 5B), which could result in smaller entrainment and deposition rates than the scenario that maximizes the peak solid–liquid discharge. Therefore, the choice of the scenario for determining the sediment volume depends on the location along the flow path: if the distance from the triggering area is short, the MPD scenario is adopted; otherwise, the MV scenario is chosen. The sediment volume can be roughly estimated directly from the solid–liquid hydrograph using the estimated value of c or an increased value depending on the position along the flow path. This value could range between 0.5 and 0.6 for the MPD scenario or between 0.3 and 0.5 for the MV scenario.
4.3 The sizing of the control works
Sizing a deposition area mainly concerns estimating the area that allows the deposition of the design volume, whereas sizing a retention basin also involves determining the downstream dike height. Sizing the outlet structure involves estimating the opening and the height of the breakers, if present. The design sediment volume, as shown above, depends on the scenario and the relative position of the work along the flow path. The MPD scenario is used for works not far from the initiation area; otherwise, the MV scenario applies. In the first case, if the solid concentration is usually high, the design volume could be that of the solid–liquid hydrographs, whereas in all other cases, preliminary routing simulations are needed for reliable estimates of the sediment volume transported by the debris flow upstream of the work location.
4.3.1 Sizing a deposition area
Bernard et al. (2024a) proposed a two-step procedure for the design of a deposition area. A first attempted value of the area A, a horizontal projection of the bottom surface, is obtained using a simplified relationship between A and the design deposition volume VD:
where kD is the dimensionless deposition coefficient, for which Bernard et al. (2024a) proposed the value 0.1. The deposition area is designed using this first-attempt value, and the corresponding deposition volume is computed as the sum of the two contributions that are shown in Supplementary Figure S5 of the Supplementary Material: the volume between the sloping surface of angle φ1 and the bottom surface of the deposition area including the lateral banks, and the volume between the sloping surface of angle φ2 and the channel bottom and banks. The former is VA and computed as the difference between the prism VV and the pyramids of bases ARB and ALB with the height approximated by L. The latter is computed as the sum of the prism of height BC with the pyramids of bases ACRB and ACLB. The relationship for computing VD is
where
The quantities BD and BU are the widths of the upstream and downstream edges of the deposition area, respectively; the quantities BRB and BLB are the right and left enlargement, with respect to the mouth of the incoming channel, respectively; θRB and θLB are the sloping angles of the right and left banks of the deposition area; BC and θC are the width and the bed-slope angle of the incoming channel, respectively; θCRB and θCLB are the sloping angles of the right and left banks of the incoming channel. The values of φ1 and φ2 proposed by Bernard et al. (2024a) are 15 and 6o, respectively. In the case of scarce maintenance for which the deposition area is not emptied after small events, or if the location has two or more incoming channels, the value of φ1 is diminished to 11o because the presence of deposit causes preferential flow paths for newly arriving flow that prevent a homogeneous filling of the deposition area. In the presence of an upstream sloping part required for addressing the flow along the longitudinal direction, Eq. 9 changes: the details are in Bernard et al. (2024a). To facilitate calculation operations, using the MATLAB® script provided in the Supplementary Material by Bernard et al. (2024a) is suggested.
4.3.2 Sizing a retention basin
Sizing a retention basin mainly concerns the height of the downstream dike and the sloping angle of the deposit upstream of it, ϑDep. The angle ϑDep can be estimated as a function of the storage basin capacity or the bed slope of the channel reach just upstream of the basin before its construction, SO. VanDine (1996) proposed a value of ϑDep ranging between 6o for a storage capacity of 25,000 m3 and 16o for a storage capacity of 100,000 m3. Conversely, Piton et al. (2018) and Piton et al. (2022) reported smaller values, 3.4o and 2.7o, for storage capacities of 15–18,000 m3 and 2.8 × 10⁶ m3, respectively. For this reason, the sizing approach based on SO is preferred. Piton and Recking (2016b) collected 456 field measurements with tanϑDep varying largely in a range of about two orders of magnitude (0.005–0.5) because it depends on the rheology of flow, the morphology upstream of the basin, the shape of the basin and the outlet structure. Following Dodge (1948), D’Agostino (2013), and Osti and Egashira (2013) (tan ϑDep = 0.6, 0.5, and 0.67 SO, respectively), Piton and Recking (2016b) proposed an envelope of the ratio tanϑDep/SO between one-third and unity. Finally, Piton et al. (2024) suggested using field values of former deposits. Therefore, a cautious approach could be the assumption of an interval of tan ϑDep between 0 (i.e., a horizontal deposition surface starting from the top of the breakers) and SO/3 when the retention basin has an outlet structure and the interval SO/3 − 2SO/3 for a downstream basin without an outlet structure that must retain all the sediment volume.
4.3.3 Sizing the openings of an open check dam
Sizing the openings of an open check dam aims to avoid clogging caused by the boulders transported by debris flows or to stop boulders with a size that could cause damages downstream. In the first case, the clogging of an open check dam prevents the regulation of solid–liquid discharge, which is temporarily halted until the dam overflows. Boulder blockages can occur when a debris-flow front impacts an open check dam or afterward. In the first case, the mutual interaction between boulders in the front can create an arch effect so that even if the width of the opening is larger than the size of the largest boulder, the opening can become jammed (Choi et al., 2016). Marchelli et al. (2020) field observations show that a relative spacing of 3 (ratio between the width of the opening and the size of the largest boulder) ensures a low probability of clogging (Tacnet and Degoutte, 2013), while a relative spacing ranging between 1.5 and 2 (Takahashi, 2007; Mark, 2017) indicates a high probability of clogging. In the second case, the opening could jam after the passage of the debris-flow front. This happens when two or more boulders transported in the body of the debris flow, with a cumulative diameter greater than the width of the considered opening, pass through it simultaneously. Such a case can be assessed probabilistically by evaluating the probability that, at the same instant, some boulders with a cumulative diameter larger than the opening width approach the opening and jam it.
Piton et al. (2022) proposed a methodology to evaluate such cases. They subdivided the boulders sampled in debris-flow deposits into classes based on their diameter. They defined Nj as the ratio between the volume of the debris-flow deposit and the volume of a sampled boulder of class j evaluated as the volume of a sphere with a diameter equal to the mean size of the class j; pj is the ratio between the number of sampled boulders of class j and Nj. In other words, pj represents the probability that a part of the debris-flow volume, equal to the volume of a boulder in class j, is actually occupied by a boulder of j-size. The values of Nj and pj change for each class j. Considering pj as constant (Piton et al., 2022) evaluated the jamming of an opening by sampling randomly from a binomial distribution the number of boulders for each class present at the opening at the same time. If the cumulative diameter of boulders is larger than the opening width, the opening is considered jammed. The random sampling is based on the binomial distribution:
where Nj,control is the volume of the debris flow passing through the opening divided by the volume of a boulder of class j, that is, the maximum number of boulders of the class j potentially flowing through the opening in that time step, and nj is the number of real boulders of class j in the considered time step.
In this work, we have integrated the methodology proposed by Piton et al. (2022) to account for the fact that, in the case of a series of check dams, the parameter pj should vary for each dam due to the retaining action of the upstream ones. For each check dam at each time step (sub-second intervals), we calculate the volume flowing through and evaluate the number of randomly sampled boulders that are either arrested or not by the structure. Consequently, the volume and number of boulders transiting downstream of the check dam are known, allowing for the pj value of each boulder class to be updated progressively. These updated values are then utilized in Eq. 11 for the next structure.
5 The planned works: overview and sizing
5.1 Survey of the basin with the assessment of the potential debris-flow hazard
According to the framework proposed in the previous section and shown in Figure 3, the basin is surveyed and examined to identify the triggering areas, sediment source areas, and flow paths. The analysis of multi-temporal aerial images for the period 1954–2018 shows that on the right side, debris-flow activity is observed along the channels incised on the scree below the rocky amphitheater that forms the northwest border of the basin (Supplementary Figure S1; Figure 1). Conversely, no debris-flow activity is observed on the left side of Ru Secco Creek, apart from the event of 4 August 2015. A map of the depositional and erosional patterns was derived by subtracting the October 2015 and November 2011 1 m × 1 m resolution LiDAR-derived DEMs on a cell-by-cell basis (details of this operation are in the Supplementary Material) and shown in Figure 6. The map of the depositional and erosional patterns shows a unique large deposit in the source area of the Antrimoia sloping plateau (insets of Figures 1 and 6). Therefore, debris flows can form due to the entrainment of sediments on the bed of channels that incise the scree on the right slopes of Ru Secco Creek (Supplementary Figure S6A) and on the debris deposit of the Antrimoia Plateau. Thus, there are two distinct triggering areas: the mouth of Salvela Creek and the mouths of the channels incising the right side of the basin, except for the Ru da Rede sub-basin, which is downstream. The sediment volume stored on the Antrimoia Plateau after the 4 August event is estimated to be approximately 620,000.00 m3 (i.e., 400,000.00 m3 of solid volume after assuming c∗ = 0.59). This estimate is consistent with the volume of the failed cliff, estimated to be approximately 460,000.00 m3 using the same technique (i.e., 780,000.00 m3 of sediment volume after assuming c∗ = 0.59). The difference is explained by considering the sediment volume transported downstream of Ru Salvela Creek during the event of 4 August 2015 (approximately 76,500.00 m3, according to Gregoretti et al., 2018) and the sediment volume carried out during the clearing operations of May–July 2015 and still lying on the upper part of Ru Salvela Creek. The survey of the basin shows most of the channels on the right side join Ru Secco Creek downstream of the chairlift area (Supplementary Figure S7B of the Supplementary Material shows one of the channels incising the right side scree and joining Ru Secco Creek downstream of the chairlift area). The presence of a sediment volume of approximately 620,000 m3 in the source area means approximately twelve events with the same initial magnitude as that of 4 August could occur (52,500.00 m3 were entrained on the Antrimoia sloping plateau according to Gregoretti et al. (2018). Such potential events, together with those likely occurring on the right side of Ru Secco Creek, where the availability of sediments due to continuous rock falls is unlimited, pose a very high threat to both the resort area and the downstream village of San Vito di Cadore.
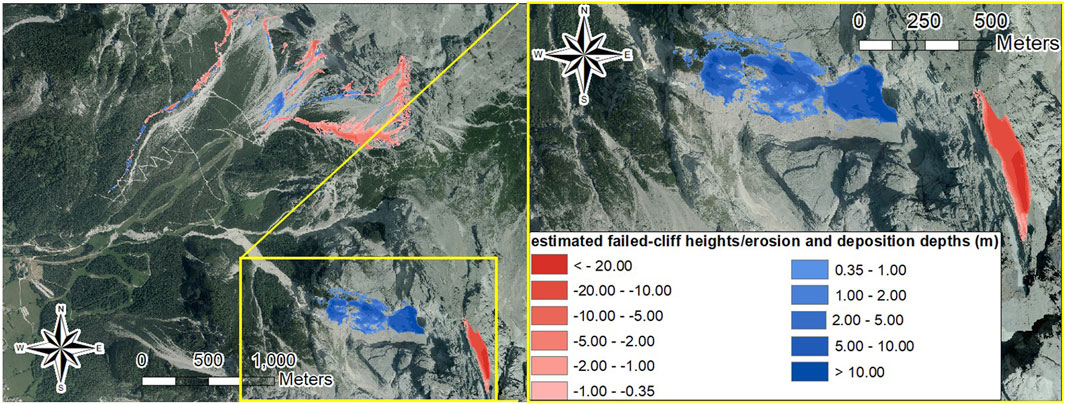
Figure 6. Map of the deposition–erosion pattern of the whole basin (A) with evidence of the aerial view of the collapsed rocky area and the debris deposit on the Antrimoia sloping plateau (B).
5.2 Solid–liquid hydrographs for the two scenarios
Figure 1 shows the sub-basins that contribute runoff (yellow divides), sediment transport (orange divides), and solid–liquid flow (red divides). The runoff hydrographs for the two scenarios are determined using the DDF curve according to the methodologies introduced in Subsection 4.1.1. The DDF curve corresponding to a return period of 300 years (Supplementary Figure S7) is obtained by interpolating the quantiles of different durations computed after applying the POT technique to the data recorded by the rain gauge of Rovina Bassa (Figure 1). In the MPD scenario, the rainfall duration that provides the maximum value of the peak discharge is 14 min for all the sub-basins except three: east Pezuo, Cengio, and Ru de Saco, which have durations of 23 min, 26 min, and 32 min, respectively. In these last three cases, a rainfall duration of 14 min is used. In the MV scenario, the rainfall duration that maximizes VCR on the Antrimoia sub-basin is assumed because it provides the surge with the largest sediment volume (Gregoretti et al., 2018). Figure 7 and Supplementary Figure S8 show the runoff hydrographs for both scenarios in the case of sub-basins providing solid–liquid flows and runoff, respectively. For the MPD scenario, the input solid-hydrograph of the sub-basin Ru del Rede is computed in the formation area, while for the other two sub-basins, it is computed downstream and corresponds to a mature debris flow. The corresponding values of c are 0.2, 0.499 and 0.422. The former has been estimated after a direct survey, while the remaining values are estimated according to the sediment volume data of the event of 4 August 2015 (Gregoretti et al., 2018). For the MV scenario, it is assumed c = 0.3 for the Antrimoia sub-basin, 0.15 for the Salvela sub-basin, and 0.1 for the Ru da Rede sub-basin (half of that of the former scenario). For the Salvela sub-basin, the value of c is half that of the Antrimoia sub-basin because the ratio VSED/VCR was half that of the Antrimoia sub-basin. The sediment volume of the hydrographs for the three sub-basins and the two scenarios is shown in Table 2. The runoff and solid–liquid hydrograph of Ru Secco Creek are shown in Figure 7: the solid discharge is computed by means of the relationship proposed by Recking (2010), resulting in a solid concentration of about 0.1, and it is added to the runoff discharge to obtain the solid–liquid hydrographs. Nearly the same value of solid discharge and concentration can be obtained using the relationship proposed by Smart and Jaeggi (1983). Details on the computations are in the Supplementary Material.
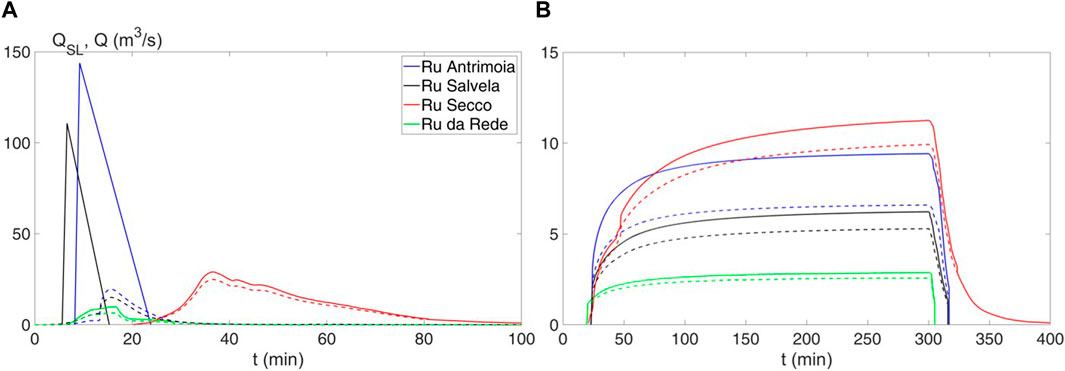
Figure 7. Continuous lines: solid–liquid hydrographs for the scenario of maximum peak discharge (A) and maximum volume (B); dashed lines: runoff hydrographs.
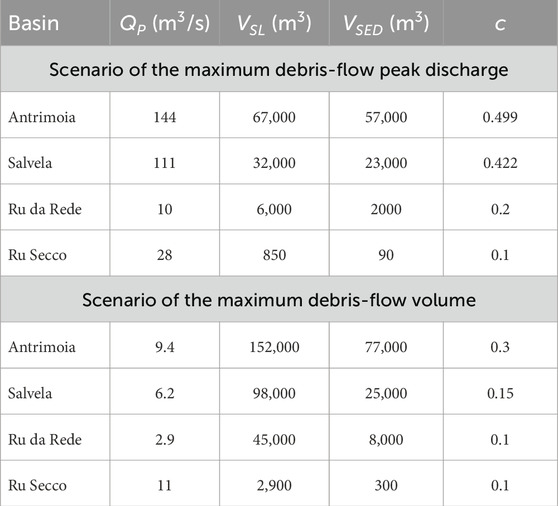
Table 2. Values of QP, VSL, VSED, and c of the solid–liquid hydrographs for the two scenarios.
5.3 Planning works
New control works are planned to protect both the resort area and the downstream village. They aim to retain most of the sediment volume entrained on both sides of Ru Secco Creek. The sediment volume transported by the debris flow formed on the Antrimoia Plateau should be trapped by control works just beneath the plateau. This solution avoids the additional entrainment along Ru Salvela Creek that occurred during the event of August 2015, and so it defends the resort area. The morphological analysis shows that Ru Salvela Creek has an average bed slope of 16o, while the reach of Ru Secco Creek just downstream the mouth of Ru Salvela has a bed-slope angle of about 10o. A constriction provided by a rocky ledge is on the left side (Supplementary Figure S9A). The design sediment volume of these works is the sediment volume corresponding to the design hydrographs of the Antrimoia and Salvela sub-basins for the MPD scenario because the position of the hydrographs is just upstream of the upper works. The computed sediment volume is 80,000 m3 (57,000 m3 and 23,000 m3 for the two sub-basins, respectively). Therefore, according to the scheme shown in Figure 2, two deposition areas are planned on Ru Salvela Creek, and a retention basin is planned on Ru Secco Creek upstream of the constriction (Figure 8). The deposition areas should be able to retain a sediment volume of 30,000 m3 each, while the retention basin should have a capacity of 20,000 m3. The outlets of the channels incising the scree on the right side of the basin are primarily distributed along the left side of Ru Secco Creek downstream of the resort area (i.e., downstream of the upper culvert). Examining this reach of Ru Secco Creek, which has a bed slope of 8.5o, an enlargement approximately 1,000 m upstream of the village is identified. This location is suitable for the placement of a retention basin. The sediment volume entrained by debris flows on the right side of the basin is roughly estimated in the range of 43,400–130,200 m3, corresponding to values of c = 0.3 and 0.5. This result is calculated using Eq. 2 after computing VSL through Eq. 4 with VCR being the sum of all contributions from each runoff hydrograph corresponding to the MV scenario. The culvert at the end of the protected reach (Supplementary Figure S3B) is removed, restoring the creek's original cross-section. The culvert acts as a constriction that could become clogged, leading to a repeat of the uncontrolled overflow that occurred during the event of 4 August 2015, which resulted in casualties and extensive damage. All the works are shown in Figure 8 and Supplementary Figure S10.
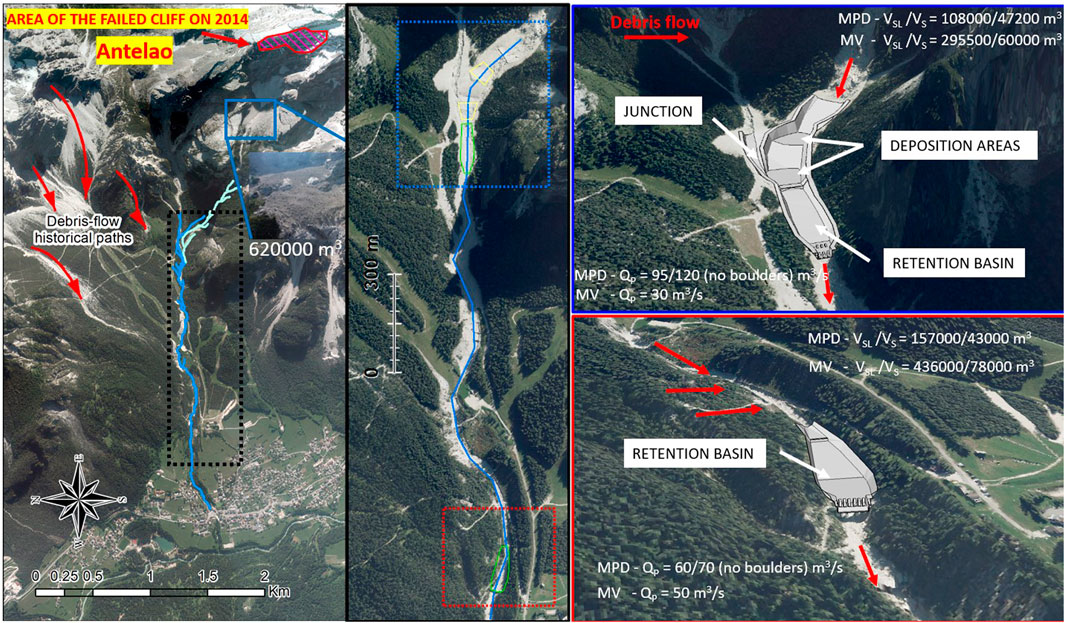
Figure 8. Schematic overhead view of the basin (left panel) and of the planned control works along Ru Salvela and Ru Secco Creeks (blue line) on the middle panel with the 3D views of the upper and lower works on the top and bottom right panels, respectively, with the values of VSL and QP upstream and downstream of the works for both scenarios.
5.4 Sizing of the planned works
The planned works are two in-series deposition areas located on Ru Salvela Creek and two retention basins located on Ru Secco Creek (Figure 8). The two deposition areas and the upper retention basin aim to reduce the sediment volume entrained on the left side, while the lower retention basin reduces the sediment volume entrained on the right side of the basin. The object of the works is to reduce the volume of sediment transported by debris flow so that no overflow can occur, and the solid discharge should fall below 5 m3/s on average upstream of the village. The design volume of the two deposition areas is 30,000 m3, which corresponds to the value A = 4,400 m2 A is the horizontal projection of the whole deposition area: flat part, sloping banks, and incoming channel bed, provided by Eq. 8. This reference value is adopted as an initial value for the design of the two deposition areas. The lower deposition area is placed at the mouth of Ru Salvela Creek (Supplementary Figure S9B). The deposition areas are not aligned, so an inclined slope is placed between them to address the flow arriving from the upper basin along the longitudinal direction of the lower basin. The slope is protected by a riprap revetment to avoid uncontrolled erosion due to its high slope (46%). The upper deposition area results are somewhat smaller than the lower area results (5,100 m2 with a flat part of 3,600 m2 against 5,400 m3 with a flat part of 3,400 m2). They are shown in Figure 8. The values of the deposition volume estimated using Eq. 9 are 24,000 and 33,600 m3, respectively. The difference in the deposition volume is due to the shape, as the areas of the flat parts are nearly the same; the upper deposition area is wider and shorter. Initially, the upper deposition area was planned as a retention basin with an open check dam as an outlet structure to increase the trapped sediment volume. Preliminary simulations showed that the possible clogging of the open check dam entailed a flow avulsion on the right bank in that zone and its conveyance along a forest road directed to the village. The downstream free edge of the deposition area prevents the possibility of avulsion with a dangerous uncontrolled flow routing in the direction of the village. The retention basin is placed upstream of a constriction that can be enlarged on both sides. The constriction is provided by a rocky ledge on the left side (Supplementary Figure S7B), just upstream of the protected reach, where the left wing of the open check dam closing the retention basin can be anchored. The design volume of the retention basin is 20,000 m3. A height of 7 m is chosen for the open check dam, which corresponds to a deposition volume of approximately 20,000 m3 assuming a horizontal deposition surface and a volume of 21,500 m3 assuming a deposition surface with a slope that is one-third of the Ru Secco bed slope (3.5o). The first large rocks entrained by the runoff flowing on the Antrimoia Plateau contribute to forming the debris-flow front. This front is likely to clog the openings of the upper open check dam, preventing its dosing effect. Therefore, a screen of breakers is placed upstream of it with four central openings 4 m wide and two lateral openings 7 m wide. The central openings of the screen breakers are misaligned compared to those of the dam to increase the dosing action in the absence of a debris-flow front composed of boulders. The 4 m width stops clusters of 1–2 m or larger boulders forming the front. In the open check dam positioned in the restriction with the left abutment fixed on a rocky ledge, there are two central openings 4 m wide and two lateral openings 3 m wide. The larger central openings should help to address the flow in the middle of the channel cross-section downstream of the dam to protect the banks. These wider-than-usual openings aim to avoid or delay clogging, thus allowing as much discharge dosing as possible. However, the large rocks transported by debris flows and not part of the front could clog one or all the openings, limiting the dosing of the discharge. The occurrence of such a scenario and its consequences must be investigated with the numerical model that implements the clogging methodology proposed by Piton et al. (2022) (see point 4.3.3). Additionally, these openings can stop the front of a second surge or that of a debris flow occurring later in time before the deposition areas and the retention basin are emptied. The top right panel of Figure 8 shows the whole area of the deposition areas and the retention basin with the screen of breakers and the open check dam, while Supplementary Figure S11 shows the planimetric and frontal views of the dam. Conversely, in the case of the debris flow corresponding to the MV scenario, the smaller runoff discharge entails a lower entrainment capability so that the debris flow is characterized by a lower concentration. This means that the simultaneous passage of several boulders is unlikely, making the dosing effect relevant, and a larger percentage of the sediment volume is transported downstream of the dam.
The lower retention basin has been located at the end of an enlargement of Ru Secco Creek, at the point where it narrows, just upstream of an existing solid-body check. The openings should hold a front with 0.7–1 m or larger boulders to avoid clogging the existing culvert just upstream of the village. As the retention basin is well downstream of the debris flow initiation area, a preliminary simulation corresponding to the MV scenario provides an estimate of the sediment volume transported by debris flows on the right side of the Ru Secco basin, resulting in 55,000 m3 when the solid–liquid volume is 78,000 m3 and the solid concentration is 0.42. The design volume of the retention basin should be about 75% of the sediment volume transported by debris flows on the right side of the Ru Secco basin, or 41,000 m3. The open check dam is positioned as far forward as possible, just upstream of the shearing zone (Rankine active pressure) of an existing solid-body check dam. The height of the dam, 10 m, is the maximum value allowed by the top of the lateral banks. The height of the breakers, 5 m, and there are seven openings: a central one 3 m wide and six lateral openings 2 m wide. The simulation results reveal that the retention basin could contain less than 41,000 m3, so the bottom was lowered by 1 m (the height of the breakers increases to 6 m, maximum value to avoid the effect of the flow jump on the downstream solid-body check dam if all the openings are clogged) and elongated upstream. The upstream extension of the retention basin is determined through preliminary simulations. Supplementary Figure S12 shows the simulated depositional profiles along the longitudinal axis of the dam for the existing and excavated bottoms. The extension searched is such that the backwater effect of the deposition in the retention basin affects the channel bed just upstream of the enlargement, maximizing the sediment volume in the retention basin. The bottom right panel of Figure 8 shows the retention basin, while Supplementary Figure S13 shows the planimetric and frontal views of the dam.
6 Analysis of the performance of the planned control works
The performance of the proposed control works is evaluated by modeling the debris-flow routing for the two scenarios, considering both the absence and presence of boulders. The DEM used for the modeling is obtained by merging the points from a UAV flight in July 2019 (see the Supplementary Material), covering Ru Secco Creek after preliminary works and the left side of the basin, with those from the LiDAR survey conducted in October 2015, covering the right side of the basin. The grid size is 1 m, according to Boreggio et al. (2022). The DEM of the dams was built after drawing and dimensioning using AutoCAD®. The dimensioned polylines were imported into GIS software and used to create a triangulated irregular network (TIN), from which the raster of the works to be inserted into the DEM was derived. The parameters of the routing model are shown in Subsection 2.4. The parameters Nj and pj (the ratios between the volume of the boulders and the volume of the debris-flow deposit and between the number of boulders and Nj, respectively) were estimated based on the 35 boulders with diameters ranging between 1 m and 2 m detected on the deposit surface between the head of Ru Salvela Creek and the upper existing deposition area, along a 200 m-long reach, to investigate the possible clogging of the openings of the dams. Larger boulders were not detected during the 2015 post-event survey, nor were any removed from the torrent bed during the realization of the preliminary works. The volume of the reference deposit was computed by differentiating DEMs corresponding to the LiDAR flight of November 2011 and the UAV survey of July 2019, resulting in approximately 11,000 m3. Although these values are inherently characterized by uncertainty, as highlighted by Piton et al. (2022), the same proportion of boulders on the deposit surface relative to the deposit volume, pj = 0.0055, is assumed for the boulders lying on the surface of the debris deposit covering the Antrimoia Plateau that is not accessible.
In the absence of boulders, openings could clog because of the deposition caused by the flatness of the bottom. About the MPD scenario, the results in terms of maximum flow depth and deposition/erosion depth, both without and with the boulders in the debris-flow mass, are detailed in Figure 9 for all the control works. In Figure 10, the longitudinal profiles of the initial and final bottom with the maximum flow surface of the two retention basins, along with the cross-sectional profiles corresponding to the dams, are shown just upstream of the dam (in Supplementary Figure S14, which shows the complete longitudinal profile). Figures 11 and 12 depict similar results for the MV scenario, while Table 3 shows the values of the simulated sediment volumes trapped in the deposition areas and retention basins for both scenarios. The results of all the simulations for the entire flow pattern are shown in Supplementary Figures S15–18.
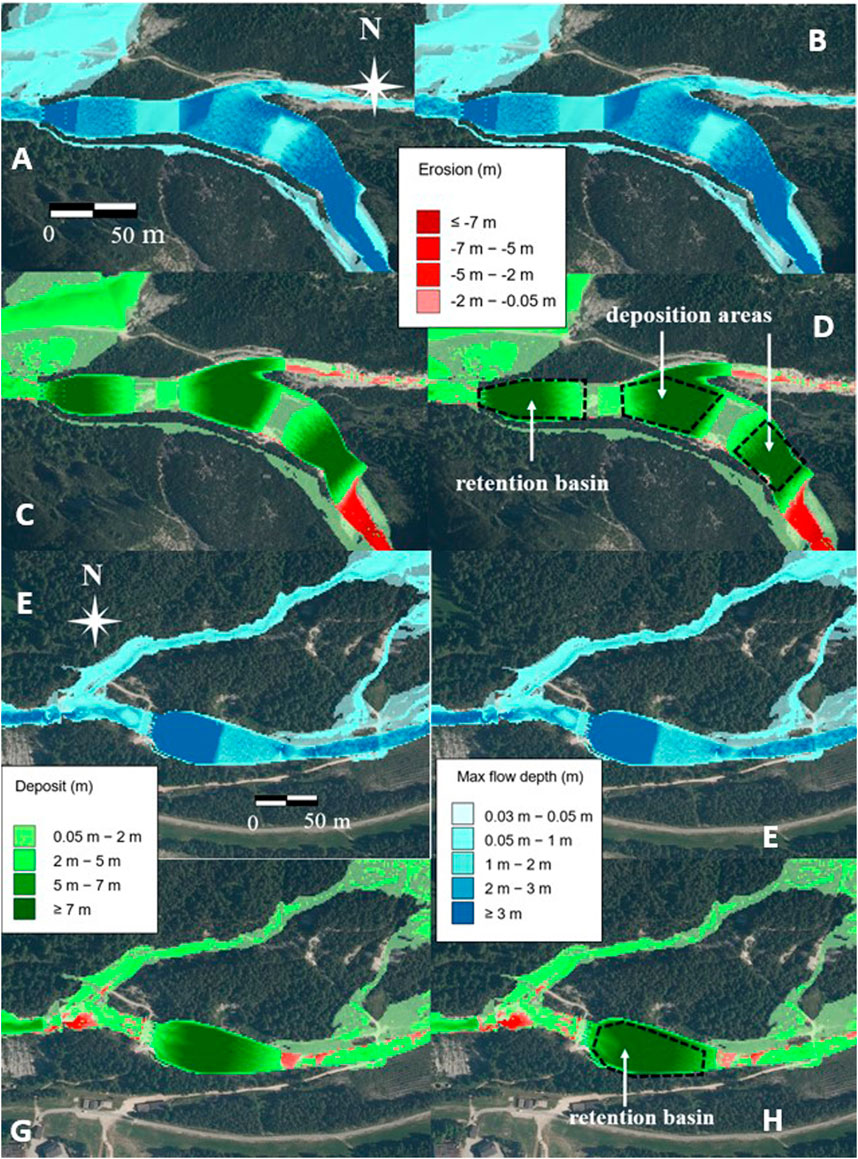
Figure 9. MPD scenario: simulated values of the maximum flow depth (A, B, E, and F) and of the deposition-erosion depth (C, D, G, and H) without (A, C, E, and G) and in the presence (B, D, F, and H) of boulders for the control works in the upper (A, B, C, and D) and lower (E, F, G, and H) parts of the basin.
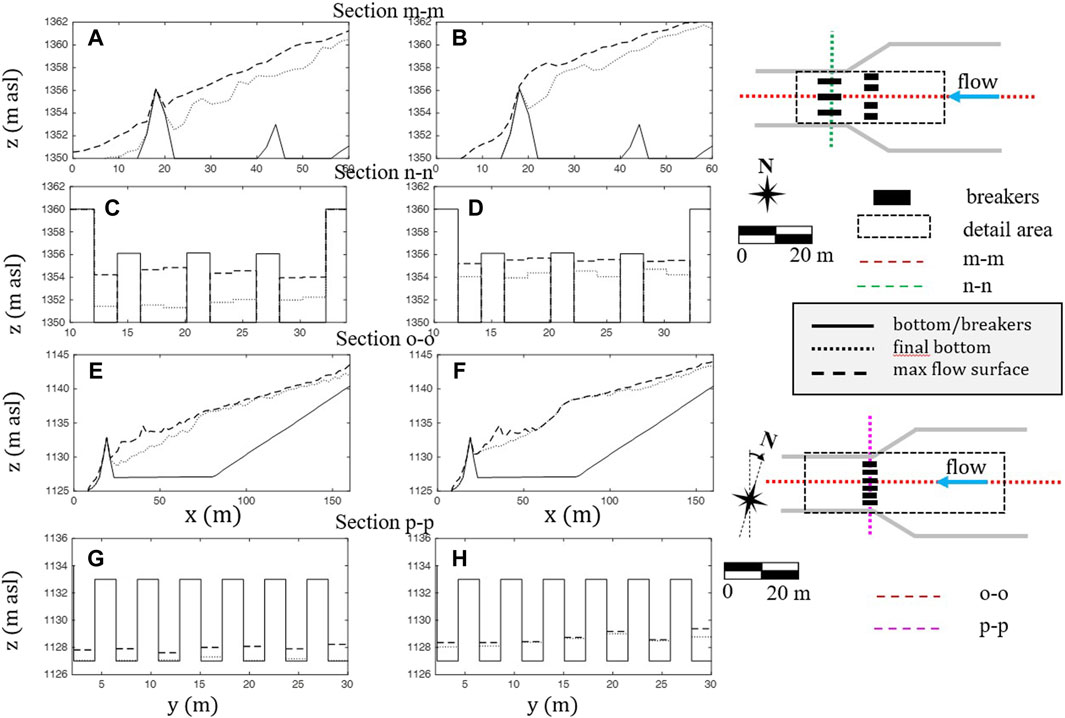
Figure 10. Longitudinal (A, B, E, and F) and transverse (C, D, G, and H) profiles of the final bottom elevation and maximum flow surface without (A, C, E, and G) and with boulders (B, D, F, and H) corresponding to the flow pattern of Figure 9 (MPD scenario).
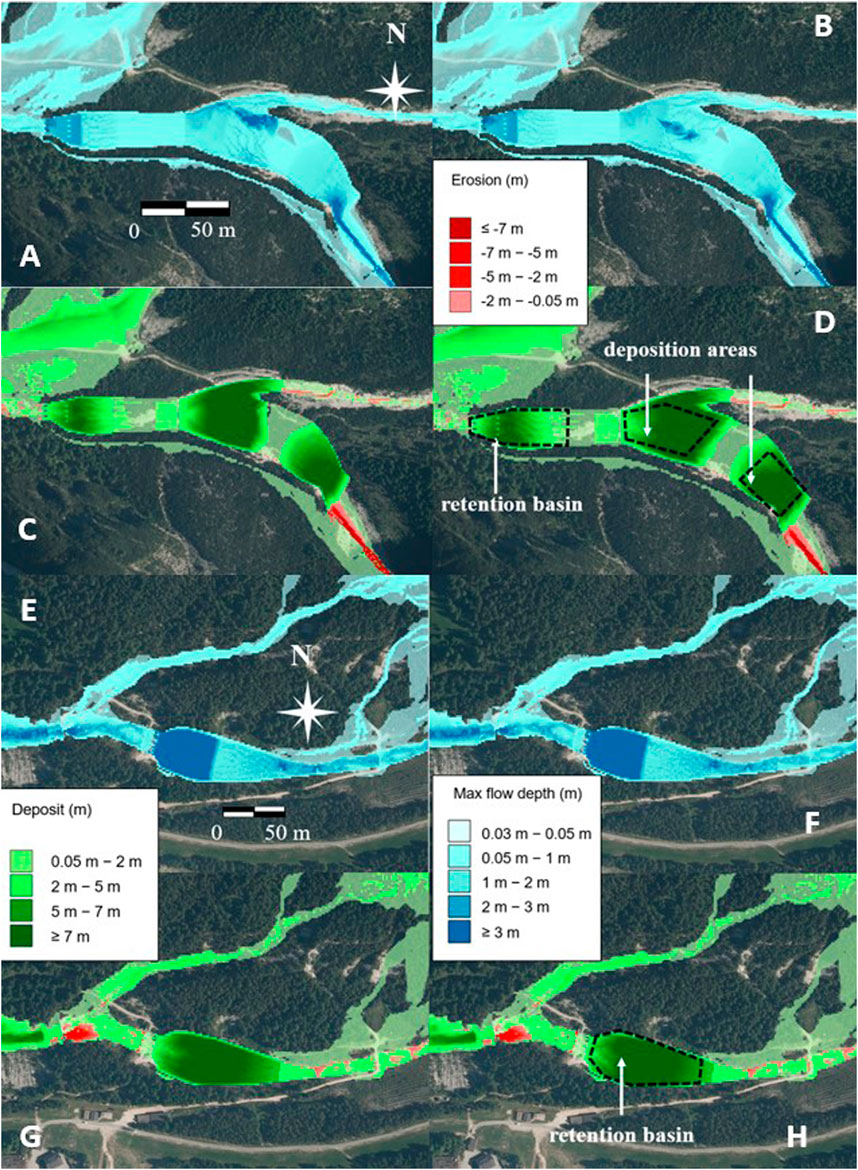
Figure 11. MV scenario: simulated values of maximum flow depth (A, B, E, and F) and of the deposition-erosion depth (C, D, G, and H) without (A, C, E, and G) and with (B, D, F, and H) boulders for the control works in the upper (A, B, C, and D) and lower (E, F, G, and H) parts of the basin.
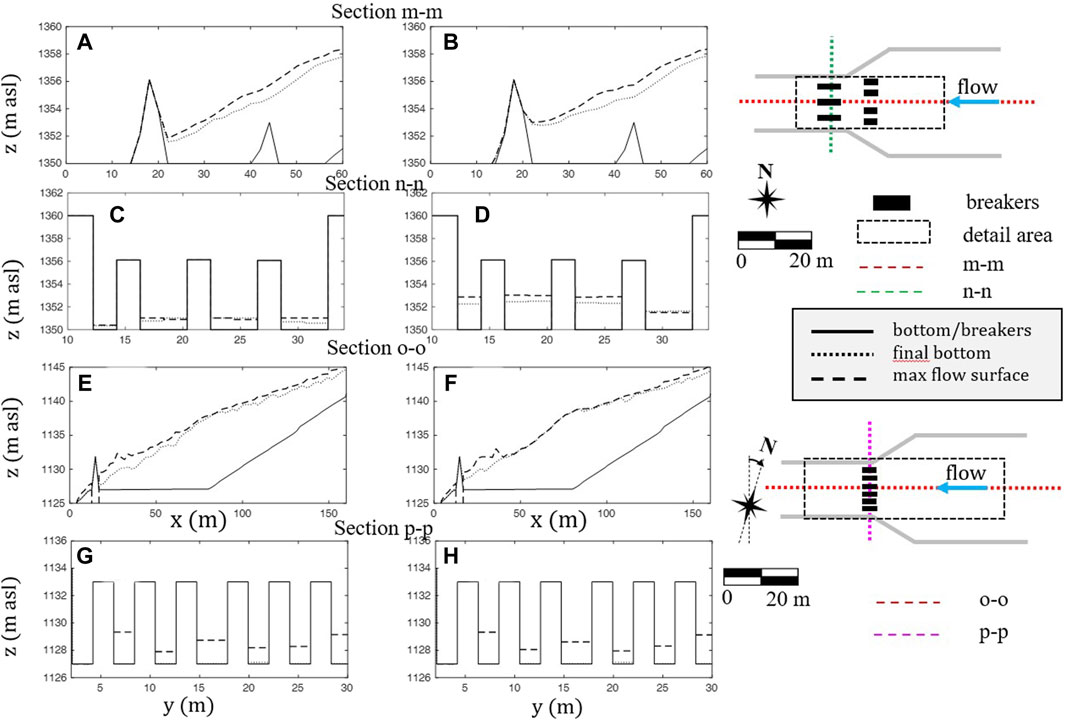
Figure 12. Longitudinal (A, B, E, and F) and transverse (C, D, G, and H) profiles of the final bottom elevation and maximum flow surface without (A, C, E, and G) and with (B, D, F, and H) boulders corresponding to the flow pattern of Figure 11 (MV scenario).
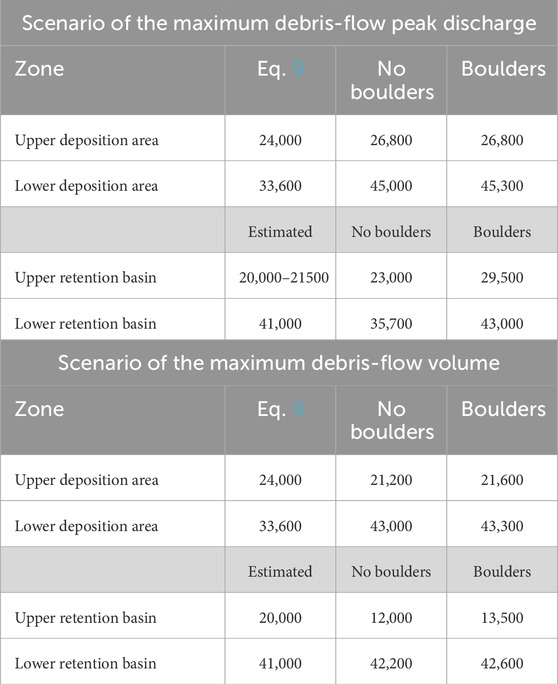
Table 3. Comparison between the sizing and simulated values of the sediment volumes (m3) trapped on the deposition areas and the retention basins, without and with boulders, for the two scenarios.
The results for the MPD scenario show that for the upper retention basin, in the presence of boulders, the deposit on the retention basin has a larger upstream extension (Figures 9D and Supplementary Figure S14B), and both the deposition and maximum flow surface profiles are higher (Figures 10B and Supplementary Figure S14B). This is due to the clogging of the openings, which almost reaches the top of the breakers when the boulders are considered. In contrast, it averages approximately 1 m when the boulders are not considered. The deposition on the lower retention basin exhibits the same behavior: the openings are mostly free when the boulders are not considered, with partial clogging of approximately 1 m on average when the boulders are considered. The values of the trapped sediment volumes (Table 3) are larger in the presence of boulders, with a positive increment of 30% and 20% for the upper and lower retention basins, respectively. The smaller increment of the deposition volume on the lower basin is associated with less clogging of the dam openings, caused by both fewer boulders in proportion to the original mass present downstream of the upper dam and the smaller discharge. Note also that the absence of smaller boulders (for example, the diameter class 0.5–1 m) in the calculation should not affect the opening clogging of the upper check dam (openings larger by at least 3 m) but could lead to an underestimation of the potential for blockage of the narrower openings of the lower dam. Regarding the deposition areas, the results remain unchanged with or without boulders, and the small difference in the estimated volumes (Table 3), less than 1%, is an artifact of the multi-processor algorithm that does not provide identical results for a same simulation.
The results for the MV scenario show a generally small or negligible difference in clogging with or without boulders. When the boulders are not considered, the openings of the upper dam are free (only a small deposition depth of some tens of centimeters occurs), whereas there is partial clogging of approximately 1 m on average when they are considered (Figure 12). Conversely, for the lower dam, there is almost no difference between the results with or without the boulders: the openings are free in both cases (Figure 12). The smaller difference for the upper dam is due to the long duration of the hydrograph, for which the number of boulders passing through the openings of the dams is smaller, and therefore, the probability of clogging decreases. The absence of a difference for the lower check dam is attributed to both the long duration of the hydrograph and to the reduced number of boulders flowing downstream of the upper dam. The trapped sediment volume on the upper retention basin is slightly larger in the presence of boulders, whereas that on the lower retention basin remains the same in both cases (Table 3).
Table 3 evaluates the effectiveness of the works by comparing the simulated deposition volumes with those used for sizing the works. The MPD scenario for the upper works shows a total of 94,100 and 101,600 m3 in the absence and presence of boulders, respectively, against the sizing value of 80,000 m3, while there are 35,700 and 43,000 m3 in the lower retention basin against a sizing value of 41,000 m3. In detail, the simulated deposition volume on the upper deposition area is just 10% larger than the value given by Eq. 9, whereas that on the lower deposition area is much higher, about 35%. The first result shows a good approximation of the deposition volume provided by the sizing procedure. Therefore, Eqs 8, 9 prove to be effective tools for a rapid application in a GIS environment, assuming significance in sizing deposition areas. The second result stems from the deposition downstream of the deposition area (Figures 9C, D), causing a backwater effect that significantly exceeds the initially estimated deposition volume. The proposed criterion for sizing the retention basin also proves effective for the upper basin and for sizing the lower basin using preliminary simulations.
In the case of the MV scenario, the corresponding values in the absence and presence of boulders are 76,200 and 78,400 m3, respectively, for the upper works and 42,200 and 42,600 m3 for the lower retention basin. Supplementary Figures S19, 20 show the hydrographs of the solid–liquid discharge, solid discharge, and concentration in the absence and presence of boulders downstream of the dams for the two scenarios. Regarding the MPD scenario, in the absence of boulders, the solid discharge is dampened downstream of the upper retention basin, with values equal to or smaller than 10 m3/s, and diminishes to the values equal to or smaller than 5 m3/s downstream of the lower retention basin. In the presence of boulders, the damping of the solid discharge downstream of the upper retention basin is more marked. This is consistent with the volume of sediment trapped in the retention basin, which is larger in the presence of boulders (Table 3), and with the longitudinal and cross-sectional profiles shown in Figure 10. Conversely, there is no significant difference when considering the presence or absence of boulders in the hydrographs downstream of the lower retention basin, as confirmed by the volume of trapped sediment (Table 3) and by the longitudinal and cross-sectional profiles shown in Figure 12. About the MV volume scenario, the hydrographs are quasi-identical for both the upper retention and lower basin. These results confirm the validity of the proposed works: both the resort area and village are protected from inundation. The solid discharge delivered downstream is not high and can be managed by a wide confluence into the steep Boite Torrent, where Ru Secco Creek ends.
7 Discussion of results
The consideration of boulders, as depicted in Figures 10, 12, and Supplementary Figure S13, results in a higher level of blockage in the dam openings, subsequently increasing both the upstream extension and the volume of the deposit upstream of the dams. Consequently, this design is more precautianary in a scenario without boulders than in one with them. Conversely, a scenario with boulders could be deemed protective if there is a potential local condition for overflow or flow diversion upstream of the dam because of the blockage in the openings. In such instances, suggesting countermeasures like raising the lateral banks might be warranted. Supplementary Figure S21A illustrates the progressive clogging of one of the openings of the upper dam caused by boulders and sediment deposition. To investigate the effect of the stochasticity of the clogging model on the results (Piton et al., 2022), we repeated the simulations for the MPD scenario four additional times. The results are shown in Supplementary Figure S21B: the boulder obstruction level fluctuates within a 1.0 m interval among the different simulations. This result does not invalidate the simulation of the clogging process but does provide some indication of its accuracy. The fluctuation shown by the obstruction level is much less than that observed by Piton et al. (2022) and Chahrour et al. (2024) for a single-opening slit dam due to the presence of multiple openings and the much lower number of repeated runs, which are much more time-consuming in the present case. The deposition volumes in the retention basin upstream of the upper check dam corresponding to the five simulations have an average and maximum scatter of about 1% and 4%, respectively (approximately 400 and 1,400 m3). The fluctuation of the clogging level over time after reaching its largest value is due to the multiple openings in the dam, which clog individually. To maintain the continuity over time, not all the cells of the opening are obstructed simultaneously but rather are clogged depending on the debris-flow propagation. The clogging level represented in Supplementary Figure S21 is the average over the wetted cells of the opening for that time step.
Simulations corresponding to the MV scenario indicate a smaller sediment volume trapped in the upper works than in the MPD scenario. Conversely, the sediment volume trapped in the lower retention basin is nearly the same for both scenarios considering the boulders, whereas, in the absence of boulders in the MV scenario, it is larger by about 20% than that trapped in the MPD scenario. This basin predominantly captures sediment entrained from the right side of the basin. Here, the longer distance from the input zone of the design hydrographs allows the debris flow to entrain and transport a larger sediment volume with respect to the MPD scenario because of the initial higher volume and smaller solid concentration. The comparison between the deposition-erosion depth maps for the MPD and MV scenarios shown in Supplementary Figures S17, 18 exhibits a larger and deeper erosion area on the right side of the basin in the case of the MV scenario.
Therefore, for the upper works, the MV scenario is ineffective because of the proximity of the works to the input zone. Specifically, the smaller flow velocity corresponding to this scenario limits the sediment entrainment, so the shorter distance of the works from the input area prevents the flow from reaching the maximum transporting capacity corresponding to the runoff contributing volume, VCR.
However, the solid–liquid flow corresponding to the MV scenario has a larger impact on the village. Supplementary Figure S21 illustrates the solid–liquid and solid hydrographs in a section upstream of the village for both scenarios. A visual comparison of the hydrographs of both scenarios indicates that the MPD has a larger peak solid–liquid discharge but a lower peak solid discharge. In addition, both the solid–liquid and solid discharges show larger values on average for the MV scenario and a duration that is about three times longer.
In essence, the MPD scenario is more protective when considering the defense of the resort area in the upper part of the basin, whereas the MV scenario is more protective when considering the defense of the village in the lower part of the basin, close to the valley bottom.
8 Conclusion
This paper presents an alternative approach for controlling the volume of sediment transported by in-channel debris flows, starting from the high-sloping reach of the channel in the upper part of the basin. It involves a cascading combination of deposition areas and retention basins with open check dams serving as outlet structures for detaining the sediment volume. The deposition areas are built in the high-sloping reach of the debris-flow channel, whereas the retention basins are situated in the intermediate and low-sloping reaches of it. The number and size of the deposition areas and retention basins depend on the morphology and the sediment volume to be stored. The proposed approach includes a framework for assessing the hazard and planning the mitigation works with criteria for determining the sizes of the works and methods for evaluating their performance.
Two sizing scenarios are considered: debris flows with maximum solid–liquid peak discharge and maximum volume, respectively. The former corresponds to a debris flow triggered by high-intensity, short-duration rainfall that provides enough runoff to entrain a large amount of sediment, resulting in high solid concentration values. The latter corresponds to a debris flow triggered by longer duration and lower intensity rainfall, resulting in a runoff with a smaller discharge but a larger volume than the previous case. This implies a debris flow with initially lower erosive power and a smaller solid concentration (i.e., solid content). Therefore, the MPD scenario is used for sizing the basins designated to store the sediment close to the triggering area, as well as the outlet structures of all the basins. Conversely, the MV scenario is used to size the basins designated to store the sediment far from the triggering area so that the entrainment of debris material is significant.
The performance of the works is evaluated by modeling the debris flows corresponding to the two scenarios. The presence of boulders in the debris flow volume is also considered, and the method by Piton et al. (2022) for evaluating dam clogging is expanded to multiple dams and implemented within a debris-flow routing model. The large flow pattern and the use of a 1-meter grid size for hydraulic modeling, which are essential for accurately representing the open check dam openings, result in an increased simulation duration. To address this, the algorithm of the model by Gregoretti et al. (2019) is modified for multi-processor utilization, reducing simulation duration to one-third when employing at least four threads.
This approach is applied in planning protective measures for a resort area and the village of San Vito di Cadore, which were impacted by a significant debris flow on 4 August 2015. Two primary sources of sediment for the development of debris-flow phenomena were identified through basin surveys and multi-temporal DEM analysis. One originated from a very large debris deposit (approximately more than 600,000 m3) on the Antrimoia Plateau, threatening both the resort area and the village. The other stemmed from scree on the upper right side of the basin, posing a threat solely to the village. The former is managed by two deposition areas along Ru Salvela Creek, where the slope is steep, and a retention basin on Ru Secco Creek just downstream of the lower deposition area, where the slope is moderately inclined. The latter is managed by a retention basin situated roughly midway between the upper retention basin and the village. The dimensions of these control works were determined using the proposed sizing criteria, assisted by hydraulic modeling, to identify the best mitigative effect.
Performance analysis via hydraulic modeling for both scenarios, with and without boulders, confirms the efficacy of the proposed works. There is no inundation, and the flow carries a small solid discharge, on average smaller than 5 m3/s with a peak of approximately 10 m3/s, which can be managed by the Boite Torrent where Ru Secco Creek converges. The analysis indicates that the upper works achieve the best mitigative effects, trapping the highest sediment volume in the MPD scenario. However, the MV scenario proves effective when the distance between the initiation area and the structures is considerable. It conveys a larger sediment volume downstream of the works when the lower retention basin provides its best mitigative effect. Therefore, in the case of retention basins without outlet structures placed close to the valley bottom, it leads to the maximum sizing volume. The presence of boulders in the debris-flow mass leads to increased clogging of dam openings, resulting in a greater trapped sediment volume in the retention basins, entailing a higher deposition surface. This condition, therefore, results in less cautionary unless the possibility of overflow and flow avulsion upstream of the dam because of the higher deposition surface.
Data availability statement
The raw data supporting the conclusion of this article will be made available by the authors, without undue reservation.
Author contributions
MBa: software and writing–review and editing. MBe: software and writing–review and editing. MBo: data curation, visualization, and writing–original draft. MS: software, visualization, and writing–review and editing. VA: funding acquisition, project administration, supervision, and writing–original draft. CG: methodology, project administration, supervision, and writing–review and editing.
Funding
The author(s) declare that financial support was received for the research, authorship, and/or publication of this article. This work was supported by the following funds: European Union Next-Generation EU, National Recovery, and Resilience Plan—NRRP, Mission 4, Component 2, Investment 1.3—D.D. 1,243 2/8/2022, PE0000005 (RETURN Extended Partnership); Fondazione Cassa di Risparmio di Padova e Rovigo (Excellence Grant 2021 to the RESILIENCE Project “Extreme storms in the Italian North-East: frequency, impacts and projected changes”); Universitá degli Studi di Padova (grants numbers DOR2059951/20 “Validation of a kinematic and bi-phases cell model for simulating the hydraulic routing of a debris flow” and DOR2330507/23 “Use of the deposition areas for the reduction of the sediment volume transported by debris flows”). Open Access funding was provided by Universitá degli Studi di Padova/University of Padua, Open Science Committee.
Acknowledgments
The authors wish to thank ARPA Veneto for the rain gauge data used to determine the depth-duration frequency curve, the municipality of San Vito di Cadore for the permission to use the forest roads, and Fabio Da Re of the Forest Service of Veneto Region for his help. Finally, Sara Cucchiaro is thanked for her help in carrying out the UAV flight in 2019, while Valentina Bonomo and Nicola Bottin are thanked for their help in the field surveys.
Conflict of interest
The authors declare that the research was conducted in the absence of any commercial or financial relationships that could be construed as a potential conflict of interest.
The author(s) declared that they were an editorial board member of Frontiers, at the time of submission. This had no impact on the peer review process and the final decision.
Publisher’s note
All claims expressed in this article are solely those of the authors and do not necessarily represent those of their affiliated organizations, or those of the publisher, the editors, and the reviewers. Any product that may be evaluated in this article, or claim that may be made by its manufacturer, is not guaranteed or endorsed by the publisher.
Supplementary material
The Supplementary Material for this article can be found online at: https://www.frontiersin.org/articles/10.3389/feart.2024.1340561/full#supplementary-material
References
Armanini, A., Fraccarollo, L., and Rosatti, G. (2009). Two-dimensional simulation of debris flows in erodible channels. Comput. Geosciences 35, 993–1006. doi:10.1016/j.cageo.2007.11.008
Baggio, T., Mergili, M., and D’Agostino, V. (2021). Advances in the simulation of debris flow erosion: the case study of the rio gere (Italy) event of the 4th august 2017. Geomorphology 381. doi:10.1016/j.geomorph.2021.107664
Bennet, G. L., Molnar, P., McArdell, B. W., and Burlando, P. (2014). A probabilistic sediment cascade model of sediment transfer in the Illgraben. Water Resour. Res. 50, 1225–1244. doi:10.1002/2013WR013806
Berger, C., McArdell, B., and Schlunegger, F. (2011). Direct measurement of channel erosion by debris flows, illgraben, Switzerland. J. Geophys. Res. 116. doi:10.1029/2010JF001722
Bernard, M., Barbini, M., Boreggio, M., Biasuzzi, K., and Gregoretti, C. (2024a). Deposition areas: an effective solution for the reduction of the sediment volume transported by stony debris flows on the high-sloping reach of channels incising fans and debris cones. Earths Surf. Process Landforms 49, 664–683. doi:10.1002/esp5727
Bernard, M., Barbini, M., Berti, M., Simoni, A., Boreggio, M., and Gregoretti, C. (2024b). Rainfall-runoff modelling in rocky headwater basins for the prediction of debris-flow occurrence. Submitted for publication.
Bernard, M., Boreggio, M., Degetto, M., and Gregoretti, C. (2019). Model-based approach for design and performance evaluation of works controlling stony debris flows with an application to a case study at Rovina di Cancia (Venetian Dolomites, Northeast Italy). Sci. Total Environ. 688, 1373–1388. doi:10.1016/j.scitotenv.2019.05.468
Bernard, M., and Gregoretti, C. (2021). The use of rain gauge measurements and radar data for the model-based prediction of runoff-generated debris-flow occurrence in early warning systems. Water Resour. Res. 57, 1–27. doi:10.1029/2020WR027893
Bollschweiler, M., and Stoffel, M. (2010). Changes and trends in debris-flow frequency since ad 1850: results from the swiss alps. Holocene 20, 907–916. doi:10.1177/0959683610365942
Boreggio, M., Bernard, M., and Gregoretti, C. (2022). Does the topographic data source truly influence the routing modelling of debris flows in a torrent catchment. Earths Surf. Process Landforms 8, 2107–2129. doi:10.1002/esp5366
Chahrour, N., Piton, G., Tacnet, J., and Berenguer, C. (2024). A surrogate deterioration model of debris retention systems towards cost-effective maintenance strategies and increased protection efficacy. Eng. Struct. 300, 117202. doi:10.1016/j.engstruct.2023.117202
Chanson, H. (2004). Sabo check dams - mountain protection systems in Japan. Int. J. River Basin Manag. 2, 301–307. doi:10.1080/15715124.2004.9635240
Choi, S., Lee, J., and Kwon, T. (2016). Effect of slit-type barrier on characteristics of water-dominant debris flows: small-scale physical modeling. Landslide 15, 111–122. doi:10.1007/s10346-017-0853-4
Christian, T. (1999). Beitrag zur Untersuchung der Entstehungsmechanismen von Murgängen debris-flow and debris-flood mitigation design in Canada. Zurich: ETH Zurich.
D’Agostino, V. (2013). “Assessment of past torrential events through historical sources,” in Dating torrential processes on fans and cones: methods and their application for hazard and risk assessment, advances in global change research. Editors M. Schneuwly-Bollschweiler, M. Stoffel, and F. Rudolf-Miklau (Dordrecht, Netherlands: Springer), 47, 131–146. doi:10.1007/978-94-007-4336-6_8
Damm, B., and Felderer, A. (2013). Impact of atmospheric warming on permafrost degradation and debris flow initiation – a case study from the eastern european alps. EG Quat. Sci. Journaly 62, 136–149. doi:10.3285/eg.62.2.05
Davison, A. C., and Smith, R. L. (1990). Models for exceedances over high thresholds. J. R. Stat. Soc. Ser. B Methodol. 52, 393–425. doi:10.1111/j.2517-6161.1990.tb01796.x
de Haas, T., Densmore, d. H. T., A, L., and Cox, N. J. (2019). Fan-surface evidence for debris-flow avulsion controls and probabilities, saline valley, California. J. Geophys. Res. 124, 1118–1138. doi:10.1029/2018jf004815
Dodge, B. H. (1948). “Design and operation of debris basins,” in Proc., federal inter-agency sedimentation conf (Washington, DC: U.S. Dept. of the Interior, Bureau of Reclamation), 274–301.
Dreabing, D., and Krautblatter, M. (2019). The efficacy of frost weathering processes in alpine rockwalls. Geophys. Res. Lett. 46, 6516–6524. doi:10.1029/2019GL081981
Flores, J., D’Alpaos, A., Squarzoni, C., Genevois, R., and Marani, M. (2010). Recent changes in rainfall characteristics and their influence on threshold for debris flow triggering on dolomitc area of cortina d’ampezzo, north-eastern Italian alps. Nat. Hazards Earth Syst. Sci. 10, 571–580. doi:10.5194/nhess-10-571-2010
Franceschinis, C., Thiene, M., Mattea, S., and Scarpa, R. (2020). “Do information and citizens characteristics affect public acceptability of landslide protection measures? a latent class approach,” in Climate change management (Springer), 503–513. doi:10.1007/978-3-030-36875-3_25
Frank, F., McArdell, B., Huggel, C., and Vieli, A. (2015). The importance of entrainment and bulking on debris flow runout modeling: examples from the swiss alps. Nat. Hazards Earth Syst. Sci. 15, 2569–2583. doi:10.5194/nhess-15-2569-2015
Gatter, R., Cavalli, M., Crema, S., and Bossi, G. (2018). Modelling the dynamics of a large rock landslide in the dolomites (eastern Italian alps) using multi-temporal dems. PeerJ 6 (15), e5903–e2583. doi:10.7717/peerj.5903
Giovannini, L., Davolio, S., Zaramella, M., Zardi, D., and Borga, M. (2021). Multi-model convection-resolving simulations of the october 2018 vaia storm over northeastern Italy. Atmos. Res. 253, 105455. doi:10.1016/j.atmosres.2021.105455
Gregoretti, C., and Dalla Fontana, G. (2008). The triggering of debris flow due to channel-bed failure in some alpine headwater basins of the dolomites: analyses of critical runoff. Hydrol. Process. 22, 2248–2263. doi:10.1002/hyp.6821
Gregoretti, C., Degetto, M., Bernard, M., and Boreggio, M. (2018). The debris flow occurred at ru secco creek, Venetian dolomites, on 4 august 2015: analysis of the phenomenon, its characteristics and reproduction by models. Front. Earth Sci. 6. doi:10.3389/feart.2018.00080
Gregoretti, C., Degetto, M., Bernard, M., Crucil, G., Pimazzoni, A., De Vido, G., et al. (2016a). Runoff of small rocky headwater catchments: field observations and hydrological modeling. Water Resour. Res. 52, 8138–8158. doi:10.1002/2016WR018675
Gregoretti, C., Degetto, M., and Boreggio, M. (2016b). Gis-based cell model for simulating debris flow runout on a fan. J. Hydrology 534, 326–340. doi:10.1016/j.jhydrol.2015.12.054
Gregoretti, C., Stancanelli, M. L., Bernard, M., Boreggio, M., Degetto, M., and Lanzoni, S. (2019). Relevance of erosion processes when modelling in-channel gravel debris flows for efficient hazard assessment. J. Hydrology 569, 575–591. doi:10.1016/j.jhydrol.2018.10.001
Hermans, M. (2011). Parallel programming in fortran 95 using OpenMP. (Madrid: School of Aeronautical Engineering - Universidad Politecnica de Madrid, Spain).
Hsu, L., Dietrich, W. E., and Sklar, L. S. (2008). Experimental study of bedrock erosion by granular flows. J. Geophys. Res. 113. doi:10.1029/2007JF000778
Hübl, J. (2018). Conceptual framework for sediment management in torrents. Water 10. doi:10.3390/w10121718
Hungr, O., Evans, S. G., Bovis, M. J., and Hutchinson, J. N. (2001). A review of the classification of landslides of the flow type, 7, 221–238. doi:10.5194/nhess-12-3075-2012
Hussin, H. Y., Quan Luna, B., Van Westen, C. J., Christen, M., Malet, J. P., and van Asch, T. W. (2012). Parameterization of a numerical 2-D debris flow model with entrainment: a case study of the Faucon catchment, Southern French Alps. South. Fr. alps 12, 3075–3090. doi:10.5194/nhess-12-3075-2012
Johnson, P. A., McCuen, R. H., and Hromadka, T. V. (1991). Debris basin policy and design. J. Hydrology 123, 83–95. doi:10.1016/0022-1694(91)90070-x
Kean, J., Staley, R. J., Leeper, D. M., Schmidt, K. M., and Gartner, J. E. (2012). A low-cost method to measure the timing of postfire flash floods and debris flows relative to rainfall. Water Resour. Res. 48. doi:10.1029/2011WR011460
Lanzoni, S., Gregoretti, C., and Stancanelli, M. L. (2017). Coarse-grained debris flow dynamics on erodible beds. J. Geophys. Res. 122, 592–614. doi:10.1002/2016jf004046
Lien, P. H., and Tsai, F. (2003). Sediment concentration distribution of debris flow. J. Hydraulic Eng. 129, 995–1000. doi:10.1061/(asce)0733-9429(2003)129:12(995)
Marchelli, M., Leonardi, A., Pirulli, M., and Scavia, C. (2020). On the efficiency of slit-check dams in retaining granular flows. Geotechnique 70 (3), 226–227. doi:10.1680/jgeot.18.P.044
Marchi, L., Brunetti, M. T., Cavalli, M., and Crema, S. (2019). Debris-flow volumes in northeastern Italy: relationship with drainage area and size probability. Earths Surf. Process Landforms 44, 933–943. doi:10.1002/esp.4546
Mark, E. (2017). Guidance for debris-flow and debris-flood mitigation design in Canada. Canada: Queen’s University. Msc Thesis (Kingstone.
McCoy, S. W., Kean, J. W., Coe, J. A., Tucker, D. M., Staley, G. E., and Wasklewicz, W. A. (2012). Sediment entrainment by debris flows: in situ measurements from the headwaters of a steep catchment. J. Geophys. Res. 117, 157–171. doi:10.1029/2011JF002278
Medina, V., Hurlimann, M., and Bateman, A. (2008). Application of FLATModel, a 2D finite volume code, to debris flows in the northeastern part of the Iberian Peninsula. Landslide 5, 127–142. doi:10.1007/s10346-007-0102-3
Musumeci, R. E., Foti, E., Rosi, D. L., Sanfilippo, M., Stancanelli, L. M., Iuppa, C., et al. (2021). Debris-flow hazard assessment at the archaeological unesco world heritage site of villa romana del casale (sicily, italy). Int. J. Disaster Risk Reduct. 64, 102509. doi:10.1016/j.ijdrr.2021.102509
Navratil, O., Liebult, F., Bellot, H., Travaglini, E., Theule, J., Chambon, G., et al. (2013). High-frequency monitoring of debris-flow propagation along the réal torrent, southern French prealps. Geomorphology 201 (30), 157–171. doi:10.1016//j.geomorph.2013.06.017
Orlandini, S., and Rosso, R. (1996). Diffusion wave modeling of distributed catchment dynamics. J. Hydrologic Eng. 1, 103–113. doi:10.1061/(ASCE)1084-0699(1996)1:3(103)
Osti, R., and Egashira, S. (2013). “Check dams, morphological adjustments and erosion control in torrential streams,” in Check dams, morphological adjustments and erosion control in torrential streams. Editors C. M. Garcia, and M. A. Lenzi, 185–210. (Antony).
Pickands, J. (1975). Statistical inference using extreme order statistics. Ann. Statistics 3, 119–131. doi:10.1214/aos/1176343003
Piton, G., Carladous, S., Recking, A., Tacnet, J. M., Liébault, F., Kuss, D., et al. (2017). Why do we build check dams in alpine streams? an historical perspective from the French experience. Earth Surf. Process. Landforms 42, 91–108. doi:10.1002/esp.3967
Piton, G., D’Agostino, V., Horiguchi, T., and Hübl, J. (2024). “Functional design of mitigation measures: from design event definition to targeted process modifications,” in Advances in debris-flow science and practice. Editors M. Jakob, S. McDougall, and P. M. Santi (Springer Verlag), 495–538. doi:10.1007/978-3-031-48691-3
Piton, G., Fontaine, F., Bellot, H., Liébault, F., Bel, C., Recking, A., et al. (2018). Direct field observations of massive bedload and debris flow depositions in open check dams. In E3S web of conferences (EDP sciences), A. Paquier, and N. Riviere (Eds.), 40, 03003–03008. doi:10.1051/e3sconf/20184003003
Piton, G., Goodwin, S. R., Mark, E., and Strout, A. (2022). Debris flows, boulders and constrictions: a simple framework for modeling jamming, and its consequences on outflow. J. Geophys. Res. 127. doi:10.1029/2021JF006447
Piton, G., and Recking, A. (2016a). Closure to “design of sediment traps with open check dams. I: hydraulic and deposition processes” by guillaume Piton and alain recking. J. Hydraulic Eng. 142. (ASCE)(ASCE)HY.1943-7900.0001048. doi:10.1061/(asce)hy.1943-7900.0001207
Piton, G., and Recking, A. (2016b). Closure to “design of sediment traps with open check dams. I: hydraulic and deposition processes” by guillaume Piton and alain recking. J. Hydraulic Eng. 142. (ASCE)(ASCE)HY.1943-7900.0001207. doi:10.1061/(asce)hy.1943-7900.0001207
Prenner, D., Hrachowitz, M., and Kaitna, R. (2019). Trigger characteristics of torrential flows from high to low alpine regions in Austria. Sci. Total Environ. 658, 958–972. doi:10.1016/j.scitotenv.2018.12.206
Pudasaini, S. P., and Mergili, M. (2019). A multi-phase mass flow model. J. Geophys. Res. 124, 2920–2942. doi:10.1029/2019.JF.005204
Recking, A. (2010). A comparison between flume and field bedload transport data andconsequences for surface based bedload transport prediction. Water Resour. Res. 46, 1–16. doi:10.1029/2009WR008007
Reid, M. E., Coe, J. A., and Dianne, L. B. (2016). Forecasting inundation from debris flows that grow volumetrically during travel, with application to the Oregon Coast Range, USA. Geomorphology 273, 396–411. doi:10.1016//j.geomorph.2016.07.039
Remaitre, A., van Asch Heiss, T. W. J., Malet, J. P., and Maquire, O. (2008). Influence of check dams on debris flow run-out intensity. Nat. Hazards Earth Syst. Sci. 8, 1403–1416. doi:10.5194/nhess-8-1403-2008
Rengers, F. K., Kean, J. W., Reitman, N. G., Smith, J. B., Coe, J. A., and McGuire, L. A. (2020). The influence of frost weathering on debris flow sediment supply in an alpine basin. J. Geophys. Res. Earth Surf. 125. doi:10.1029/2019JF005369
Rengers, F. K., McGuire, L. A., Kean, J. W., Staley, D. M., Dobre, M., Robichaud, P. R., et al. (2021). Movement of sediment through a burned landscape: sediment volume observations and model comparisons in the san gabriel mountains, California, USA. J. Geophys. Res. Earth Surf. 126, 1–25. doi:10.1029/2020jf006053
Rosatti, G., Zugliani, D., Pirulli, M., and Martinengo, M. (2019). A new method for evaluating stony debris flow rainfall thresholds: the backward dynamical approach. Heliyon 5, e01994. doi:10.1016/j.heliyon.2019.e01994
Santi, P. M., deWolfe, V. G., Higgins, J. D., Cannon, S. H., and Gartner, G. E. (2008). Sources of debris flow material in burned areas. Geomorphology 96, 310–321. doi:10.1016//j.geomorph.2007.02.022
Simoni, A., Bernard, M., Berti, M., Boreggio, M., Lanzoni, S., Stancanelli, L., et al. (2020). Runoff-generated debris flows: observation of initiation conditions and erosion–deposition dynamics along the channel at Cancia (eastern Italian Alps). Earths Surf. Process Landforms 45, 3556–3571. doi:10.1002/esp4981
Smart, G., and Jaeggi, M. (1983). Sediment transport on steep slopes - Mitteilung der Versuch-sanstalt fur Wasserbau, Hydrologie und Glaziologie report 64. Zurich: ETH Zurich.
Stock, J. D., and Dietrich, W. E. (2006). Valley incision by debris flows: evidence of topographic signature. Geol. Soc. Am. Bull. 118, 1125–1148. doi:10.1130/B25902.1
Stoffel, M., Tiranti, D., and Huggel, C. (2014). Climate change impacts on mass movements - case studies from the european alps. Sci. Total Environ. 493, 1255–1266. doi:10.1016/j.scitotenv.2014.02.102
Strouth, A., and McDougall, S. (2021). Societal risk evaluation for landslides: historical synthesis and proposed tools. Landslides 18, 1071–1085. doi:10.1007/s10346-020-01547-8
Tacnet, M., and Degoutte, G. (2013). “Principes de conception des ouvrages de protection contre les risques torrentiels design principles of torrential hazard mitigation structures,” in Torrents et rivières de montagne — Dynamique et aménagement, 267–331. QUAE (Antony).
Theule, J., Liebult, F., Laigle, D., and Loye, A.Jaboyedoff (2015). Channel scour and fill by debris flows and bedload transport. Geomorphology 243 (0), 92–105. doi:10.1016/j.geomorph.2015.05.003
Thiene, M., Shaw, W. D., and Scarpa, R. (2017). Perceived risks of mountain landslides in Italy: stated choices for subjective risk reductions. Landslide 14, 1077–1089. doi:10.1007/s10346-016-0741-3
VanDine, D. (1996). Debris flow control structures for forest engineering (Victoria: ministry of Forests, British Columbia, VIC, Canada).
Wang, H., and Kondolf, M. (2014). Upstream sediment-control dams: five decades of experience in the rapidly eroding dahan River Basin, taiwan. J. Am. Resour. Water Assoc. 50, 735–747. doi:10.1111/jawr.12141
Xu, Q., Zhang, S., Li, W. L., and Van Asch, T. W. (2012). The 13 August 2010 catastrophic debris flows after the 2008 Wenchuan earthquake, China. china 12, 201–216. doi:10.5194/nhess-12-201-2012
Zollinger, F. (1985). “Debris detention basins in the european alps,” in International symposium on erosion, debris flow and disaster prevention.
Zubrycky, S., Mitchell, A., McDougall, S., Strouth, A., Clague, J. J., and Menounos, B. (2021). Exploring new methods to analyse spatial impact distributions on debris-flow fans using data from south-western british columbia. Earths Surf. Process Landforms 45, 2395–2413. doi:10.1002/esp5184
Nomenclature
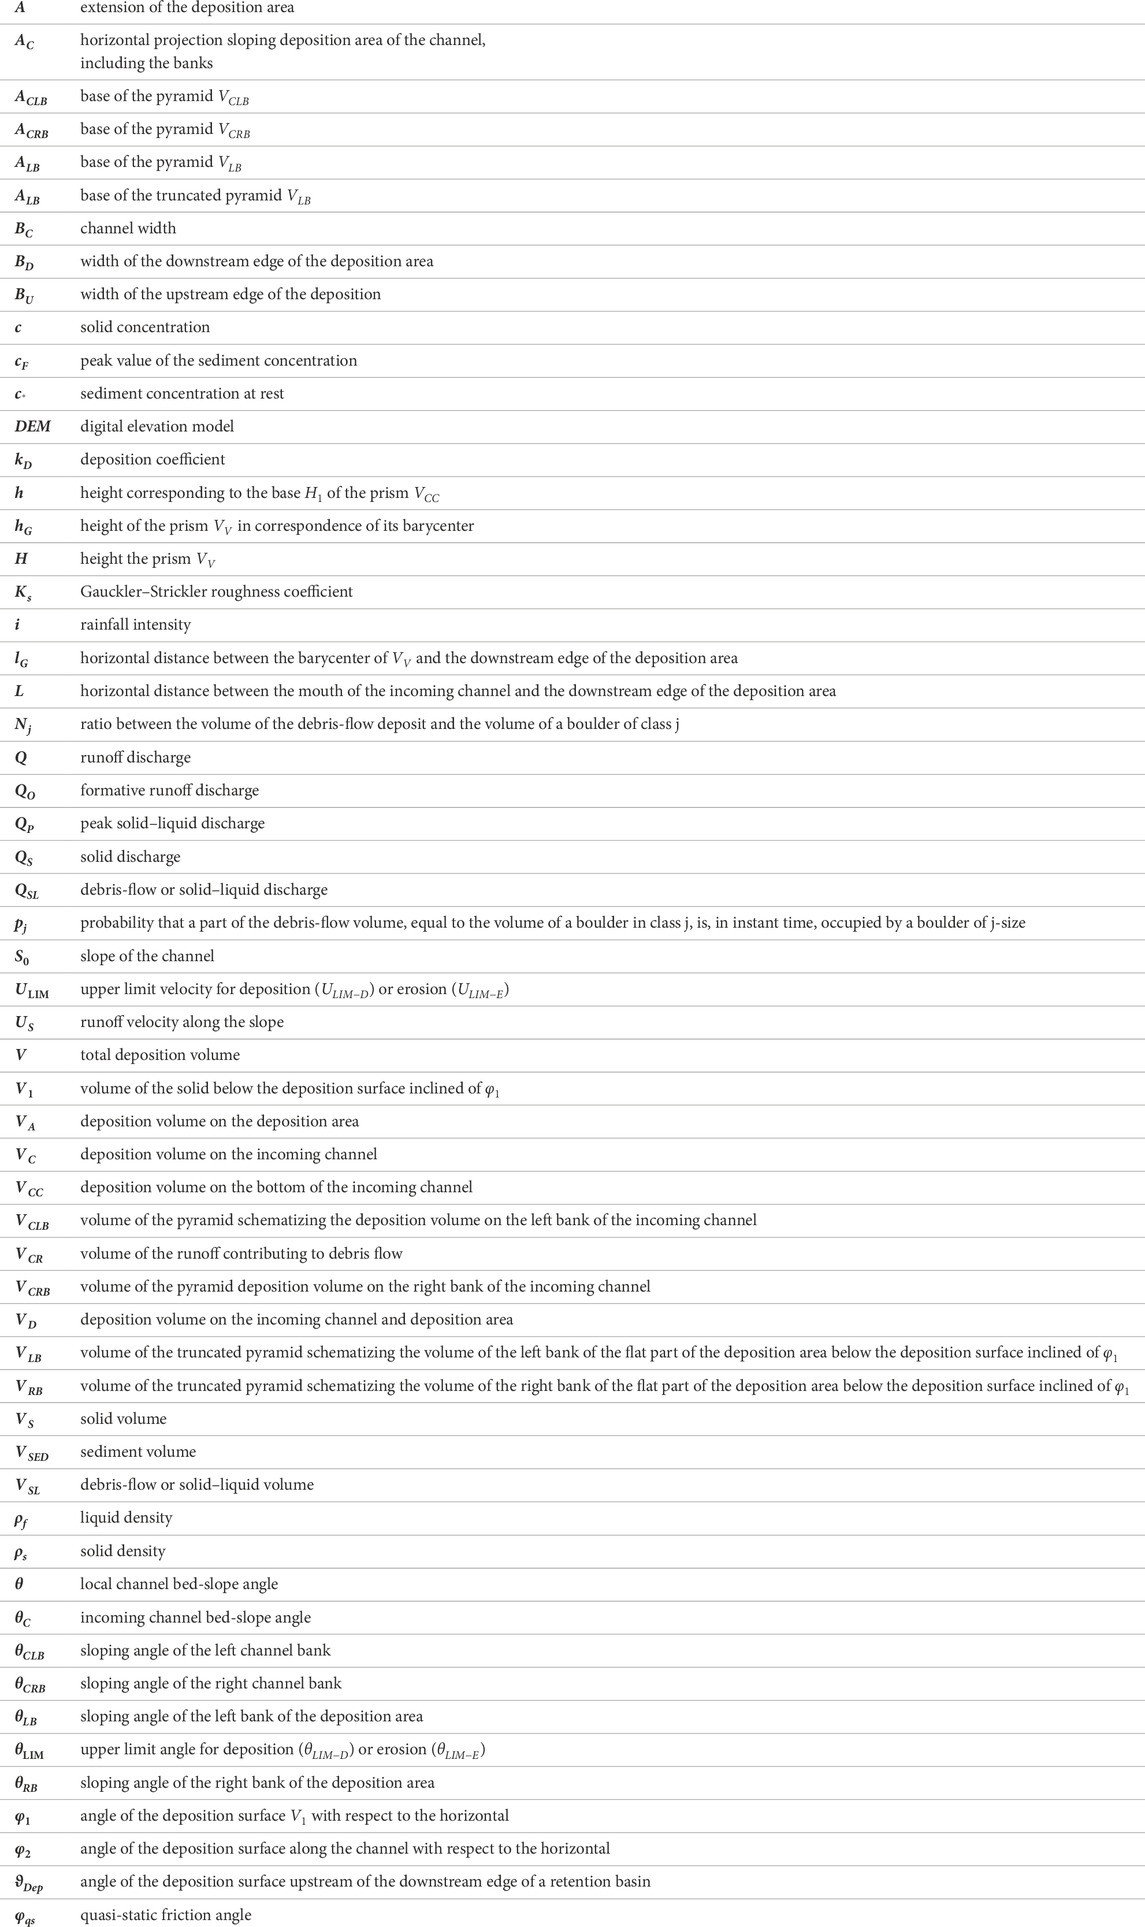
Keywords: debris flow, sediment control, retention basin, deposition area, open check dam, opening clogging, debris-flow modeling
Citation: Barbini M, Bernard M, Boreggio M, Schiavo M, D’Agostino V and Gregoretti C (2024) An alternative approach for the sediment control of in-channel stony debris flows with an application to the case study of Ru Secco Creek (Venetian Dolomites, Northeast Italy). Front. Earth Sci. 12:1340561. doi: 10.3389/feart.2024.1340561
Received: 18 November 2023; Accepted: 22 April 2024;
Published: 09 July 2024.
Edited by:
Davide Tiranti, Agenzia Regionale per la Protezione Ambientale del Piemonte (Arpa Piemonte), ItalyReviewed by:
Minu Treesa Abraham, Norwegian Geotechnical Institute (NGI), NorwayGuillaume Piton, UMR5001 Institut des Géosciences de l'Environnement (IGE), France
Copyright © 2024 Barbini, Bernard, Boreggio, Schiavo, D’Agostino and Gregoretti. This is an open-access article distributed under the terms of the Creative Commons Attribution License (CC BY). The use, distribution or reproduction in other forums is permitted, provided the original author(s) and the copyright owner(s) are credited and that the original publication in this journal is cited, in accordance with accepted academic practice. No use, distribution or reproduction is permitted which does not comply with these terms.
*Correspondence: Carlo Gregoretti, Y2FybG8uZ3JlZ29yZXR0aUB1bmlwZC5pdA==