 Valery Fridovsky
 Sergey Kryazhev2,1
 Lena Polufuntikova
 Maxim Kudrin
 Galina Anisimova
- 1Diamond and Precious Metal Geology Institute, Siberian Branch of the Russian Academy of Sciences, Yakutsk, Russia
- 2Central Research Institute of Geological Prospecting for Base and Precious Metals, Moscow, Russia
The Badran orogenic gold deposit is located in the Yana-Kolyma belt, Eastern Siberia; it has proven reserves of ∼9.3 t of gold and an average grade of 7.8 ppm. The total gold production at the Badran deposit since 1984 amounts to ∼34 t. Despite many years of study, the origin of the gold deposits of the Yana-Kolyma metallogenic belt, one of the world’s largest belts, and the Badran deposit is controversial. Synthesis of regional geology and geology of the Badran deposit, fluid inclusion analysis, mineral and (S-O) isotope chemistry defines the genetic model, origin of fluids, and source of metals in the evolution of the ore-forming system, equivalent to other orogenic gold deposits on the margin of the Siberian craton. The deposit is localized in the Upper Triassic clastic rocks and is controlled by the NW-trending thrust. Polyphase mineralization occurs as disseminated arsenian pyrite and arsenopyrite ores with invisible gold, quartz veins with native gold and Fe, Pb, Zn, Cu sulfides and sulfosalts of orogenic type, and locally post-ore Ag, Sb-bearing minerals and Hg epithermal features. The quartz veins with native gold were formed from low-medium saline (1.5–10 wt% NaCl eq.) aqueous-carbonic fluids boiling at temperatures of 290°C to 210 °C and pressures of 300–250 to 125 bar. The δ34S values of pyrite and arsenopyrite vary from −1.1‰ to +2.4‰, with an average of +0.4‰; the δ18О of quartz from +15.1‰ to +17.5‰ at constant δ18ОH2O about +7.5‰ (±1.0‰). High contents of As (up to 2.4 wt%) and Co/Ni ∼ from 0.3 to 9.9 in pyrite of proximal alteration are typical for hydrothermal systems. The results obtained confirm that the ore-forming fluids did not have a single origin, but were formed from a mixture of subcontinental lithospheric mantle and metamorphic sources. The subcrustal lithospheric mantle was fertilized in the time preceding mineralization (Late Jurassic) and was derived directly from the down-going subduction slab and overlying sediment wedge at the closure of the Oymyakon Ocean.
1 Introduction
On the regional scale, the Badran gold deposit is located in the rear of the Verkhoyansk fold-and-thrust belt southeast of the Yana-Kolyma orogenic belt (Figure 1). It belongs to the orogenic-type deposits characteristic of one of the world’s largest Late Jurassic-Early Neocomian Yana-Kolyma metallogenic belts, where the total amount of gold produced and recorded in resources is ∼8320 tons (Goryachev and Pirajno, 2014). Here, along with large orogenic gold deposits (Natalka, Degdekan, Pavlik, Drazhnoe, and others), intrusion-related Au deposits of smaller size are also known (Chepak, Teutedjak, Chistoe, Ergelyakh, and others), along with related Quaternary placers (Fridovsky, 2002; Goldfarb et al., 2014; Goryachev and Pirajno, 2014; Fridovsky, 2018; Vikent’eva et al., 2018). There are also Au-Sb, Mo-W, and Sn-W deposits in this territory (Figure 1).
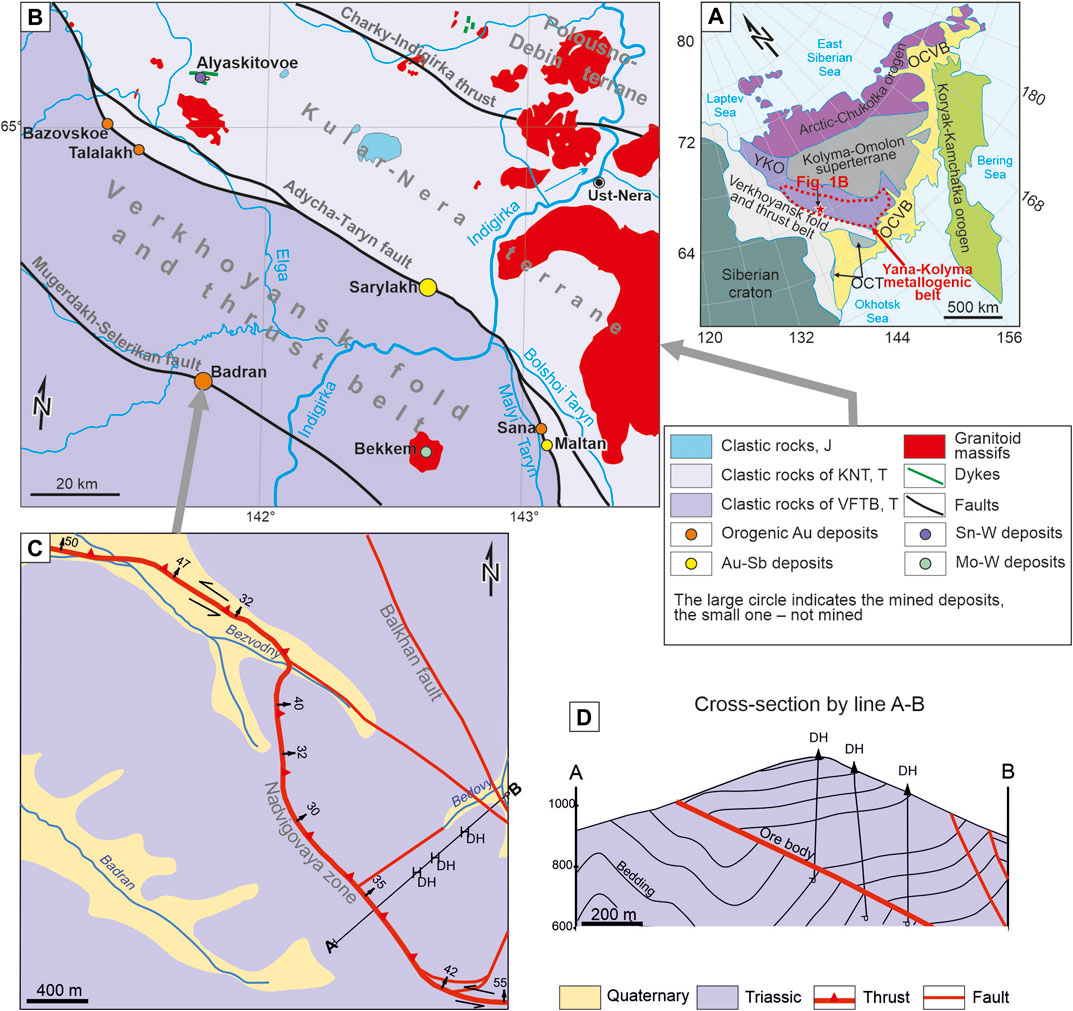
FIGURE 1. Geological maps of the Yana-Kolyma orogen belt showing: (A) Regional tectonic setting of the Yana-Kolyma orogenic belt; (B) Tectonic framework and distribution of ore deposits of the West Yana-Kolyma orogenic belt; (C) Generalized geological map of the Badran deposit; (D) Cross-section of the Badran deposit. Abbreviations in A, (B) YKO—Yana-Kolyma orogenic belt; OCVB—Okhotsk-Chukotka volcanic belt; OCT—Okhotsk craton terrane.
The Badran deposit was discovered in 1961, explored in 1970–1980, and in 1956–1976 by trenching and drilling, and underground mining. In 1984 underground Au mining began at the field, which continues to the present day. The total volume of gold production is about 34 tons. The gold reserves of the deposit are estimated at ∼ 9.3 t with an average content of 7.8 ppm. The deposit has been explored by surface and underground workings at a distance of more than 5 km; a downdip of more than 1.2 km makes it possible to study the structure of the deposit, the mineral composition of ores and the conditions of ore formation at various deep levels. The results of studying various aspects of geology, mineralogy, and conditions of ore formation of the Badran deposit are considered in a number of scientific papers (Anisimova et al., 1998; Fridovsky, 1999; Fridovsky, 2002; Fridovsky, 2018; Neustroev, 2003; Amuzinsky, 2005; Anisimova et al., 2008; Konstantinov, 2010; Obolensky et al., 2011).
Despite many years of study, the origin of the gold deposits of the Yana-Kolyma metallogenic belt and the Badran deposit is controversial. Based on the example of a large Natalka deposit, water entry from a magmatic source is proven (Goryachev et al., 2008). Gamyanin et al. (2018) explain the formation of the OGD region by the involvement of metamorphic fluids. A study by Obolensky et al. (2011) suggested that the Badran deposit was formed during the evolution of a metamorphic hydrothermal system with an important contribution to mantle fluids. For this reason, the main purpose of this study was to obtain new information for a better understanding of the Badran deposit genesis.
In this paper, based on detailed fieldwork in underground mine workings, we present a brief summary of data on the geology of the deposit and new results of studying the material composition of disseminated and vein mineralization, geochemical, stable S and O isotopes, and the fluid inclusion microthermometry data for understanding ore-forming events and reinterpretation of the source of gold and the hydrothermal fluid-flow processes that formed orogenic Au Badran deposit in the context of the evolution of the surrounding accretion-collision structures of the Verkhoyansk-Kolyma orogen.
2 Regional tectonic and metallogenic setting
The Badran Au deposit is located in the rear of the Verkhoyansk fold-and-thrust belt to the southeast of the Yana-Kolyma orogen (Figure 1А). The Verkhoyansk fold-and-thrust belt lies on the Archean-Proterozoic basement and is composed of the Mesoproterozoic–Devonian carbonate-clastic and carbonate rocks and the Carboniferous–Middle Jurassic clastic rocks of the passive continental margin of the Siberian сraton. The Verkhoyansk fold-and-thrust belt is separated from the Yana-Kolyma orogen by the regional Adycha-Taryn fault with an NW orientation and a length of about 2.000 km. The Yana-Kolyma orogen includes the Late Jurassic terranes of various origins (Khanchuk, 2006) (Figure 1А). Deformation processes and magmatism in the orogen in the Late Jurassic–Valanginian is related to the closure of the small Oymyakon paleoocean and the subsequent collision of the Kolyma-Omolon superterrane and the eastern margin of the Siberian craton (Parfenov and Kuzmin, 2001; Goryachev and Pirajno, 2014).
The Yana-Kolyma metallogenic belt (YKMB) is identified mainly in the structures of the Kular-Nera and Polousno-Debin terranes of the Yana-Kolyma orogen and the rear zone of the Verkhoyansk fold-and-thrust belt. The belt stretches in the NW direction for more than 1.000 km with a width of up to 200 km to the SW from the Main Kolyma batholith belt (154–144 Ma, zircon, U-Pb SHRIMP-RG (Akinin et al., 2009), SHRIMP-II (Gertseva et al., 2021)), and Uyandina-Yasachnaya volcanic arc (152–153 Ma, zircon, U-Pb SHRIMP (Toro et al., 2016). Metallogenic specialization of the Badran deposit area is determined by gold (Badran, Drazhnoye, Malo-Tarynskoe, Basovskoe, Talalakh, etc.) and Au-Sb (Sarylakh, Maltan, Kim, Vzbros-2, etc.) deposits and less than W-Sn (Alyaskitovoe), Mo-W (Bekkem) deposits. Quite often, the orogenic gold deposits of the region show the overlap of late Au-Sb and Ag-Sb mineralization associated with the development of the Cretaceous Paleo-Pacific active continental margin.
The main structures of the Badran deposit area are determined by systems of extended NW thrusts and linear folds. They are separated by vast fields with gentle and near horizontal occurrence of rocks. Transverse NE and NS faults (oblique ramps), mainly of strike-slip and normal-strike-slip fault kinematics, dividing the thrusts into separate segments, are also identified. Thrusts are the main ore-controlling structures. The longest (about 20 km) is the Badran-Egelyakh thrust of the Mugurdakh-Selerikan fault system. The faults are expressed by thick (up to the first tens of meters) zones of brecciation of clastic rocks and are accompanied by folds with horizontal and inclined (up to vertical) hinges. Differently directed movements are identified along the faults—early thrust and late sinistral- and dextral-strike-slip faults, studied in detail at the gold deposits of the Kular-Nera terrane (Fridovsky et al., 2014; Fridovsky et al., 2015; Fridovsky et al., 2017; Fridovsky, 2018).
Magmatic formations do not occur at the Badran deposit. To the northeast of the deposit, there are the Late Jurassic intrusive rocks and volcanic rocks of the intermediate and felsic composition of the Tas-Kystabyt belt (151–148 Ma, zircon, U-Pb SHRIMP-II (Prokopiev et al., 2018; Gertseva et al., 2021) and the Late Cretaceous granitoids of the Yus-Kuel complex (92–88 Ma, zircon, U-Pb SHRIMP-II (Protopopov et al., 2019)). Orogenic Au mineralization often involves the Late Jurassic-Early Cretaceous granitoids of small massifs and dikes from the mafic to the felsic composition of the complex of small intrusions (151–143 Ma, zircon, U-Pb SHRIMP II (Fridovsky et al., 2020a; Fridovsky et al., 2020b; Fridovsky et al., 2022)). These rocks were formed from a mixed source with the involvement of the mantle (OIB- and E-MORB type), lower-crust and subduction components with the Mesoproterozoic-Paleoproterozoic Sm-Nd model estimates of the age of their magmatic sources (Fridovsky et al., 2020a; Fridovsky et al., 2020b; Fridovsky et al., 2022).
There is usually no spatial connection between gold deposits and magmatism and metamorphism. The deposits were formed after basic and granitoid magmatism (about 150 million years), superimposed on regional metamorphic changes in clastic rocks of the greenschist facies. The metallogenic time of formation of the gold mineralization is synchronous to the late collisional event of the end of the Tithonian-Valanginian during crustal thickening before the orogen collapse. Such conditions are characteristic of orogenic gold mineralization events in accretion-collision orogens (Goldfarb and Groves, 2015; Yang et al., 2021).
Dating of micas (40Ar/39Ar) and native gold (Re-Os) from ore veins of orogenic gold deposits in the western part of the YKMB demonstrate a wide range of tectonothermal events that occurred from 148 to 126 million years (Fridovsky et al., 2015; Fridovsky et al., 2021; Fridovsky et al., 2022; Prokopiev et al., 2018). These events correlate with various tectonic processes on the eastern periphery of the Siberian craton in the Late Jurassic-Early Cretaceous. Isotopic Re-Os estimates of the age of gold (148 and 137 million years) (Fridovsky et al., 2021) coincide with the time of formation of dikes (151–145 million years) and cooling of granitoids of the small intrusions complex (138–137 million years) (Fridovsky et al., 2022) and reflect two stages of the formation of orogenic gold mineralization of the western part of the YKMB in connection with accretion-collision events on the eastern margin of the Siberian craton. According to the new 40Ar/39Ar geochronological data, for sericite from alterations, as well as feldspars and plagioclase from dikes of gold ore and gold-antimony deposits of this belt, the interval of 132–123 million years reflects the young tectonothermal processes of the final stage of the formation of gold mineralization (Fridovsky et al., 2022). These data are fit to the available age estimates for sericites from veins [126–127 Ma, 40Ar/39Ar (Fridovsky and Zaitsev, 2018; Prokopiev et al., 2018)] and granitoids [120–128 Ma, Rb-Sr and K-Ar (Zaitsev et al., 2018)] of various ore objects of the western part of the Yana-Kolyma metallogenic belt. The Hauterivian-Aptian event was probably a reflection of superimposed tectonic thermal processes occurring in the rear of the Uda-Murgal volcanic-plutonic belt. Thus, the features of the structure and metallogeny of the area of the Badran and YKMB deposits are associated with a complex interaction in the Late Jurassic to Early Cretaceous of subsynchronous geodynamic events on the eastern margin of the Siberian craton (subduction of the Oymyakon Ocean plate, accretion and collision of the Kolyma-Omolon superterrane) and Northern Asia (subduction of the Paleo-Pacific plate accretion (Parfenov and Kuzmin, 2001).
3 Deposit geology
The Badran deposit is confined to the Nadvigovaya zone, the most ore-bearing section of the Badran-Egelyakh fault. The thickness of the thrust zone is up to 30 m. The displacement amplitude is estimated from 600 to 1,300 m (Anisimova et al., 1998; Neustroev, 2003). Several segments of the zone of different occurrence have been identified (Figure 1С). The north-western segment (survey profiles 0–250) occurs in the valley of the Bezvodny Creek. The Nadvigovaya zone here dips to C (5–20) at an angle of 30–50. The central segment (survey profiles 250–420) is the most ore-bearing, the zone dips gently to the NE (40–65), and the angle of dip is 24–30. The occurrence of the southeastern segment (east of the 420-survey profile) is similar to the NW segment—dipping to N (355–20), and the angle of dip is 30–50. Analysis of fractured structures and reconstruction of local tectonic stress fields showed changes in their orientation and kinematics in various segments of the Nadvigovaya zone (Fridovsky, 1999). There are thrust displacements for the central segment: NE-SW orientation of the compression axis and a near-vertical or steeply inclined (65–70) plunge of the extensional axis to the NE or SW. The NW and SE segments are characterized by strike-slip reverse fault movements similar to the central segment by the position of the compression axis, a gently inclined (20–28) plunge of the extensional axis.
The Nadvigovaya zone is composed of breccias of host rocks with vein-veinlet and disseminated gold-bearing pyrite-arsenopyrite mineralization (Figure 2). The folded structures of the deposit area are represented by the Mugurdakh syncline, Talnakh, and Selerikan anticlines of the NW strike, extending up to 120–200 km (Neustroev, 2003). The southwestern wing of the Talnakh anticline is thrust over the Badran-Egelyakh fault onto the structures of the Mugurdakh syncline. The latter has an asymmetric structure, the southwest wing is characterized by gentle (20–25) rock dips, and the northeast—moderately steep (30–45) ones. In the zone of the Badran-Egelyakh thrust, the near-fault compressed folds of the NW and NE strikes are developed (Fridovsky, 2018). Here, the angle of dip of the rocks on the wings of the folds increases to 80°, and overturned occurrences are manifested.
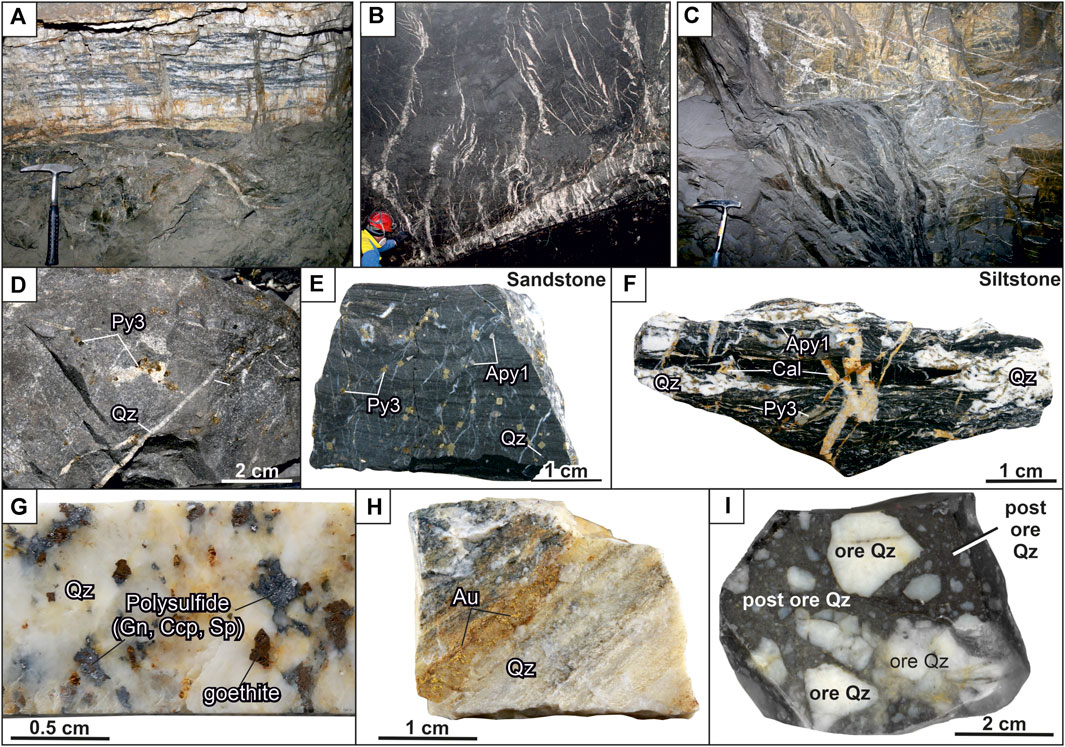
FIGURE 2. Photographs of mineralization at the Badran deposit: (A) quartz vein of banded structure with polymetal-carbonate-albite-quartz mineralization and predominantly native gold; (B, C) veinlets of quartz; (D) veinlets of quartz and pyrite3; (E) disseminated pyrite3 and arsenopyrite1 with “invisible” gold; (F) pyrite3, arsenopyrite1, and quartz-carbonate veinlets; (G) galena-chalcopyrite-sphalerite-goethite aggregate in quartz; (H) native gold in quartz; (I) breccia of ore white quartz in post-mineral dark gray quartz. Abbreviation (Warr, 2021): Qz = Quartz, Cal = Calcite, Apy = Arsenopyrite, Py = Pyrite, Gn = Galena, Sp = Sphalerite, Ccp = Chalcopyrite, Au = Native Gold.
The host rocks are the Norian clastic deposits (sandstones, silty sandstones, and siltstones) of the Upper Triassic with a total thickness of more than 3.800 m. Vein-veinlet mineralization is most intensively developed in sandstone beds, and their contacts with siltstones determine the position and morphology of sheet ore bodies. Ore-bearing rocks are metamorphosed to the level of carbonate-sericite-chlorite and chlorite-carbonate subfacies of the greenschist facies. Proximal alterations of sericite-chlorite-carbonate-quartz composition with highly gold-bearing disseminated pyrite and arsenopyrite are widely manifested in clastic rocks.
Three main morphological types of ore bodies are identified at the deposit: vein, vein-veinlet, and vein-disseminated (Figure 2). Quartz veins of a tabular shape are the leading type of ore bodies (Figure 2A). Their thickness is up to several meters, strike extent is tens of meters, and dip extent—hundreds of meters. Veins usually lie in the axial part of the Nadvigovaya zone, less often in its footwall or hanging contacts. In the upswells of the Nadvigovaya zone, branching and several parallel veins are observed. In the outcrops of veins and their flanks, the number of quartz veinlets increases (vein-veinlet type), and massive and coarse-banded structures of veins are replaced by veinlet and breccia ores (Figure 2B, C). The veinlet-disseminated type is represented by breccias and alterations with veinlet silification (from 5% to 40%) and impregnations of pyrite and arsenopyrite (Figures 2D–F). The content of “invisible” gold in pyrite and arsenopyrite is up to the first hundred grams per ton. In quartz veins and veinlets, gold is free, its content ranges from the firsts to hundreds of ppm and is associated with galena, sphalerite, and chalcopyrite (Figures 2G, H).
4 Mineralogy and paragenetic sequence
The ores of the Badran deposit are characterized by an exceptionally diverse mineral composition (Anisimova et al., 2008). About 50 hypogene and hypergene minerals are described here. Eight different stages of mineral formation were macroscopically and microscopic studies described in the Badran gold deposit, as illustrated in Figure 3. There are four ore and four post-ore stages of mineral formation.
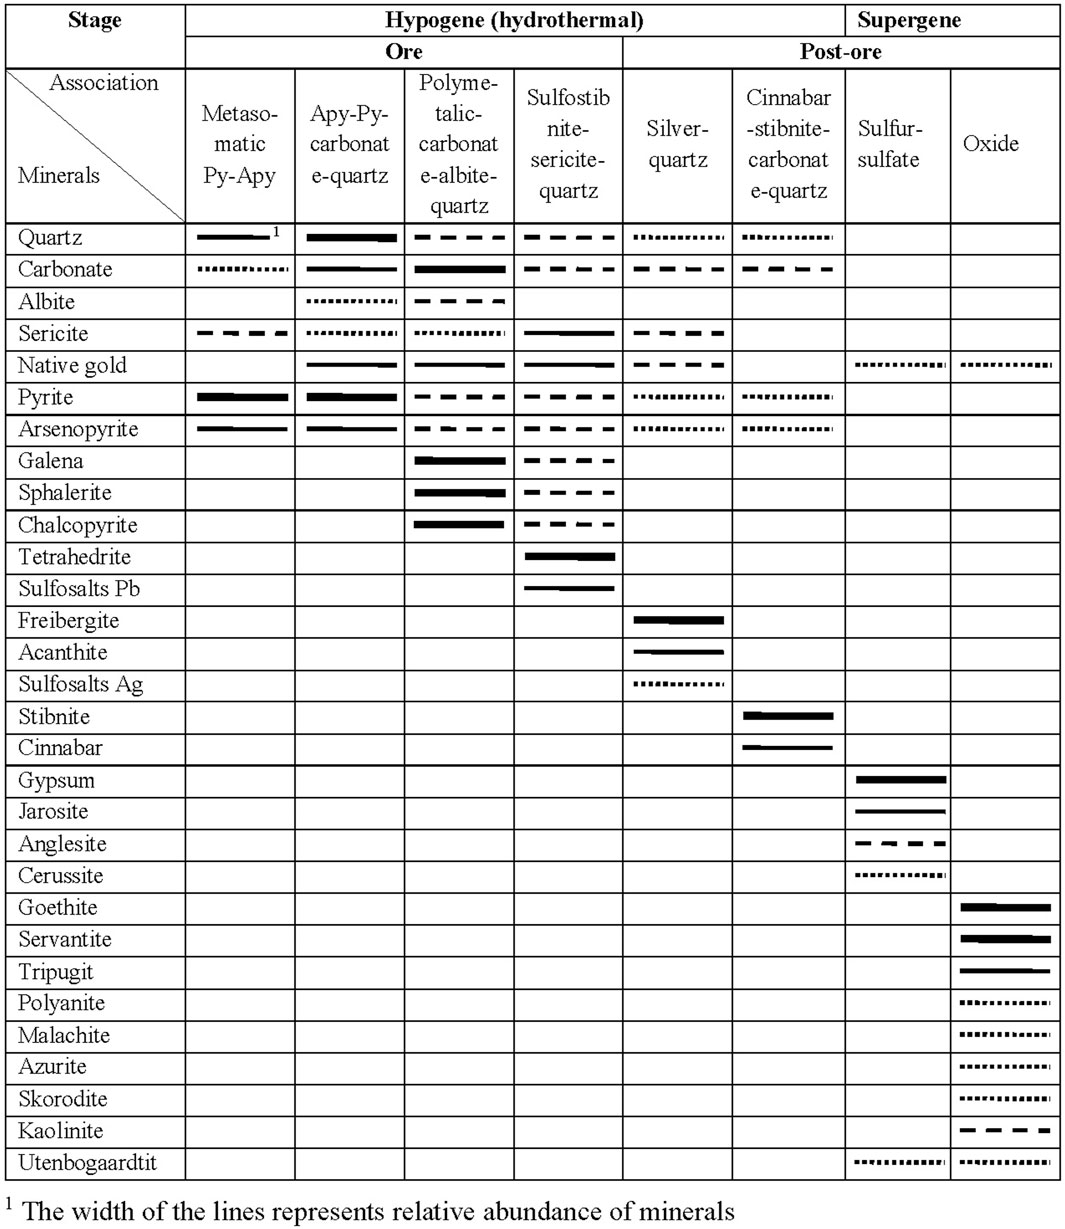
FIGURE 3. The paragenetic sequence of ore minerals and some gangue minerals in the Badran gold deposit.
Metasomatic pyrite-arsenopyrite association in proximal sericite-chlorite-carbonate-quartz alterations is widespread. The typomorphic minerals of the association are gold-bearing pyrite3 (Au up to 120 ppm) and arsenopyrite1 (Au up to 205 ppm), which form dispersed dissemination of metacrystals in ore zones and in host rocks (Figures 2D–F; Figures 4C, D). This gold1 is in an “invisible” form (Fridovsky et al., 2022). Arsenopyrite1 is found everywhere, but less often than pyrite3. Arsenopyrite1 forms dispersed dissemination of idiomorphic prismatic crystals in quartz-bearing siltstones (Figures 2E, F). Radial growths of small crystals of arsenopyrite are characteristic. Often crystals are cataclastic (Figure 4D). Quartz1, carbonate, and sericite are associated with pyrite3 and arsenopyrite1 (Figures 2D–F). Pyrite1 and Pyrite2 are also found in altered rocks. Pyrite1 is represented by dust-like and fine-grained spherical (framboidal) particles and nodular aggregates ranging in size from 10 to 100 microns (Figures 4A, B). The location of Py1 follows the primary sedimentary texture of rocks. Metamorphic pyrite2 represented by crystals with subhedral and euhedral shapes, ranging in size from 2 to 3 microns to 2–4 mm, which form dissemination intergrowths, nests, and thin veinlets (Figures 4A, B) (Fridovsky et al., 2022).
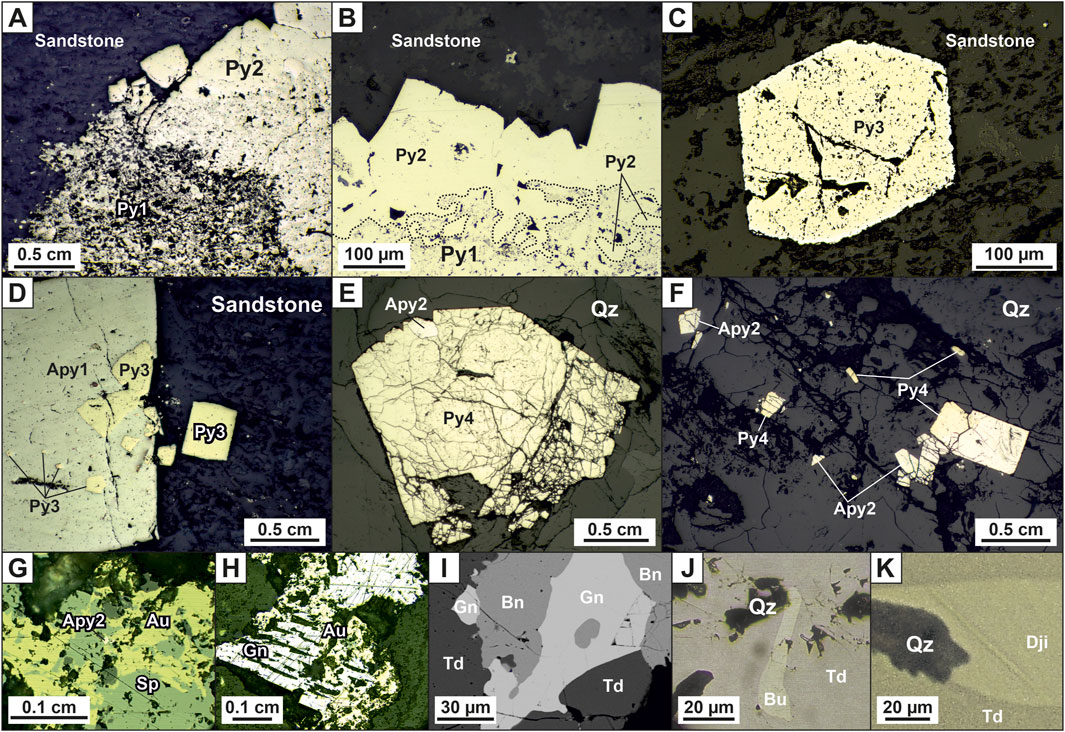
FIGURE 4. Photomicrographs reflected light (A–H) and photomicrographs backscattered electron images (I–K) disseminated and vein ores at the Badran deposit: (A, B) pyrite1 and pyrite2 intergrowths in sandstone; (C) pentagonal dodecahedral crystal of pyrite3 from proximal alteration; (D) pyrite3 intergrowths in arsenopyrite1, and separate pyrite3 crystals in sandstone; (E) crushed pyrite4 crystal with arsenopyrite2 in quartz; intergrowths and separate crystals of arsenopyrite2 and pyrite4 in quartz; (G) native gold in association with sphalerite and arsenopyrite2; (H) gold with galena; (I) overgrowth of galena with bournonite and tetrahedrite; (I) inclusion of boulangerite in a tetrahedrite; (J) bournonite in tetrahedrite; (K) diamond-shaped jamesonite in tetrahedrite. Abbreviation (Warr, 2021): Qz = Quartz, Cal = Calcite, Apy = Arsenopyrite, Py = Pyrite, Gn = Galena, Sp = Sphalerite, Ccp = Chalcopyrite, Au = Native Gold, Bu = Bournonite, Td = Tetrahedrite, Bu = Boulangerite, Dji = Jamesonite.
Arsenopyrite-pyrite-carbonate-quartz vein association is the most common in ore bodies. Native gold of this association is usually represented by finely dispersed idiomorphic crystals and lumpy varieties of gold (Figure 2H). Quartz2 of the main producing association has an inequigranular and hypidiomorphic structure. Color is milky-white, grayish-white, and, rarely, white. In the selvages of veins and veinlets, as well as near the xenoliths of the host rocks, this quartz often has a crustified texture, and in the central part, a massive and knotted texture. The structure of the aggregate is hypidiomorphic-granular. Vein pyrite4 has, basically, an irregular shape (Figures 4E, F). It is characterized by a high gold content, sometimes reaching hundreds of ppm, but on average tens of ppm, the silver content of pyrite is next lower order. A typomorphic feature of pyrite4 is its increased arsenic content. Arsenopyrite2 is developed in quartz veins and is often found with Py4 (Figures 4E, F). Apy2 is surrounded by late minerals—chalcopyrite and fahlore often associate native gold with arsenopyrite (Figure 4G). The composition of arsenopyrite2 is characterized by high sulfur content and low arsenic content. The mineral is characterized by high gold content, reaching hundreds of ppm. Native gold2 is common in minerals of the early arsenopyrite-pyrite-carbonate-quartz association of vein filling (Figures 5A, B). A significant part of it is also in a finely dispersed form.
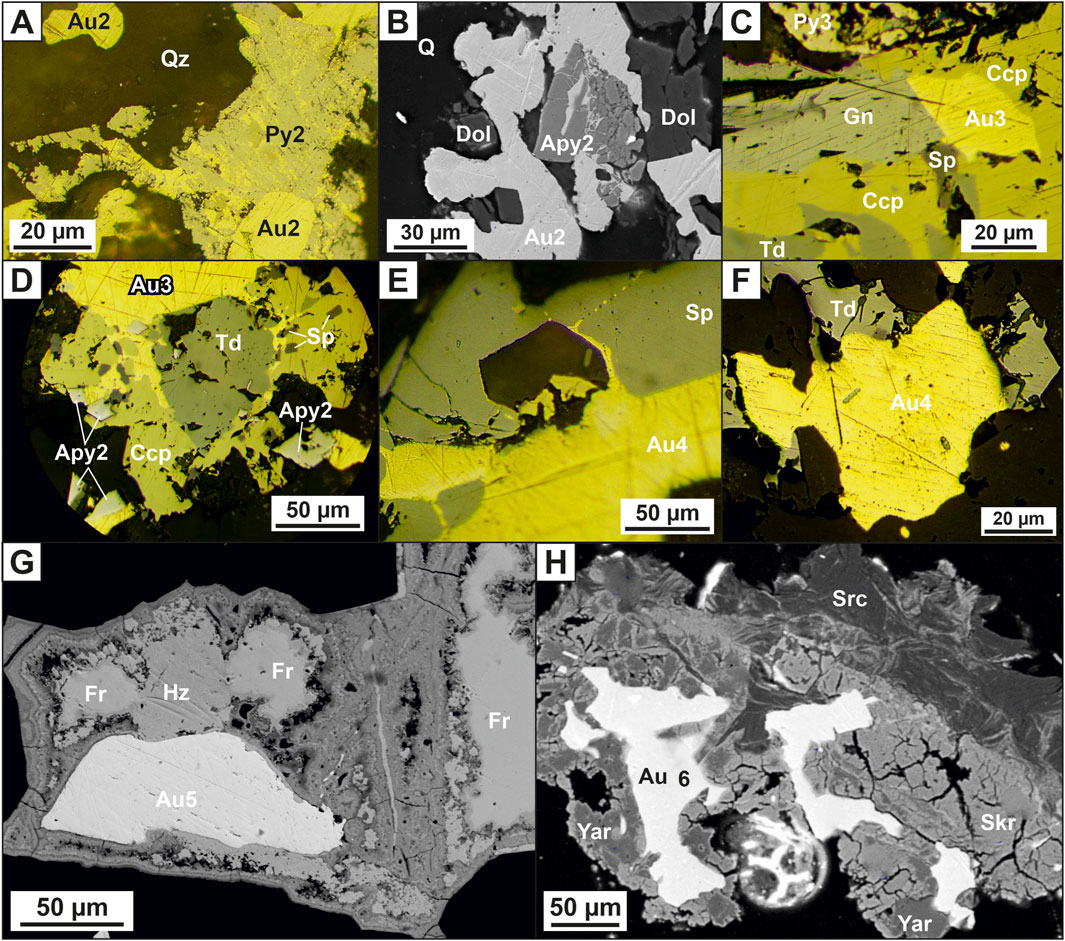
FIGURE 5. Photomicrographs reflected light (A, C–F) and photomicrographs backscattered electron images (B, G–H) of native gold at the Badran deposit: (A) gold2 in pyrite4; (B) gold2 in arsenopyrite2; (C–D) the relationship of gold3 with chalcopyrite, galena, sphalerite, tetrahedrite and arsenopyrite2; (E–F) gold4 with sphalerite and tetrahedrite; (G) low-grade gold5 in association with freibergite, chalcosine; (H) gold6 in hypergenic minerals: jarosite, scorodite in association with sericite. Abbreviation (Warr, 2021): Apy = Arsenopyrite, Py = Pyrite, Gn = Galena, Sp = Sphalerite, Ccp = Chalcopyrite, Au = Native Gold, Td = Tetrahedrite, Fr = Freibergite, Hz = Chalcosine, Yar = Jarosite, Scr = Scorodite, Src= Sericite.
Polymetal-carbonate-albite-quartz mineral association is mainly distributed on the flanks of the upper horizons of the Nadvigovaya zone. At deep horizons, it is found in the central part of ore columns. Quartz3 of a sugar-like habit composes separate veins and veinlets. The proportion of this quartz in the vein filling ranges from 15% to 30%. Typomorphic minerals are chalcopyrite, galena, sphalerite, gold, dolomite, and albite (Figure 2G; Figure 4H). Galena is a minor mineral. The frequency of its occurrence increases with depth. It is associated with sphalerite, chalcopyrite, bournonite, fahlore, and native gold (Figures 4G, H; Figure 5C). Galena in the deposit contains bismuth and silver in the form of an impurity, the concentration of which disappears with depth. Sphalerite occurs in quartz in the form of irregularly shaped particles and scattered single crystals of yellowish-brown color, which is explained by low ferruginousity. It is associated with galena, chalcopyrite, bournonite, fahlore, and native gold (Figures 4G, 5C–E). Chalcopyrite is observed in quartz in the form of small irregularly shaped particles and emulsion dissemination of chalcopyrite in sphalerite and fahlore. The frequency of occurrence of chalcopyrite in association with native gold increases with depth (Figures 5C, D). Gold3 (fineness from 800‰ to 899‰) is associated with the main minerals, chalcopyrite and galena. In this case, chalcopyrite always acts as the host mineral, and galena forms close growths with gold (Figures 5C, D).
Sulfostibnite-sericite is a quartz mineral association with an admixture of rare sulfostibnites, characterized by an increase in the potential of antimony and sulfur. It occurs in the central most ore-bearing interval of the Nadvigovaya zone. Quartz4 is an ore-free milky white that mainly associates with carbonate and chlorite. On the contacts of the veins, such quartz usually has a comb structure. Tetrahedrite, gold, and sericite are typomorphic minerals. Tetrahedrite forms xenomorphic inclusions, veinlets, and granular aggregates in quartz in associations with native gold, bournonite, galena, and chalcopyrite (Figures 4I–K; Figure 5F). The silver content in tetrahedrite varies widely from 0% to 9.72%. Tetrahedrite, as a rule, is oxidized with the formation of thin rims, falsers of malachite, azurite, chalcosine, and covellite. The native gold (Au4) of this association is the most high-grade (900‰–998‰), it is predominantly interstitial, lenticular, wedge-shaped, ribbon-shaped, and lump-shaped (Figures 5E, F). The mineral associations described above are the most economically important. They formed the ore columns of the Badran deposit. The formation of pyrite five to six completes orogenic ore formation at the deposit. Pyrite five to six forms a rare euhedral and subhedral dissemination and is related to polymetallic-carbonate-albite-quartz and sulfostibnite-sericite-quartz mineral associations, respectively.
Silver-quartz and cinnabar-stibnite-carbonate-quartz mineral associations are widespread locally. Freibergite, acanthite, argentotetrahedrite, and low-grade mercury gold (400‰–700‰) are the typomorphic minerals of the silver-quartz association. The dark gray—black quartz5-6 of this association cements fragments of early white quartz (Figure 2I). The fahlore of the Badran deposit have an abnormally high silver content (>30%). It does not form large accumulations and occurs in growth with argentite, electrum, native gold, freibergite, and tetrahedrite. Sporadic veinlets of a typomorphic mineral of another association, stibnite with idiomorphic water-transparent quartz and dolomite nests, occupy a crosscutting position in relation to early paragenesis. Signs of cinnabar are found on the near-surface horizons of the deposit. Freibergite (Ag—10%–29%) occurs at the upper horizons, it forms close growths with tetrahedrite. Acanthite and low-grade native gold are often associated with it. Acanthite forms granular aggregates and sometimes myrmekitic growths with freibergite. In association with acanthite, bournonite and low-grade native gold (Au5) are also found in the ore (Figure 5G). Acanthite contains impurities of Fe, Sb, and Cu. It is likely that such a set of elements can be explained by the close association of acanthite with fahlore. Native gold has not been identified in this association. Pyrite 7–8 forms cogenetic growths with the minerals of silver-quartz and cinnabar-stibnite-carbonate-quartz associations.
In the process of hypergenesis, there was a change in ores and the formation of two mineral associations of sulfur-sulfate and oxide compositions. The typomorphic minerals of the first association are gypsum, jarosite, anglesite, covellite, and chalcosine; those of the secondare goethite, hydrogoethite, malachite, azurite, cervantite, tripuhyite, polianite, and uytenbogaardtite. They develop when pyrite, arsenopyrite, chalcopyrite, iron-magnesian dolomite, and mica minerals are replaced. At deep horizons, gypsum and iron hydroxides and oxides are noted in hypergenic minerals. Gold and silver sulfides in the ores of the Badran deposit were found at the horizon of 940–960 m of ore column I in association with high-silver fahlore, acanthite, pyrargyrite, bournonite, galena, various mercurous native gold, anglesite and close growth with hypergene minerals. Considering chemical composition, the analyzed compounds cover the entire interval between AgAuS and Ag3AuS2, but differences predominate, tending to the silver analog uytenbogaardtite. Au and Ag sulfides of the Badran deposit, in our opinion, were formed due to native gold and hypergene changes in high-silver fahlores, as evidenced by the ubiquitous joint presence of uytenbogaardtite with oxides of Sb and Fe with the admixture of Ag, Cu, and As. Native gold of the sixth generation (Au6) occurs with minerals of the hypergene stage, mainly with iron hydroxides, scorodite, and jarosite, and sometimes has a spongy habit (Figure 5H). This gold often forms thread-like veinlets in iron hydroxides with arsenopyrite relics.
5 Samples and analytical methods
5.1 Sample preparation
More than 200 ore samples were selected from the rich areas of the ore bodies of the Badran deposit to study the mineral composition аnd stable isotope analysis and fluid inclusion. All monofractions of minerals were hand-picked with a binocular microscope. The samples were crushed to 16–60 mesh size to ensure purity of >98%. Sixteen ore samples were subjected to S isotope analysis from a micro-weighted portion, and twenty by the in situ method. Isotopic analysis of O quartz was performed in twelve ore samples. The study of the thermometry of fluid inclusions in quartz was performed in doubly polished sections (0.3–0.5 mm thick). Fluid inclusions were studied in twenty-two ore samples, selected at various depth levels from underground mine workings of the Badran deposit. Only in eight polished sections were inclusions with sufficient dimensions found.
5.2 Scanning electron microscope and electron probe microanalysis
The analyses of minerals were performed at the Diamond and Precious Metal Geology Institute, Siberian Branch, Russian Academy of Sciences (RAS), Yakutsk, Russia following the procedure of Kudrin et al. (2021). The qualitative chemical and mineral compositions of the samples were studied with the use of a JEOL JSM-6480LV scanning electron microscope (SEM) equipped with an Energy 350 Oxford energy dispersive spectrometer (acceleration voltage was 20 kV, current through the sample was 1 nA, beam diameter was 1 µm). The major element compositions of minerals were determined by standard X-ray spectral analysis on a Camebax-Micro electron probe microanalyzer (EPMA). The analytical conditions were as follows: accelerating voltage of 20 kV; beam current of 25 nA; measurement time of 10 s; K series for Fe, Co, Ni, Cu, and S; M series for Au and Pb; L series for As and Sb.; and wavelength-dispersive spectrometer (WDS) with LiF, PET, and TAP crystals. The standards used were: FeS2 for Fe and S, FeAsS for As, Fe-Ni-Co alloy for Co, Ni, Au-Ag alloy of fineness for Au and Ag, CuSbS2 for Sb, and PbS for Pb. The detection limit was 0.01%. In each grain, three measurements were made: rim, mantle, and core zone.
5.3 S–O isotope analysis
Isotopic analysis of δ34S in sulfides (58 samples) and δ18O in quartz (12 samples) was performed in the Laboratory of Stable Isotopes of the Far Eastern Geological Institute, Far Eastern Branch of the Russian Academy of Sciences (RAS), Vladivostok, Russia.
5.3.1 Sulfur Isotope Analysis
The Femtosecond laser-ablation fluorination method described in detail by (Ignatiev et al., 2018; Velivetskaya et al., 2019) was applied for in situ measurements of δ34S values in sulfide minerals. Briefly, an ultraviolet femtosecond laser ablation system (NWR Femtosecond UC with laser Pharos 2mJ-200-PP, supplied by Electro Scientific Industries New Wave Research Division, Portland, OR, USA) was used to produce a laser crater of approximately 80 μm diameter and 40 μm depth in pyrite. Laser-generated aerosol sulfide particles were converted to SF6 via reaction with BrF5 at 350°C. The SF6 was purified by means of a cryogenic trap system (Velivetskaya et al., 2019) and introduced into the ion source of a Thermo Scientific MAT 253 isotope ratio mass spectrometer using a gas injection interface developed and described by (Ignatiev et al., 2018). Sulfur isotope ratios were measured by monitoring the SF5+ ion currents at mass-to-charge ratios of m/z 127 (32SF5+) and 129 (34SF5+). All sulfur isotope data are presented as conventional notation δ34S and reported relative to Vienna Cañon Diablo Troilite (V-CDT). Three International Atomic Energy Agency standards IAEA S1, S2, and S3 (Ag2S powder) were used to calibrate the SF6 reference gas and in-house standard (pyrite). Analytical precision of ±0.2‰ (1σ) for δ34S values was estimated from the long-term (approximately 1-year-long period) reproducibility of in-house standard (Velivetskaya et al., 2019). It should be noted that the method does not require the use of any correction factors for the effect of a laser-induced isotope fractionation due to the use of a femtosecond laser, which eliminates the effect of heating of crater walls and dramatically reduces the dependence of isotope fractionation on the matrix (Fu et al., 2017), observed in the nanosecond laser ablation.
5.3.2 Oxygen isotope analysis
A laser fluorination system modified from Sharp (1990) directly coupled to a Thermo Scientific MAT 253 isotope ratio mass spectrometer was used. Approximately 1 mg of the sample was heated by a CО2 laser (MIR-30, New Wave Research, United States) in the presence of BrF5. The O2 gas liberated from the sample was purified by passing through a series of liquid nitrogen traps, a KBr trap at 100°C, and through an HP-MOLSIV 30 m × 0.32 mm × 25 um column. The oxygen isotope ratio of the O2 gas was measured by the MAT-253 mass spectrometer running in continuous flow mode relative to the O2 reference gas that was calibrated against the international standard NBS-28 and the standard at the University of Wisconsin UWG-2 garnet (Valley et al., 1995). Isotope values are given in the standard delta notation per mil (‰) versus VSMOW. The external reproducibility of δ18O values was better than 0.1‰ for standards and 0.2‰ for the samples.
5.4 Thermometry and compositions of fluid inclusions
Microthermometric analyses of the fluid inclusions were made using the UMTK-3 freezing-heating stage designed by VIMS Institute and modified by TsNIGRI Institute, Russian Geological Survey, to allow low-temperature experiments. Low-temperature measurements were conducted first; cooling was by liquid N2 flow. The stage employs a chromel-alumel thermocouple and is capable of attaining temperatures ranging from below −180 to over +650°C. The stage was periodically calibrated using the boiling temperature of pure N2 (−196°C), triple point for pure CO2 (−56.6°C), temperatures of ice melting in standard NaCl solutions (from −18 to −1°C), melting temperatures of AgNO3 (210°C) and K2CrO7 (398°C).
For bulk fluid inclusion analysis (Kryazhev et al., 2006), pure mineral concentrates of 1 g of quartz were prepared by handpicking under a binocular microscope and crushed in an agate mortar to 0.25–0.5 mm. This was followed by cleaning in an aqueous (1:1) HNO3 solution and then by water-flow electrolytic cleaning in an ultrasonic bath for 3 h. Following this procedure, the samples were dried and put into a quartz glass reactor under vacuum at 110°C and then filled with helium. The fluid inclusions were heated to 500°C for 15 min. The gases extracted were introduced into a gas chromatograph (Agilent 6890) for determination of H2O, CO2, and CH4. Then, the heated samples were leached with deionized water in an ultrasonic bath for 15 min. The leachate solution was separated by centrifuging and then analyzed by ion chromatography (TSVET3006) for anions (Cl, F, and SO4) and by ICP-MS (Elan-6100) for other elements.
5.5 Gold content in sulfides
The content of Au in powdered monomineral samples of pyrite (12 pcs.) and arsenopyrite (9 pcs.) was determined by atomic absorption spectrometry with electrothermal atomization on a LUMEX MGA-1000 spectrometer (Russia) (DPMGI SB RAS). The lower limit of gold detection is 0.02 ppm.
6 Results
6.1 Chemical сomposition of pyrite and arsenopyrite from proximal alteration rock
In the sericite-chlorite-carbonate-quartz proximal alterations, arsenopyrite1 is represented by short-prismatic and pseudopyramidal crystals, pyrites are characterized by cubic and pentagondodecahedral forms (Figures 3C, D). There are fractured arsenopyrite1 and pyrite3 with inclusions of late sulfides (galena, sphalerite, chalcopyrite, etc.). Crystal size from 1–1.5 to 2–3 mm. Pyrite3 and arsenopyrite1 are characterized by disseminated, euhedral, and/or semieuhedral textures. The content of disseminated sulfide mineralization in proximal аlteration is up to 6%–8%. Usually, pyrite prevails at a distance from quartz veins/veinlets, and arsenopyrite prevails near them. These minerals hosted invisible gold in the Badran deposit.
Supplementary Tables S1, S2 contain information about compositions (wt%) and Table 1 contains statistical characteristics (minimum values; maximum values, median, standard deviation, and coefficient of variation) for pyrite and arsenopyrite in the proximal аlteration rock of the Badran deposit analyzed by EPMA. Pyrite of non-stoichiometric composition prevails (Fe/(As+S)≠0.50; S/Fe≠2.00). The main impurity in pyrite3 is As (СAs = 0.18–2.41 wt%) (Figure 6A).
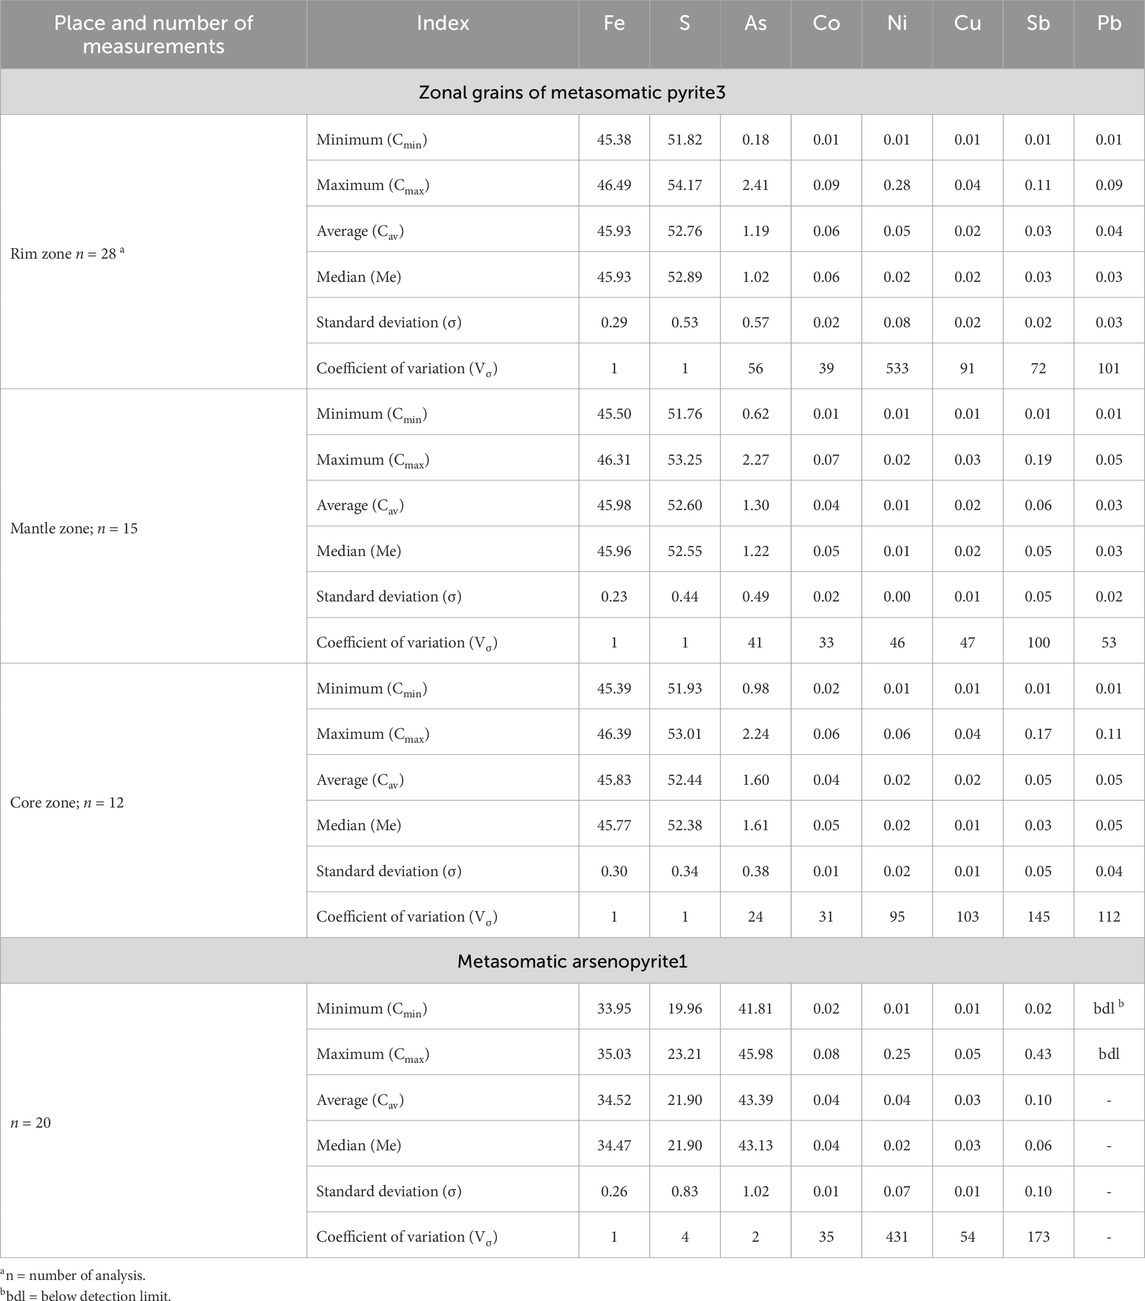
TABLE 1. Statistical values of EPMA analyses of pyrite3 and arsenopyrite1 from proximal alterations of the Badran gold deposit (wt%).
Typomorphic impurities in pyrite3 are Co, Ni, Cu, Sb, and Pb (Figure 6A). Micro impurities of other elements are present in quantities below the detection limit of EPMA analyzes. The total impurity content varies from 0.01 to 0.37 wt% and the entire spectrum of elements is recorded in single crystals. The concentrations of impurity elements vary within large limits (Supplementary Tables S1, S2; Table 1), the most stable contents are characteristic of Co (Vσ = 31%–39%) and As (Vσ = 34%–56%). The distribution of the contents of both the major elements and the impurity elements is zonal in nature, which made it possible to identify the rim, mantle, and core zones in crystals.
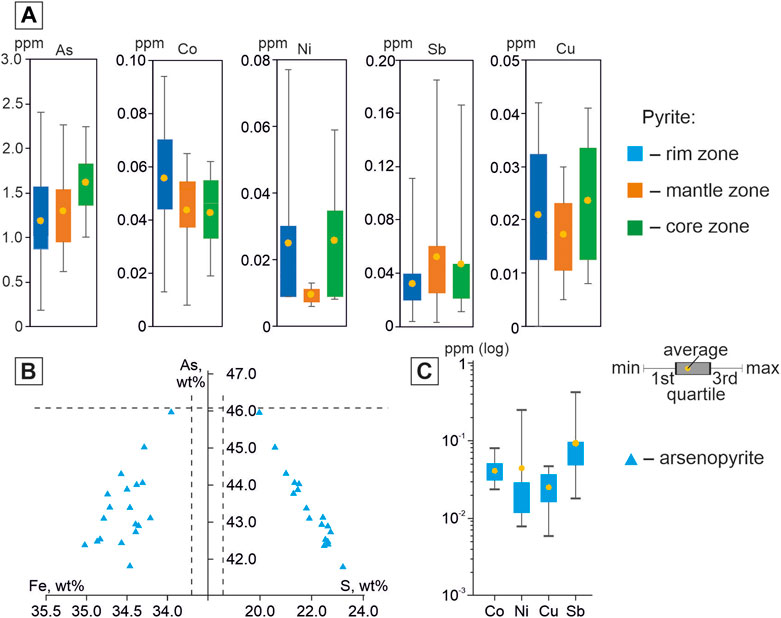
FIGURE 6. Boxplots showing the compositional difference of pyrite3 in this study acquired by EPMA analysis (A), diagrams of the ratios of concentrations of Fe, S, and As in arsenopyrite1 (B), boxplots showing the compositional difference of arsenopyrite1 in this study acquired by EPMA analysis (C). The lower border of the line shows the minimum value, the upper shows the maximum value. The circles in the boxes denote the average and the bottom and top of each box denote the first and third quartiles, respectively. Concentrations are in a logarithmic scale. The line Fe=34.30 wt%, S=19.69 wt%, and As=46.01 wt% corresponds to the stoichiometric composition of arsenopyrite.
The rim zone is characterized by an increased content of Co (0.07–0.09 wt%), for individual crystals of pyrites, increased contents of Ni and Sb are recorded (max CNi up to 0,28 wt%; max CSb = up to 0.11 wt%). In the mantle zone, the minimum contents of Cu, Ni, and Pb are observed. The core zone is characterized by an increased content of As (0.98–2.2.24 wt% at Vσ = 24%), but maximum concentrations are recorded in the rim zone.
Arsenopyrite1 is characterized by a non-stoichiometric composition [(S+As)/Fe≠2.00], an excess of S (CS = 19.96–23.21 wt%) and the lack of As (СAs = 41.81–45.98 wt%) (Figure 6B). Fe content is close to stoichiometric (Me=34.36 wt%). Elements-impurities are Co, Ni, Cu, and Sb (Figure 6C). The constant impurity is Co (Vσ=35%). The distribution of the remaining impurities is very uneven.
6.2 Fluid inclusion analysis
6.2.1 Fluid inclusion petrography
Fluid inclusions were studied in quartz from quartz2 of the main producing аrsenopyrite-pyrite-carbonate-quartz vein association. The classification of fluid inclusions into primary and secondary in doubly polished sections was carried out using the criteria described by Roedder (1984). In most of the studied samples, only small and very small gas-liquid inclusions 5–10 μm in size were found (Figure 7). Measurements were carried out only in primary and pseudosecondary inclusions in the central and outer zones of quartz crystals from veins containing visible gold of the main ore-forming stages. Pseudosecondary inclusions are also used for analysis (Yardley and Bodnar, 2014) since they are cogenetic to a later ore event that brought a significant amount of gold into the quartz vein system. Their analysis is important for understanding the evolution of the ore-forming system. Considering the degree of filling, two coexisting types of fluid inclusions (FI) are identified. Type I inclusions are essentially gaseous (65–100 vol% gas), whereas type II inclusions are liquid-gaseous (10–20 vol% gas). The homogenization temperature, pressure, and fluid composition in inclusions from the central (type-IA and type-IIA) and external (type-IB and type-IIB) zones of quartz crystals differ significantly (Table 2).
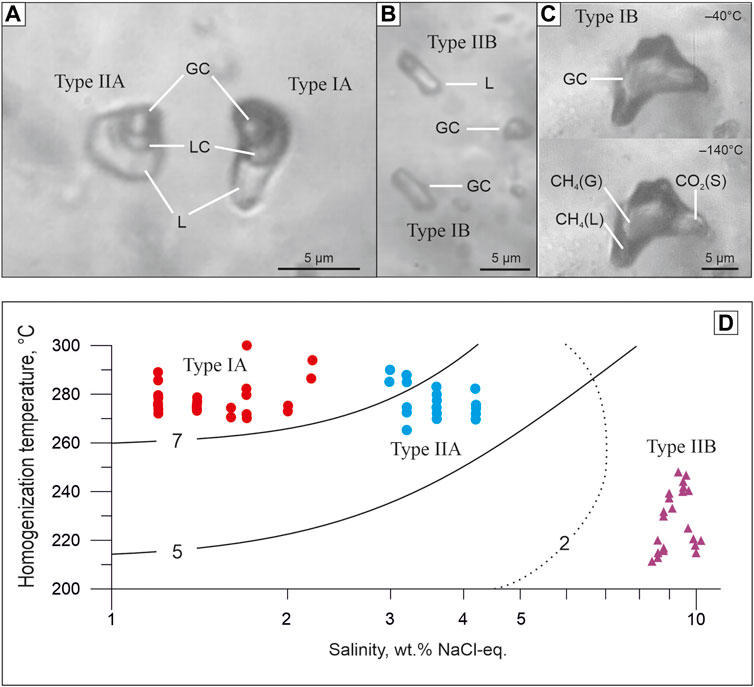
FIGURE 7. Micrographs of fluid inclusions in quartz from the Badran gold deposit. (A) The central zone of quartz crystals (type-IA + type-IIA); (B, C) the outer zone of quartz crystals (type-IB + type-IIB). Abbreviation: L—liquid H2O. LC—liquid СО2+СН4, GC—gaseous СО2+СН4. СН4(L)—liquid СН4. СН4(G)—gaseous СН4. СО2(S)—solid CO2. (D)—Salinity-temperature diagram showing the data for type IA, IIA, and IIB fluid inclusions. Solid and dotted lines show CO2 solubility in H2O-NaCl solutions (mol%) under the pressure of 500 bars and 200 bars, respectively (Soloviev et al., 2019).
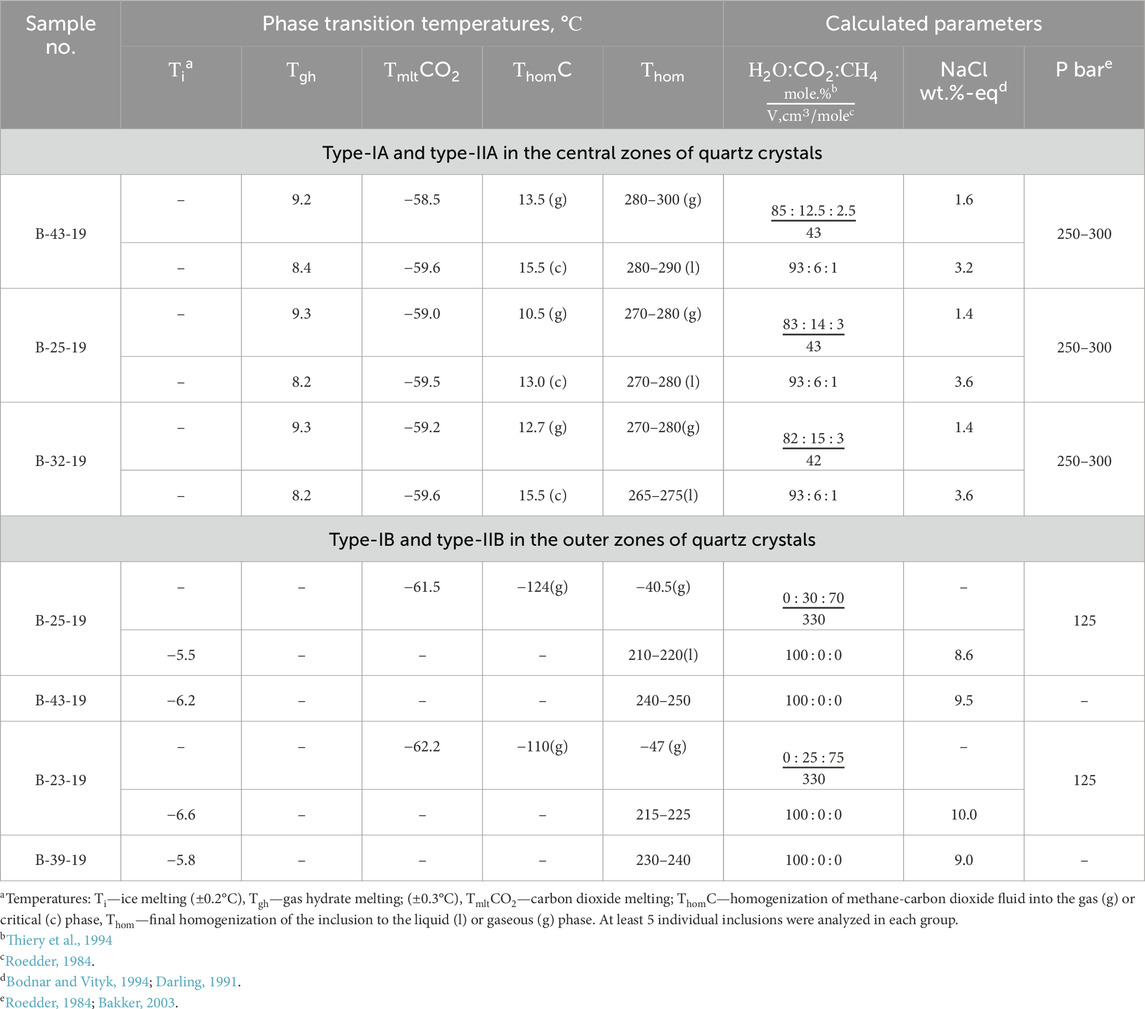
TABLE 2. Results of the microthermometry of fluid inclusions in quartz from the Badran deposit.
6.2.2 PTX results of the fluid inclusions study
In the central zones of the crystals, a large number of relatively evenly distributed primary coexisting carbonic-aqueous to aqueous-carbonic types IA and IIA fluid inclusions and their clusters are observed (Figure 7А). Type IA and IIA inclusions have similar homogenization temperatures, but different salinities (Figure 7D). Homogenization of inclusions occurs in the interval of 265°С–300°С by dissolving carbon dioxide in water (Type IIA) or by evaporation of water (Type IA). Salinities range from 3.2% to 3.6% (Type IIA) to 1.4%–1.6% (Type IA) in wt% NaCl equivalent. When the inclusions are cooled, a gas hydrate is formed, which does not allow accurate measurement of the temperature of the eutectic of the water-salt solution. The first ice melting temperature in inclusions varies from −30 to −25°C, which indicates a predominantly chloride composition of salts (Borisenko, 1977). Thus, the fluid inclusion study shows that the ore fluids have low salinity and are CO2-rich. Petrography and microthermometric results suggest that fluid immiscibility occurred during the gold mineralization stage. The fluid immiscibility was likely responsible for the deposition of gold and sulfide minerals (Ni et al., 2015).
The outer zones of crystals are composed of water-transparent quartz which contains mainly gas-liquid inclusions (type-IIB) with a small bubble and homogenization temperatures to the liquid phase from 250° to 210°C. The eutectic temperature (the first ice melting) of solutions of inclusions is −7.5...-7.0°C, which indicates a predominantly chloride-bicarbonate-sulfate composition of salts (Borisenko et al., 2007). The concentration of solutions at the melting point of the last ice crystal is estimated at 8–10 wt% NaCl-eq.
In association with gas-liquid inclusions are low-density gas inclusions (type-IB) (Figure 7B). During cooling in some vacuoles (favorable in shape), freezing of CO2 and the formation of liquid methane rim is observed (Figure 7C). The mole fraction of methane, determined by the melting and evaporation temperature of carbon dioxide, is 70%–75% (Thiery and al, 1994).
The association of liquid and gas inclusions (Types IB and IIB) suggests that they were also captured simultaneously from a heterogeneous (boiling) fluid. Consequently, the measured homogenization temperatures of the gas-liquid (type-IIB) inclusions correspond to the conditions of their capture.
The presence of coexisting carbonic and aqueous-carbonic inclusions in the same clusters and trails provides evidence for considering them as trapped contemporaneously in the two-phase immiscible field. If so, the trapping pressures for the coexisting types IA+IIA and IB+IIB can be established using trapping temperatures for the high-density type B fluid inclusions and densities for the low-density type A fluid inclusions (e.g., Roedder, 1984).
The melting point of carbon dioxide in inclusions (from −58.5 to −59.6°C) indicates the presence of a significant impurity of methane (and probably nitrogen) in the fluid. Densities (molar volumes) for the fluid inclusions containing fractions of methane in addition to CO2 can be determined by the melting point of CO2 and the homogenization temperature of methane-carbon dioxide fluid using the diagrams from Thiery et al. (1994). The type IB fluid inclusion density is about 330 cm3/mol. Correspondingly, using the computing programs of Bakker (2003), the trapping pressure for type IB+IIB inclusions (trapping temperature 210°C–220°C) is estimated at 125 bar.
The density of the carbonic phase in type IA fluid inclusions is about 180–200 cm3/mol. Taking into account the volume fraction of carbon dioxide (about 65 vol%), the composition and density of the inclusions can be calculated (Roedder, 1984). Calculations indicate that fluids in type IA inclusions contain 85–82 mol% H2O, 15–18 mol% CO2 (+CH4), Their molar volume is about 42–43 cm3/mol (Table 2). Using the computing programs of Bakker (2003), the trapping pressure for type IA+IIA inclusions (trapping temperature 285°C–270°C) is estimated at 250–300 bar. It should be noted that according to experimental data (Figure 7D), the fluid contained in type IIA inclusions could be captured from a homogeneous solution only at pressures above 500 bar.
6.2.3 Bulk composition of fluid inclusions
Bulk analysis makes it possible to estimate the composition of fluid inclusions regardless of their size. The results obtained from 23 samples are given in Supplementary Table S3. According to the predominance of the main fluid components, the samples are divided into several groups, which can be considered as samples containing mainly one or another of the types of fluid inclusions described above (or a combination thereof). Samples containing water-carbon dioxide inclusions (type IA+IIA) are identified by a high concentration of CO2, as well as CH4 and Cl. There is a direct correlation between these components and water. In this group, some samples are recognized separately, in which the chlorine ion content was below the detection limit, despite the large amount of CO2. It can be assumed that these samples contain mainly substantially gaseous inclusions (type IA). Quartz with inclusions of low-temperature bicarbonate-sulfate solutions (type IIB) is identified by high SO4 contents in aqueous extracts. In some samples along with abnormal amounts of sulfate, very high concentrations of Fe, Mn, Ba, Sr, as well as Cu, Zn, and Pb were found. Similar concentrations of elements in extracts may indicate in favor of their presence in the form of mineral phases (including in the form of daughter minerals in inclusions). It should be noted here that in samples with visible sulfide mineralization, the sulfate ion is not found. As noted above, inclusions that are substantially methane in composition are present in association with inclusions of low-temperature sulfate solutions. However, CH4 and SO4 show a negative correlation in bulk analysis. However a significant increase in the CO2/CH4 ratio in samples with type-IB+IIB FI indicates that during the analysis, CH4 and SO4 react with each other.
6.3 Stable S–O isotope study
The new and previously obtained sulfur isotope results are given in Table 3. The isotopic composition of pyrite and arsenopyrite sulfur from ore veins with visible gold and proximal alteration of the Badran deposit is characterized by a narrow range of values from −1.1‰ to +2.4‰, average value of +0.4‰. δ34S values of arsenopyrite from alterations vary from −1.1 to +2.4‰, and of arsenopyrite from quartz veins from +1.1 to +2.3‰. In situ determination of δ34S in arsenopyrite from alterations showed its homogeneous isotopic composition. Variations in the magnitude of δ34S in pyrites from the proximal alteration vary from −0.7 to +2.1‰ (mean ∼+0.9‰, coefficient of variation CV = 80%), which is somewhat wider than in pyrite from quartz veins from +1.0 to +1.4‰.
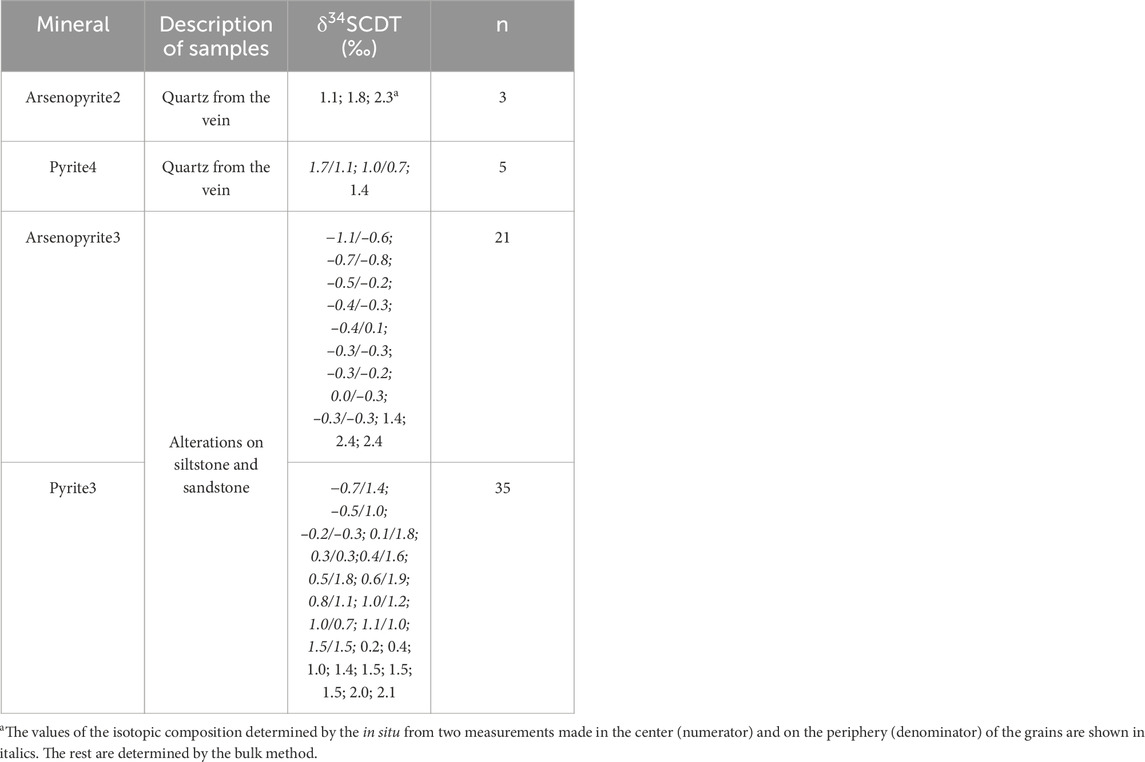
TABLE 3. Sulfur isotope compositions of ore sulfides from the Badran deposit.
According to the values of δ34S in pyrite, two types of crystals are identified from the proximal alteration (Fridovsky et al., 2022). The first type is isotopically inhomogeneous with sulfur weighting from the center to the periphery of the grains (the average in the center of the grains is +0.2‰, average at the periphery of the grains is +1.5‰). The difference in the value of δ34S is up to 2.1‰. The second type, taking into account the analysis error, is isotopically homogeneous pyrite, in which the values of δ34S in the center of crystals do not significantly (0.0‰–0.3‰) differ from the periphery.
The δ18O values of quartz from ore veins with visible gold of the Badran deposit, selected at various depth levels, vary in a narrow range from +15.1 to +17.5‰ (mean +16.4‰, n = 12). The oxygen isotopic composition of the water included in these fluids is calculated considering the entrapment temperatures of primary inclusions in quartz (290°С–210°С) and equilibrium constants for oxygen isotope exchange between quartz and water (Clayton et al., 1972). The range of δ18ОH2O values was quite uniform (+7.5‰ ± 1‰).
7 Discussion
7.1 Genesis of pyrite and arsenopyrite and gold endowment
The analysis of the Co, Ni, and As content in pyrite and As, S, and Fe in arsenopyrite and the ratios of these elements is important for determining the conditions of formation and genesis of these minerals with invisible gold in Badran deposit (Bralia et al., 1979; Bajwah et al., 1987; Azovskova et al., 2014; Reich et al., 2016; Roman et al., 2019; Large and Maslennikov, 2020).
The Co/Ni ratio in pyrite varies from 0.3 to 9.9, which is typical for p-type pyrite with high conductivity. Such negatively charged pyrite according to data (Large and Maslennikov, 2020) mainly attracts gold. For most of the analyzed grains, Co/Ni>1, which according to (Zhang et al., 2014; Roman et al., 2019) is characteristic of hydrothermal fluids (Figure 8A). Considering the As-Co-Ni system, it is possible to judge the conditions of pyrite formation. Co and Ni are of mantle origin, but Ni is a part of the minerals already at the early stages of magmatic melt migration. The Co content is quite stable in the hydrothermal fluid. As passes into the solid phase at lower temperatures, isomorphically replacing S in pyrite. In the As-Co-Ni diagram (Figure 8B), the points are concentrated at the top of As, which may indicate, as mentioned earlier when discussing the results of the study of fluid inclusions, the formation of pyrite at a shallow depth from solutions of combined composition.
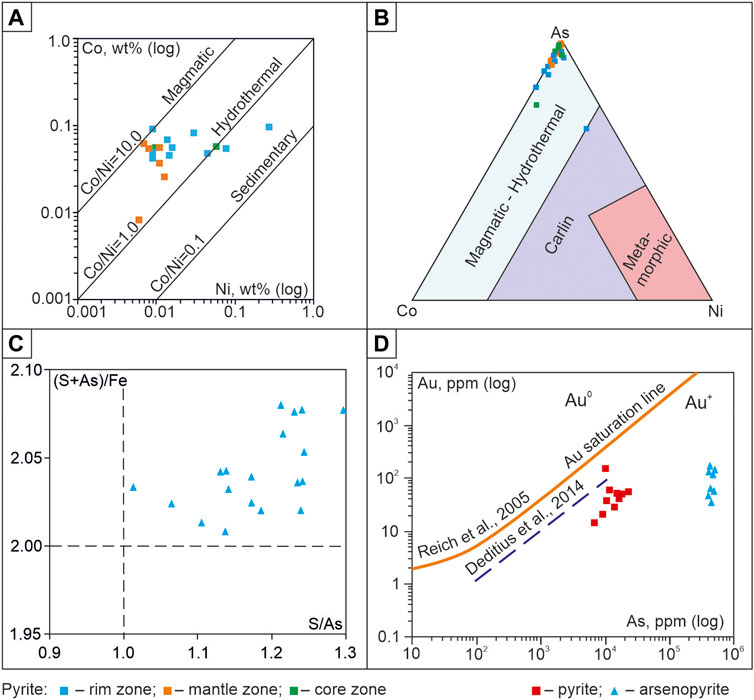
FIGURE 8. (A) Binary plot of Co vs. Ni concentration in pyrites. The demarcated fields are after Xu (1998) and Bajwah et al. (1987); (B) Ternary plot of As-Co-Ni concentration in pyrites. The demarcated fields are after Yan et al. (2012); (C) Binary plot of S/As vs. (S + As)/Fe in proximal аlteration arsenopyrite. The intersection of the lines S/As = 1 and (S + As)/Fe = 2 corresponds to the stoichiometric composition (Sazonov et al., 2016); (D) Gold concentration in pyrite and arsenopyrite plotted against As concentration. The Au saturation line is after Reich et al. (2005) and Deditius et al. (2014).
Variations of As and S contents even within one grain in the metasomatic arsenopyrite of the Badran deposit amount to 0.6–1.2 wt%. The constant excess of S with a lack of As and the high “mobility” of these elements in solution leads to a violation of the mineral structure and distortion of the octahedral environment of Fe atoms (Sazonov et al., 2016). The graph (Figure 8C) demonstrates the non-stoichiometric composition of Aspy (S/As = 1.01–1.30; (S+As)/Fe = 2.01–2.08), which reflects the instability of the ore formation regime.
Pyrite3 and arsenopyrite1 are the main gold-bearing minerals in the proximal alteration of the Badran deposit. Gold can be either in the form of isomorphic substitution of Fe, As, and S in these minerals of non-stoichiometric composition or in the form of microinclusions. Microinclusions of native gold were not observed in the studied sulfides, but their gold content is high (in pyrite up to 155.5 ppm Au and in arsenopyrite up to 123.6 ppm Au) (Table 4). The position of Au concentrations in Py and Apy below the saturation line is characteristic of the structurally related form of “invisible” Au+ gold (Figure 8D). This type of gold content is described in many gold deposits of various ages (Reich et al., 2005; Deditius et al., 2014). Non-stoichiometry of the compositions and imperfection of the structure of pyrite and arsenopyrite provides wide possibilities for isomorphic substitution of Au+ mineral-forming elements (As, F, S) (Figure 8D).
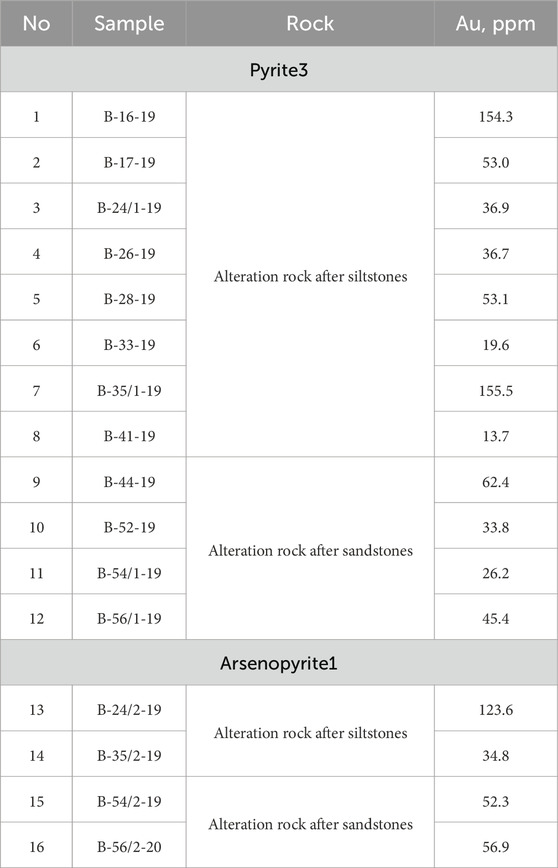
TABLE 4. Сoncentrations of Au (ppm) in pyrite and arsenopyrite from proximal alterations rocks of the Badran deposit.
7.2 The origin of fluids in the evolution of the ore-forming system
Based on the results of the study of fluid inclusions from quartz veins with visible gold of the Badran deposit, its formation was determined at temperatures from 290°С to 210°C and pressures from 250 to 125 bar. The obtained temperatures correspond to orogenic gold deposits in the western part of the YKMB, but the pressure is lower (Fridovsky et al., 2020). Mineral formation at the Badran deposit occurred under conditions of heterogenization (boiling) of ore-bearing fluids and the change of the lithostatic pressure gradient by hydrostatic one. In the process of ore formation, the composition of gold-bearing solutions has significantly evolved. Early pyrite-arsenopyrite metasomatic and arsenopyrite-pyrite-carbonate-quartz vein mineral associations were formed with the involvement of diluted alkaline-chloride methane-carbon dioxide fluids (С=1.5–3.5 wt% NaCl-eq., xCO2+CH4 = 4–6 mol%, CO2/CH4 = 5–7). The late polymetallic-carbonate-albite-quartz and sulfostibnite-sericite-quartz mineral associations were deposited after a drop in temperature and pressure from sulfur-methane solutions (С = 8–10 wt% NaCl eq., xCO2+CH4 < 1 mol%, CO2/CH4 = 0.3–0.4). The obtained parameters are typical for the Phanerozoic orogenic deposits (Wilkinson, 2001; Goldfarb and Groves, 2015). In low- and moderately-saline fluids, the sulfide (HS¯) complex can be the major agent for gold transportation in hydrothermal fluids in the Badran gold deposit (Monsef and Abdelnasser, 2021). The change from the early stages to the late stages of the P-T parameters of the ore fluid, its cooling, pressure reduction, and interaction with surrounding rocks leads to a decrease in the solubility of gold, destabilization of Au(HS)2, gold precipitation in association with sulfides Fe, Pb, Zn, and Cu.
Studied fluid inclusions (type-I, -II) from quartz veins with visible gold of the Badran deposit at discrimination diagram of Wilkinson (2001) of salinity vs. homogenization temperature they fall, mostly to the field of vein Au deposits (Figure 9). The above suggests the origin of ore-bearing fluids in the Badran area from various sources of deep metamorphic reservoirs and subcrustal lithospheric mantle (SСLM). The latter was fertilized in the time preceding mineralization (Late Jurassic) and was derived directly from the down-going subduction slab and overlying sediment wedge at the closure of the Oymyakon Ocean according to the model (Groves et al., 2020).
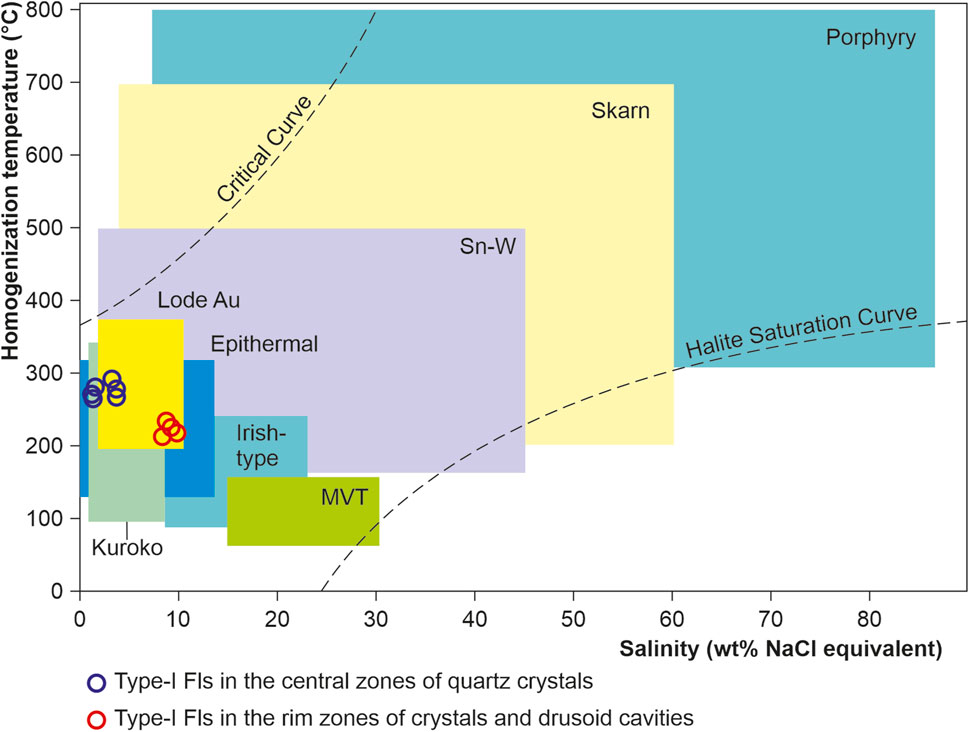
FIGURE 9. Salinity vs. homogenization temperature diagrams to fluid inclusions of the Badran deposit. The demarcated fields’ typical ranges for fluid inclusions from different types of deposits are after (Wilkinson, 2001).
7.3 Source of metals and ore fluids
Sulfur аnd oxygen isotope data provide an opportunity to gain useful information about possible sources of metals and ore fluids (Wilkinson, 2001). Studies of the isotopic composition of sulfur pyrite (δ34S from −0.7 to +2.1‰) and arsenopyrite (δ34S from −1.1 to +2.4‰) of the Badran deposit have shown that δ34S are close to sulfides from gold-quartz veins of orogenic deposits in the western part of the YKMB (arsenopyrite—from −2.1 to +2.4‰, pyrite—from −6.6 to +5.4‰ (Gamyanin et al., 2018; Kudrin et al., 2021; Fridovsky et al., 2022) and are characterized by a smaller range of variations than δ34S in pyrite from quartz veins and alterations (mean +4.0‰) of the Upper-Kolyma gold-bearing area (Tyukova and Voroshin, 2008). Similar isotopic composition of sulfur arsenopyrite and pyrite of orogenic OGDs of the western part of the YKMB and disseminated mineralization from ore alterations of the Badran deposit indicates their formation during a single isotope equilibrium evolving hydrothermal event under conditions of phase separation of ore-forming fluids.
According to the data (Hoefs, 2018), various ore-forming sources are characterized by individual values of δ34S of sulfides (Figure 10A). Sulfur from marine environments shows δ34S values of ∼ +20‰, wide variations in the value of δ34S are determined for sedimentary (from −40‰ to +50‰) and metamorphic (from −20‰ to +20‰) reservoirs. The isotopic composition δ34S of sulfur from granite is estimated by (from −2‰ to +10‰), basalt—(from 0‰ to +5‰). The values of δ34S close to zero are characteristic of mantle or mantle-derived sources. The average isotopic composition of sulfur pyrite and arsenopyrite from alterations and ore veins of the Badran deposit is close to 0‰ (Figure 10A) and is consistent with the data obtained from other OGD of the western part of the YKMB (Fridovsky et al., 2013; Fridovsky et al., 2014; Fridovsky et al., 2015; Gamyanin et al., 2018; Kudrin et al., 2021; Fridovsky et al., 2022).
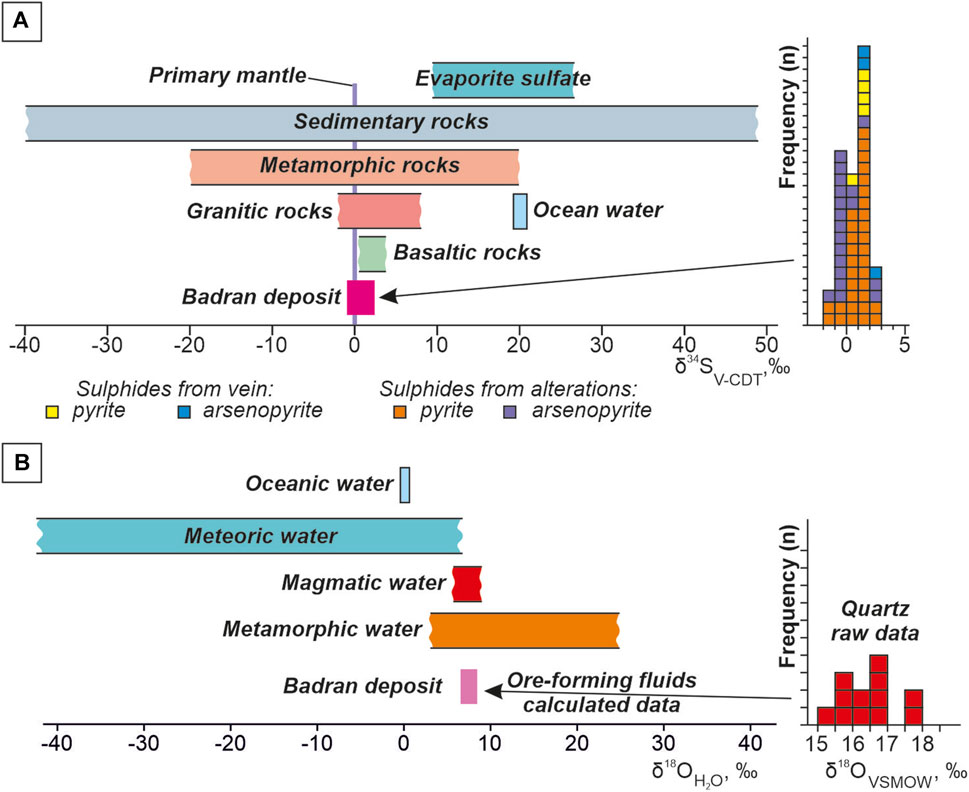
FIGURE 10. Distribution and frequency histogram from the Badran gold deposit showing: (A) δ34S isotope composition for ore sulfides. δ34S values of various geological reservoirs after (Hoefs, 2018); (B) δ18О isotope composition for quartz from the ore veins and δ18О of mineral-forming fluid. The values of δ18O of water from various sources according to (Rollinson, 1993).
Values of δ34S close to 0‰ show that the sulfur is consistent with fluids of subcontinental lithospheric mantle and magmatic origin. The obtained results may indicate the involvement of a deep source of sulfur in ore formation at the Badran deposit. The combination of the narrow δ34S range and the lack of sharp change from the depth of 600 m to the surface the fluid temperature and salinity showed that ore-forming fluids and sources were stable. Such conditions can be an essential requirement for large-scale gold mineralization (Li et al., 2023).
Isotopic composition of oxygen quartz from ore veins with native gold of the Badran deposit (from +15.1 to +17.5‰) is somewhat narrower than the range characteristic of gold-quartz deposits in the western part of the YKMB (from +14.2 to +19.5‰ (Gamyanin et al., 2018)), is close to δ18O quartz of the super-large Nezhdaninskoe gold deposit (from +14.8 to +16.6‰ (Bortnikov et al., 2007)), but it is somewhat heavier than for the Natalka deposit (from +11.6 to +14.1‰ (Goryachev et al., 2008)) (Figure 10B). The obtained values of δ18O quartz are comparable to the Phanerozoic orogenic gold deposits (from +12 up to +18‰ (Kerrich, 1990; Ridley and Diamond, 2000). The close values of δ18O quartz from different sites of the Badran deposit may indicate a homogeneous source of fluids of the deep metamorphic thermal system.
The oxygen isotopic composition of the water included in these fluids is calculated considering the entrapment temperatures of primary inclusions in quartz (290°С–210°С) and equilibrium constants for oxygen isotope exchange between quartz and water (Figure 10B) (Clayton et al., 1972). The obtained relatively uniform range of δ18ОH2O values (+7.5‰ ± 1‰) indicates a probable paragenetic relationship of ore-forming fluids with magmas or metamorphic reservoirs (Rollinson, 1993).
Thus, the obtained results of studying fluid systems, S-O stable isotopes, and geochemistry of sulfides from proximal alteration confirm that the ore-forming fluids of the Badran deposit did not have a single origin, but were obtained from a mixture of subcontinental lithospheric mantle and metamorphic sources.
8 Conclusion
1) The Badran polychronous gold deposit contains typically orogenic disseminated mineralization with arsenian pyrite and arsenopyrite ores with invisible gold, quartz veins with native gold and sulfides Fe, Pb, Zn, Cu, and sulfosalts, as well as locally post-ore minerals Ag, Sb, and Hg epithermal features. It was formed in six stages of mineralization: (I) metasomatic pyrite-arsenopyrite, (II) arsenopyrite-pyrite-carbonate-quartz, (III) polymetal-carbonate-albite-quartz, (IV) sulfostibnite-sericite-quartz, (V) silver-quartz, (VI) cinnabar-stibnite-carbonate-quartz. The sericite-chlorite-carbonate-quartz proximal alteration contains the disseminated arsenian pyrite and arsenopyrite with high contents of invisible structurally bound Au+. Disseminated and vein ores are controlled by thrust structures, which are transit routes for trans-crustal fluids.
2) Ore formation at the Badran gold deposit occurred under conditions of heterogenization (boiling) of low-saline aqueous-carbonic fluids. At an early stage, the fluids had an alkaline-chloride methane-carbon dioxide composition. At a late stage, with a drop in temperature and pressure, they contained sulfur-methane solutions. The change of the P-T parameters of the ore-forming fluid, boiling and the interaction with the surrounding rocks led to a decrease in solubility and precipitation of gold.
3) The combination of the narrow δ34S range and the lack of sharp change with the depth of the fluid temperature and salinity showed that ore-forming fluids and sources were stable. Such conditions can be an essential requirement for large-scale gold mineralization.
4) The results obtained confirm that the ore-forming fluids of the Badran gold deposit did not have a single origin, but were obtained from a mixture of subcontinental lithospheric mantle and metamorphic sources.
Data availability statement
The original contributions presented in the study are included in the article/Supplementary Material, further inquiries can be directed to the corresponding author.
Author contributions
VF: Conceptualization, Data curation, Formal Analysis, Funding acquisition, Investigation, Methodology, Project administration, Supervision, Validation, Writing–original draft, Writing–review and editing. SK: Conceptualization, Formal Analysis, Investigation, Methodology, Validation, Writing–original draft, Writing–review and editing. LP: Conceptualization, Formal Analysis, Methodology, Writing–original draft, Writing–review and editing. MK: Conceptualization, Formal Analysis, Methodology, Validation, Visualization, Writing–original draft, Writing–review and editing. GA: Conceptualization, Formal Analysis, Methodology, Validation, Writing–original draft, Writing–review and editing.
Funding
The author(s) declare financial support was received for the research, authorship, and/or publication of this article. This research was financially supported by the Diamond and Precious Metals Geology Institute, Siberian Branch of the Russian Academy of Sciences (FUFG-2024-0006). Isotope geochemical studies was supported by the Russian Science Foundation (RSF) (project no. 23-47-00064).
Acknowledgments
The authors would like to thank some reviewers for their thorough reviews which have greatly improved the manuscript.
Conflict of interest
The authors declare that the research was conducted in the absence of any commercial or financial relationships that could be construed as a potential conflict of interest.
Publisher’s note
All claims expressed in this article are solely those of the authors and do not necessarily represent those of their affiliated organizations, or those of the publisher, the editors and the reviewers. Any product that may be evaluated in this article, or claim that may be made by its manufacturer, is not guaranteed or endorsed by the publisher.
Supplementary material
The Supplementary Material for this article can be found online at: https://www.frontiersin.org/articles/10.3389/feart.2024.1340112/full#supplementary-material
References
Akinin, V. V., Prokopiev, A. V., Toro, J., Miller, E. L., Wooden, J., Goryachev, N. A., et al. (2009). U–PB SHRIMP ages of granitoids from the Main batholith belt (North East Asia). Dokl. Earth Sci. 426, 216–221. doi:10.1134/S1028334X09040217
Amuzinsky, V. A. (2005). Metallogenic epochs and content of ore complexes of the Verkhoyansk folded system. Yakutsk: YSU Publishing House. (In Russian).
Anisimova, G. S., Amuzinsky, V. A., and Balandin, V. A. (1998). Sulfide-quartz deposits in gently sloping faults – a new type of gold deposits. Russ. Geol. 6, 65–70. (In Russian).
Anisimova, G. S., Kondratieva, L. A., Serkebaeva, E. S., and Ageenko, V. A. (2008). Badran gold deposit, eastern yakutia. Ores Metals 5, 49–60. (In Russian).
Azovskova, O. B., Utochkina, N. V., and Zubova, T. P. (2014). Geochemical features of pyrite and marcasite from weathering crusts and “ancient” loose deposits of the Aktai area (Northern Urals)” in Ezhegodnik-2013, Tr. IGG UrO RAN. Ufa, Russia: URO RAN, 238–245. (In Russian).
Bajwah, Z. U., Seccombe, P. K., and Offler, R. (1987). Trace element distribution, Co:Ni ratios and genesis of the Big Cadia iron-copper deposit, New South Wales, Australia. Min. Deposita 22, 292–303. doi:10.1007/bf00204522
Bakker, R. J. (2003). Package FLUIDS 1. Computer programs for analysis of fluid inclusion data and for modelling bulk fluid properties. Chem. Geol. 194, 3–23. doi:10.1016/S0009-2541(02)00268-1
Bodnar, R. J., and Vityk, M. O. (1994). Interpretation of microthermometric data for H2O-NaCl fluid inclusions. Blacksburg, Virginia Tech, 117–130.
Borisenko, A. S. (1977). Cryometric study of salt composition of solutions in gas–liquid inclusions in minerals. Geol. Geofiz. 8, 16–28. (In Russian).
Bortnikov, N. S., Vikent'eva, O. V., Prokof'ev, V.Yu., Gamyanin, G. N., Alpatov, V. A., and Bakharev, A. G. (2007). Fluid composition and origin in the hydrothermal system of the Nezhdaninsky gold deposit, Sakha (Yakutia), Russia. Geol. Ore Dep. 49 (2), 87–128. doi:10.1134/S1075701507020018
Bralia, A., Sabatini, G., and Troja, F. (1979). A revaluation of the Co/Ni ratio in pyrite as geochemical tool in ore genesis problems. Min. Depos. 14, 353–374. doi:10.1007/bf00206365
Clayton, R. N., O’Neil, J. R., and Mayeda, T. K. (1972). Oxygen isotope exchange between quartz and water. J. Geophys Res. 77, 3057–3067. doi:10.1029/jb077i017p03057
Darling, R. S. (1991). An extended equation to calculate NaCl contents from final clathrate melting temperatures in H2O-CO2-NaCl fluid inclusions: implications for PT-isochors location. Geoch. Cosmochim. Acta 55, 3869–3871. doi:10.1016/0016-7037(91)90079-k
Deditius, A. P., Reich, M., Kesler, S. E., Utsunomiya, S., Chryssoulis, S. L., Walshe, J., et al. (2014). The coupled geochemistry of Au and as in pyrite from hydrothermal ore deposits. Geoch. Cosmochim. Acta 140, 644–670. doi:10.1016/j.gca.2014.05.045
Fridovsky, V. Y. (1999). Strike slip fault duplexes of the Badran deposit (North-East Yakutia). Izvestiya vysshikh uchebnykh zavedenii. Geol. Explor. 1, 60–66. (in Russian).
Fridovsky, V. Y. (2002). “Structures of gold ore fields and deposits of the Yana-Kolyma ore belt,”. Metallogeny of collisional geodynamic settings. Editors N. V. Mezhelovsky, and G. S. Gusev (Moscow: GEOS), 1, 6–241. (in Russian).
Fridovsky, V. Y. (2018). Structural control of orogenic gold deposits of the Verkhoyansk-Kolyma folded region, northeast Russia. Ore Geol. Rev. 103, 38–55. doi:10.1016/j.oregeorev.2017.01.006
Fridovsky, V. Y., Gamyanin, G. N., and Polufuntikova, L. I. (2013). The Sana Au–quartz deposit within the Taryn ore cluster. Razvedka Okhrana Nedr 2, 3–7. (in Russian).
Fridovsky, V. Y., Gamyanin, G. N., and Polufuntikova, L. I. (2014). Gold-quartz and antimony mineralization in the Maltan deposit in Northeast Russia. Russ. J. Pac Geol. 8 (4), 276–287. doi:10.1134/S1819714014040034
Fridovsky, V. Y., Gamyanin, G. N., and Polufuntikova, L. I. (2015). Structures, mineralogy, and fluid regime of ore formation in the polygenetic Malo-Taryn gold field, Northeast Russia. Russ. J. Pac Geol. 9 (4), 274–286. doi:10.1134/S1819714015040028
Fridovsky, V. Y., Goryachev, N. A., Krymsky, R. S., Kudrin, M. V., Belyatsky, B. V., and Sergeev, S. A. (2021). The Age of gold mineralization in the Yana–Kolyma metallogenic belt, Northeastern Russia: first data of Re–Os isotope geochronology of native gold. Russ. J Pac. Geol. 15 (4), 293–306. doi:10.1134/S1819714021040035
Fridovsky, V. Y., Kudrin, M. V., Polufuntikova, L. I., and Goryachev, N. A. (2017). Ore-controlling thrust faults at the Bazovskoe gold-ore deposit (Eastern Yakutia). Dokl. Earth Sci. 474 (2), 617–619. doi:10.1134/S1028334X17060034
Fridovsky, V. Y., Polufuntikova, L. I., Gamyanin, G. N., and Solovyov, E. E. (2015). Orogenic gold deposits with significant resource potential in the central part of the Yana-Kolyma belt. Explor Prot. Min. res 11, 3–9. (in Russian).
Fridovsky, V. Y., Polufuntikova, L. I., Kudrin, M. V., and Goryachev, N. A. (2022). Sulfur isotope composition and geochemical characteristics of gold-bearing sulfides of the Badran orogenic deposit, Yana-Kolyma metallogenic belt (North-East Asia). Dokl. Earth Sci. 502 (1), 3–9. doi:10.1134/S1028334X22010032
Fridovsky, V. Y., Vernikovskaya, A. E., Yakovleva, K. Y., Rodionov, N. V., Travin, A. V., Matushkin, N. Y., et al. (2022). Geodynamic formation conditions and age of granitoids from small intrusions in the west of the Yana–Kolyma gold belt (Northeast Asia). Russ. Geol. Geophys 63 (4), 483–502. doi:10.2113/RGG20214442
Fridovsky, V. Y., Yakovleva, K. Y., Vernikovskaya, A. E., Rodionov, N. V., Vernikovsky, V. A., Matushkin, N. Y., et al. (2020). Geodynamic emplacement setting of the Late jJrassic dikes of the Yana–Kolyma gold belt, NE folded framing of the Siberian craton: geochemical, petrologic, and U-Pb zircon data. Minerals 10 (11), 1–27. doi:10.3390/min10111000
Fridovsky, V. Y., Yakovleva, K. Y., Vernikovskaya, A. E., Vernikovsky, V. A., Rodionov, N. V., and Lokhov, K. I. (2020). Late jurassic (151–147 Ma) dike magmatism of the northeastern margin of the siberian craton. Dokl. Earth Sci. 491 (1), 117–120. doi:10.1134/S1028334X2003006X
Fu, J., Hu, Z., Li, J., Yang, L., Zhang, W., Liu, Y., et al. (2017). Accurate determination of sulfur isotopes (δ33S and δ34S) in sulfides and elemental sulfur by femtosecond laser ablation MC-ICP-MS with non-matrix matched calibration. J. Anal. At. Spectrom. 32, 2341–2351. doi:10.1039/C7JA00282C
Gamyanin, G. N., Fridovsky, V. Y., and Vikent’eva, O. V. (2018). Noble-metal mineralization of the Adycha–Taryn metallogenic zone: geochemistry of stable isotopes, fluid regime, and ore formation conditions. Russ. Geol Geoph 59 (10), 1271–1287. doi:10.1016/j.rgg.2018.09.006
Gertseva, M. V., Luchitskaya, M. V., Sysoev, I. V., and Sokolov, S. D. (2021). Stages of formation of the main batholith belt in the Northeast of Russia: U–Th–Pb SIMS and Ar–Ar geochronological data. Dokl. Akad. Nauk. 499 (1), 5–10. doi:10.31857/S2686739721070057
Goldfarb, R., and Groves, D. (2015). Orogenic gold: common or evolving fluid and metal sources through time. Lithos 233, 2–26. doi:10.1016/j.lithos.2015.07.011
Goldfarb, R. J., Taylor, R., Collins, G., Goryachev, N. A., and Orlandini, O. F. (2014). Phanerozoic continental growth and gold metallogeny of Asia. Gondwana Res. 25 (1), 48–102. doi:10.1016/j.gr.2013.03.002
Goryachev, N. A., and Pirajno, F. (2014). Gold deposits and gold metallogeny of Far East Russia. Ore Geol. Rev. 59, 123–151. doi:10.1016/j.oregeorev.2013.11.010
Goryachev, N. A., Vikentyeva, O. V., Bortnikov, N. S., Prokofiev, V. Y., Alpatov, V. A., and Golub, V. V. (2008). World-class Natalka gold deposit: REE distribution, fluid inclusions, stable oxygen isotopes and ore formation conditions (North-East of Russia). Geol. Rudn. Mest. 50, 414–444. (in Russian).
Groves, D. I., Santosh, M., Deng, J., Wang, Q. F., Yang, L. Q., and Zhang, L. (2020). A holistic model for the origin of orogenic gold deposits and its implications for exploration. Min. Depos. 55, 275–292. doi:10.1007/s00126-019-00877-5
Ignatiev, A. V., Velivetskaya, T. A., Budnitskiy, S. Y., Yakovenko, V. V., Vysotskiy, S. V., and Levitskii, V. I. (2018). Precision analysis of multisulfur isotopes in sulfides by femtosecond laser ablation GC-IRMS at high spatial resolution. Chem. Geol. 493, 316–326. doi:10.1016/j.chemgeo.2018.06.006
Kerrich, R. (1990). Mesothermal gold deposits: a critique of genetic hypotheses. Greenstone gold and crustal evolution, in Greenstone gold and crustal evolution. NUNA Conf. Volume, 13–31.
Khanchuk, A. I. (2006). in Geodynamics, magmatism and metallogeny of the East of Russia. Editor A. I. Khanchuk (Vladivostok: Dalnauka). (in Russian).
Kryazhev, S. G., Prokofiev, V. Y., and Vasyuta, Y. V. (2006). The use of the ICP MS method in the analysis of the composition of ore-forming fluids of hydrothermal ore deposits. Vestnik of the Moscow University (4), 30–36. (in Russian).
Kudrin, M. V., Fridovsky, V. Y., Polufuntikova, L. I., and Kryuchkova, L. Y. (2021). Disseminated gold–sulfide mineralization in metasomatites of the khangalas deposit, yana–kolyma metallogenic belt (northeast Russia): analysis of the texture, geochemistry, and S isotopic composition of pyrite and arsenopyrite. Minerals 11, 403. doi:10.3390/min11040403
Large, R. R., and Maslennikov, V. V. (2020). Invisible gold paragenesis and geochemistry in pyrite from orogenic and sediment-hosted gold deposits. Minerals 10, 339. doi:10.3390/min10040339
Liu, Z., Ni, P., Zhang, Y.-Q., Sheng, Z.-L., Wang, G.-G., Zhang, S.-L., et al. (2021). An Early Cretaceous gold metallogenesis in the Wuhe area, Eastern Anhui province: constraints from geology, fluid inclusion, H-O isotope and geochronology on the Hekou gold deposit. Ore Geol. Rev. 138, 104319. doi:10.1016/j.oregeorev.2021.104319
Monsef, M., and Abdelnasser, A. (2021). Ore-forming mechanism and its relationship with deformational and metamorphic episodes at Haimur gold mine, Nubian Shield, Egypt. Geol. Mag. 158 (3), 518–536. doi:10.1017/S0016756820000655
Neustroev, R. G. (2003). Conditions of localization of ore pillars of the Badran deposit (Yakutia). Izvestiya vuzov. Geol explor 3, 54–57. (in Russian).
Ni, P., Wang, G. G., Chen, H., Xu, Y. F., Guan, S. J., Pan, J. Y., et al. (2015). An early paleozoic orogenic gold belt along the Jiang−Shao fault, south China: evidence from fluid inclusions and Rb–Sr dating of quartz in the huangshan and pingshui deposits. J. Asian Earth Sci. 103, 87–102. doi:10.1016/j.jseaes.2014.11.031
Obolensky, A. A., Gushchina, L. V., Anisimova, G. S., Serkebaeva, E. S., Tomilenko, A. A., and Gibsher, N. A. (2011). Physicochemical modeling of mineral formation processes at the Badran gold deposit (Yakutia). Russ Geol Geoph 52, 290–306. doi:10.1016/j.rgg.2011.02.003
Parfenov, L. M., and Kuzmin, M. I. (2001). “Tectonics,” in Geodynamics and metallogeny of the territory of the republic of sakha (yakutia). Editors L. M. Parfenov, and M. I. Kuzmin (Moscow: Nauka/Interperiodika). (in Russian).
Prokopiev, A. V., Borisenko, A. S., Gamyanin, G. N., Pavlova, G. G., Fridovsky, V. Y., Kondrat’eva, L. A., et al. (2018). Age constraints and tectonic settings of metallogenic and magmatic events in the Verkhoyansk–Kolyma folded area. Russ Geol Geoph 59 (10), 1237–1253. doi:10.1016/j.rgg.2018.09.004
Protopopov, G. H., Truschelev, A. M., and Kuznetsov, Y. V. (2019). State geological map of the Russian federation scale 1:1000 000 third generation. Verkhoyansk-kolyma series. Sheet Q-54 – ust-nera. Explanatory note. Ministry of natural resources of Russia, rosnedra, FSBI VSEGEI, JSC yakutskgeologiya. St. Petersburg: VSEGEI Publishing House. 845.
Reich, M., Kesler, S. E., Utsunomiya, S., Palenik, C. S., Chryssoulis, S. L., and Ewing, R. C. (2005). Solubility of gold in arsenian pyrite. Geochim. Cosmochim. Acta 69, 2781–2796. doi:10.1016/j.gca.2005.01.011
Reich, M., Simon, A., Deditius, A., Barra, F., Chryssoulis, S., Lagas, G., et al. (2016). Trace element signature of pyrite from the los colorados iron oxide-apatite (IOA) deposit, Chile: a missing link between andean IOA and iron oxide copper-gold systems. Econ. Geol. 111, 743–761. doi:10.2113/econgeo.111.3.743
Ridley, J. R., and Diamond, L. W. (2000). Fluid chemistry of orogenic lode gold deposits and implication for genetic models. Gold 2000 Rev. Econ. Geol. 13, 141–162. doi:10.5382/Rev.13.04
Roedder, E. (1984). “Fluid inclusions,” in Reviews in mineralogy. Editor H. P. Ribbe (Washington DC: Mineralogical Society of America), 12, 1–644.
Roman, N., Reich, M., Leisen, M., Morata, D., Barra, F., and Deditius, A. P. (2019). Geochemical and micro-textural fingerprints of boiling in pyrite. Geochim Cosmochim Acta 246, 60–85. doi:10.1016/j.gca.2018.11.034
Sazonov, A. M., Kirik, S. D., Silyanov, S. A., Bayukov, Y. A., and Tishin, P. A. (2016). Typomorphism of arsenopyrite of the blagodatnoye and olympiada gold deposits (yenisei ridge). Mineralogy 3, 53–70. (in Russian) https://elibrary.ru/wzvrof.
Sharp, Z. D. (1990). A laser-based microanalytical method for the in situ determination of oxygen isotope ratios of silicates and oxides. Geochim. Cosmochim. Acta. 54, 1353–1357. doi:10.1016/0016-7037(90)90160-m
Soloviev, S. G., Kryazhev, S. G., Dvurechenskaya, S. S., Vasyukov, V. E., Shumilin, D. A., and Voskresensky, K. I. (2019). The superlarge Malmyzh porphyry Cu-Au deposit, Sikhote-Alin, eastern Russia: igneous geochemistry, hydrothermal alteration, mineralization, and fluid inclusion characteristics. Ore Geol. Rev. 113, 103112. doi:10.1016/j.oregeorev.2019.103112
Tan, B., Ni, P., Li, S.-N., Xiang, H.-L., Wang, G.-G., Chi, Z., et al. (2020). Geological, fluid inclusion, and H–O–C–S–Pb isotopic constraints on the genesis of the Shuangqishan gold deposit, Fujian, China. J. Geochem. Explor. 214, 106544. doi:10.1016/j.gexplo.2020.106544
Thiery, R., Kerkhof, A. M., and Dubessy, J. (1994). νX properties of CH4-CO2 and CO2-N2 fluid inclusions: modeling for T < 31 ºC and P < 400 bars. Eur. J. Mineral. 6, 753–771.
Toro, J., Miller, E. L., Prokopiev, A. V., Zhang, X., and Veselovskiy, R. (2016). Mesozoic orogens of the arctic from novaya zemlya to Alaska. J. Geol. Soc. 173 (6), 989–1006. doi:10.1144/jgs2016-083
Tyukova, E. E., and Voroshin, S. V. (2008). Isotopic composition of sulfur in sulfides from ores and host rocks of the Upper Kolyma region (Magadan region). Russ. J. Pac. Geol. 27, 29–43. doi:10.1007/s11720-008-1003-y
Valley, J. W., Kitchen, N., Kohn, M. J., Niendorf, C. R., and Spicuzza, M. J. (1995). UWG-2, a garnet standard for oxygen isotope ratios: strategies for high precision and accuracy with laser heating. Geochim. Cosmochim. Acta. 59, 5223–5231. doi:10.1016/0016-7037(95)00386-x
Velivetskaya, T. A., Ignatiev, A. V., Yakovenko, V. V., and Vysotskiy, S. V. (2019). An improved femtosecond laser-ablation fluorination method for measurements of sulfur isotopic anomalies (δ33S and δ36S) in sulfides with high precision. Rapid Commun. Mass Spectrom. 33, 1722–1729. doi:10.1002/rcm.8528
Vikent’eva, O. V., Prokofiev, V. Y., Gamyanin, G. N., Bortnikov, N. S., and Goryachev, N. A. (2018). Intrusion-related gold-bismuth deposits of North-East Russia: PTX parameters and sources of hydrothermal fluids. Ore Geol. Rev. 102, 240–259. doi:10.1016/j.oregeorev.2018.09.004
Warr, L. N. (2021). IMA-CNMNC approved mineral symbols. Mineral. Mag. 85 (3), 1–30. doi:10.1180/mgm.2021.43
Wilkinson, J. (2001). Fluid inclusions in hydrothermal ore deposits. Lithos 55, 229–272. doi:10.1016/S0024-4937(00)00047-5
Yang, L., Wang, Q., Groves, D. I., Lu, S. L., Huajian, W. P., Peng, W., et al. (2021). Multiple orogenic gold mineralization events in a collisional orogen: insights from an extruded terrane along the southeastern margin of the Tibetan Plateau. J. Struct. Geol. 147, 104333. doi:10.1016/j.jsg.2021.104333
Yardley, B. W. D., and Bodnar, R. J. (2014). Fluids in the continental crust. Geochem. Perspect. 3 (1), 1–127. doi:10.7185/geochempersp.3.1
Zaitsev, A. I., Fridovsky, V. Y., Vernikovskaya, A. E., Kudrin, M. V., Yakovleva, K. Y., and Kadilnikov, P. I. (2018). Rb-Sr isotopic study of basites of the Tarynsky dike complex of the ore-magmatic system (North-East of Russia). Russ. Geol. 5, 50–61.
Keywords: geology, mineral, (S-O) isotope, Badran gold deposit, eastern Siberia
Citation: Fridovsky V, Kryazhev S, Polufuntikova L, Kudrin M and Anisimova G (2024) Geology, fluid inclusions, mineral and (S-O) isotope chemistry of the Badran orogenic Au deposit, Yana-Kolyma belt, eastern Siberia: implications for ore genesis. Front. Earth Sci. 12:1340112. doi: 10.3389/feart.2024.1340112
Received: 17 November 2023; Accepted: 19 January 2024;
Published: 16 February 2024.
Edited by:
Yi Zheng, Sun Yat-sen University, ChinaReviewed by:
Pura Alfonso, Universitat Politecnica de Catalunya, SpainPei Ni, Nanjing University, China
Copyright © 2024 Fridovsky, Kryazhev, Polufuntikova, Kudrin and Anisimova. This is an open-access article distributed under the terms of the Creative Commons Attribution License (CC BY). The use, distribution or reproduction in other forums is permitted, provided the original author(s) and the copyright owner(s) are credited and that the original publication in this journal is cited, in accordance with accepted academic practice. No use, distribution or reproduction is permitted which does not comply with these terms.
*Correspondence: Valery Fridovsky, ZnJpZG92c2t5QGRpYW1vbmQueXNuLnJ1