
94% of researchers rate our articles as excellent or good
Learn more about the work of our research integrity team to safeguard the quality of each article we publish.
Find out more
ORIGINAL RESEARCH article
Front. Earth Sci., 06 March 2024
Sec. Hydrosphere
Volume 12 - 2024 | https://doi.org/10.3389/feart.2024.1339822
This article is part of the Research TopicMicroplastic and Nanoplastic Fate and Transport in Groundwater, Surface Water, and Soil Ecosystems: Occurrence, Methods, and PerspectiveView all 4 articles
 Peter Conowall1*†
 Kathryn M. Schreiner1,2*†
 Joseph Marchand1,2†
 Elizabeth C. Minor1,2†
 Casey W. Schoenebeck3†
 Melissa A. Maurer-Jones2†
 Thomas R. Hrabik4†
Microplastic (<5 mm) pollution has been documented globally throughout freshwater and marine ecosystems. Exposure to and ingestion of microplastics presents a threat to the health of aquatic and marine organisms and humans through the consumption of fish and crustaceans. Understanding the factors which influence microplastic ingestion by fish is a key step in predicting the potential health risks. Drivers of microplastic consumption have been studied in lab settings, but there has been limited ability to confirm in field studies. Here we examine the roles and contributions of feeding guild, pelagic microplastic concentrations, and fish length to microplastic consumption by three species of fish across four lake ecosystems in Minnesota, United States. Fish samples were collected in the summers of 2019 and 2020 and processed to determine variability in microplastic ingestion. Identifying particles between 0.18 and 5 mm, plastic ingestion ranged from 0.6 microplastics fish−1 in Elk Lake (low surface water microplastics) bluegill to 1.09 microplastics fish-1 in White Iron Lake (moderate surface water microplastics) cisco. Results indicate that microplastic consumption by filter feeding cisco is driven by surface water microplastic concentrations, while microplastic consumption by visual feeding bluegill and yellow perch is not. Additionally, the high variability of ingestion between lake ecosystems coupled with the complex behavior of some fish species presents difficulties in identifying primary drivers of microplastic consumption that would be broadly applicable across ecosystems and species.
Understanding the drivers of microplastic (plastic particles < 5 mm) exposure to ecosystems, organisms, and humans is increasingly important owing to the potential ramifications for public health and safety. The rapid rise of plastic production to satisfy the many uses by both consumers and industry has resulted in widespread pollution of microplastics to freshwater and marine ecosystems (Carpenter and Smith, 1972; Wong et al., 1974; Browne et al., 2010; Cole et al., 2011; Eriksen et al., 2013; Conowall et al., 2023). Due to the high use of plastics both commercially and by consumers, plastic pollution is often associated with urban areas and anthropogenic activity (Fendall and Sewell, 2009; Driedger et al., 2015; Napper et al., 2015; Crew et al., 2020). Distribution and fluxes of microplastics can be influenced by factors such as wastewater treatment plant outflows, runoff, and atmospheric deposition (Crew et al., 2020; Evangeliou et al., 2020; Freeman et al., 2020; Kumar et al., 2021; Rehm et al., 2021; Han et al., 2022). Additionally, due to their small size, microplastics are readily transported via the atmosphere and are deposited into both urban and remote ecosystems (Free et al., 2014; Dris et al., 2016; Allen et al., 2019; Enyoh et al., 2019; Chen et al., 2020; Negrete Velasco et al., 2020; Conowall et al., 2023). Due to the widespread distribution of microplastics in the environment, microplastic ingestion by aquatic organisms has been documented across various ecosystems (Devriese et al., 2015; Peters et al., 2018; Roch et al., 2019; Barboza et al., 2020; Wootton et al., 2021b; Parker et al., 2021).
Ingestion of microplastics poses several risks to the health of aquatic organisms. The ingestion of microplastics has the potential to cause digestive stress on organisms through intestinal accumulation and inflammation and digestive blockages (Cong et al., 2019; Mak et al., 2019; Qiang and Cheng, 2019). Chemicals associated with plastics pose a greater potential risk to organisms than the physical impacts of microplastics, especially at environmentally relevant concentrations of microplastics. Plastic additives such as bisphenol-A (BPA), brominated phthalates, and nonylphenol are identified as endocrine disruptors and pose threats to aquatic organisms (Hermabessiere et al., 2017; Chen et al., 2019). In fish with plastics present in their gut, gills, and muscle, tissue BPA levels have been found to be elevated with evidence of neurotoxicity (Barboza et al., 2020; Barboza et al., 2020). Additionally, leached nonylphenol from plastic bags can lead to mortality for some fish species (Hamlin et al., 2015). There is also evidence that microplastics sorb several potentially toxic chemicals, including non-ionic organic compounds, non-polar organic compounds, and heavy metals (Hüffer and Hofmann, 2016; Richard et al., 2019; Uber et al., 2019). Furthermore, mercury accumulation has been observed at elevated levels in the liver and gills of fish that have been exposed to microplastics (Barboza et al., 2018). The toxicity of plastics to fish and the potential risk to humans of elevated levels of chemicals such as mercury and BPA make it vital to understand the potential levels of microplastic exposure to fish in natural environments.
Modes of uptake of microplastics by fish and primary drivers of microplastic exposure and ingestion have been identified in a variety of ecosystems. Roch et al. (2020) categorized microplastic ingestion into either active uptake, as a result of misidentification of microplastics as food, or passive uptake through accidental ingestion or trophic transfer. Active uptake in vivo by fish of microplastics that resembled food occurred at higher rates than plastics which did not (Roch et al., 2019). Feeding strategy, fish length, water column microplastic concentration, and food availability have all been identified as significant drivers of microplastic consumption by fish in vivo (Peixoto et al., 2019; Roch et al., 2020). However, few studies have explored the important drivers of fish consumption in the wild. In one example, fish collected off the coast of Australia consumed higher levels of microplastics than fish sampled from Fiji, which may be evidence of increased exposure and ingestion by fish in closer proximity to higher human activity and thus higher microplastic pollution (Wootton et al., 2021a). There is also evidence of the impact of feeding strategy on microplastic consumption, where filter feeding resulted in increased microplastic consumption by fish collected from the wild (Collard et al., 2017; Feng et al., 2019). Yet, there is limited evidence comparing different species, both within and across ecosystems. This study aims to fill these knowledge gaps by examining the uptake of microplastics by fish species using different feeding modes in multiple contrasting lake ecosystems in Minnesota, United States.
Four Minnesota lakes from the group of 25 MN DNR Sentinel study lakes were selected for this study based on their varying fish habitat, and food web structure. These included Elk Lake, Peltier Lake, Ten Mile Lake, and White Iron Lake (Figure 1). Importantly, these lakes also sustain populations of target study fish with different feeding strategies. Elk, Ten Mile, and White Iron Lakes sustain healthy populations of filter feeding cisco (Coregonus artedi). Visual feeding yellow perch (Perca flavescens) are present in Elk Lake and White Iron Lake, while visual feeding bluegill (Lepomis macrochirus) are present in Elk, Ten Mile, and Peltier Lakes. Elk Lake is a relatively small (littoral area = 0.3 km2, surface area = 1.2 km2) lake with a maximum depth of 28.3 m (Sentinel Lakes, 2022) (Table 1). Peltier Lake is also relatively small (littoral area = 1.7 km2, surface area = 2.2 km2) with a maximum depth of only 5.5 m (Sentinel Lakes, 2022) (Table 1). Ten Mile Lake is much larger (littoral area = 5.3 km2, surface area = 20.2 km2) than Elk Lake and Peltier Lake with a maximum depth of 63.4 m (Sentinel Lakes, 2022) (Table 1). Lastly, White Iron Lake has a relatively large littoral area (6.5 km2) and surface area (13.1 km2) with a maximum depth of 14.3 m (Sentinel Lakes, 2022) (Table 1).
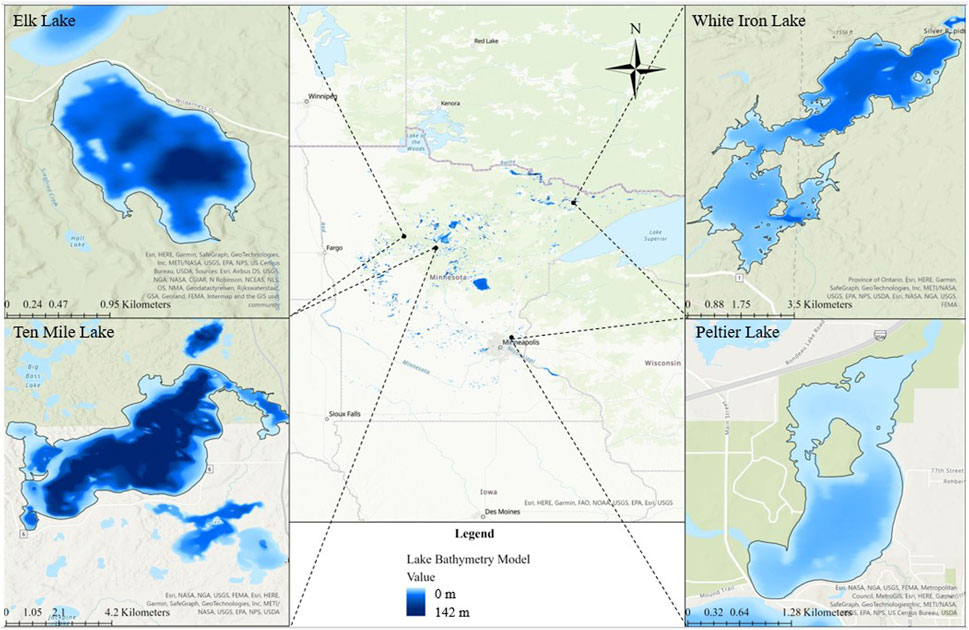
FIGURE 1. Map of Minnesota and the four study lakes. Bathymetry is shown for each lake to demonstrate the differences in depth of the lakes, with light blue representing shallower areas and darker blue representing deeper areas of the lakes.
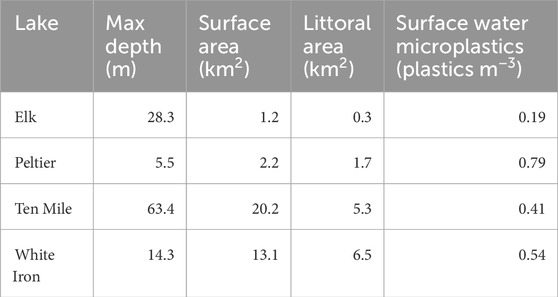
TABLE 1. Characteristics describing the lakes where fish were collected. Lake metrics are from the Minnesota DNR Sentinel Lakes website (Sentinel Lakes, 2022). Surface water microplastic concentrations are based on the findings of Conowall et al. (2023). White Iron Lake surface water microplastics concentration is based only on samples from the north basin of the lake, where the fish were collected (Conowall et al., 2023).
Pelagic surface water microplastic concentrations were determined by Conowall et al. (2023). Using manta tow nets, samples were collected between June 6th and 20 June 2019 and between June 11th and 2 July 2020. Samples were processed using a Fenton’s reagent and peroxidation protocol, with a lower size cutoff of 330 µm (Conowall et al., 2023). Pelagic microplastic concentrations are used in this study as an indicator and comparison of potential microplastic exposure of fish species in the study lakes. Microplastics concentrations in the lakes ranged from 0.19 microplastics m−3 in Elk Lake to 0.79 microplastics m−3 in Peltier Lake (Conowall et al., 2023) (Table 1). More details and information about the study lakes can be found in Conowall et al. (2023).
All three fish species occupy comparable trophic positions but display differences in feeding behavior. Bluegill and yellow perch primarily visually identify and forage on individual prey (Laarman, 2004; Moran et al., 2018; Richmond et al., 2004). Bluegill are a warm-water species which spend the majority of their time in the littoral zone (Laarman, 2004; Moran et al., 2018). They are often generalists which feed primarily zooplankton and macroinvertebrates but may display multiple ecomorphs according to occupied habitat and diet (Laarman, 2004; Moran et al., 2018). Yellow perch have highly variable life histories, undergoing ontogenetic dietary shifts that transition from feeding initially on zooplankton, to macroinvertebrates as juveniles, to small fish as adults (Lott et al., 1996; Kraemer et al., 2012). Often, these shifts in diet are accompanied by spatial shifts between the littoral and pelagic zone, with smaller juvenile perch occupying primarily the littoral zone and larger mature perch occupying either the pelagic or littoral zone (Kraemer et al., 2012). Cisco, in contrast to bluegill and yellow perch, consume primarily zooplankton and utilize rapid gulping to create filter force, allowing them to ingest multiple prey at once (Janssen, 1978) which facilitates filter feeding. Cisco are a cold-water fish which occupy primarily the pelagic zone due to their need for higher oxygen and lower temperature levels (Ahrenstorff et al., 2013). Cisco display varying diel vertical migration (DVM) patterns across different lake ecosystems, based largely on temperature and resource availability, but generally demonstrate similar feeding behavior and occupy similar habitat across ecosystems (Ahrenstorff et al., 2013).
Fish were collected during the summers of 2019 and 2020. Bluegill and yellow perch were collected from the littoral zone of the study lakes and were sampled on the same dates as pelagic surface water samples. Bluegill were collected from Elk, Ten Mile, and Peltier Lakes and yellow perch were collected from Elk and White Iron Lakes. Electrofishing was the primary method of collection of bluegill and yellow perch, and rod and reel were used as a secondary method of collection if it was deemed necessary. Cisco were collected using vertical gill nets (monofilament nylon) with mesh sizes of 9.5, 12.7, 19.0, 25.4, 31.8, 38.1, and 44.5 mm, which were deployed in the pelagic zone of study lakes and left overnight. Cisco were collected later in the summer following stratification between July 19th and 6 September 2019 and between July 6th and 26 August 2020. We acknowledge that there is a gap between the time of cisco sampling and bluegill and yellow perch sampling, but we do not believe it significantly alters the ability to compare the consumption of these species. Importantly, yellow perch and cisco were only collected from the north basin of White Iron Lake, and thus only the surface water microplastic samples from the north basin of the lake were used for the pelagic microplastic concentration and comparisons of color and morphology (Conowall et al., 2023). Collected fish that remained alive were dispatched quickly by cranial displacement. Fish were then wrapped in combusted (450°C for at least 4 h to remove all organic carbon) aluminum foil and stored on ice until they could be stored in a freezer to await dissection.
130 fish (61 cisco, 35 bluegill and 34 yellow perch) were dissected and processed for analysis of microplastics within their gastrointestinal (GI) tract. A minimum of 10 fish of each species were dissected and processed from each lake. In total, 39 fish were examined from Elk Lake (10 bluegill, 19 cisco, 10 yellow perch), 15 fish were examined from Peltier Lake (15 bluegill), 20 fish were examined from Ten Mile Lake (10 bluegill, 10 cisco) and 56 fish from White Iron Lake (32 cisco, 24 yellow perch). Fish of various lengths were dissected to capture individuals of different life stages and diets and assess possible variations in microplastic consumption associated with size or maturity. Frozen fish were thawed prior to dissection and the length and wet mass was recorded for each fish. Fish length was recorded from the forwardmost point of the head to the tip of the compressed tail. An initial incision was made at the anal vent of the fish with a sterile dissection scalpel. The incision was then extended from the anal vent up to the gills along the underside of the fish. Cuts were then made on the esophagus behind the gills and the intestines at the anal vent to disconnect the digestive tract from the fish. This stomach and intestines were isolated by carefully cutting connective tissue to remove other GI organs and excess tissue. The stomach and intestines were then wrapped in combusted aluminum foil and then freeze dried. Cotton lab coats and purple nitrile gloves were worn during dissection.
Enzymatic degradation was used as a gentle method for the removal of tissue and other organic material and was performed according to methods and recommendations by Löder et al. (2017). Freeze dried GI tracts were transferred to combusted pre-weighed glass jars and dry mass of the GI tracts were recorded. 30 mL of a filtered (0.45 μm MCE filter) 10% w/w sodium dodecyl sulfate (SDS) was added to samples and left to incubate at 50°C for 24 h. The SDS treatment step was performed to saturate cell residues to increase available surface area for enzymatic action. Following incubation, samples were filtered onto a 180 μm nylon mesh filter to remove excess SDS and contents were then rinsed back into their glass containers with Milli-Q water. 5 mL of prefiltered proteinase K (Sigma-Aldrich, Tritirachium album) solution was added to samples, accompanied by 25 mL of prefiltered tris(hydroxymethyl)aminomethane (Tris) (Sigma-Aldrich, ACS Grade) buffer (pH 9) was added to samples to satisfy the pH of optimum activity of proteinase K. Samples were then left to incubate for 48 h at approximately 50°C. Following proteinase treatment, a density separation step was performed to remove remaining high-density material. Approximately 6 g of sodium chloride (previously combusted at 450°C for at least 4 h) was added per 20 mL of solution to obtain a saturated salt solution (density of 1.2 g cm−3), which was then transferred to a foil covered long glass stem funnel with clipped silicone tubing attached. Samples were allowed to density separate overnight. Sodium chloride was chosen in place of higher density options such as zinc chloride due to its lower potential environmental concerns. Following this density separation, high density material was drained from the funnel if there was a visible high-density pellet of material at the bottom of the silicone tubing. The supernatant was then filtered onto a 0.45 μm filter and rinsed thoroughly with milli-Q water to remove any excess salt. High density fractions were filtered onto 180 μm nylon net filters and were examined under microscope if possible. The majority (124 out of 130) of high-density fractions were able to be examined, with only six samples having high density fractions which could not be examined due to an excess of high-density material. Notably, cisco most frequently had high density fractions that were too large to be examined, likely due to high levels of chitin from their zooplankton dominated diet. All filters which could be examined were carefully transferred to covered glass Petri dishes to dry prior to microscopic analysis.
Sample filters were examined under a microscope (Amscope 3.5x-90x LED Trinocular Zoom Stereo Microscope with digital camera) at ×40 magnification. Particles of interest were isolated and categorized based on morphology (fiber, film, foam, fragment, sphere or other) and color (Supplementary Table S3). Particles were measured based on the length of their longest dimension. A lower size limit of 180 µm was used, which was set by the 180 µm filter used in the enzymatic degradation step. A pressure test and melt test were performed on all particles suspected of being microplastics. The pressure test was performed as a preliminary test, by lightly applying pressure to a particle with the tip of a needle. Due to the plasticity and resiliency of plastics, microplastic particles are unlikely to break or crumble under light pressure. A melt test was then performed on all plastics as a confirmatory test, by placing a hot needle tip close to a particle of interest. Particles that melted were recorded as plastics and collected if possible and saved. A random subset of 19 microplastics was selected from the identified microplastics (112) for analysis of plastic chemical composition.
Microplastic composition was analyzed using either Pyrolysis-Gas Chromatography/Mass Spectrometry (Py-GC/MS) or Attenuated Total Reflectance-Fourier Transform Infrared Spectroscopy (ATR-FTIR). Py-GC/MS was performed using a pyrolysis and thermal desorption unit (TDU) (Gerstel GmbH and Co. KG) with a gas chromatograph (Agilent 7890 B) and mass spectrometer (Agilent 5977 A) (Hendrickson et al., 2018; Conowall et al., 2023). Either a splitless (<50 μg sample) or 1:100 split (>50 μg sample) injection was used for introduction of pyrolyzed sample to the column. Py-GC/MS data were compared to the National Institute of Standards and Technology (NIST) mass spectral library, as well as to plastic standards (PE, PP, PS, PVC, and PET) analyzed in-house using the same py-GC/MS conditions. Comparisons were also done according to recommendations from other published works with a focus on indicator ions for identification (Primpke et al., 2020; Bouzid et al., 2022). Samples were analyzed on the ATR-FTIR (Thermo Scientific Nicolet iS50) between wavenumbers 4,000–500 cm1 using a diamond crystal with 64 scans per sample at a resolution of 4 cm−1 and were compared to the Hummel Polymer Sample Library (Hebner and Maurer-Jones, 2020; Elmer-Dixon et al., 2022). Polymer analysis was transitioned from Py-GC/MS to FTIR due to higher positive identification rates of FTIR, especially for fibers.
Summative statistics such as frequency of occurrence (FO) and plastics per individual (PI) are reported as either a mean or mean ± standard error. Plastics per individual describes the number of plastics per fish while frequency of occurrence is representative of the proportion of fish from a group of data which had at least one plastic present within their GI tract. Plastic color and morphology are reported as a percentage of the total plastics isolated from the GI tracts of sample fish. All figures and analyses were performed using R (version 4.1.0). Data was visually determined to be non-normal and thus, non-parametric tests were chosen for statistical analysis.
First, microplastic consumption by all fish across all study lakes was examined using a Kruskal–Wallis rank-sum test to identify any difference in microplastic consumption (PI) across the study lakes regardless of feeding strategy. For the comparison of FO across lakes, fish were given either a value of 0 (no plastics present) or 1 (plastics present) and a chi-squared test was performed to analyze differences in frequency of microplastics consumed across lakes. Microplastic consumption by visual feeders and filter feeders was then compared in each study lake in which both were present using a Wilcox rank-sum test. For the comparison of FO by filter and visual feeders, chi-squared tests were performed for visual and filter feeders from each lake. Finally, Spearman’s rank correlation test was performed to test correlation between surface water microplastic concentrations and microplastics consumed by filter feeders and visual feeders.
Fish length was also considered as a possible influential driver of microplastic consumption by fish. To examine the influence of fish length on microplastic consumption, fish were separated based on species and examined on a lake-by-lake basis. Data was separated based on species and lake due to differences in potential microplastic exposure across lakes, as well as differences in fish body size in different lakes as well as different species. Spearman’s rank correlation tests were then used to compare microplastic consumption to fish length.
Finally, feeding strategy was compared to both colors and morphologies of microplastics isolated from the GI tracts of fish. This comparison was performed on the basis that microplastic consumption may be influenced by colors or morphologies of microplastics, based on prey characteristics (Lopes et al., 2020; Okamoto et al., 2022). Fisher’s exact test was performed to determine any difference in frequency in the colors and morphologies of microplastics consumed by filter feeding fish and visual feeding fish across all four lakes. Fisher’s exact test was also performed to compare the colors and morphologies of microplastics consumed by each species in lakes in which at least two species were sampled (Elk, Ten Mile, and White Iron Lakes). Lastly, Fisher’s exact test was performed to compare the colors and morphologies of surface water microplastics (n = 149) to plastics consumed by filter feeders and visual feeders respectively.
During sample collection and in the lab, natural fiber clothing and lab coats were worn to minimize possible contamination, although yellow synthetic life preservers were used during field sampling. All reactants and reagents were filtered through 0.45 µm mixed cellulose ester (MCE) filters after preparation to remove any potential microplastics. Glassware was combusted at 450°C prior to use if possible or rinsed vigorously with MilliQ water before reuse if combustion was not possible due to time constraints. Samples were kept covered with combusted aluminum foil as much as possible to minimize contamination from airborne fallout. A random subset of filters was chosen to be examined under microscopy by multiple technicians together to reduce observer bias during the microscopy steps.
Method blanks were performed to account for possible contamination through the dissection and processing steps. Method blanks followed all steps of the extraction, digestion, and density separation. Of the 10 processed method blanks, four contained plastics, with five plastics in total being isolated for an average of 0.5 microplastics blank−1. Of the five plastics isolated, four were yellow fragments and one was a blue fragment. We believe this contamination is from Kimax bottle lids that were used, which we discuss in more depth in the SI. We recognize this is a relatively high level of plastics per blank compared to our sample microplastic abundance. However, due to the dominance of fibers and relatively low proportion of yellow and blue fragments of similar size in our samples, we do not think this has a significant impact on our raw counts. It is possible though that this contributed to the elevated levels of fragments and yellow and blue microplastics in samples. In addition to method blanks, positive controls were also performed to test the recovery rate of the enzymatic degradation process. Positive controls were processed using the same methods as both samples and method blanks. Overall recovery was 91.1%, with 100% of fibers being recovered across the positive controls and 86.7% of spheres being recovered. Additional QA/QC information can be found in the SI.
Of the 130 processed fish, 62 (30 cisco, 15 bluegill, and 17 yellow perch) contained microplastics. The FO of microplastics within the GI tract of fish was thus 48% and the plastic counts per fish ranged from 0–4 plastics. The average PI of all fish was 0.86 ± 0.10 plastics. There was no statistical difference in the PI (p = 0.819) or FO (p = 0.981) of fish sampled from Elk (n = 39), Peltier (n = 15), Ten Mile (n = 20), or White Iron (n = 56) Lakes. Elk Lake had the lowest average PI (0.69 ± 0.14 plastics). Along with Elk Lake (46%), fish from Peltier (47%), Ten Mile (45%), and White Iron Lakes (50%) all had similar FO of plastics within their GI tracts, ranging from 45% to 50%. Of the study lakes, fish from White Iron Lake had the highest PI (1.04 ± 0.17 plastics). Ten Mile Lake fish had an average PI of 0.80 ± 0.24 plastics, followed by Peltier Lake fish with an average PI of 0.73 ± 0.25.
To first examine the relationship between feeding strategy and microplastic consumption, we examined and compared the FO and PI of visual and filter feeders in Elk, Ten Mile and White Iron Lakes (Figure 2). In Elk Lake, visual feeding fish had a higher FO (50%) and PI (0.75 ± 0.20 plastics) than filter feeding fish (42% and 0.63 ± 0.20 plastics), but the differences were not statistically significant (p = 0.592 and p = 0.859 respectively). Ten Mile Lake and White Iron Lake filter feeding fish had higher FO and PI than visual feeding fish. In Ten Mile Lake, 50% of filter feeding fish had plastics in their GI tract and had an average PI of 0.90 ± 0.38 plastics compared to only 40% of visual feeding fish with an average of 0.70 ± 0.30 plastics. However, these differences in FO (p = 1.00) and PI (0.739) were not significantly different. In White Iron Lake, the differences in FO (p = 0.787) and PI (p = 0.605) were not significant, despite filter feeding cisco having the highest FO (53%) and PI (1.09 ± 0.22 plastics) observed across all study lakes. Visual feeding fish in White Iron Lake had a lower FO (46%) and PI (0.96 ± 0.27 plastics) than White Iron Lake filter feeders but did consume on average more plastics than fish from the other study lakes.
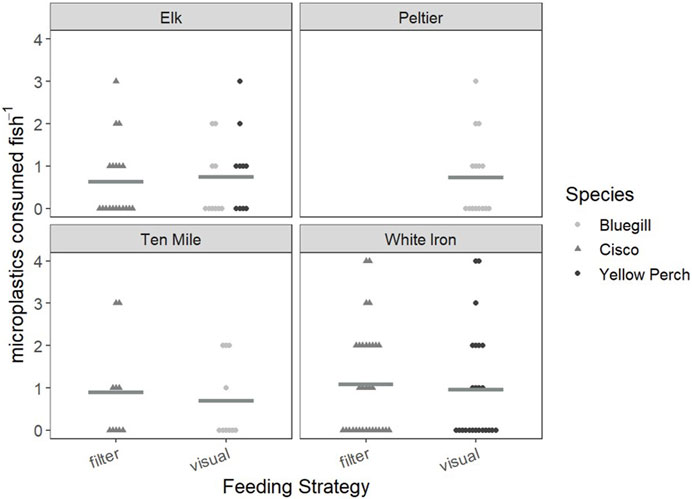
FIGURE 2. Consumed microplastics plotted as a comparison of visual and filter feeding fish in each lake. Cisco are represented by gray triangles, while bluegill and yellow perch are represented by light gray and black points, respectively. Mean values for the consumed microplastics of each feeding strategy in each lake are represented by horizontal Gy bars.
To visualize and compare the combined influence of feeding strategy and microplastic exposure, fish were separated by feeding strategy and microplastic consumption by filter and visual feeding fish and the correlation between surface water concentration and microplastic consumption was tested. When examining the relationship visually, there appears to be a positive relationship between surface water microplastics and microplastic consumption by filter feeders, which was not observed in visual feeders (Figure 3). However, the correlation between surface water concentrations and consumption was not significant for filter feeders (rs = 0.153, p = 0.240) or visual feeders (rs = 8.57 × 10⁻⁴, p = 0.994) according to Spearman’s rank correlation tests.
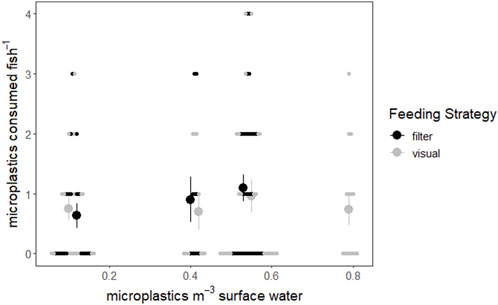
FIGURE 3. Consumed microplastics plotted relative to surface water microplastic concentrations of the study lakes (Conowall et al., 2023). Filter feeding fish are represented by black points while visual feeding fish are represented by light gray points. Small points represent individuals, while large points represent the average number of microplastics consumed by fish of that feeding strategy at that surface water microplastic concentration. Vertical lines represent the standard error of microplastics consumed by fish.
To examine the relationship between fish length and microplastic consumption, fish were grouped into 5 cm size bins in increments from 5 to 40 cm and plotted to visualize trends in microplastic consumption relative to size (Figure 4). There was no consistent relationship observed between length and plastic consumption of the three species. Spearman’s rank correlation on microplastic consumption relative to bluegill length were not significant for Elk (rs = −0.457, p = 0.184), Peltier (rs = −0.370, p = 0.174), or Ten Mile Lake (rs = −0.160, p = 0.659), but the relationship between fish length and microplastic consumption in bluegill may still be important. There was no observed relationship between yellow perch length and microplastics consumed in Elk or White Iron Lakes and correlations were not significant for either lake (rs = −0.337, p = 0.341 and rs = −0.204, p = 0.339 respectively). Cisco had no relationship between length and microplastics consumed in Elk (rs = 0.153, p = 0.531) and White Iron (rs = 0.060, p = 0.744) Lakes. However, despite the very small size range of cisco in Ten Mile Lake (2.8 cm), there was a significant correlation (rs = 0.907, p = 2.87 × 10⁻⁴) between cisco length and microplastics consumed.
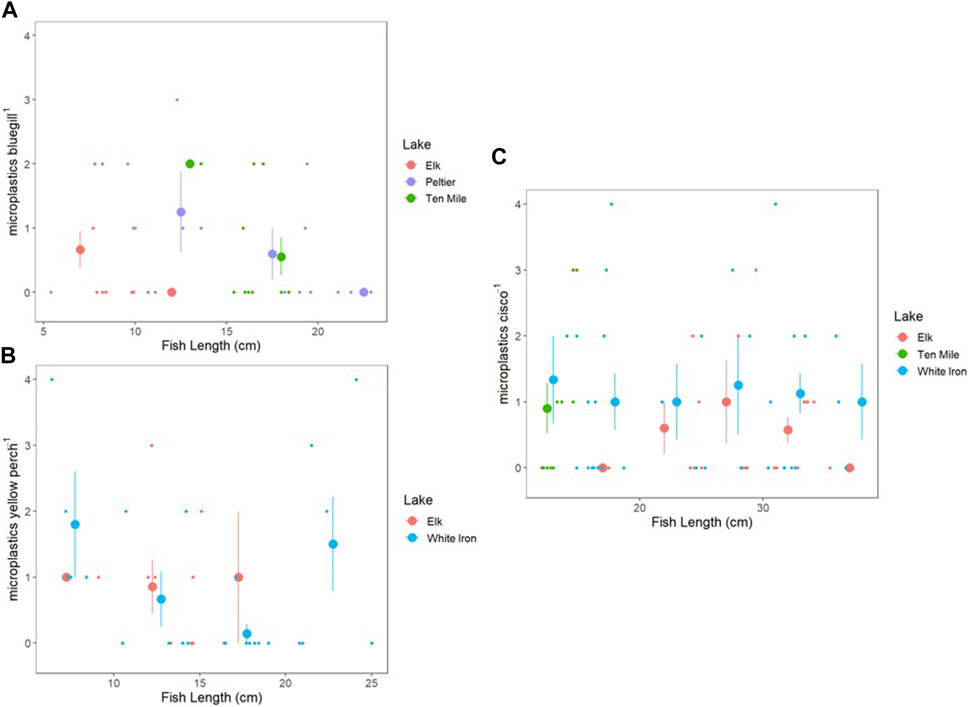
FIGURE 4. Microplastic consumption plotted in relation to fish length for bluegill (A), yellow perch (B), and cisco (C). Small points are individual fish, and large points represent the average PI of fish from 5 cm size bins, with vertical bars representing the standard error of the mean PI. Size bins are 5–10, 10–15, 15–20, 20–25, 25–30, 30–35, and 35–40 cm.
Of identified plastics (112 plastics), fibers were the dominant morphology, comprising 60.7% of all identified plastics (Figure 5). Fragments (33.0%) were the second most common plastics morphology identified within the GI tracts of fish, while films (5.4%) and plastics labeled as “other” (0.9%) were the least common. Blue (32.1%) and black (17.9%) were the most common plastic colors within fish GI tracts. Translucent and transparent (17.0%) plastics were frequently identified, as well as red and yellow plastics which comprised 8.9% and 9.8% of the plastics isolated from fish respectively. No other color of plastics accounted for more than 5% of the total plastics isolated and all other colors combined accounted for only 14.3% of the isolated plastics. Of the plastics analyzed with either Py-GC/MS or FTIR, 74.7% (14) were positively identified as plastics and 26.3% (5) had insufficient data to be identified. Polyethylene was the dominant plastic type (31.6%) among analyzed plastics and 26.3% could be confirmed as polymers, but the specific plastic type could not be confirmed. Polypropylene (1), alkyd resin (1), and nylon (1) each made up 5.3% of the plastics analyzed. For comparison, polypropylene (18.9%) was the most abundant plastic identified in pelagic surface water samples, followed by polyethylene (10.8%) and polystyrene (2.7%) (Conowall et al., 2023). In surface water samples, 13.5% of particles were confirmed as plastics but had insufficient data to be classified as a plastic type and 54.1% of particles could not be confirmed as plastics (Conowall et al., 2023). However, Conowall et al., 2023 only used Py-GC/MS for the identification of microplastic composition, which limits comparisons of composition of plastics consumed by fish and in surface waters due to a difference in methodology and a much lower positive identification rate (45.9%) compared to this study.
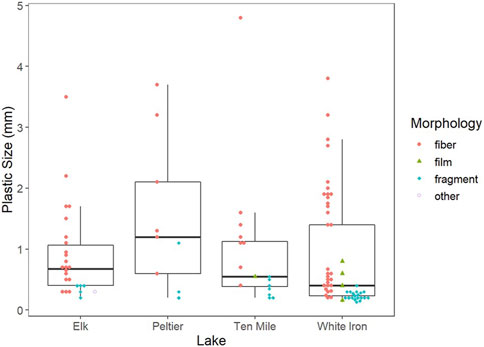
FIGURE 5. Morphology and size of microplastics isolated from fish from the four study lakes. Boxplots represent the first and third quartiles while bold horizontal lines represent the median plastic size from each lake. The whiskers extend from the hinge to the largest value no further than 1.5 * the interquartile range.
The colors and morphologies of consumed microplastics were also separated by feeding strategy to examine any differences in morphologies of microplastics consumed by fish of different feeding strategies. Morphologies of microplastics consumed by filter and visual feeders were very similar, with fibers (61% and 67% respectively) and fragments (35% and 27%) comprising the consumed plastics of each species almost entirely. Films accounted for 4% of plastics consumed by filter and visual feeders. There was no statistical difference in the morphologies of plastics consumed by filter and visual feeders across study lakes (p = 0.814). There were differences in the colors of plastics consumed by filter and visual feeders, but the differences were not statistically significant (p = 0.105). Blue plastics were the most frequently consumed microplastic color by filter feeders (29%) and visual feeders (29%) but black microplastics made up a larger portion of plastics consumed by visual feeders (27%) than filter feeders (12%). Additionally, while fish of both feeding strategies consumed similar amounts of translucent/transparent plastics (filter = 16%; visual = 15%), visual feeders (13%) consumed more yellow plastics than filter feeders (6%). Filter feeding fish consumed slightly more red plastics (12%) than visual feeders (8%) and all other colors made up a much larger proportion of plastics consumed by filter feeders (24%) than visual feeders (8%). Filter feeders and visual feeders did display differences in the colors and morphologies of microplastics when compared to surface waters. Filter feeders consumed higher proportions of blue, red, and yellow plastics and less translucent/transparent plastics than were found in surface waters (p = 5.00 × 10⁻⁴) (Figure S-1). Visual feeders consumed higher proportions of blue and black plastics and less translucent/transparent plastics than were found in surface waters (p = 5.00 × 10⁻⁴) (Figure S-1). Both filter feeders and visual feeders consumed relatively more fragments than were found in surface water samples (p = 1.50 × 10⁻³ and p = 0.027 respectively).
Additionally, morphologies and colors of consumed plastics by each species were compared in study lakes containing at least two study species (Figure S-2). Morphologies and colors of plastics consumed by bluegill, cisco and yellow perch were similar in Elk Lake and no statistical difference was observed (p = 0.923 and p = 0.0.634), despite bluegill consuming relatively more black plastics than cisco or yellow perch. In Ten Mile Lake, cisco (three red plastics) consumed more red microplastics than bluegill (0 red microplastics) but otherwise the colors of microplastics consumed were very similar and overall there was no statistical difference (p = 0.405). There was also no statistical difference in morphologies of plastics consumed by cisco and bluegill in Ten Mile Lake (p = 0.786). In White Iron Lake, the colors of microplastics consumed by cisco and yellow perch were very similar and there was no statistical difference (p = 0.591). Cisco (12 fragments) did consume notably more fragments than yellow perch (four fragments), but the difference in plastic morphology extracted from cisco and yellow perch was not significant (p = 0.252).
The average FO of plastics in fish from this study was comparable to the findings by Parker et al. (2021) (mean FO= 45%, median FO= 39%) and a review of studies on freshwater fishes by Wootton et al. (2021b) (mean FO = 43%, median FO = 40%). The average PI of fish from this study is lower than what has been observed in freshwater fishes (average PI = 3.49; median PI = 1.67) and in wild caught fishes (average PI = 2.64; median PI = 0.82) (Wootton et al., 2021b; Parker et al., 2021). In total, 12 out of 34 studies reviewed by Parker et al. (2021) reported a PI value of 0.90 or lower. Additionally, the FO and PI from this study are comparable to studies on freshwater fish with lower, comparable, and higher microplastic size cutoffs, indicating that low plastic consumption in this study is not simply a result of the size cutoff of this study (Peters and Bratton, 2016; Zhang et al., 2017; Horton et al., 2018; Andrade et al., 2019). Fish observed in this study not only consumed fewer microplastics than many other freshwater studies, but there was a lack of significant difference in microplastic consumption in fish found in the four study lakes. Literature has shown that increased microplastic exposure is directly related to increased microplastic uptake by aquatic species (Peixoto et al., 2019; Roch et al., 2020). Importantly, our findings do not directly support these studies, because fish did not show varying levels of microplastic consumption in the different study lakes, despite there being differences in surface water microplastic concentrations (Table 1).
In addition to there being no observable difference in microplastic consumption across the study lakes, fish from Peltier Lake had the second lowest PI of fish from the four study lakes, despite Peltier Lake having the highest surface water microplastic concentrations (Conowall et al., 2023). However, only bluegill were collected from Peltier Lake, which lacked a filter feeding species to collect, and bluegill as a species had the lowest FO and PI across all study lakes. When comparing microplastic consumption by fish in lakes containing both filter feeders and visual feeders (Elk, Ten Mile, and White Iron), there was a slight increase in microplastic consumption with increased surface water microplastic concentration, with average microplastic consumption increasing from a PI of 0.69 in Elk Lake, to 0.80 in Ten Mile Lake and 0.81 in White Iron Lake. This pattern suggests a possible relationship between surface water microplastic concentrations and microplastic consumption, but there was no statistical difference in microplastic consumption across study lakes and Ten Mile and White Iron Lakes show almost no difference in FO or PL.
Despite correlation tests of surface water microplastic concentrations and microplastic consumption not being significant, the difference observed between filter and visual feeders may still be important when considering the relationship between feeding strategy, microplastics pollution, and microplastics consumption. There is a potentially important positive trend between the mean PI and FO of filter feeding fish and surface water microplastic concentrations from Elk to Ten Mile to White Iron Lakes (Table 2; Figure 3). This relationship is supported by studies which have identified filter feeding as influential to increasing microplastic consumption in wild fish (Collard et al., 2017; Feng et al., 2019). In contrast, visual feeding fish do not display any consistent relationship between consumed microplastics and surface water microplastic concentrations (Figure 3). This could be explained by the varying impacts which feeding strategies can have on microplastic ingestion, such as lack of selectivity in filter feeders leading to increased microplastic consumption and more random colors and morphologies of microplastics consumed than visual feeders of similar trophic level (Collard et al., 2019; 2017; Wootton et al., 2021b; Parker et al., 2021). The slight differences in colors of plastics consumed by filter and visual feeders may offer further support of this in the study lake, but conclusions cannot be made due to a lack of significance. While the differences in colors and morphologies of plastics consumed by filter feeders and visual feeders were not significantly different, they did both exhibit differences in colors and morphologies of consumed plastics when compared to surface water microplastics. These findings suggest that while there may be some relationship between surface water microplastic concentrations and microplastic consumption, this relationship is not observed consistently in fish with different behavioral traits in the study lakes. Importantly, in lakes with overall lower microplastics loading, and thus lower levels of exposure, the influence of microplastic exposure on microplastic consumption may be reduced relative to other influential factors, such as feeding strategy, living habitat, diet, and trophic position (Collard et al., 2019; Jiang et al., 2022). Further, the role of microplastic exposure on microplastic consumption may be reduced or altered in natural settings compared to lab settings because of interacting drivers of consumption in complex natural systems (Peixoto et al., 2019; Roch et al., 2020). The difference in the observed relationships between microplastic concentrations and microplastic consumption by visual and filter feeding fish points to an interaction between feeding strategy and microplastic exposure in these more complex natural ecosystems. This interaction is likely further complicated by factors such as feeding habitat and diet, which have been identified as influential to microplastic consumption and are more variable across species and ecosystems (Wootton et al., 2021b; Parker et al., 2021).
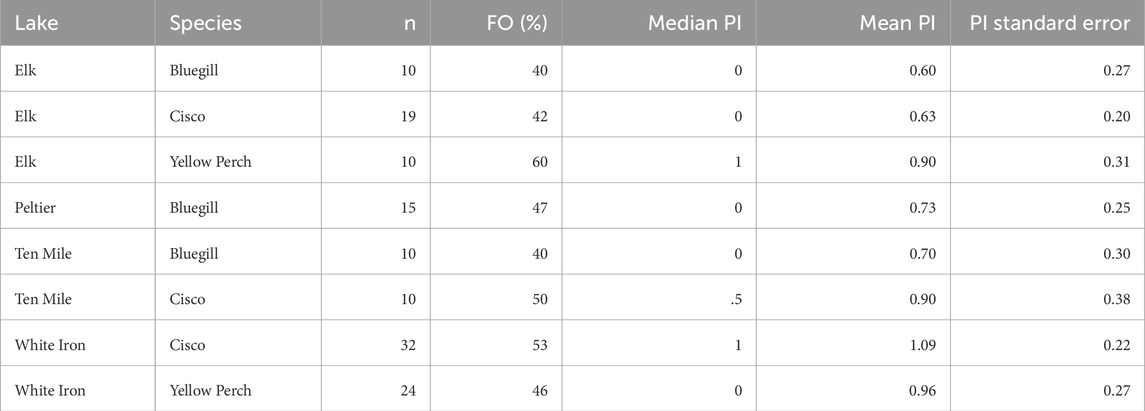
TABLE 2. Summative values for the microplastic consumption by the different species collected from each study lake including: frequency of occurrence (FO) of microplastics in the GI tracts, median plastics per individual (PI) and the PI mean and standard error.
Bluegill consumed the fewest microplastics across all three species. Additionally, bluegill consumed similar numbers of microplastics in all three lakes: Elk (FO = 40.0%; PI = 0.60), Peltier (FO = 46.7%; PI = 0.73), and Ten Mile (FO = 40.0%; PI = 0.7) lakes (Table 2). Despite surface water microplastics concentrations ranging from 0.19 microplastics m-3 in Elk Lake to 0.79 microplastics m−3 in Peltier Lake (Conowall et al., 2023), there was no significant correlation between plastic consumption by bluegill and surface water microplastic concentrations. While the average PI of bluegill from these lakes does increase slightly with increased surface water microplastic concentrations, the difference is much less than would be expected based on the difference in surface water microplastic concentrations and theoretical exposure levels. This may be an indication that bluegill as a species are selective as consumers and able to avoid microplastic consumption despite higher levels of exposure. This may also indicate that they are less resource limited than other species. Bluegill have generally similar diets across ecosystems consisting largely of zooplankton and aquatic insects and are known to be selective feeders (Laarman, 2004). However, populations can diverge into littoral populations and pelagic ecomorphs, with pelagic bluegill feeding primarily on zooplankton and littoral bluegill displaying more generalist feeding behavior (Moran et al., 2018). Additionally, pelagic bluegill displayed different approach behavior and feeding behavior to attempt to capture numerous zooplankton at once (Moran et al., 2018). This variability in both habitat and feeding behavior increases the potential variability of microplastic uptake routes of bluegill both within a single lake, but also across lakes. This may further contribute to the lack of a relationship between surface water microplastic concentrations and microplastic consumption by bluegill.
Yellow perch also showed similar levels of microplastic consumption in both study lakes from which they were sampled but consumed notably more microplastics than bluegill (Table 2). This was unexpected because bluegill and yellow perch are both visual feeders and occupy similar trophic positions in most ecosystems. Based on the cited importance of feeding strategy, feeding habitat, and diet, it would be expected that yellow perch and bluegill would consume a similar number of microplastics (Peixoto et al., 2019; Roch et al., 2020; Wootton et al., 2021b; Parker et al., 2021). While selectivity may contribute to the lack of variation of microplastic consumption by yellow perch across lakes, these fish also likely have high levels of variability of microplastic exposure and consumption throughout their lives based on ontogenetic dietary shifts. Variation in feeding strategy often accompanies dietary transitions, which range from zooplankton to macroinvertebrates to small fish as yellow perch increase in size. Changes in diet are often variable across lakes based on food web structure, habitat, and resource availability (Lott et al., 1996; Kraemer et al., 2012). Levels of microplastic consumption as well as routes of uptake may change in response to ontogenetic dietary shifts. Based on the wide size range of fish examined here, these shifts were certainly represented, but based on the variability in these shifts between lakes, it is impossible to accurately compare the possible effects on microplastic consumption. Variability in behavior and habitat that has been observed in both bluegill and yellow perch makes it increasingly difficult to predict the levels of microplastic consumption by a single species across different lakes, but also similar species within the same lake. This is evident by the difference in consumption by bluegill (FO = 40% and PI = 0.6) and yellow perch (FO = 60% and PI = 0.9) from Elk Lake, despite being two species that are visual feeders, occupy similar trophic positions and habitat and thus similar levels of theoretical microplastic exposure. This likely highlights the subtle differences between species and the effects of those differences on microplastic consumption. For example, similar trophic position does not inherently mean similar diet, as bluegill may depend on organisms such as Chironomidae, Cladocera, and terrestrial insects in the same lakes where yellow perch feed largely on aquatic insect larvae, Leptodora, and crayfish (Laarman, 2004). While these diets are similar in terms of overall trophic position, they may provide notable differences in terms of microplastic exposure and consumption.
In contrast to bluegill and yellow perch, cisco offer a simpler comparison across lakes because they show little variation in habitat across lakes due in large part to their temperature and oxygen sensitivity. Cisco can vary in behavior and diet from lake to lake depending on zooplankton communities as well as resource availability. However, they are primarily zooplanktivores, feeding sometimes on insect larva such as Hexagenia spp. or Chaoborus spp. (Ahrenstorff et al., 2013). Cisco occupy pelagic zones and display diel vertical migration (DVM) patterns, which can vary from lake to lake depending on resource availability, environmental conditions, and risk of predation (Loch, 1974; Shields and Underhill, 1993; Ahrenstorff et al., 2013). This general consistency in behavior and habitat, despite differences across lake ecosystems, is likely a reason that there is a simpler relationship between microplastic consumption by cisco and microplastic exposure based on surface water microplastic concentrations. Individual cisco both within and across different lake ecosystems likely demonstrate overall similar behavior and thus have similar possible routes of exposure and uptake. Thus, drivers of microplastic consumption by pelagic filter feeding fish like cisco may be more predictable, depending more heavily on surface water microplastic concentrations. In contrast, species such as bluegill and yellow perch have highly variable life histories and thus, high variability in habitat, diet, and feeding behavior. This is likely coupled with a higher variability of drivers of microplastic consumption, making it difficult to predict. Fish size may also be an influential factor in microplastic consumption, with increased body size and increased gape size resulting in increased consumption (Parker et al., 2021; Gad and Midway, 2022). However, after grouping fish into 5 cm size bins by species, no clear relationship was observed between fish length and microplastic consumption (Figure 4). In Ten Mile Lake, there was a positive correlation between cisco length and microplastic consumption. However, all cisco from Ten Mile Lake fell within a single size bin, with a total size range of only 2.8 cm, making it hard to compare to the other cisco populations sampled. Based on this small size separation and no observed relationship between cisco length and microplastic consumption in the other study lakes, we are hesitant to make any concrete claims or conclusions about any relationship between cisco length and microplastic consumption. White Iron Lake yellow perch showed a decrease in average microplastic consumption from 0–20 cm before a shift to an increase in average microplastic consumption from 20–25 cm (Figure 4). This may be evidence of a shift in microplastic consumption in response to ontogenetic shifts which result in changes to both diet and feeding habitat and presumably could impact microplastic consumption (Kraemer et al., 2012). However, these shifts may occur differently across lakes based on resource availability, making any comparison across lakes difficult, and any interpretations or conclusions very speculative. Lastly, there was a slight decrease in average microplastic consumption with increased bluegill length in all three lakes (Elk, Peltier, and Ten Mile), but correlation tests were not significant (Figure 4). It is possible this relationship is ecologically important, but with the data presented here it is unclear. It is possible that density dependence and resource limitation are relaxed in larger fish. It is also possible that larger fish seek larger prey items and in turn, there is less mistaken identity between small prey and microplastics.
While microplastic consumption across the three species shows high variability in drivers, all species exhibit active uptake as indicated by the difference in both colors and morphologies of microplastics within fish GI tracts when compared to surface water microplastics. While fibers were the dominant morphology in both fish (61.9%) and surface waters (78.0%), they made up a smaller proportion of the total number of plastics isolated from fish samples than from surface water particulate samples (Conowall et al., 2023) (Figure 5). More notably, however, fragments were the second most common morphology within fish (33.0%) but were one of the least common morphologies in surface waters (5.2%) of the study lakes (Conowall et al., 2023). A similar difference in plastic morphology between water particulate and fish samples was observed in the Fengshan River, where across six sites, fibers comprised 81%–99% of water microplastics but only 50%–66% of microplastics extracted from fish (Tien et al., 2020). Fragments made up a much larger proportion of microplastics extracted from fish in the Fengshan River, making up 34%–50% of the extracted plastics across four sites, which was much higher than in water samples (1%–19%) (Tien et al., 2020). The difference in morphology between surface water and fish-ingested microplastics was accompanied by differences in the colors of microplastics from fish and surface waters. Despite translucent and transparent plastics making up over half of the microplastics in surface waters of the study lakes, they comprised less than one-fifth of the plastics isolated from fish (Conowall et al., 2023). Additionally, black and blue microplastics, which combined to make up only 21.4% of the plastics in surface waters, comprised 50% of the microplastics within fish (Conowall et al., 2023). This may be an indication of consumption as a result of active uptake of microplastics that have been mistaken as prey. It is likely that colorful (black, blue, and red) fragments and fibers more closely resemble prey items than translucent plastics, which is known to increase the likelihood of consumption by fish (de Sá et al., 2015; Roch et al., 2020). Further, differences in prey items between species may result in differences in the colors and morphologies of microplastics consumed by different species. The differences observed in colors and morphologies of microplastics consumed by the different species in each lake may point to this, despite the differences not being significant. More data, such as additional fish as well as diet data would be needed to determine if these differences may be related to differences in diet between species.
Together, our findings highlight the complexities of explaining microplastic consumption by fishes and other aquatic organisms. Exposure levels and factors such as diet, feeding strategy, and feeding habitat almost certainly impact microplastic consumption, but this serves as evidence that predicting microplastic consumption by fishes is dependent on more than just these simple factors. Independent variables that extend beyond simple loading and abundance of microplastics but include ecosystem characteristics such as resource availability that may be dependent on species (i.e., feeding strategy, size, and general diet) and study system (i.e., microplastic concentrations, eutrophication, and available habitat) may shed light on key mechanisms underlying consumption. Fish behavior is remarkably complex between species but can also be highly variable within one species across ecosystems (Lott et al., 1996; Kraemer et al., 2012; Laarman, 2004; Ahrenstorff et al., 2013; Moran et al., 2018). This variability in behavior, along with the multiple possible routes of microplastics uptake (i.e., confusion with food, accidental passive uptake, or trophic transfer) make comparisons or predictions of microplastic consumption very difficult without more detailed data to provide information about the behavior of study fishes. Implementing detailed diet surveys, more in depth food web research, or stable isotopic data into microplastics research would allow for more detailed interpretation and understanding of what more nuanced factors may be impacting microplastics consumption. Diet surveys and food web research allow for an improved understanding of the diets of study fishes (Lott et al., 1996; Ahrenstorff et al., 2013; Laarman, 2004). Additionally, stable isotopic data can give crucial information about trophic level, diet, and feeding habitat and has been used to successfully classify ontogenetic shifts in species like yellow perch (Kraemer et al., 2012). Implementation of either or both these methods may allow for the comparison of specific diets, food items, and/or trophic position to plastic consumption. This could provide important information about how diets, feeding strategies, and habitats impact microplastic consumption, regardless of species. This information would allow for another option of determining what roles habitat and trophic position may play in microplastic consumption, as well as provide insight as to the potential roles of passive or active uptake of microplastics. Even with the detailed cisco behavior that has been documented on these study lakes, it is difficult to interpret the data without the aforementioned information.
Microplastic consumption by bluegill, cisco, and yellow perch differed among ecosystems, however hypothesized drivers including surface water microplastics concentrations and feeding strategy did not appear to be primary factors related to observed variability. Microplastic consumption by cisco appeared related to surface water microplastic concentrations, but consumption by visual feeding bluegill and yellow perch was driven by a more complex suite of factors. This may indicate that differences in drivers such as feeding strategy, ontogeny, population dynamics and ecosystem conditions may alter the response (microplastic consumption) to microplastic exposure. The findings of this study point to the overall low variability of microplastic consumption across species and ecosystems, despite differences in exposure, feeding strategy, and feeding habitat. This low variance highlights the difficulties of comparing microplastic consumption of fish due to complex species traits and ecosystem characteristics and suggests we do not have a clear understanding of the different drivers of microplastics consumption by fish.
The original contributions presented in the study are included in the article/Supplementary Material, further inquiries can be directed to the corresponding author.
Ethical approval was not required for the study involving animals in accordance with the local legislation and institutional requirements because we were volunteering with MN DNR while collecting fish. Since MN DNR doesn’t need an animal care protocol to collect fish, there was no IACUC requirement.
PC: Conceptualization, Data curation, Formal Analysis, Methodology, Writing–original draft, Writing–review and editing, Investigation. KS: Conceptualization, Funding acquisition, Resources, Supervision, Writing–review and editing, Data curation, Formal Analysis, Investigation, Methodology, Project administration. JM: Data curation, Formal Analysis, Writing–review and editing, Investigation. EM: Conceptualization, Funding acquisition, Methodology, Resources, Writing–review and editing, Data curation, Formal Analysis, Investigation, Project administration. CS: Conceptualization, Funding acquisition, Methodology, Resources, Writing–review and editing, Data curation, Formal Analysis, Investigation, Project administration. MM-J: Methodology, Resources, Writing–review and editing, Data curation, Formal Analysis. TH: Conceptualization, Funding acquisition, Methodology, Resources, Writing–review and editing, Data curation, Formal Analysis, Investigation, Project administration.
The author(s) declare that financial support was received for the research, authorship, and/or publication of this article. Funding for this project was provided to KS, EM, TH, and CS by the Minnesota Environment and Natural Resources Trust Fund as recommended by the Legislative-Citizen Commission on Minnesota Resources (LCCMR), ML 2019, First Special Session, Chp. 4, Art. 2, Sec. 2, Subd. 04d.
The authors acknowledge the laboratory support of Julia Agnich, Sarah Grosshuesch, and Roselynd Lin, as well as field support from Will French and the Minnesota Department of Natural Resources Sentinel Lakes Program.
The authors declare that the research was conducted in the absence of any commercial or financial relationships that could be construed as a potential conflict of interest.
All claims expressed in this article are solely those of the authors and do not necessarily represent those of their affiliated organizations, or those of the publisher, the editors and the reviewers. Any product that may be evaluated in this article, or claim that may be made by its manufacturer, is not guaranteed or endorsed by the publisher.
The Supplementary Material for this article can be found online at: https://www.frontiersin.org/articles/10.3389/feart.2024.1339822/full#supplementary-material
Ahrenstorff, T. D., Hrabik, T. R., Jacobson, P. C., and Pereira, D. L. (2013). Food resource effects on diel movements and body size of cisco in north-temperate lakes. Oecologia 173, 1309–1320. doi:10.1007/s00442-013-2719-3
Allen, S., Allen, D., Phoenix, V. R., Le Roux, G., Durántez Jiménez, P., Simonneau, A., et al. (2019). Atmospheric transport and deposition of microplastics in a remote mountain catchment. Nat. Geosci. 12, 339–344. doi:10.1038/s41561-019-0335-5
Andrade, M. C., Winemiller, K. O., Barbosa, P. S., Fortunati, A., Chelazzi, D., Cincinelli, A., et al. (2019). First account of plastic pollution impacting freshwater fishes in the Amazon: ingestion of plastic debris by piranhas and other serrasalmids with diverse feeding habits. Environ. Pollut. 244, 766–773. doi:10.1016/j.envpol.2018.10.088
Barboza, L., Cunha, S., Monteiro, C., Fernandes, J., and Guilhermino, L. (2020a). Bisphenol A and its analogs in muscle and liver of fish from the North East Atlantic Ocean in relation to microplastic contamination. Exposure and risk to human consumers. J. Hazard. Mater. 393, 122419. doi:10.1016/j.jhazmat.2020.122419
Barboza, L. G. A., Lopes, C., Oliveira, P., Bessa, F., Otero, V., Henriques, B., et al. (2020b). Microplastics in wild fish from North East Atlantic Ocean and its potential for causing neurotoxic effects, lipid oxidative damage, and human health risks associated with ingestion exposure. Sci. Total Environ. 717, 134625. doi:10.1016/j.scitotenv.2019.134625
Barboza, L. G. A., Vieira, L. R., Branco, V., Carvalho, C., and Guilhermino, L. (2018). Microplastics increase mercury bioconcentration in gills and bioaccumulation in the liver, and cause oxidative stress and damage in Dicentrarchus labrax juveniles. Sci. Rep. 8, 15655. doi:10.1038/s41598-018-34125-z
Bouzid, N., Anquetil, C., Dris, R., Gasperi, J., Tassin, B., and Derenne, S. (2022). Quantification of microplastics by pyrolysis coupled with gas Chromatography and mass Spectrometry in sediments: challenges and implications. Microplastics 1, 229–239. doi:10.3390/microplastics1020016
Browne, M. A., Galloway, T. S., and Thompson, R. C. (2010). Spatial patterns of plastic debris along estuarine shorelines. Environ. Sci. Technol. 44, 3404–3409. doi:10.1021/es903784e
Carpenter, E. J., and Smith, K. L. (1972). Plastics on the sargasso sea surface. Science 175, 1240–1241. doi:10.1126/science.175.4027.1240
Chen, Q., Allgeier, A., Yin, D., and Hollert, H. (2019). Leaching of endocrine disrupting chemicals from marine microplastics and mesoplastics under common life stress conditions. Environ. Int. 130, 104938. doi:10.1016/j.envint.2019.104938
Chen, X., Chen, X., Zhao, Y., Zhou, H., Xiong, X., and Wu, C. (2020). Effects of microplastic biofilms on nutrient cycling in simulated freshwater systems. Sci. Total Environ. 719, 137276. doi:10.1016/j.scitotenv.2020.137276
Cole, M., Lindeque, P., Halsband, C., and Galloway, T. S. (2011). Microplastics as contaminants in the marine environment: a review. Mar. Pollut. Bull. 62, 2588–2597. doi:10.1016/j.marpolbul.2011.09.025
Collard, F., Gasperi, J., Gabrielsen, G. W., and Tassin, B. (2019). Plastic particle ingestion by wild freshwater fish: a critical review. Environ. Sci. Technol. 53, 12974–12988. doi:10.1021/acs.est.9b03083
Collard, F., Gilbert, B., Eppe, G., Roos, L., Compère, P., Das, K., et al. (2017). Morphology of the filtration apparatus of three planktivorous fishes and relation with ingested anthropogenic particles. Mar. Pollut. Bull. 116, 182–191. doi:10.1016/j.marpolbul.2016.12.067
Cong, Y., Jin, F., Tian, M., Wang, J., Shi, H., Wang, Y., et al. (2019). Ingestion, egestion and post-exposure effects of polystyrene microspheres on marine medaka (Oryzias melastigma). Chemosphere 228, 93–100. doi:10.1016/j.chemosphere.2019.04.098
Conowall, P., Schreiner, K. M., Minor, E. C., Hrabik, T., and Schoenebeck, C. W. (2023). Variability of microplastic loading and retention in four inland lakes in Minnesota, USA. Environ. Pollut. 328, 121573. doi:10.1016/j.envpol.2023.121573
Crew, A., Gregory-Eaves, I., and Ricciardi, A. (2020). Distribution, abundance, and diversity of microplastics in the upper St. Lawrence River. Environ. Pollut. 260, 113994. doi:10.1016/j.envpol.2020.113994
de Sá, L. C., Luís, L. G., and Guilhermino, L. (2015). Effects of microplastics on juveniles of the common goby (Pomatoschistus microps): confusion with prey, reduction of the predatory performance and efficiency, and possible influence of developmental conditions. Environ. Pollut. 196, 359–362. doi:10.1016/j.envpol.2014.10.026
Devriese, L. I., van der Meulen, M. D., Maes, T., Bekaert, K., Paul-Pont, I., Frère, L., et al. (2015). Microplastic contamination in brown shrimp (Crangon crangon, linnaeus 1758) from coastal waters of the southern north sea and channel area. Mar. Pollut. Bull. 98, 179–187. doi:10.1016/j.marpolbul.2015.06.051
Driedger, A. G. J., Dürr, H. H., Mitchell, K., and Van Cappellen, P. (2015). Plastic debris in the laurentian great lakes: a review. J. Gt. Lakes. Res. 41, 9–19. doi:10.1016/j.jglr.2014.12.020
Dris, R., Gasperi, J., Saad, M., Mirande, C., and Tassin, B. (2016). Synthetic fibers in atmospheric fallout: a source of microplastics in the environment? Mar. Pollut. Bull. 104, 290–293. doi:10.1016/j.marpolbul.2016.01.006
Elmer-Dixon, M. M., Fawcett, L. P., Hinderliter, B. R., and Maurer-Jones, M. A. (2022). Could superficial chiral nanostructures Be the reason polyethylene yellows as it ages? ACS Appl. Polym. Mater. 4, 6458–6465. doi:10.1021/acsapm.2c00877
Enyoh, C. E., Verla, A. W., Verla, E. N., Ibe, F. C., and Amaobi, C. E. (2019). Airborne microplastics: a review study on method for analysis, occurrence, movement and risks. Environ. Monit. Assess. 191, 668. doi:10.1007/s10661-019-7842-0
Eriksen, M., Mason, S., Wilson, S., Box, C., Zellers, A., Edwards, W., et al. (2013). Microplastic pollution in the surface waters of the laurentian great lakes. Mar. Pollut. Bull. 77, 177–182. doi:10.1016/j.marpolbul.2013.10.007
Evangeliou, N., Grythe, H., Klimont, Z., Heyes, C., Eckhardt, S., Lopez-Aparicio, S., et al. (2020). Atmospheric transport is a major pathway of microplastics to remote regions. Nat. Commun. 11, 3381. doi:10.1038/s41467-020-17201-9
Fendall, L. S., and Sewell, M. A. (2009). Contributing to marine pollution by washing your face: microplastics in facial cleansers. Mar. Pollut. Bull. 58, 1225–1228. doi:10.1016/j.marpolbul.2009.04.025
Feng, Z., Zhang, T., Li, Y., He, X., Wang, R., Xu, J., et al. (2019). The accumulation of microplastics in fish from an important fish farm and mariculture area, Haizhou Bay, China. Sci. Total Environ. 696, 133948. doi:10.1016/j.scitotenv.2019.133948
Free, C. M., Jensen, O. P., Mason, S. A., Eriksen, M., Williamson, N. J., and Boldgiv, B. (2014). High-levels of microplastic pollution in a large, remote, mountain lake. Mar. Pollut. Bull. 85, 156–163. doi:10.1016/j.marpolbul.2014.06.001
Freeman, S., Booth, A. M., Sabbah, I., Tiller, R., Dierking, J., Klun, K., et al. (2020). Between source and sea: the role of wastewater treatment in reducing marine microplastics. J. Environ. Manag. 266, 110642. doi:10.1016/j.jenvman.2020.110642
Gad, A. K., and Midway, S. R. (2022). Relationship of microplastics to body size for two estuarine fishes. Microplastics 1, 211–220. doi:10.3390/microplastics1010014
Hamlin, H. J., Marciano, K., and Downs, C. A. (2015). Migration of nonylphenol from food-grade plastic is toxic to the coral reef fish species Pseudochromis fridmani. Chemosphere 139, 223–228. doi:10.1016/j.chemosphere.2015.06.032
Han, N., Zhao, Q., Ao, H., Hu, H., and Wu, C. (2022). Horizontal transport of macro- and microplastics on soil surface by rainfall induced surface runoff as affected by vegetations. Sci. Total Environ. 831, 154989. doi:10.1016/j.scitotenv.2022.154989
Hebner, T. S., and Maurer-Jones, M. A. (2020). Characterizing microplastic size and morphology of photodegraded polymers placed in simulated moving water conditions. Environ. Sci. Process. Impacts 22, 398–407. doi:10.1039/C9EM00475K
Hendrickson, E., Minor, E. C., and Schreiner, K. (2018). Microplastic abundance and composition in western lake superior as determined via microscopy, pyr-GC/MS, and FTIR. Environ. Sci. Technol. 52, 1787–1796. doi:10.1021/acs.est.7b05829
Hermabessiere, L., Dehaut, A., Paul-Pont, I., Lacroix, C., Jezequel, R., Soudant, P., et al. (2017). Occurrence and effects of plastic additives on marine environments and organisms: a review. Chemosphere 182, 781–793. doi:10.1016/j.chemosphere.2017.05.096
Horton, A. A., Jürgens, M. D., Lahive, E., van Bodegom, P. M., and Vijver, M. G. (2018). The influence of exposure and physiology on microplastic ingestion by the freshwater fish Rutilus rutilus (roach) in the River Thames, UK. Environ. Pollut. 236, 188–194. doi:10.1016/j.envpol.2018.01.044
Hüffer, T., and Hofmann, T. (2016). Sorption of non-polar organic compounds by micro-sized plastic particles in aqueous solution. Environ. Pollut. 214, 194–201. doi:10.1016/j.envpol.2016.04.018
Janssen, J. (1978). Feeding-behavior repertoire of the alewife, Alosa pseudoharengus, and the ciscoes Coregonus hoyi and C. Artedii. J. Fish. Res. Bd. Can. 35, 249–253. doi:10.1139/f78-040
Jiang, Y., Yang, F., Hassan Kazmi, S. S. U., Zhao, Y., Chen, M., and Wang, J. (2022). A review of microplastic pollution in seawater, sediments and organisms of the Chinese coastal and marginal seas. Chemosphere 286, 131677. doi:10.1016/j.chemosphere.2021.131677
Kraemer, L. D., Evans, D., and Dillon, P. J. (2012). The impacts of ontogenetic dietary shifts in yellow perch (Perca flavescens) on Zn and Hg accumulation. Ecotoxicol. Environ. Saf. 78, 246–252. doi:10.1016/j.ecoenv.2011.11.033
Kumar, R., Sharma, P., Verma, A., Jha, P. K., Singh, P., Gupta, P. K., et al. (2021). Effect of physical characteristics and hydrodynamic conditions on transport and deposition of microplastics in riverine ecosystem. Water 13, 2710. doi:10.3390/w13192710
Laarman, P. W. (2004). The food and feeding habits of the bluegill and yellow perch in lakes with good and poor fishing. Michigan Department of Natural Resources. Fisheries research report: 1790.
Loch, J. S. (1974). Phenotypic variation in the lake whitefish, Coregonus clupeaformis, induced by introduction into a new environment. J. Fish. Res. Bd. Can. 31, 55–62. doi:10.1139/f74-008
Löder, M. G. J., Imhof, H. K., Ladehoff, M., Löschel, L. A., Lorenz, C., Mintenig, S., et al. (2017). Enzymatic purification of microplastics in environmental samples. Environ. Sci. Technol. 51, 14283–14292. doi:10.1021/acs.est.7b03055
Lopes, C., Raimundo, J., Caetano, M., and Garrido, S. (2020). Microplastic ingestion and diet composition of planktivorous fish. Limnol. Oceanogr. Lett. 5, 103–112. doi:10.1002/lol2.10144
Lott, J., Willis, D., and Lucchesi, D. (1996). Relationship of food habits to yellow perch growth and population structure in south Dakota lakes. J. Freshw. Ecol. 11, 27–37. doi:10.1080/02705060.1996.9663491
Mak, C. W., Ching-Fong Yeung, K., and Chan, K. M. (2019). Acute toxic effects of polyethylene microplastic on adult zebrafish. Ecotoxicol. Environ. Saf. 182, 109442. doi:10.1016/j.ecoenv.2019.109442
Moran, C. J., Rzucidlo, C. L., Carlowicz, R. M., and Gerry, S. P. (2018). Stereotyped feeding behaviors of polyphenic bluegill sunfish. J. Zoology 305, 116–123. doi:10.1111/jzo.12540
Napper, I. E., Bakir, A., Rowland, S. J., and Thompson, R. C. (2015). Characterisation, quantity and sorptive properties of microplastics extracted from cosmetics. Mar. Pollut. Bull. 99, 178–185. doi:10.1016/j.marpolbul.2015.07.029
Negrete Velasco, A. de J., Rard, L., Blois, W., Lebrun, D., Lebrun, F., Pothe, F., et al. (2020). Microplastic and fibre contamination in a remote mountain lake in Switzerland. Water 12, 2410. doi:10.3390/w12092410
Okamoto, K., Nomura, M., Horie, Y., and Okamura, H. (2022). Color preferences and gastrointestinal-tract retention times of microplastics by freshwater and marine fishes. Environ. Pollut. 304, 119253. doi:10.1016/j.envpol.2022.119253
Parker, B., Andreou, D., Green, I. D., and Britton, J. R. (2021). Microplastics in freshwater fishes: occurrence, impacts and future perspectives. Fish Fish. 22, 467–488. doi:10.1111/faf.12528
Peixoto, D., Amorim, J., Pinheiro, C., Oliva-Teles, L., Varó, I., de Medeiros Rocha, R., et al. (2019). Uptake and effects of different concentrations of spherical polymer microparticles on Artemia franciscana. Ecotoxicol. Environ. Saf. 176, 211–218. doi:10.1016/j.ecoenv.2019.03.100
Peters, C. A., and Bratton, S. P. (2016). Urbanization is a major influence on microplastic ingestion by sunfish in the Brazos River Basin, Central Texas, USA. Environ. Pollut. 210, 380–387. doi:10.1016/j.envpol.2016.01.018
Peters, C. A., Hendrickson, E., Minor, E. C., Schreiner, K., Halbur, J., and Bratton, S. P. (2018). Pyr-GC/MS analysis of microplastics extracted from the stomach content of benthivore fish from the Texas Gulf Coast. Mar. Pollut. Bull. 137, 91–95. doi:10.1016/j.marpolbul.2018.09.049
Primpke, S., Christiansen, S. H., Cowger, W., De Frond, H., Deshpande, A., Fischer, M., et al. (2020). Critical assessment of analytical methods for the harmonized and cost-efficient analysis of microplastics. Appl. Spectrosc. 74, 1012–1047. doi:10.1177/0003702820921465
Qiang, L., and Cheng, J. (2019). Exposure to microplastics decreases swimming competence in larval zebrafish (Danio rerio). Ecotoxicol. Environ. Saf. 176, 226–233. doi:10.1016/j.ecoenv.2019.03.088
Rehm, R., Zeyer, T., Schmidt, A., and Fiener, P. (2021). Soil erosion as transport pathway of microplastic from agriculture soils to aquatic ecosystems. Sci. Total Environ. 795, 148774. doi:10.1016/j.scitotenv.2021.148774
Richard, H., Carpenter, E. J., Komada, T., Palmer, P. T., and Rochman, C. M. (2019). Biofilm facilitates metal accumulation onto microplastics in estuarine waters. Sci. Total Environ. 683, 600–608. doi:10.1016/j.scitotenv.2019.04.331
Richmond, H. E., Hrabik, T. R., and Mensinger, A. F. (2004). Light intensity, prey detection and foraging mechanisms of age 0 year yellow perch. J. Fish Biol. 65, 195–205. doi:10.1111/j.0022-1112.2004.00444.x
Roch, S., Friedrich, C., and Brinker, A. (2020). Uptake routes of microplastics in fishes: practical and theoretical approaches to test existing theories. Sci. Rep. 10, 3896. doi:10.1038/s41598-020-60630-1
Roch, S., Walter, T., Ittner, L. D., Friedrich, C., and Brinker, A. (2019). A systematic study of the microplastic burden in freshwater fishes of south-western Germany - are we searching at the right scale? Sci. Total Environ. 689, 1001–1011. doi:10.1016/j.scitotenv.2019.06.404
Sentinel lakes (2022). Minnesota department of natural resources. Available at: https://www.dnr.state.mn.us/fisheries/slice/sentinel-lakes.html (Accessed May 1, 2022).
Shields, B. A., and Underhill, J. C. (1993). Phenotypic plasticity of a transplanted population of dwarf cisco,Coregonus artedii. Environ. Biol. Fish. 37, 9–23. doi:10.1007/BF00000708
Tien, C.-J., Wang, Z.-X., and Chen, C. S. (2020). Microplastics in water, sediment and fish from the Fengshan River system: relationship to aquatic factors and accumulation of polycyclic aromatic hydrocarbons by fish. Environ. Pollut. 265, 114962. doi:10.1016/j.envpol.2020.114962
Uber, T. H., Hüffer, T., Planitz, S., and Schmidt, T. C. (2019). Sorption of non-ionic organic compounds by polystyrene in water. Sci. Total Environ. 682, 348–355. doi:10.1016/j.scitotenv.2019.05.040
Wong, C. S., Green, D. R., and Cretney, W. J. (1974). Quantitative tar and plastic waste distributions in the pacific ocean. Nature 247, 30–32. doi:10.1038/247030a0
Wootton, N., Ferreira, M., Reis-Santos, P., and Gillanders, B. M. (2021a). A comparison of microplastic in fish from Australia and Fiji. Front. Mar. Sci. 8. doi:10.3389/fmars.2021.690991
Wootton, N., Reis-Santos, P., and Gillanders, B. M. (2021b). Microplastic in fish – a global synthesis. Rev. Fish. Biol. Fish. 31, 753–771. doi:10.1007/s11160-021-09684-6
Keywords: microplastics, fish, microplastic pollution, microplastic ingestion, pollution
Citation: Conowall P, Schreiner KM, Marchand J, Minor EC, Schoenebeck CW, Maurer-Jones MA and Hrabik TR (2024) Variability in the drivers of microplastic consumption by fish across four lake ecosystems. Front. Earth Sci. 12:1339822. doi: 10.3389/feart.2024.1339822
Received: 16 November 2023; Accepted: 12 February 2024;
Published: 06 March 2024.
Edited by:
Uwe Schneidewind, University of Birmingham, United KingdomReviewed by:
Lee Haverson, University of Birmingham, United KingdomCopyright © 2024 Conowall, Schreiner, Marchand, Minor, Schoenebeck, Maurer-Jones and Hrabik. This is an open-access article distributed under the terms of the Creative Commons Attribution License (CC BY). The use, distribution or reproduction in other forums is permitted, provided the original author(s) and the copyright owner(s) are credited and that the original publication in this journal is cited, in accordance with accepted academic practice. No use, distribution or reproduction is permitted which does not comply with these terms.
*Correspondence: Peter Conowall, Y29ub3dhbGxAd2lzYy5lZHU=; Kathryn M. Schreiner, a3NjaHJlaW5AZC51bW4uZWR1
†ORCID: Peter Conowall, orcid.org/0000-0002-6256-2573; Kathryn M. Schreiner, orcid.org/0000-0002-7600-5006; Joseph Marchand, orcid.org/0009-0000-3607-5790; Elizabeth Minor, orcid.org/0000-0001-6930-9338; Thomas Hrabik, orcid.org/0000-0001-8947-2589; Casey Schoenebeck, orcid.org/0000-0002-4787-574X; Melissa Maurer-Jones, orcid.org/0000-0003-1517-6183
Disclaimer: All claims expressed in this article are solely those of the authors and do not necessarily represent those of their affiliated organizations, or those of the publisher, the editors and the reviewers. Any product that may be evaluated in this article or claim that may be made by its manufacturer is not guaranteed or endorsed by the publisher.
Research integrity at Frontiers
Learn more about the work of our research integrity team to safeguard the quality of each article we publish.