 Chonghan Yu
 Xin Su
 Xuan Ding1
 Chunhui Tao
- 1School of Ocean Sciences, China University of Geosciences, Beijing, China
- 2Ministry of Natural Resources, Second Institute of Oceanography, Hangzhou, China
The Agulhas Return Current (ARC) transports warm tropical and subtropical waters eastward into the southern Indian Ocean. It plays a crucial role in the oceanographic connections between the Indian, Atlantic, and Southern oceans. Modern oceanographic observations show that the latitudinal position of the ARC varies interannually. However, its historical positional variations remain poorly understood. Calcareous nannofossils can be a good indicator of ancient current migration, although their record in the Southwest Indian Ocean is poorly studied. This research aims to understand the characteristics and downcore variation of the calcareous nannofossil assemblages and trace the record of the ancient ARC. To achieve these goals, this study analyzed pelagic sediments of multicore 34IV-SWIR-S021MC03, 34IV-SWIR-S032MC04, and 34IV-SWIR-S040MC05 from the Southwest Indian Ocean. A total of 13 nannofossil species have been identified. The assemblages belong to the subtropical convergence zone regime. They are characterized by warm and cold water species, dominated by Emiliania huxleyi, Calcidiscus leptoporus, Gephyrocapsa muellerae, and Florisphaera profunda. According to the AMS14C age model and phytoplankton ecological signatures, this study establishes a calcareous nannofossil indicator to trace the migration of the ancient ARC during the last 40 kyr. The result shows three periods of migration: 40–22 kyr, the ancient ARC was in the far north and was moving southward; 22–14 kyr, a transitional period, the ancient ARC was moving northward; 14–3 kyr, the ARC was moving southward. This further suggests that the migration of the ancient ARC is more complex than the two recognized phases, and there were essential turning points around the last glacial maximum period. It also acknowledges that the ancient ARC is sensitive to interglacial periods and can be influenced simultaneously by the Southern Hemisphere monsoon and westerly winds.
1 Introduction
The Agulhas system plays a crucial role in global ocean circulation, connecting the Indian Ocean, the Atlantic Ocean, and the Southern Ocean (Gordon et al., 1992; Lutjeharms, 2006; Beal et al., 2011; Backeberg et al., 2012). It is located in a transitional zone between the easterly trade winds and westerlies of the Southern Hemisphere. The Agulhas Current transports warm equatorial Indian Ocean waters partly to the Atlantic Ocean through the Agulhas Retroflection (Retroflection/Agulhas Ring) and partly eastward as the Agulhas Return Current (ARC) carries warm tropical and subtropical water (Lutjeharms and Valentine, 1984; Lutjeharms and Valentine, 1988; Lutjeharms and Ansorge, 2001). Lin and Wang’s (2016) research on modern oceanography and remote sensing suggests that Agulhas retroflection showed significant fluctuations from 1993 to 2013. Using foraminiferal assemblages, Peeters et al. (2004) first revealed the north–south changes in the subtropical convergence of the Agulhas Retroflection since the Marine Isotope Stage 14 (MIS 14) period. The ARC is sensitive to the global climate and can affect the climate in return (Perch-Nielsen, 1985; Behrenfeld et al., 2006). The ARC shifts equatorward, leading to a more than 3° shift in the Southern Hemisphere jet and weakening stationary wave activity in the Austral Hemisphere (Garfinkel et al., 2020). However, few studies have been reported on the latitudinal variation of the ARC during the geological history period (Choudhari et al., 2023).
The modern surface bioenvironmental regimes around the ARC area have been divided into three main oceanographic regimes: the subtropical zone (Agulhas Current zone), the subtropical convergence zone, and the sub-Antarctic zone (Murtugudde and Busalacchi, 1999; Machu et al., 2005). However, little is known about palaeoceanographic regimes. Calcareous nannofossils and planktonic foraminifera from MIS 1 to MIS 7 have reconstructed the Agulhas Current Retroflection, and both of them are responsive to glacial–interglacial cycles (Flores et al., 1999). The water masses control the survival of coccolithophores and are responsive to changes in water temperature, salinity, and nitracline levels (Bown et al., 2004; Maiorano et al., 2009). Thus, their fossil record in deep-sea sediment can reflect the characteristics of the water in the investigated area (McIntyre and Be, 1967; Bollmann, 1997; Flores et al., 1997; Tangunan et al., 2020). The calcareous nannofossil group can be a good indicator of ancient current migration (Dittert et al., 1999; Machu and Garcon, 2001; Billard and Inouye, 2004), paleo-productivity (Beaufort et al., 2001), and paleo-stratification (Jordan et al., 1996; Tangunan et al., 2021), which has been well-applied to the Kuroshio Current (Su and Wei, 2005) and the California Current (Su et al., 2020). When using nannofossils to recover historical changes of ancient currents, researchers usually choose the corresponding alternative markers, such as Florisphaera profunda, Emiliania huxleyi, and Gephyrocapsa oceanica (F-EG ratio) (Su and Wei, 2005) and Umbellosphaerara/Gephyrocapsa oceanica (Yang et al., 2001), to indicate changes in the Kuroshio current. F. profunda is a typical coccolithophore living in the lower photic zone (LPZ) (Zhang and Liu, 2005; Zhao et al., 2009), and its index has been used to reflect surface water stratification. However, there is a lack of a calcareous nannofossil proxy to indicate the migration of the ancient ARC and its paleo-stratification changes over time.
In the last decade, China’s oceanographic survey cruises have obtained several valuable pelagic sediment cores in the ARC region while exploring polymetallic sulfides on the Southwest Indian Ridge (SWIR). This provides favorable conditions for the current study. This research had the following goals: 1) to understand the characteristics of the calcareous nannofossil assemblage and the calcareous nannofossil oceanographic zone in the SWIR; 2) to understand changes in the fossil record during the last 40 kyr and correlate bioecology to establish the fossil group as a proxy for reconstructing the migration of the ancient ARC; and 3) to trace the record of the ARC migration during the Late Pleistocene.
2 Geologic and oceanographic setting
The area of this study is located between the Indomed and Gallieni transform faults on the SWIR, around 40°S and 50°E (Figure 1). This is an ultra-low-spreading mid-ocean ridge region with a spreading rate of 14–16 mm/year (Dick et al., 2003). The overall thickness of the ocean floor pelagic sediments in this area is thin and mainly confined to topographic depressions. Generally, the study area’s central sediments are calcareous ooze, dominated by calcareous nannofossils and foraminifers (Chen et al., 2021). Due to the influence of the surrounding magmatic or volcanic activity, the sediments sometimes contain rock and mineral fragments, depending on the distance from the center of volcanic or magmatic activity (Song et al., 2020; Zhang et al., 2022).
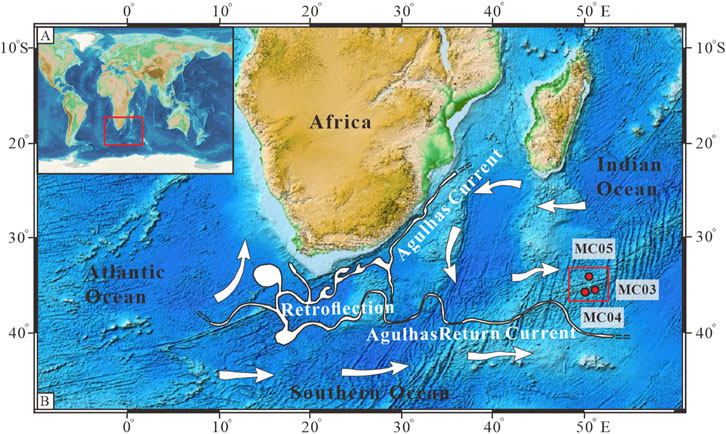
Figure 1. Sampling locations and surface currents in the study area. (A) Location of the three cores, 34IV-SWIR-S021MC03, 34IV-SWIR-S032MC04, and 34IV-SWIR-S040MC05, in this study. (B) Location of the study area. Red round dots are sampling cores; intense currents and their components are white; open white arrows represent the general background circulation; the base map refers to http://www.gebco.net; and currents refer to Lutjeharms (2006).
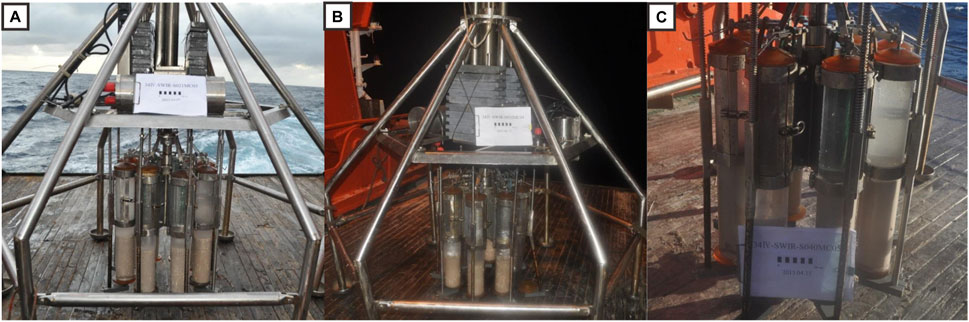
Figure 2. Deck photographs of multicores 34IV-SWIR-S021MC03 (A), 34IV-SWIR-S032MC04 (B), and 34IV-SWIR-S040MC05 (C).
The surface waters of the study area are mostly influenced by the ARC (Lutjeharms, 2006). The ARC is initiated by the Agulhas Retroflection, which transports warm tropical and subtropical waters eastward, and is bounded to the south by the Subtropical Front (STF), which feeds cold and fresh sub-Antarctic surface waters (Stramma and Lutjeharms, 1997). The hydrographic boundary of the ARC is 40°S (Duncan, 1970). The Agulhas Retroflection Front and the South Subtropical Front distinguish the surface water mass regimes observed in the study area. At the Agulhas Retroflection Front, sea surface temperature (SST) changes from 19°C to 17°C and sea surface salinity decreases from 35.54 to 35.39 (Belkin and Gordon, 1996; Holliday and Read, 1998). The South Subtropical Front ranges from 17°C to 11°C and 35.35 to 34.04 (Belkin and Gordon, 1996; Holliday and Read, 1998).
The nitrate, silicate, and phosphate in the Indian Ocean region north of 40°S are lower than those in the southern sub-Antarctic region, where the bottom water is in close contact with the surface water. The water brings in large amounts of nutrients from the bottom, resulting in high nutrient levels (Behrenfeld et al., 2006).
3 Materials and methods
Samples: The studied pelagic sediments were collected by the Chinese DY34-IV expedition in 2015. Three multicores, 34IV-SWIR-S021MC03, 34IV-SWIR-S032MC04, and 34IV-SWIR-S040MC05 (hereafter MC03, MC04, and MC05) with lengths of 22 cm, 20 cm, and 27 cm, respectively, were analyzed (Figure 2). These cores were sampled at a depth interval of 2 cm, from which a total of 35 samples, split into 11, 10, and 14 samples, were collected (Table 1). The color of the sediments ranged from pale yellowish white to grayish white. The particle size of these sediments was mainly sand size and silt size, and the composition of these sediments is dominated by calcareous nannofossils and foraminifera, with fewer mineral fragments.
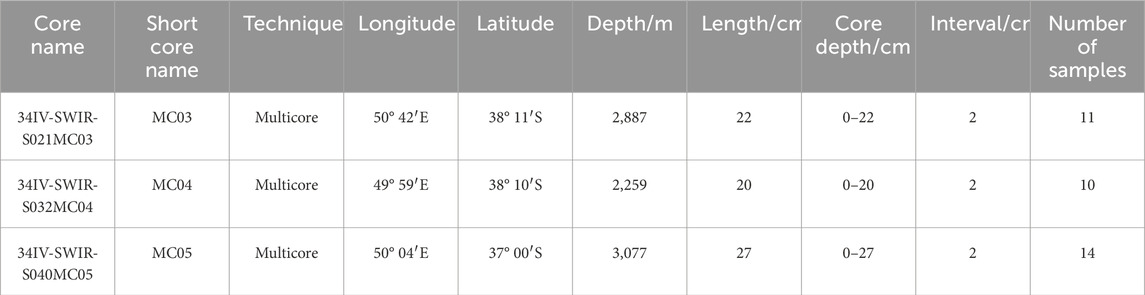
Table 1. Basic information of the three core samples from the study area.
Fossil extraction and identification: The analysis and identification of calcareous nannofossils were conducted in the School of Ocean Sciences, China University of Geosciences (Beijing) laboratory. The rapid preparation method was used for the nannofossil slide preparation (Su, 1996; Jiang et al., 2016). Ultraviolet solidification glue was used as slide adhesive glue. Fossils were observed and counted under a Zeiss Axio Lab A1 Microscope at 1000x magnification, and >600 individuals were counted for each slide. The fossil definition and classification were referred to in the references of Perch-Nielsen (1985), Jordan et al. (2000), and Young et al. (2003), and the updated Nannotax3 database on the official website of the International Nannoplankton Association (http://nannotax.org/). The small-sized Gephyrocapsa species, such as G. ericsonii and G. aperta, have many morphological transition types between different species. However, they are too small to identify correctly at the species level under a light microscope. For this reason, we used the term “small Gephyrocapsa species group” (small Gephyrocapsa group) for Gephyrocapsa species with sizes of <3 μm.
The relative abundance of fossils in each sample was calculated. Furthermore, we applied two fossil indices. The Simpson’s diversity index (Simpson, 1949) for fossils was calculated as described:
where N is the total number of individuals in the sample and ni is the number of individuals of the species.
The F. profunda index was also calculated. The abundance of the LPZ taxon F. profunda is against all upper photic zone (UPZ) species to minimize species evolutionary bias on the stratification index (Tangunan et al., 2021):
AMS14C dating: six samples from the top and bottom of each core were used for the dating analysis. These samples were rinsed with purified water and dried at room temperature. Individual planktonic foraminifers (larger than 250 μm) and Globorotalia inflata were selected under a microscope. Note that only intact, clean, and undissolved specimens were picked for dating. The G. inflata samples were sent to Beta Laboratories in the United States for AMS14C dating analysis. The AMS14C data obtained were corrected with marine reservoir effects and calendar age. Calibration was performed using the online program calib8.2 (Stuiver and Reimer, 1993; Heaton et al., 2020). Estimated ages for intermediate samples between the top and bottom of the core were calculated using linear interpolation. Linear sedimentation rates for each depth interval were computed using the difference method. The Late Pleistocene deep-sea oxygen isotope stage boundary follows Lisiecki and Raymo (2005), which gives MIS 1 and MIS 2 boundary ages of 14 ka B.P., MIS 2 and MIS 3 boundary ages of 29 ka B.P., and MIS 3 and MIS 4 boundary ages of 57 ka B.P. The MIS 1 and MIS 4 boundary ages were calculated using a linear interpolation method.
4 Results
4.1 AMS14C dates and age model
The dating results (14C ages) of the studied multicores are shown in Table 2. For core MC03, the ages for the top sediment sample (MC03-1) and the bottom sample (MC03-11) are 2.939 ka B.P. and 9.660 ka B.P., respectively. For core MC04, the top and bottom samples (MC04-1, MC04-10) have ages of 12.707 ka B.P. and 39.933 ka B.P., respectively. In addition, ages of 3.302 ka B.P. and 16.747 ka B.P. are dated for the top (MC05-1) and bottom (MC05-14) samples of core MC05, respectively.
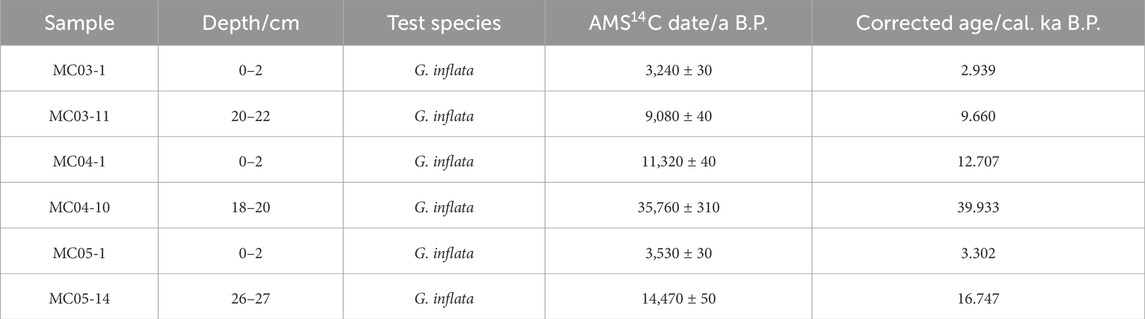
Table 2. AMS14C dating results for cores 34IV-SWIR-S021MC03, 34IV-SWIR-S032MC04, and 34IV-SWIR-S040MC05 in the Southwest Indian Ocean.
The dating results suggest that the oldest sediments retreated by the multicores are in core MC04 at 39.933 ka B.P. All core-top sediments in the three cores are missing, lacking sediments deposited during the last 2.939 kyr, 12.707 kyr, and 3.302 kyr in cores MC03, MC04, and MC05, respectively.
In terms of the sedimentation rate, the lowest sedimentation rate is 0.66 cm/ka for core MC04 during MIS 3–MIS 2 and 2.98 cm/ka and 1.90 cm/ka for cores MC03 and MC05 during MIS 2–MIS 1, respectively (Figure 3).
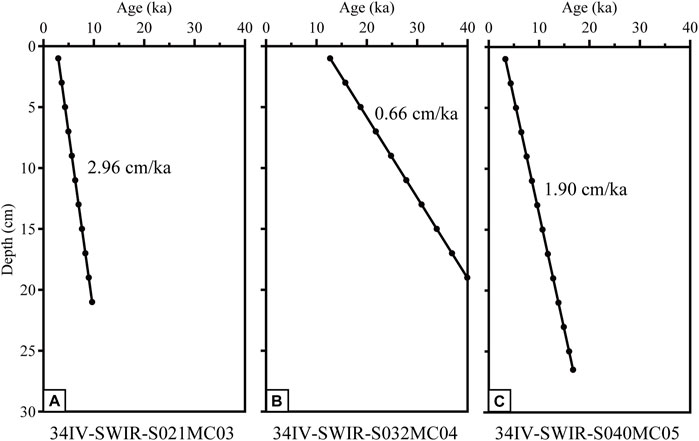
Figure 3. Age model in cores 34IV-SWIR-S021MC03 (A), 34IV-SWIR-S032MC04 (B), and 34IV-SWIR-S040MC05 (C).
Overall, it shows that the three cores revealed different sedimentation intervals. However, they can still obtain the nannofossil records and their general change over the last 40 kyr. The downcore variation in fossil abundance from the three cores is summarized on a single plot. The earliest fossil records (during 40–17 kyr) are revealed only by the lower interval of core MC04; the records during 17–12 kyr can be seen from the top part of core MC04 and the lowest part of core MC05; the records of 12–10 kyr are only in the middle interval of core MC05; and the records of 10–3 kyr are seen from the top intervals of cores MC05 and MC03.
4.2 Characteristics of the calcareous nannofossil assemblage
A total of 22,611 individuals of calcareous nannofossil were identified in this study, representing 13 species in 12 genera. The relative abundance of each core sample was plotted as a mean value (Figure 4). To describe the whole picture, the three core samples were then averaged for the following description. E. huxleyi dominated the community, with a relative abundance of 47%. The common species or fossil group with high abundance was Calcidiscus leptoporus (12.5%), Gephyrocapsa muellerae (11.4%), F. profunda (9.7%), and the small Gephyrocapsa group (8%). The dominant and common species and groups accounted for 85.2%, 89.8%, and 91% of the fossil assemblages in cores MC03, MC04, and MC05, respectively. The remaining species listed in alphabetical order are Calciosolenia brasiliensis (<1%), Ceratolithus cristatus (<1%), Coccolithus pelagicus (<1%), G. oceanica (2.6%), Helicosphaera carteri (1.9%), Rhabdosphaera clavigera (1.3%), Syracosphaera pulchra (1.1%), Umbellosphaera tenuis (1.2%), and Umbilicosphaera sibogae (2.7%).
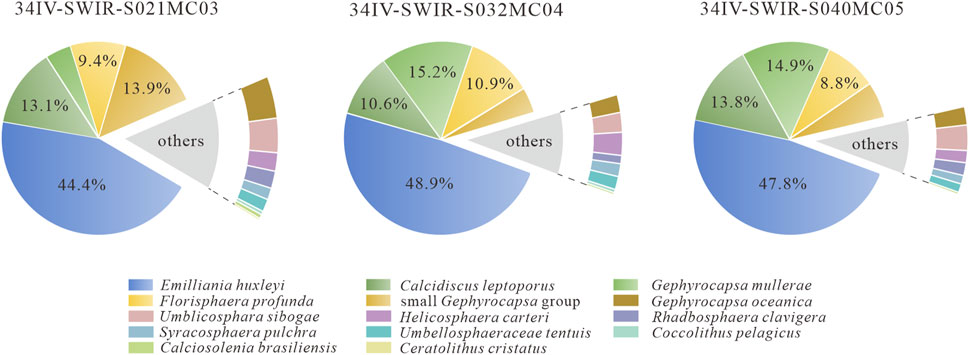
Figure 4. Average relative abundance of calcareous nannofossils in cores 34IV-SWIR-S021MC03, 34IV-SWIR-S032MC04, and 34IV-SWIR-S040MC05.
Overall, the fossil assemblage is dominated by E. huxleyi and commonly includes C. leptoporus, G. muellerae, and F. profunda. The fossil community composition of core MC04 (geographically southwestern) is broadly similar to that of MC03 (geographically southeastern) and MC05 (geographically northern). This suggests that there are no significant geographical differences between the fossil communities in the three cores and that they can collectively reflect changes in the fossil community composition over time.
4.3 Records of calcareous nannofossil fossil variation with depth and time
To understand the variation of calcareous nannofossil with depth and time, this study plotted the downcore variation of nannofossil abundance (Figure 5). Sediment depth information is shown on the right, and age information is shown on the left.
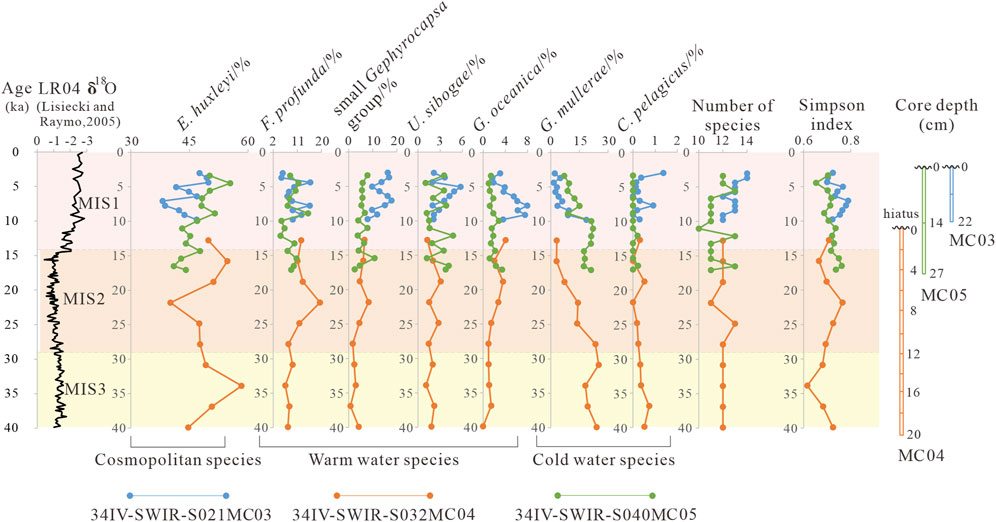
Figure 5. Relative abundance of calcareous nannofossils in cores 34IV-SWIR-S021MC03, 34IV-SWIR-S032MC04, and 34IV-SWIR-S040MC05 of ecological indicator species during the last 40 kyr.
First, the calcareous nannofossil variation with depth shows a different trend in the three cores. In core MC03, the genera of E. huxleyi increase from 12 at 20–22 cm to 14 at 0–2 cm. The relative abundance of E. huxleyi varies between 38% and 50%. U. sibogae and the small Gephyrocapsa group show an increasing trend, while G. muellerae and G. oceanica have the opposite trend. In core MC04, the Simpson index is variable, but the number of species is stable. The relative abundance of E. huxleyi reaches a maximum of 58% at 14–16 cm and a minimum of 40% at 6–8 cm. G. muellerae decreases from 24% at 18–20 cm to 3% at 0–2 cm. F. profunda peaks at 19% at 6–8 cm. In core MC05, the number of genera varies between 10 and 13. E. huxleyi increases from 44% at 26–27 cm to 55% at 2–4 cm, while G. muellerae decreases from 21% at 26–27 cm to 7% at 0–2 cm.
Second, the fossil variation over time shows a clear link. During the MIS 3 period, the relative abundance of F. profunda, U. sibogae, G. oceanica, and the small Gephyrocapsa group showed a tendency to increase, while E. huxleyi presented a decreasing trend, as did G. muellerae and C. pelagicus. During the MIS 2 period, F. profunda and the small Gephyrocapsa group peak at 21 ka, while E. huxleyi declines to 40% at the same time. Meanwhile, the LR04 δ18O record also shows a low trend. During the MIS 1 period, the number of calcareous nannofossil genera and Simpson’s index show an increasing trend, which also applies to the LR04 δ18O record. F. profunda, U. sibogae, G. oceanica, and the small Gephyrocapsa group indicate an overall increasing trend, while G. muellerae and C. pelagicus show the opposite trend. F. profunda increases from a minimum of 4.7% to a maximum of 15.9%, and U. sibogae increases from 1.0% to 5.7%. The small Gephyrocapsa group, G. oceanica, and E. huxleyi show differences between MC03 and MC05. MC03 has a high content of the small Gephyrocapsa group, G. oceanica, while MC05 has a high content of E. huxleyi.
In summary, the downcore fossil variation shows three periods. During 40–22 ka, F. profunda, U. sibogae, G. oceanica, and the small Gephyrocapsa group were at low abundance, and G. muellerae and C. pelagicus were at high abundance. In contrast, during 14–3 kyr, the F. profunda, U. sibogae, G. oceanica, and the small Gephyrocapsa group were in high abundance, the content of G. muellerae and C. pelagicus decreased, and the number of fossil genera and Simpson’s index increased. The transitional period was 22–14 ka. The similarity of the calcareous nannofossil assemblages in the three cores and the consistent change trend show that the main difference is temporal. In contrast, the geographic differences have little effect on the fossil assemblages. The three core samples can be composited to discuss indicators of the ARC. The idea and composite method are based on the initial reports of Ocean Drilling Program Leg 184 (Wang et al., 2000).
5 Discussion
5.1 Oceanographic zonation of the fossil assemblage in the study area
The calcareous nannofossil assemblages in this study are composed of 13 species, represented by E. huxleyi, C. leptoporus, and F. profunda. To understand the calcareous nannofossil oceanographic zone, the study compared data from a total of 13 surface sediment samples from the previous survey (Flores et al., 1999; Tangunan et al., 2021), which come from three main oceanographic zones: subtropical, subtropical convergence , and sub-Antarctic zones (Figure 6). Those “surface” samples may not indeed be “modern” either but rather have different relatively older ages, based on the age model in Section 4.1.
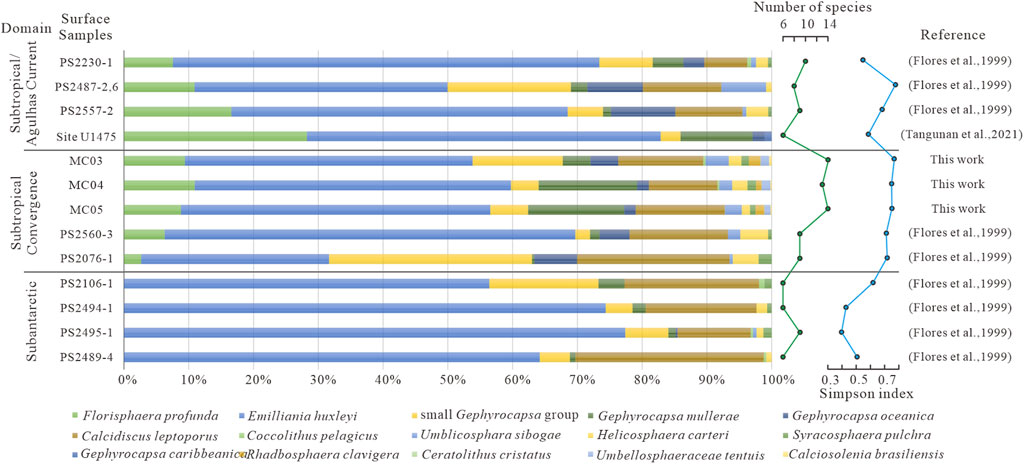
Figure 6. Relative abundance of calcareous nannofossils in the surface sediments in and around the study area.
The subtropical calcareous nannofossil assemblage contains ecologically typical genera such as the warm-water species F. profunda (up to 16%), G. oceanica (up to 10%), and U. sibogae (up to 7%), which are rare or absent in the sub-Antarctic zone. The cold-water species C. pelagicus is absent in subtropical areas but exists in sub-Antarctic fossil communities. The study area with cores MC03, MC04, and MC05 shows lower levels of F. profunda (mean 9%), G. oceanica (mean 3%), and U. sibogae (mean 3%) than those in the subtropical zone, while C. pelagicus is present. The calcareous nannofossil assemblage characterized by both warm and cold water species shows remarkable features about the subtropical convergence zone (Figure 7).
From the oceanographic perspective, the study area at present is located in the subtropical convergence zone of the oceanic geographic region, which is bounded to the north by the subtropical zone rich in warm-water species and poor in cold-water species and to the south by the sub-Antarctic zone rich in cold-water species and lacking warm-water species. The typical ecological species of calcareous nannofossil in the study area is feasible to mark the variability of the ARC between the subtropical and sub-Antarctic zones, at least during the MIS 3–MIS 1 period.
The temperature and salinity of the surface seawater affect the fossil community. Both the subtropical and sub-Antarctic environments characterize the geographically intermediate convergence zone. Hutson (1980) examined the tropical Agulhas Current, characterized by temperatures above 17°C and salinities below 35.5‰. The subtropical convergence zone features lower temperatures, while the sub-Antarctic zone south of 42°S has a drop of 8.4°C. Patil et al. (2017) also identified temperature and nutrient concentrations as the most critical factors influencing coccolithophore diversity and distribution.
Additionally, the number of genera (13–14 species) and Simpson’s index (0.61–0.76) are higher in cores MC03, MC04, and MC05 than those in the cores from the subtropical zone and sub-Antarctic zone. The possible reasons are that warm-water bodies, eddies, and developed large oceanic fronts benefit the growth of phytoplankton (Mcgillicuddy et al., 2007; Siegel et al., 2011; Huang et al., 2017).
5.2 Indicator for latitudinal variations in the ancient ARC
The discussion in Section 5.1 suggests that the nannofossils in the study area were sensitive to the migration of the ARC, which allows us to find a suitable indicator to trace the ancient ARC using phytoplankton ecology. The proxy for the ancient ARC is formed by the sum of eight warm-water calcareous nannofossils, and the reason for this is described in detail below.
F. profunda commonly lives in the LPZ and is strongly correlated with changes in the depth of the nutricline dynamics (Okada and Honjo, 1973; Okada, 1980). It is adapted to temperatures above 12°C (Okada and Honjo, 1973). Its percentage has been used to record the temporal and spatial variability of the nutricline (Molfino and McIntyre, 1990a; Molfino and McIntyre, 1990b). The F. profunda index can indicate the stratification of its waters (Beaufort et al., 2001; Tangunan et al., 2021). A low index value indicates a mixed water column (shallow nutricline), while values closer to 1 indicate a stratified water column (deep nutricline). F. profunda was distributed in the subtropical and convergent zones, with values ranging from 3% to 23%, and was not found in the sub-Antarctic zone.
The small Gephyrocapsa group is considered to be a group species associated with upwelling (Wells and Okada, 1997). Flores et al. (1999) associated them with palaeotemperatures, a significant increase in abundance during the MIS 19–21 interglacial period, and an opposite trend to the cold-water planktonic foraminiferal assemblages. Ballegeer et al. (2022) at ODP Site 1090 indicated that the small Gephyrocapsa group was the dominant species during the warm period from 3.2 to 2.85 Ma, while C. pelagicus increased during the cold period after 2.85 Ma. According to Section 5.1, its overall abundance in the subtropical and convergence zones was higher than that in the sub-Antarctic zone, and its abundance in the MIS 1 period was higher than that in the MIS 3–2 period. This indicates that the small Gephyrocapsa group is temperature-sensitive and prefers warmer waters.
U. sibogae is a tropical genus associated with surface currents at AC of up to 10% (Fincham and Winter, 1989). Flores et al. (1999) suggested that it is associated with F. profunda and G. oceanica, which have similar trends and indicate high relative abundance during the interglacial period. Thus, U. sibogae is related to temperature.
G. oceanica is a warm-water species (McIntyre and Be, 1967; Okada and Honjo, 1975). This genus is distributed in AC tropical waters and is similar to F. profunda, controlled by the same water conditions with maximum levels in MIS 7 (Prell et al., 1980; Flores et al., 1999). In the present study, G. oceanica was abundant in the subtropical and convergence zones, with minimal content in the sub-Antarctic zone. It is low in MIS 3–2 and increased during the interglacial period in MIS 1.
R. clavigera, U. tenuis, C. brasiliensis, and C. cristatus are warm-water species (Haidar and Thierstein, 2001; Hagino and Okada, 2006; Hayat et al., 2022). Their average content is only about 1%, a low value in the study area. In the Southern Ocean, U. tenuis was abundant at 50 m depth in the subtropical convergence zone north of 42°S, with a temperature range of 10–25°C (Mohan et al., 2008). In this study, U. tenuis is an ecological species of the tropical-to-subtropical convergence zone (McIntyre and Be, 1967; Okada and McIntyre, 1979).
In summary, this study has established a proxy using the sum of the relative abundances of eight warm-water species, namely, F. profunda, the small Gephyrocapsa group, U. sibogae, G. oceanica, R. clavigera, U. tenuis, C. brasiliensis, and C. cristatus, as a nannofossil group to indicate the migration of the ARC. Here, a high relative abundance of the fossil group indicates an overall southward movement of the ancient ARC. In contrast, a lower relative abundance indicates a northward movement of the ancient ARC.
5.3 Record of the ARC migration over the last 40 kyr
Following the ARC indicator chosen in Section 5.2, the migration of the ancient ARC is compared with the migration of the STF, the migration of the Agulhas leakage, changes in seawater stratification, and changes in productivity (Figure 8).
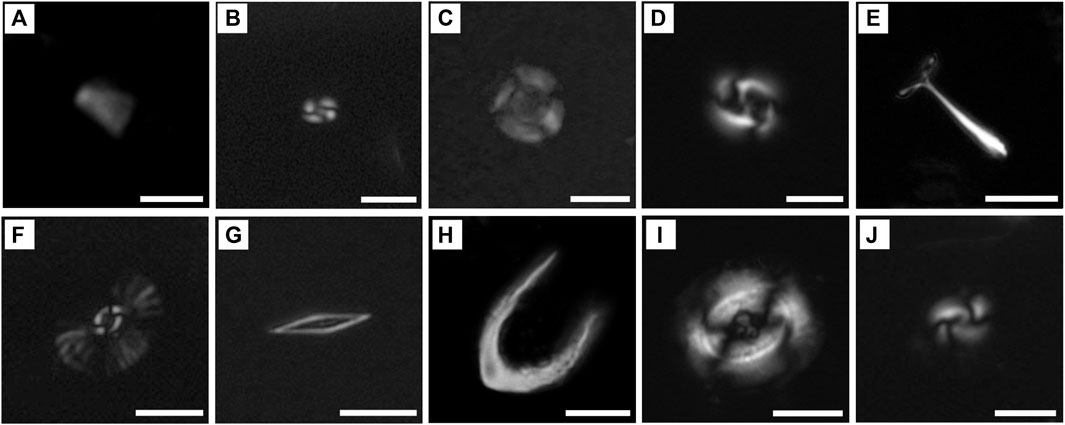
Figure 7. Micrographs of calcareous nannofossils used as typical warm species (A–H) and cold species (I, J) in the Southwest Indian Ocean. The scale bar represents 5 μm. (A) F. profunda, (B) Small Gephyrocapsa group (<3 μm), (C) U. sibogae, (D) G. oceanica, (E) R. clavigera, (F) U. tenuis, (G). C. brasiliensis, (H) C. cristatus, (I) C. pelagicus, and (J) G. muellerae.
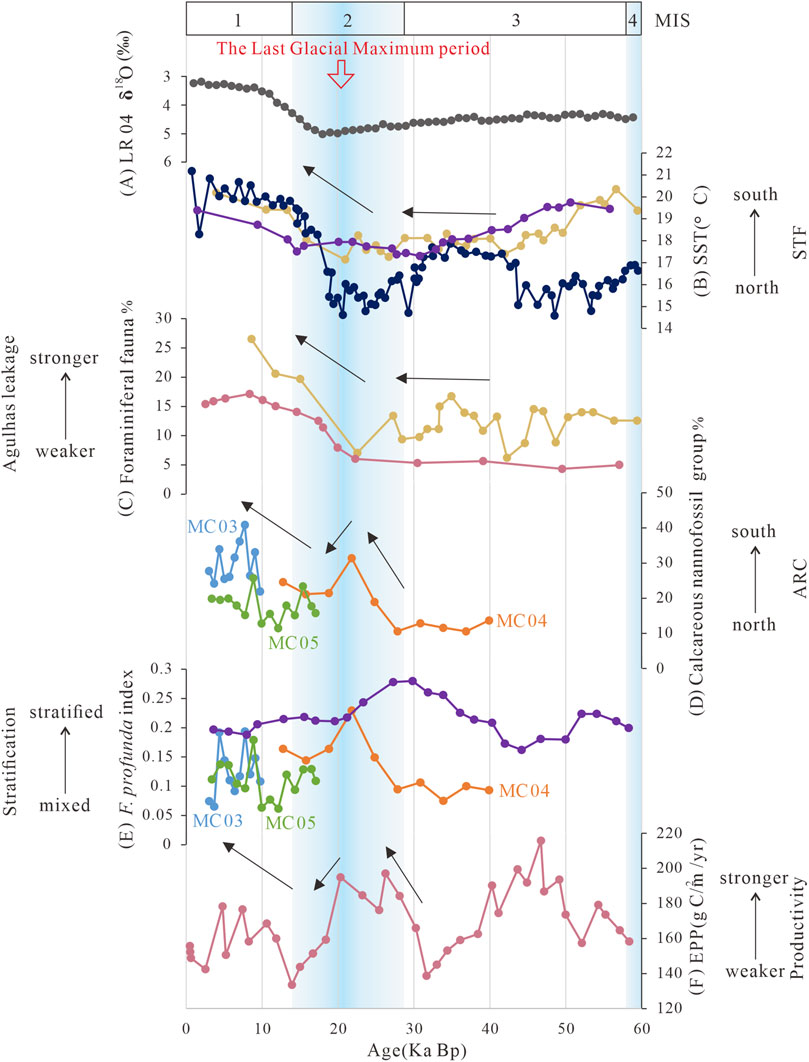
Figure 8. Palaeoceanographic records in and around the region of the Agulhas Return Current. (A) Gray line cited in the LR04 stack (Lisiecki and Raymo, 2005); (B) surface seawater temperature record. The yellow line is cited in Peeters et al. (2004), the dark blue line is cited in Romero et al. (2015), and the purple line is cited in Tangunan et al. (2021); (C) planktonic foraminiferal fauna record. The pink line is cited in Flores et al. (1999), and the yellow line is cited in Peeters et al. (2004); (D) calcareous nannofossil group record. The blue line is cited in MC03 station, the orange line is cited in MC04 station, and the green line is cited in MC05 station; (E) F. profunda index record. The blue line is cited in the MC03 station, the orange line is for the MC04 station, the green line is for the MC05 station, and the purple line is cited in Tangunan et al. (2021); and (F) primary productivity record. The pink line is cited in Flores et al. (1999).
The temporal variations of the nannofossil group proxy in the studied cores show three periods of ARC migration over the last 40 kyr (Figure 8D). During 40–22 kyr, the fossil group indicator increased from an initial 10% to 30%, indicating the ARC was in the far north and started to move south. Next, the fossil group decreased to 20% at 19 ka, suggesting that the ARC had a northward migration from 22 to 14 kyr. Third, the fossil group continued to increase into the MIS 1 period (14 ka), peaking at nearly 40%. Combining the above three migration records and the oceanographic background of the study area, it can be seen that the position of the ancient ARC was more northerly than the modern one during the MIS 3 period. The sub-Antarctic zone controlled the study area, which corresponded to the high abundance of cold-water species during the MIS 3 period. This is corroborated by two ice cores drilled in central Greenland, where oxygen isotope records show that MIS3 was not a classical interglacial; cold stadial climatic conditions are abrupt transitions to a mild interstadial, eventually followed by a return to cold stadial conditions (Dansgaard et al., 1993). In addition, the polar planktic foraminifera are abundant, and their isotopic ratios correspond with a cold and turbulent climate in the North Atlantic Ocean during MIS 3 (Bond and Lotti, 1995).
However, changes in the strength of the Agulhas leakage, as indicated by planktonic foraminiferal assemblages, show a different pattern, with the nannofossils showing a three-step change in the ARC. In contrast, the foraminifera showed a two-step change over the last 40 kyr (Figure 8C). The planktonic foraminifera record in the Agulhas retroflection showed a high presence of sub-Antarctic foraminifera during the MIS 3 period, coinciding with the weak strength of the Agulhas Retroflection (Flores et al., 1999; Peeters et al., 2004). The turning point was during the last glacial maximum period, when the foraminiferal assemblage indicator increased from approximately 5% to 25%, signaling a greater muscular strength of the Agulhas Retroflection. The calcareous nannofossil assemblages also had the same trend during the glacial periods. This suggests that they were similarly affected by the glacial periods and reached a turning point during the last glacial maximum period.
Although there is a lack of direct evidence for the ancient Agulhas Retroflection and changes in the strength of the Agulhas Retroflection, modern observations, such as observations of absolute sea surface height data published by the French space agency AVISO, indicate that the latitude and longitude ranges of the modern Agulhas Retroflection change are 14–19°E and 38.5–40°S, respectively. This evidence confirms that the Agulhas Retroflection has been changing in an oscillatory manner from year to year (Lin and Wang, 2016). Modern remote sensing observations suggest that an enhanced (weakened) ARC implies a westward (eastward) location of the Agulhas Retroflection and a southward (northward) latitude of the ARC.
The changes in surface seawater temperature are time-leading (Figure 8A). Compared to the UK37 surface seawater temperature data (Tangunan et al., 2021) obtained by previous authors (Figure 8B), the surface seawater temperature of core MD02-2588 on the southern Agulhas Plateau shows three phases of change similar to the changes in the calcareous nannofossil assemblage in the study area. There was an overall increasing trend from a minimum of 4.5°C to a maximum of 18°C during MIS 3, with an average temperature of 17.5°C between 40 and 29 ka. The second phase is a decreasing trend into MIS 2, with an average temperature of 15°C between 29 and 20 ka. Third, surface seawater temperatures continued to increase after 29 ka, with an average temperature of 20°C after MIS 1. At the same time, the surface seawater temperature of core MD02-2588 south of Cape Canyon, GeoB-3603–2 (35° 08′S to 17° 33′E, 2840 m depth), and IODP Site U1475 had similar surface temperatures, which were stable at approximately 18°C between 40 and 22 ka and then gradually increased to 19–20°C after 22 ka.
The F. profunda index is used as an indicator of seawater stratification in this research (Figure 8E). The fossil record of the F. profunda index shows that seawater stratification in the study area was weak, with the F. profunda index around 0.1 during 40–22 kyr. Afterward, the stratification was more robust at 22 ka. The turning point occurred around the last glacial period, when the F. profunda index showed a sharp value of about 0.25, then weakened, and gradually increased again after entering the MIS 1 period (14 ka). However, the mean value was only about 0.1, and the surface seawater was still relatively mixed. Comparison with the results of the F. profunda index for IODP Site U1475 near the Agulhas Retroflection (Figure 8E in purple) indicates that seawater stratification in the study area also presents a trend with an increase at the beginning, followed by a decrease, and then stability (Tangunan et al., 2021). The seawater in the warm eddies in and around the ARC is strongly stratified, and the depth of the nutricline could reach up to 100 m (Chapman et al., 1987; Gordon et al., 1987). Thus, it can be seen that the seawater stratification is enhanced when the ARC moves southward and is weakened by a northward ARC.
Seawater stratification in the region of IODP Site U1475 started enhancing at 40 ka. It reached its highest peak at MIS 2, after which it began to weaken, and the F. profunda index tended to stabilize at around 0.2 after 19 ka. Overall, the seawater in the region of IODP Site U1475 is more stratified than the study area. The time lag in its variation needs further investigation with more data. In addition, past primary productivity (EPP) shows that the changes in surface seawater productivity follow the trend of the F. profunda index in three cores (Figure 8F). It rose during MIS 3–MIS 2, declined around the last glacial maximum period, and rose again as it entered MIS 1.
Based on the above discussion, the factors that may control the migration of the ancient ARC can be the glacial–interglacial cycles, the Southern Hemisphere westerly winds, and the Southern Hemisphere southwestern monsoon. First, the glacial–interglacial cycles. During a period (40 ka) of the MIS 3, the climate was colder, and the sub-Antarctic zone mainly controlled the study area; the position of the ARC was more northerly than in modern times. After that, the ARC moved southward gradually, and the inflection point appeared at approximately 20 ka. The last glacial maximum period was temporally migrated northward between 22 and 19 ka. Waelbroeck et al. (2002) used an oxygen isotope to estimate the last glacial maximum period to be approximately 19.5 ka. CO2 and δ D in Antarctic ice-core bubbles showed that the last glacial maximum period appeared at approximately 20 ka. Then, during the warm period of MIS 1, the ARC moved southward again.
Second, the Southern Hemisphere westerly winds. The Agulhas Current system also lies in a transition zone between the easterly trade winds and the Southern Hemisphere westerlies (Lutjeharms, 2006). An analysis performed within two global (ORCA05 and INALT01) and two regional (AGIO and ARC) model configurations shows that an equatorward (poleward) shift of the westerlies increases (decreases) leakage (Jonathan, 2013). The actual control of the position of the STF is crucially dependent on whether the front is considered simply a surface water mass boundary or a dynamical front (Boer et al., 2013). Boer et al. (2013) suggested that Southern Hemisphere westerly winds control the position of the STF.
Third, the Southern Hemisphere southwestern monsoon. Calcite saturation peaked during the last glacial maximum period due to the intensification of the southwesterly monsoon, which delayed the return of interglacial warming (Johnstone et al., 2014). The wind and dust transport intensity and the monsoon factor recorded by Hole GC02 in the Madagascar Basin show peaks during the last glacial bloom, indicating an intensification of the southwest monsoon (Lin, 2019). Therefore, the ancient ARC in the study area since the southwestern monsoon in the Southern Hemisphere may similarly control 40 ka.
In summary, the calcareous nannofossil proxy indicates three periods of ancient ARC migration in the Southwest Indian Ocean over 40 kyr. During 40–22 kyr, the ARC was in the far north and started to move south, while the study area was in the sub-Antarctic zone. During 22–14 kyr, the ARC moved northward under the influence of the last glacial maximum period. From 14 ka to 3 ka, the ARC turns again to move southward. The study area is now located in the subtropical convergence zone. The changes in seawater stratification are closely related to changes in migration, with seawater stratification increasing during southward migration and decreasing during northward migration. The migration of the ancient ARC shows an apparent response to glacial and interglacial changes, as well as to westerly winds and the southwestern monsoon in the Southern Hemisphere. The migration of the ancient ARC may be correlated with the drift of the Agulhas Ring through the subtropical gyre into the South Atlantic (Rackebrandt et al., 2011).
6 Conclusion
The ARC plays a crucial role in the oceanographic connections between the Indian, Atlantic, and Southern oceans. However, its historical positional variations remain poorly understood. This study identified 13 calcareous nannofossil species from pelagic sediments to understand the characteristics and downcore variation of the calcareous nannofossil assemblages in the Southwest Indian Ocean. A calcareous nannofossil indicator was established to trace the migration of the ancient ARC over the last 40 kyr. The corresponding conclusions are as follows.
(1) The surface pelagic sediments in the study area are not simply modern samples but represent the fossil record of the last 40 kyr with a sedimentation rate of 0.66–2.98 cm/ka, according to the AMS14C age model.
(2) The calcareous nannofossil assemblages in the study area belong to the subtropical convergence zone regime. They are characterized by warm- and cold-water species, dominated by E. huxleyi, C. leptoporus, G. muellerae, and F. profunda.
(3) The calcareous nannofossil indicator shows three periods of migration during the last 40 kyr: during 40–22 kyr, the ancient ARC was in the far north and was moving southward; during 22–14 kyr, a transitional period, the ancient ARC was moving northward; and during 14–3 kyr, the ARC is moving southward again. The results suggest that the migration of the ancient ARC is more complex than the two recognized phases.
(4) The cyclical migrations of the three phases of the ancient ARC over 40 kyr record paleoclimatic information, with essential turning points around the last glacial maximum period. The ancient ARC was affected by global cooling and began to move northward, with a decrease in the calcareous nannofossil indicator in this study area. When global temperatures began to rise at the end of the last glacial maximum period, the ancient ARC began to move southward, increasing the warm species F. profunda, U. sibogae, G. oceanica, and the small Gephyrocapsa group. The Simpson index was high, while the upper layer of seawater was stratified. This study recognizes that the ancient ARC is sensitive to interglacial periods and is also influenced by both the Southern Hemisphere monsoon and westerly winds at the same time.
Data availability statement
The raw data supporting the conclusion of this article will be made available by the authors, without undue reservation.
Author contributions
CY: conceptualization, data curation, formal analysis, and writing–original draft. XS: funding acquisition, investigation, methodology, project administration, resources, and writing–review and editing. XD: formal analysis, investigation, supervision, visualization, and writing–review and editing. JZ: data curation and writing–original draft. CT: funding acquisition, resources, supervision, visualization, and writing–review and editing. SL: methodology, supervision, and writing–review and editing.
Funding
The author(s) declare financial support was received for the research, authorship, and/or publication of this article. This research was funded by the China Ocean Mineral Resources R&D Association (COMRA) project under contract no. 2-8-2018-08 and National Natural Science Foundation of China (40876030 and U2344222).
Acknowledgments
The authors are grateful to the captains and crews of the Chinese DY34 expedition on Dayangyihao, who contributed to the collection of sediment samples and the success of this project. The authors also thank the editor and reviewers for their valuable contributions to the manuscript, which significantly helped the authors improve the quality of this paper.
Conflict of interest
The authors declare that the research was conducted in the absence of any commercial or financial relationships that could be construed as a potential conflict of interest.
Publisher’s note
All claims expressed in this article are solely those of the authors and do not necessarily represent those of their affiliated organizations, or those of the publisher, the editors, and the reviewers. Any product that may be evaluated in this article, or claim that may be made by its manufacturer, is not guaranteed or endorsed by the publisher.
References
Backeberg, B. C., Penven, P., and Rouault, M. (2012). Impact of intensified Indian Ocean winds on mesoscale variability in the Agulhas system. Nat. Clim. Change 2 (8), 608–612. doi:10.1038/nclimate1587
Ballegeer, A. M., Jose-Abel, F., Francisco J, S., and Andreas, S. R.-H. (2022). Coccolith dissolution versus productivity changes during the Plio-Pleistocene (3.14–1.80 MA) in the South Atlantic (ODP site 1090). Palaeogeogr. Palaeocl. 603, 111184. doi:10.1016/j.palaeo.2022.111184
Beal, L. M., Ruijter, W. P. M. D., Biastoch, A., Zahn, R., Cronin, M., Hermes, J., et al. (2011). On the role of the Agulhas system in ocean circulation and climate. Nature 472, 429–436. doi:10.1038/nature09983
Beaufort, L., De Garidel-Thoron, T., Mix, A. C., and Pisias, N. G. (2001). ENSO-like forcing on oceanic primary production during the Late Pleistocene. Science 293 (5539), 2400–2444. doi:10.1126/science.293.5539.2440
Behrenfeld, M. J., O’Malley, R. T., Siegel, D. A., Mcclain, C. R., Sarmiento, J. L., Feldman, G. C., et al. (2006). Climate driven trends in contemporary ocean productivity. Nature 444 (7120), 752–755. doi:10.1038/nature05317
Belkin, I. M., and Gordon, A. L. (1996). Southern Ocean fronts from the greenwich meridian to tasmania. J. Geophys. Res. 101 (C2), 3675–3696. doi:10.1029/95jc02750
Billard, C., and Inouye, I. (2004). “What is new in coccolithophore biology?,” in Coccolithophores. Editors H. R. Thierstein, and J. R. Young (Berlin, Heidelberg: Springer Berlin Heidelberg), 1–29. doi:10.1007/978-3-662-06278-4_1
Boer, A. M. D., Graham, R. M., Thomas, M. D., and Kohfeld, K. E. (2013). The control of the southern hemisphere westerlies on the position of the subtropical front. J. Geophys. Res. Oceans 118 (10), 5669–5675. doi:10.1002/jgrc.20407
Bollmann, J. (1997). Morphology and biogeography of Gephyrocapsa coccoliths in Holocene sediments. Mar. Micropaleontol. 29 (3-4), 319–350. doi:10.1016/s0377-8398(96)00028-x
Bond, G. C., and Lotti, R. (1995). Iceberg discharges into the north atlantic on millennial time scales during the last glaciation. Science 267 (5200), 1005–1010. doi:10.1126/science.267.5200.1005
Bown, P. R., Lees, J. A., and Young, J. R. (2004). Calcareous nannoplankton evolution and diversity through time. in Coccolithophores: from molecular processes to global impact. (Berlin, Germany: Springer), 481–508.
Chapman, P., Duncombe, R. C. M., and Allanson, B. R. (1987). Nutrients, chlorophyll and oxygen relationships in the surface layers at the Agulhas Retroflection. Deep sea Res. 34 (8), 1399–1416. doi:10.1016/0198-0149(87)90134-8
Chen, X., Sun, X. M., Wu, Z. W., Wang, Y., Lin, X., and Chen, H. J. (2021). Mineralogy and geochemistry of deep-sea sediments from the ultraslow-spreading southwest Indian ridge: implications for hydrothermal input and igneous host rock. Minerals 11 (2), 138–38. doi:10.3390/min11020138
Choudhari, P., Nair, A., Mohan, R., and Patil, S. (2023). Variations in the Southern Ocean carbonate production, preservation, and hydrography for the past 41, 500 years: evidence from coccolith and CaCO3 records. Palaeogeogr. Palaeocl. 614 (111425), 111425. doi:10.1016/j.palaeo.2023.111425
Dansgaard, W., Johnsen, S. J., Clausen, H. B., Dahl-Jensen, D., Gundestrup, N. S., Hammer, C. U., et al. (1993). Evidence for general instability of past climate from a 250-kyr ice-core record. Nature 364 (6434), 218–220. doi:10.1038/364218a0
Dick, H. J. B., Lin, J., and Schouten, H. (2003). An ultraslow-spreading class of ocean ridge. Nature 426 (6965), 405–412. doi:10.1038/nature02128
Dittert, N., Baumann, K.-H., Bickert, T., Henrich, R., Huber, R., Kinkel, H., et al. (1999). “Carbonate dissolution in the deep-sea: methods, quantification and paleoceanographic application,” in Use of proxies in paleoceanography (Berlin, Germany: Springer). doi:10.1007/978-3-642-58646-0_10
Fincham, M., and Winter, A. (1989). Paleoceanographic interpretations of coccoliths and oxygen-isotopes from the sediment surface of the southwest Indian Ocean. Mar. Micropaleontol. 13, 325–351. doi:10.1016/0377-8398(89)90024-8
Flores, J. A., Gersonde, R., and Sierro, F. J. (1999). Pleistocene fluctuations in the Agulhas Current Retroflection based on the calcareous plankton record. Mar. Micropaleontol. 37 (1), 1–22. doi:10.1016/s0377-8398(99)00012-2
Flores, J. A., Sierro, F. J., Frances, G., Vazquez, A., and Zamarren, I. (1997). The last 100000 years in the western Mediterranean: sea surface water and frontal dynamics as revealed by coccolithophores. Mar. Micropaleontol. 29 (3-4), 351–366. doi:10.1016/s0377-8398(96)00029-1
Garfinkel, C. I., White, I., Gerber, E. P., and Jucker, M. (2020). The impact of SST biases in the tropical east pacific and Agulhas current region on atmospheric stationary waves in the southern hemisphere. J. Clim. 33 (21), 9351–9374. doi:10.1175/jcli-d-20-0195.1
Gordon, A. L., Lutjeharms, J. R. E., and Grundlingh, M. L. (1987). Stratification and circulation at the Agulhas retroflection. Deep sea Res. 34 (4), 565–599. doi:10.1016/0198-0149(87)90006-9
Gordon, A. L., Weiss, R. F., Smethie, W. M., and Warner, M. J. (1992). Thermocline and intermediate water communication between the South atlantic and Indian oceans. J. Geophys. Res. -Oceans 97 (C5), 7223–7240. doi:10.1029/92jc00485
Hagino, K., and Okada, H. (2006). Intra- and infra-specific morphological variation in selected coccolithophore species in the equatorial and subequatorial Pacific Ocean. Mar. Micropaleontol. 58 (3), 184–206. doi:10.1016/j.marmicro.2005.11.001
Haidar, A. T., and Thierstein, H. R. (2001). Coccolithophore dynamics off Bermuda (N. Atlantic). Deep Sea Res. 48 (8-9), 1925–1956. doi:10.1016/s0967-0645(00)00169-7
Hayat, S., Skampa, E., Gogou, A., Stavrakakis, S., Parinos, C., and Triantaphyllou, M. (2022). Seasonal variability in present-day coccolithophore fluxes in deep eastern mediterranean sea: a multi-year study (2015–2017) of coccolithophore export in se ionian sea at 4300 m depth. J. Mar. Sci. Eng. 10 (11), 1761. doi:10.3390/jmse10111761
Heaton, T. J., Kohler, P., Butzin, M., Bard, E., Reimer, R. W., Austin, W. E. N., et al. (2020). Marine20–the marine radiocarbon age calibration curve (0–55,000 cal bp). Radiocarbon 62 (4), 779–820. doi:10.1017/rdc.2020.68
Holliday, N. P., and Read, J. F. (1998). Surface oceanic fronts between Africa and Antarctica. Deep Sea Res. 45 (2-3), 217–238. doi:10.1016/s0967-0637(97)00081-2
Huang, J., Xu, F. H., Zhou, K. B., Xiu, P., and Lin, Y. L. (2017). Temporal evolution of near-surface chlorophyll over cyclonic eddy lifecycles in the southeastern Pacific. J. Geophys. Res.- Oceans 122 (8), 6165–6179. doi:10.1002/2017jc012915
Hutson, W. H. (1980). The Agulhas current during the late Pleistocene: analysis of modern faunal analogs. Science 207 (4426), 64–66. doi:10.1126/science.207.4426.64
Jiang, S. J., and Zhang, A. H. (2016). A slide-making technique for prepararing calcareous nannofossils form large amout of samples. Acta micropalaeontol. Sin. 33 (2), 207–210. doi:10.16087/j.cnki.1000-0674.2016.02.010
Johnstone, H. J. H., Kiefer, T., Elderfield, H., and Schulz, M. (2014). Calcite saturation, foraminiferal test mass. and Mg/Ca based temperatures dissolution corrected using XDX-A 150 ka record from the western Indian Ocean. Geochem. Geophy. Geosy. 15 (3), 781–797. doi:10.1002/2013gc004994
Jonathan, V. D. (2013). Controls and impact of Agulhas leakage. Ph.D Thesis. Kiel: Christian Albrechts University in Kiel.
Jordan, R. W., Broerse, A. T. C., Hagino, K., Kinkel, H., Sprengel, C., Takahashi, K., et al. (2000). Taxon lists for studies of modern nannoplankton. Mar. Micropaleontol. 39 (1-4), 309–314. doi:10.1016/s0377-8398(00)00026-8
Jordan, R. W., Zhao, M., Eglinton, G., and Weaver, P. P. E. (1996). Coccolith and alkenone stratigraohy and palaeoceanography at an upwelling site off NW Africa (ODP 658C) during the last 130000 years. Aberystwyth: Aberystwyth Press.
Lin, X., and Wang, Z. M. (2016). Changes of Agulhas retroflection in recent 21 years. Per. Ocean. Univ. China 46 (7), 11–14. doi:10.16441/j.cnki.hdxb.20150204
Lin, Z. (2019). Sediment records and climatic environment evolution during the last 200 ka in the southwest Indian Ocean. Sanya: University of Chinese Academy of Sciences.
Lisiecki, L. E., and Raymo, M. E. (2005). A Pliocene∼Pleistocene stack of 57 globally distributed benthic delta O18 records. Paleoceanography 20 (2). doi:10.1029/2004pa001071
Lutjeharms, J. R. E., and Ansorge, I. J. (2001). The Agulhas return current. J. Mar. Syst. 30, 115–138. doi:10.1016/s0924-7963(01)00041-0
Lutjeharms, J. R. E., and Valentine, H. R. (1984). Southern Ocean thermal fronts south of Africa. Deep-Sea Res. 31 (12), 1461–1475. doi:10.1016/0198-0149(84)90082-7
Lutjeharms, J. R. E., and Valentine, H. R. (1988). Eddies at the sub-tropical convergence south of africa. J. Phys. Oceanogr. 18 (5), 761–774. doi:10.1175/1520-0485(1988)018<0761:eatscs>2.0.co;2
Machu, E., Biastoch, A., Oschlies, A., Kawamiya, M., Lutjeharms, J. R. E., and Garcon, V. (2005). Phytoplankton distribution in the Agulhas system from a coupled physical-biological model. Deep Sea Res. 52 (7), 1300–1318. doi:10.1016/j.dsr.2004.12.008
Machu, E., and Garcon, V. (2001). Phytoplankton seasonal distribution from SeaWiFS data in the Agulhas Current system. J. Mar. Res. 59 (5), 795–812. doi:10.1357/002224001762674944
Maiorano, P., Marino, M., and Flores, J.-A. (2009). The warm interglacial marine isotope stage 31: evidences from the calcareous nannofossil assemblages at site 1090 (Southern Ocean). Mar. Micropaleontol. 71 (3-4), 166–175. doi:10.1016/j.marmicro.2009.03.002
Mcgillicuddy, D. J., Anderson, L. A., Bates, N. R., Bibby, T., Buesseler, K. O., Carlson, C. A., et al. (2007). Eddy/wind interactions stimulate extraordinary mid-ocean plankton blooms. Science 316 (5827), 1021–1026. doi:10.1126/science.1136256
McIntyre, A., and Be, A. W. H. (1967). Modern coccolithophoridae of the atlantic ocean—I. Placoliths and cyrtoliths. Deep-Sea Res. 14, 561–597. doi:10.1016/0011-7471(67)90065-4
Mohan, R., Mergulhao, L. P., Guptha, M. V. S., Rajakumar, A., Thamban, M., Anilkumar, N., et al. (2008). Ecology of coccolithophores in the Indian sector of the Southern Ocean. Mar. Micropaleontol. 67 (1-2), 30–45. doi:10.1016/j.marmicro.2007.08.005
Molfino, B., and McIntyre, A. (1990a). Precessional forcing of nutricline dynamics in the equatorial Atlantic. Science 249 (4970), 766–769. doi:10.1126/science.249.4970.766
Molfino, B., and McIntyre, A. (1990b). Nutricline variation in the equatorial atlantic coincident with the younger dryas. Paleoceanography 5, 997–1008. doi:10.1029/pa005i006p00997
Murtugudde, R., and Busalacchi, A. J. (1999). Interannual variability of the dynamics and thermodynamics of the tropical Indian ocean. J. Clim. 12, 2300–2326. doi:10.1175/1520-0442(1999)012<2300:ivotda>2.0.co;2
Okada, H. (1980). Calcareous nannofossils from deep sea drilling project sites 442 through 446, philippine sea. Init. Rep. DSDP 58, 549–565. doi:10.2973/dsdp.proc.58.107.1980
Okada, H., and Honjo, S. (1973). The distribution of oceanic coccolithophorids in the Pacific. Deep sea Res. 20, 355–374. doi:10.1016/0011-7471(73)90059-4
Okada, H., and Honjo, S. (1975). Distribution of coccolithophores in marginal seas along the western pacific ocean and in the red sea. Mar. Biol. 31, 271–285. doi:10.1007/bf00387154
Okada, H., and McIntyre, A. (1979). Seasonal distribution of modern coccolithophores in the western North Atlantic ocean. Mar. Biol. 54, 319–328. doi:10.1007/bf00395438
Patil, S. M., Mohan, R., Shetye, S. S., Gazi, S., Baumann, K.-H., and Jafar, S. (2017). Biogeographic distribution of extant coccolithophores in the indian sector of the southern ocean. Mar. Micropaleontol. 137, 16–30. doi:10.1016/j.marmicro.2017.08.002
Peeters, F. J. C., Acheson, R., Brummer, G.-J. A., Ruijter, W. P. M., Schneider, R. R., Ganssen, G. M., et al. (2004). Vigorous exchange between the Indian and Atlantic oceans at the end of the past five glacial periods. Nature 430 (7000), 661–665. doi:10.1038/nature02785
Perch-Nielsen, K. (1985). “Mesozoic calcareous nannofossils,” in Plankton stratigraphy (Cambridge: Cambridge University Press), 329–426.
Prell, W. L., Hutson, W. H., Williams, D. F., Be, A. W. H., Geitzenauer, K., and Molfino, B. (1980). Surface circulation of the Indian Ocean during the last glacial maximum, approximately 18000 yr B.P. Quat. Res. 14, 309–336. doi:10.1016/0033-5894(80)90014-9
Rackebrandt, N., Kuhnert, H., Groeneveld, J., and Bickert, T. (2011). Persisting maximum Agulhas leakage during MIS 14 indicated by massive Ethmodiscus oozes in the subtropical South Atlantic. Paleoceanography 26 (3). doi:10.1029/2010pa001990
Romero, O. E., Kim, J.-H., Barcena, M. A., Hall, I. R., Zahn, R., and Schneider, R. (2015). High-latitude forcing of diatom productivity in the southern Agulhas Plateau during the past 350kyr. Paleoceanography 30 (2), 118–132. doi:10.1002/2014pa002636
Siegel, D. A., Peterson, P., Mcgillicuddy, D. J., Maritorena, S., and Nelson, N. B. (2011). Bio-optical footprints created by mesoscale eddies in the Sargasso Sea. Geophys. Res. Lett. 38, 392. doi:10.1029/2011gl047660
Song, B., Su, X., Lv, S. H., Ni, J. Y., Liao, S. L., Tao, C. H., et al. (2020). Geochemical contrast in sediments from active and inactive hydrothermal fields on the Southwest Indian ridge. Geoscience 34 (1), 130–140. doi:10.19657/j.geoscience.1000-8527.2019.010
Stramma, L., and Lutjeharms, J. R. E. (1997). The flow field of the subtropical gyre of the South Indian Ocean. J. Geophys. Res. 102 (C3), 5513–5530. doi:10.1029/96jc03455
Stuiver, M., and Reimer, P. J. (1993). Extended 14C data base and revised CALIB 3.0 14C age calibration program. Radiocarbon 35 (1), 215–230. doi:10.1017/s0033822200013904
Su, X. (1996). Development of late tertiary and quaternary coccolith assemblages in the northeast atlantic. Kiel: Research center for marine geosciences Christian Albrechts University in Kiel.
Su, X., Qu, Y., Chen, F., Yang, S. X., Zhou, Y., Cui, H. P., et al. (2020). Deep sea benthic foraminifera from the taixinan basin and changes of their cold seep microhabitats during the past 50000 years. Earth Sci. Front. 27 (6), 255–275. doi:10.13745/j.esf.sf.2020.6.13
Su, X., and Wei, K. Y. (2005). Calcareous nannofossils and variation of the Kuroshio current in the okinawa trough during the last 14000 years. Terr. Atmos. Ocean. Sci. 16 (1), 095–111. doi:10.3319/tao.2005.16.1.95(ot
Tangunan, D., Baumann, K.-H., and Fink, C. (2020). Variations in coccolithophore productivity off South Africa over the last 500 kyr. Mar. Micropaleontol. 160, 101909–101912. doi:10.1016/j.marmicro.2020.101909
Tangunan, D., Berke, M. A., Cartagena-Sierra, A., Flores, J. A., Gruetzner, J., Jimenez-Espejo, F., et al. (2021). Strong glacial-interglacial variability in upper ocean hydrodynamics, biogeochemistry, and productivity in the southern Indian Ocean. Commun. earth environ. 2 (1), 80. doi:10.1038/s43247-021-00148-0
Waelbroeck, C., Labeyrie, L., Michel, E., Duplessy, J. C., Mcmanus, J. F., Lambeck, K., et al. (2002). Sea-level and deep water temperature changes derived from benthic foraminifera isotopic records. Quat. Sci. Rev. 21 (1-3), 295–305. doi:10.1016/s0277-3791(01)00101-9
Wang, P., Prell, W. L., and Blum, P. (2000). Proceedings of the ocean Drilling program, initial reports, 184. College Station, TX: Ocean Drilling Program.
Wells, P., and Okada, H. (1997). Response of nannoplankton to major changes in sea-surface temperature and movements of hydrological fronts over Site DSDP 594 (south Chatham Rise, southeastern New Zealand), during the last 130 kyr. Mar. Micropaleontol. 32, 341–363. doi:10.1016/s0377-8398(97)00025-x
Yang, T. N., Wei, K. Y., and Gong, G. C. (2001). Distribution of coccolithophorids and coccoliths in surface ocean off northeastern Taiwan. Bot. Bull. Acad. Sin. 42 (4), 287–302. doi:10.7016/BBAS.200110.0287
Young, J. R., Geisen, M., Cros, L., Kleijne, A., Probert, I., and Ostergaard, J. B. (2003). A guide to extant coccolithophore taxonomy. J. Nannoplankt. Res. 1, 1–132. doi:10.58998/jnr2297
Zhang, L. Y., Tao, C. H., Su, X., Lv, S. H., Zhou, J. P., Deng, X. M., et al. (2022). Characteristics of rare earth elements in the surface sediments of Southwest Indian Ridge: implication of grain size for the identification of hydrothermal activity. Geo - Mar. Lett. 42 (1), 7–18. doi:10.1007/s00367-022-00729-8
Zhang, S. Y., and Liu, C. L. (2005). On palaeoceanographic significance of Florisphaera profunda (calcareous nannofossils). Acta micropalaeontol. Sin. 22 (3), 278–284. doi:10.3969/j.issn.1000-0674.2005.03.007
Zhao, J. T., Zhou, L. C., Li, J., Cao, Q. Y., and Li, T. G. (2009). Variations and control factors of percent content of lower photic calcareos nannofossil species-Florisphaera Profunda in the middle of okinawa trough since MIS6. Mar. Geol. Quat. Geol. 29 (1), 67–71. doi:10.3724/SP.J.1140.2009.01067
Keywords: calcareous nannofossil, pelagic sediment, Agulhas Return Current, last glacial maximum period, southwest Indian ridge
Citation: Yu C, Su X, Ding X, Zhang J, Tao C and Lv S (2024) Calcareous nannofossil records and the migration of the Agulhas Return Current during the last 40 kyr. Front. Earth Sci. 12:1322023. doi: 10.3389/feart.2024.1322023
Received: 15 October 2023; Accepted: 11 April 2024;
Published: 10 May 2024.
Edited by:
Erik Wolfgring, Austrian Science Fund (FWF), AustriaReviewed by:
Luigi Jovane, University of São Paulo, BrazilMatthias Kranner, University of Kiel, Germany
Copyright © 2024 Yu, Su, Ding, Zhang, Tao and Lv. This is an open-access article distributed under the terms of the Creative Commons Attribution License (CC BY). The use, distribution or reproduction in other forums is permitted, provided the original author(s) and the copyright owner(s) are credited and that the original publication in this journal is cited, in accordance with accepted academic practice. No use, distribution or reproduction is permitted which does not comply with these terms.
*Correspondence: Xin Su, eHN1QGN1Z2IuZWR1LmNu