
94% of researchers rate our articles as excellent or good
Learn more about the work of our research integrity team to safeguard the quality of each article we publish.
Find out more
ORIGINAL RESEARCH article
Front. Earth Sci. , 26 January 2024
Sec. Economic Geology
Volume 12 - 2024 | https://doi.org/10.3389/feart.2024.1308426
 Guanghuan Chen1,2,3
 Zhankun Liu1,2,3
 Guodong Chen1,2,3*Shaofeng Xie4Xin Yang5Xiao Li5Yudong Chen2,3Zihe Hao2,3Huiting Zhong2,3Liqun Jiang2,3
Gold mineralization in the Jiaojia gold belt was formed in a structurally-dominant hydrothermal mineral system showing a close spatial association with the Jiaojia detachment fault. This study delves into the Jiaojia gold belt from the perspective of coupled spatial association and ore-forming processes by employing spatial analysis of three-dimensional (3D) models, 3D ore-forming numerical modeling, and 3D prospectivity modeling using machine learning techniques (random forest (RF) and multilayer perceptron (MLP)). The overarching goal is to gain insight into the structural-hydrothermal gold system and pinpoint potential areas of deep-seated gold deposits for future exploration endeavors. The spatial analysis of ore-controlling faults uncovers a close correlation between gold enrichment and specific fault geometrical attributes, including a dip angle ranging from 20° to 40°, minimal variations in dip angle (less than 5°), and convex topographical features. These attributes likely stem from the influence of fault morphology on the flow and pooling of fluids. In conjunction with this, 3D ore-forming numerical modeling of structural deformation and fluid flow reveals that gold mineralization is intertwined with moderate volumetric strain and shear strain of rock and fluid divergence. This interaction seems particularly pronounced in areas characterized by channel-like or gentle features. Consequently, it is plausible that gold distribution in the Jiaojia region is the outcome of a comprehensive coupling process involving strain localization, rock deformation, fluid flow, heat transfer and/or interaction. The deep gold prospectivity models of RF and MLP for the Jiaojia district jointly using the predictive variables of fault geometry features and ore-forming simulation data (volume strain, shear strain, temperature variation, and fluid flux) exhibit higher AUC (area under the curve) values compared to models employing individual predictor variable datasets. This improvement underscores their enhanced predictive capability. The prospectivity results thus were used for identifying gold potential within the Jiaojia region, where five promising gold targets at depth were ultimately determined.
The Jiaodong Peninsula, Eastern China, is renowned as the largest gold province in China, where has been detected more than 5,000 t of gold resources (Figure 1) (Deng et al., 2020; Chen et al., 2023). Gold deposits in this region typically exhibit vein-to disseminated style mineralization, and are categorized into two primary types: 1) veinlet- and disseminated-type (Jiaojia-type), characterized by veinlet- and disseminated-style gold mineralization closely associated strongly altered and fractured rocks, and 2) vein-type (Linglong-type), identified by the massive, parallel auriferous quartz veins at steep dip angles (Goldfarb and Santosh, 2014; Li et al., 2015; Guo et al., 2017). Notably, the Jiaojia-type deposits account for more than 80% gold reserves of the Jiaodong deposits and are dominant in large-scale gold deposits (>20 t), such as the Jiaojia, Xincheng, and Sanshandao deposits (Yang et al., 2016; Wen et al., 2016; Song et al., 2019). The Jiaojia-type gold deposits are considered to hold significant economic potential for future mineral exploration in the Jiaodong Peninsula.
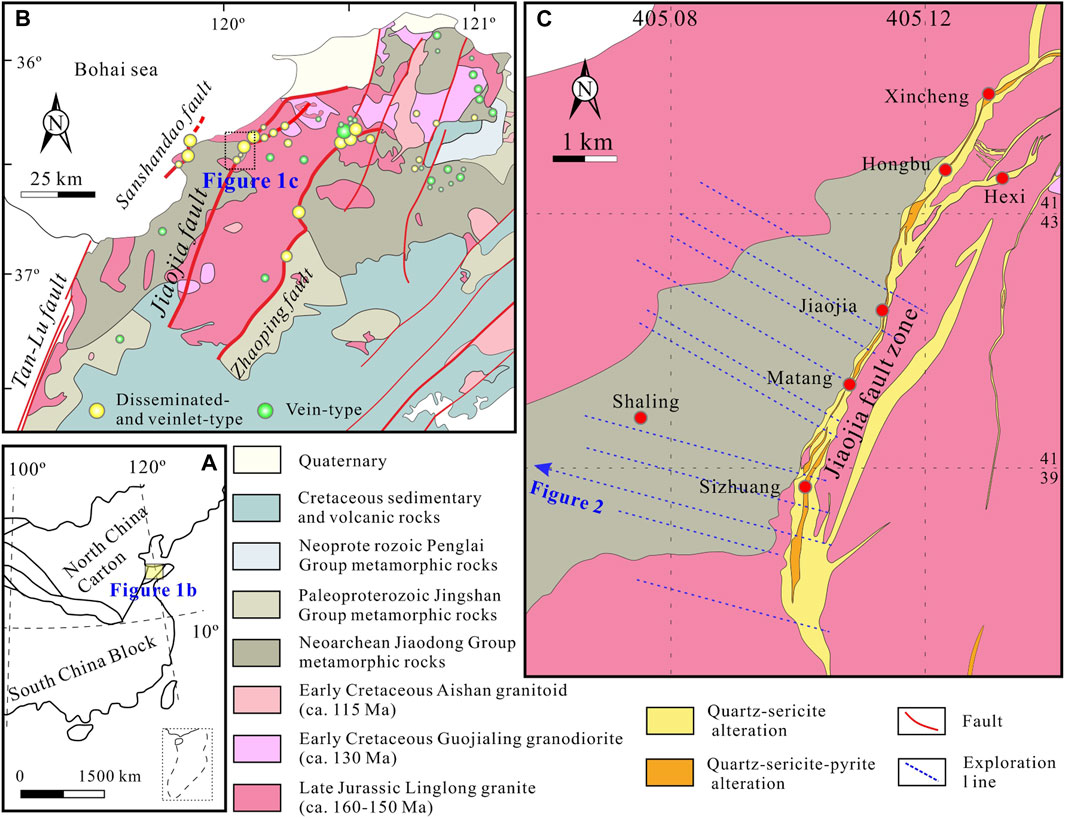
FIGURE 1. Geological maps showing the location of the Northwestern Jiaodong Peninsula (A) and the Jiaojia gold belt (B). And the geology map of the Jiaojiao gold belt (C) (Modified from Deng et al., 2015; Liu et al., 2021b). The legends are for the subfigures of (B) and (C).
The Jiaojia-type gold deposit is originally defined in the Jiaojia gold belt (Figure 1B), which is located in the northwestern Jiaodong Peninsula. The Jiaojia gold belt has been found total gold resources >1,400 t (Chen and Xiao, 2023). As typical structurally-controlled hydrothermal deposits, the Jiaojia-type gold deposits commonly present the closely spatially association with regional NE-NEE striking detachment faults (such as Jiaojia, Sanshandao), such as 1) gold enrichment trends to occur the footwall of these faults with a parallel feature, 2) fertile gold orebodies are often related to fault gentle parts, and 3) mineralization-alteration zonation is generally surrounding the regional fault (Fan et al., 2003; Li et al., 2015; Song et al., 2015; Mao et al., 2019; Song et al., 2023). The formation of Jiaojia-style gold mineralization, therefore, is essentially controlled by structures in an epizonal setting (Yang et al., 2016). However, the structural controls on gold mineralization distribution remains incomplete based solely on these empirical ore patterns, especially from the perspective of interconnected spatial association and ore-forming processes, hindering the deep gold exploration in the Jiaodong Peninsula.
Recent advancements in three-dimensional (3D) geological modeling have significantly improved the quality of geology visualization. Unlike traditional geological investigations that rely solely on visual observations, 3D models provide new and valuable insights into the distribution and genesis of ore deposits (Carranza, 2009; Wang et al., 2015; Liu et al., 2016; Kitt et al., 2017; Stoch et al., 2017; Unger et al., 2018; Liu et al., 2021a). One aspect, the 3D models of geology bodies (e.g., fault, alteration, and orebody) directly present the spatial features that aid in investigating its distribution pattern (Perrouty et al., 2014; Unger et al., 2018; Mao et al., 2023a; Huang et al., 2023; Xiao et al., 2023). In addition, spatial analysis (e.g., buffer analysis, shape analysis) on the 3D models with a powerful ability to obtain the model features have been applied to unravel complex relationships between mineralization and surrounding geological units a quantitative data view (Liu et al., 2013; Haddad-Martim et al., 2017; Nguemhe Fils et al., 2020; Liu et al., 2021a; Mao et al., 2023b). Notably, 3D geological models, as a data foundation, also provide a framework for ore-forming numerical simulations of the behavior of hydrothermal fluids and mineralization processes. The ore-forming simulation of hydrothermal deposits, in particular for structurally-dominant mineral systems, has enhanced the understanding of the complex mineralization geodynamic conditions and mineralizing fluid flow pattern and helped characterize the spatial-temporal evolution of mineralization events (Zhao et al., 2012; Liu et al., 2016; Li et al., 2017; 2018b; Huang et al., 2020; Xiao and Wang, 2021; Chen and Xiao, 2022; Xie et al., 2022). The 3D numerical simulation has been used to identify potential mineralization, but the large uncertainties and bias generated by numerical simulation of complex ore-forming processes may hinder its spatial localization of mineralization on a small scale for drillhole verification (Oliver et al., 2014; Zuo et al., 2021). However, the information implied in the simulation geodynamic data may be potential variables for mineral exploration, like the geometric features of 3D models extracted by spatial analysis. As far as we learned, there are only few attempts of prospectivity modeling with concerns of ore-forming simulation (Wang et al., 2020; Liu et al., 2023; Xiao et al., 2024). How to reliably dig the ore-forming information in simulation geodynamic data and integrate it with spatial features to conduct 3D prospectivity modeling is still challenging.
Given the above issues, this study focuses on the Jiaojia gold belt as a case study, employing the spatial analysis of 3D models to obtain geometric variables and ore-forming numerical simulation to obtain geodynamic variables. In terms of the highly nonlinear association between gold and the above variables, we conducted a machine learning-based prospectivity modeling to capture the high-dimension ore-controlling features from these input data. The synergy among these works aims to 1) elucidate the key ore-controlling factors controlling gold enrichment in the Jiaojia gold belt and gain the understanding of the mineralization function of structural-dominant gold system, 2) contribute to effective and realistic decision-making in gold exploration endeavors at Jiaojia, and 3) ultimately establish a useful mineral exploration workflow at low cost.
The Jiaodong Peninsula is situated in the eastern North China Craton and comprises two tectonic units of the Jiaobei terrane and the Sulu ultra-high pressure orogenic belt. The Jiaobei terrane hosts most gold deposits (Figure 1), in particular for the large scale (>20 tons Au) deposits, including Sanshandao, Jiaojia, Linglong and Dayingezhuang by a series of NE–NEE striking regional low-angle (mostly <45°) faults. The exposed rocks in the Jiaobei terrane include the Precambrian TTG and metamorphic rocks (ca. 2.5 Ga Jiaodong and ca. 1.9 Ga Jingshan group; Tang et al., 2007; Shan et al., 2015; Shan and Zhai, 2020), Mesozoic diorite and granite (ca. 160–155 Ma Linglong biotite granite, ca. 132–128 Ma Guojialing granodiorite and monzogranite, and ca. 115 Ma Aishan monzogranite; Goss et al., 2010; Li et al., 2012; Mao et al., 2022), and mafic-felsic dikes (lamprophyre, quartz diorite, and diorite porphyry; Deng et al., 2017) (Figure 1). The distribution of intrusive rocks is also closely associated with the region NE structure (Goldfarb and Santosh, 2014; Deng et al., 2017).
The Jiaojia gold belt is controlled by the NNE-striking Jiaojia fault zone, which extends more than 60 km in surface and hosts a huge hydrothermal alteration-Au mineralization zone (Figure 1B). It strikes NE 10°–70° and dips NW 20°–50°. The fault was initially formed under the transpressional tectonic regime and lately deformed at an extensional stress state during the ore-forming period (Deng et al., 2015), which results in the network of ductile-brittle shear fractures with varying morphology.
Gold deposits in the Jiaojia belt mainly include Sizhuang, Jiaojia and Xincheng (Figure 1B) and share similar characteristics in terms of age (∼120 Ma), geology (granite and structure hosting) and mineralization (disseminated and veinlet) characteristics (namely, Jiaojia-type), like other disseminated gold deposits in the Jiaodong Peninsula (Deng et al., 2015; Song et al., 2015; Yang et al., 2016; Yu et al., 2019; Zhang et al., 2020; Mao et al., 2023b). Orebodies at Jiaojia are spatially continuous and parallelly distributed in the fractured, pyrite-sericite-quartz altered granites at the footwall of the Jiaojia fault (Figure 2). Gold orebodies generally have a variable extending down plunging (60–2,400 m), thickness (1.16–125.0 m; mean ∼15 m) and Au grade (1.0–17.6 g/t; mean 3.0 g/t), which is usually linked to the geometry (divergent bends or dilatational jogs) of fault zone or subsidiary faults (Wang et al., 2019). The recent drill hole data have detected gold orebodies at a depth of −2,850 m in the Sizhuang gold deposit (Yuan et al., 2014). The mineralization is characterized by strong (pyrite)-sericite-quartz alteration, silicification, K-feldspar alteration and sulfide alteration on cataclastic granite. Gold is mostly observed in the fractures of pyrite intergrown with chalcopyrite and galena and minor as inclusions in sulfide (Yang et al., 2016; Liu et al., 2021b).
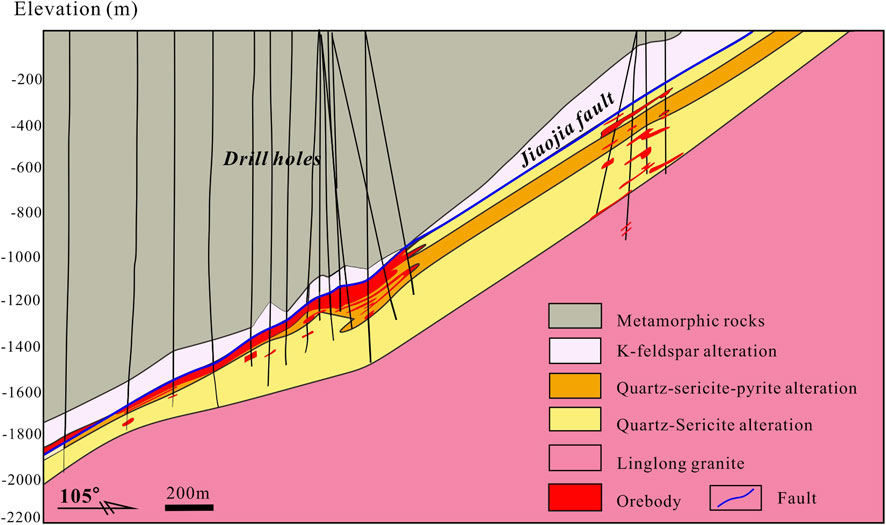
FIGURE 2. Representative cross-section showing fault, mineralization, alteration and wall rocks in the Jiaojia gold belt.
The fluid inclusion studies have revealed that the ore-forming fluids for the Jiaojia gold mineralization are low density, moderate pressure, low salinity and CO2-rich and its homogenization temperatures mainly vary from 120°C to 320°C (Wang et al., 2015; Yang et al., 2016). Besides, the isotope data have revealed that the ore-forming fluids have already interacted with basement and shallow rocks and also mixed with external waters in the gold system (Mao et al., 2008; Wang et al., 2015; Deng et al., 2020a). This is consistent with other gold deposits in the Jiaodong region. Thus, a genetic model involving deep (lithospheric mantle sourced) auriferous fluid contributing to mineralization is widely accepted in the Jiaojia district (Goldfarb and Santosh, 2014; Song et al., 2015; Yang et al., 2016). At the gold precipitation level, i.e., shallow crust (<10 km), the ore-forming fluids flow and pooling are dominant by the regional fault deformation at a compression-extension transition setting.
Gold mineralization in the Jiaojia belt is primarily attributed to the structure-dominant hydrothermal system, of which the Jiaojia fault plays the roles of the conduits of ore fluid flow, driver of fluid ascending, trapping of fluid pooling and promoter of fluid-rock interaction (Wang et al., 2015; Wang et al., 2019; Huang et al., 2020; Liu et al., 2021b). In this study, we focus on the fault geometry and its associated mineralization geodynamic process by using the modeling spatial analysis and ore-forming computational simulation to quantitatively analyze their joint influence on gold mineralization. The output of spatial analysis and simulation are further used as predictive variables for deep gold prospectivity modeling at Jiaojia, by following a traditional 3D prospectivity modeling approach (Yuan et al., 2014; Nielsen et al., 2015; Xiao et al., 2015; Li et al., 2018; Li et al., 2019; Mao et al., 2019; Xiang et al., 2019; Zhang et al., 2019; Zhang et al., 2020; Mao et al., 2020; Liu et al., 2021c). The main steps of this work (Figure 3) include.
(1) data prerequisite: gathering all exploration data about the Jiaojia gold belt (e.g., geology maps, drill hole data, geochemical surveys, geophysical data, etc.);
(2) 3D modeling: conducting a realistic 3D modeling of geology units (fault, orebody and wall rocks),
(3) prediction variables generation: 1) identifying the key factors related to mineralization and quantitatively obtaining the ore-controlling features by geospatial analysis, and 2) performing 3D numerical simulation and simulating the structural deformation and fluid flow processes;
(4) prediction variables integration and practice: integrating the geometric features and simulation data as predictor variables using machine learning methods to establish gold prospectivity model and determining gold exploration targets.
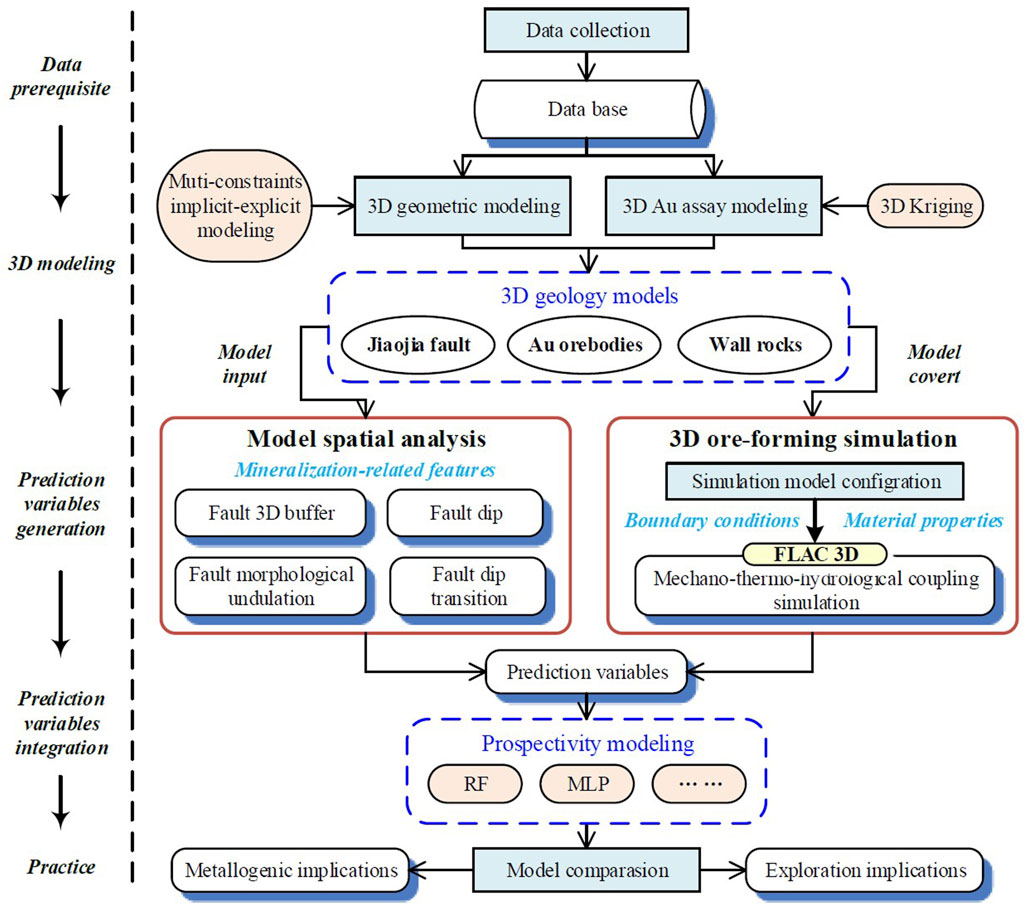
FIGURE 3. Workflow of this study.
The extensive library of exploration data involved all the mines in the Jiaojia gold belt (e.g., Xincheng, Jiaojia, Sizhuang, Shaling, etc) was conducted after collecting one 1:10,000 scale surface geological map, 187 cross-sections, 745 drillholes, 92,304 gold assays (ore and non-ore), 11 geochemistry profiles, 41 Controlled-Sourse Audio-frequency Magnetotelluric (CSAMT) profiles, and 3 seismic profiles. The extensive data broadly covers the available exploration areas at Jiaojia, combined with skilled geology interpretations and advanced modeling methods, permitting us to construct reliable geology models.
We here employed a combination of explicit and implicit modeling to build the 3D models of the Jiaojia fault, wall rocks and orebodies (Figure 4). The models (fault, orebody, and wall rocks) in areas with fault or orebody location exactly detected by drill holes or tunnels were created by the explicit modeling method, while the fault models in the areas with few drillholes were constructed by a multiple constraint implicit modeling method. The detailed method of implicit modeling for fault can be found in the literature (Mao et al., 2019; Wang et al., 2023). Briefly, here, we first construct an interpretive fault model as an initial model based on geology knowledge and drill hole data. It is further stepwise refined by the gradual addition of geophysical data (e.g., gravity data, CSAMT and seismic profiles) that yields the fault location interpretation by the level set function in a Bayesian framework (Wang et al., 2023). By using the modeling approach, we constructed the Jiaojia fault model with a depth range from the surface to −3,000 m (Figure 4B).
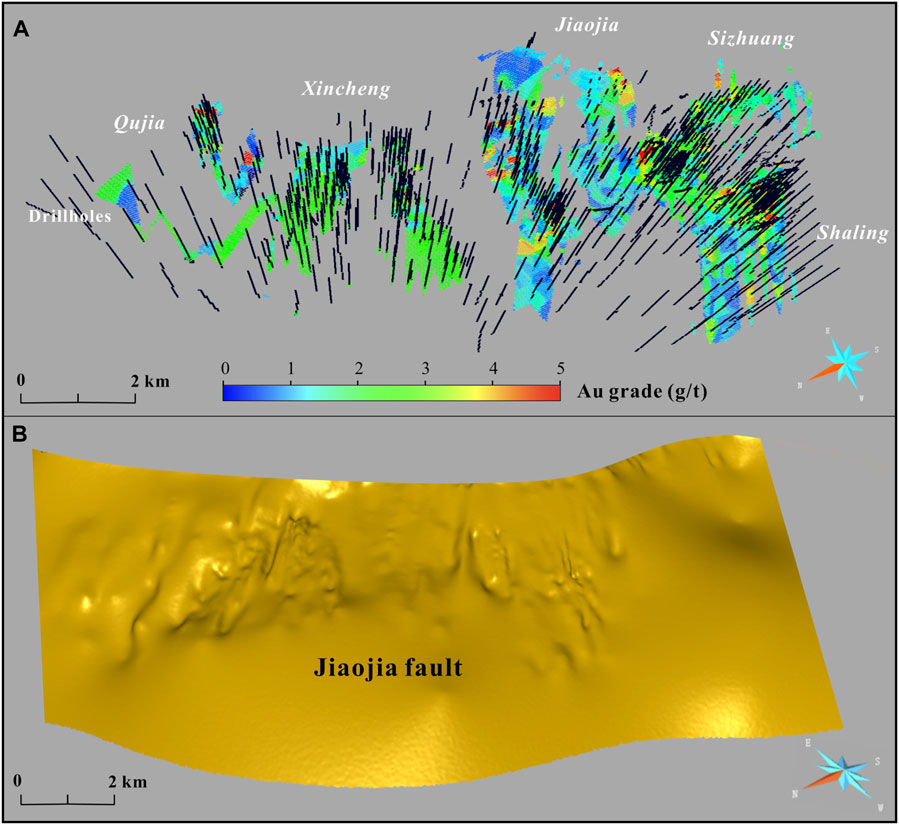
FIGURE 4. 3D models of gold orebodies and Jiaojia fault in the Jiaojia district.
Considering gold mineralization in the Jiaojia belt is spatially continuous and has a variable thickness, we establish the 2D and 3D initial curves of orebodies based on cross-section or tunnels map and further manually interconnect them in SKUA-GoCAD@™ to generate the 3D surface models using our geology skills. In terms of the mineralization and predictive attributes of orebody, the surface models were further voxelized into block models to store the grade and ore-controlling information. In this study, we generated 47,801 25×25×25 m cubic blocks of orebody models. Given the collected gold assay data, the Kriging method was used for gold grade interpolation for each voxel. The interpolation results for known areas including ore and non-ore (Figure 4A) show the gold grade ranges from 0 to 27.4 g/t with a median value of 0.57, a mean value of 0.91, and a standard deviation of 1.12. We also define a term of AuMet to represent the gold amounts in one voxel, which is calculated by the AuMet summary of subvoxels. For one subvoxel, AuMet=Au × ρ×V, where Au is gold grade, ρ is fixed as 2.76 g/cm3, and V is the volume of voxel. The AuMet varies in the range of 0–417,493 g with a median value of 1,405, a mean value of 8,698, and standard deviation 22,951.
Given the aforementioned 3D models, we performed several spatial analyses on geometry of the Jiaojia fault that is considered as the most important ore-controlling factor to obtain geometric features (Figure 3). Typically, the fault controls on gold mineralization can reflect the fluid flow along or from conduits, fluid pooling degree or gold precipitation related to pressure fluctuation. Here the 3D buffer analysis, 3D morphological analysis and calculation of dip and dip variation were conducted. The 3D buffer analysis can yield the distance field of the Jiaojia fault that represents the fault influence on wall rocks that promote ore fluids escape from fluid conduits. The fault distance to one voxel (dF) is defined as positive when it is located on the hanging wall and negative otherwise. The dip and dip variation calculation are conducted based on the triangular irregular network (TIN) of the fault model. Due to the possible local errors related to the small size of TIN, the dip (dipF) and its variations (vDip) are evaluated in a 3D buffer space. We define the negative vDip reflect the fault from steep to gentle (dip decreasing) and positive otherwise. The 3D morphological analysis on fault surface was conducted based on mathematical morphology (Serra and Vincent, 1992). We use the 3D shape analysis method for geological bodies to capture shape features of faults. Specially, the opening-closing morphological filtering in morphological techniques is used to extract the trend shape of faults. Given the trend shape of faults, the hierarchical shape undulation features are extracted from faults by adopting set operations and Euclidean distance transform. In this work, two scale of sphere elements were used to generate the variable of waF and wbF. Details of 3D model spatial analysis above mentioned have been described in our previous studies (Mao et al., 2019; 2020; Liu et al., 2021a; Deng et al., 2021). After the spatial analysis of fault model, we correlated these features to orebody voxel models via the minimum Euclidean distance to resent the spatial association between mineralization and fault.
To conduct 3D numerical modeling of coupled thermal, hydraulic and mechanical processes in the Jiaojia gold system to obtain geodynamic variables (Figure 3), the explicit finite difference code FlAC3D (Goss et al., 2010) was used. This code solves a series of governing equations that can approximate and characterize fluid flow, heat transport, and rocks deformation during ore-forming processes, and has been applied successfully in various hydrothermal deposits (Liu et al., 2016; Li et al., 2018b; Li et al., 2018c; Eldursi et al., 2021). The specific principles, governing equations, and implementation have been summarized in detail in the Help file of the FLAC3D software, and here it will not be reiterated.
In FLAC3D, the model domain is discretized into hexahedral grids, and assigned physical and mechanical properties on each hexahedral grid. Next, FLAC3D solves governing equations on each grid point using an iterative, time-stepping approach (Itasca, 2012). All grid points are computed once for one time step, and the iterative process can involve sequential steps for fluid flow, deformation, and heat conduction (Itasca, 2012; Li et al., 2017). Within each time step, the simulation progressively advances the evolution of the system by solving equations for each physical field through multiple iterations.
The model is treated as a saturated isotropic porous medium. During deformation, the response of rocks to applied stresses typically follows Mohr-Coulomb constitutive model. Specifically, the initial response of rocks is elastic, and after the applied stress exceeds the yield point defined by the Mohr-Coulomb yield criterion, the plastic deformation occurs (Oliver et al., 2006). Such a model is capable of capturing important damage mechanisms in rocks, such as shear damage alone fractures or fault zones, and has been used in most numerical simulation scenarios of ore-forming process (Gessner, 2009; Huang et al., 2020; Xie et al., 2022; Shan et al., 2023). Fluid flow adheres to Darcy’s law (Oliver et al., 2006). Changes in volume during deformation induce changes in pore pressure, which is the driving force of fluid flow (Zhao et al., 2012; Zhao et al., 2022). Hydrothermal fluid flow can change the temperature of surrounding rocks, which in turn affects the mechanical properties of rocks and leads to changes in fluid.
This study applied the 3D geological modeling approach as stated above to construct the geological model at Jiaojia. The model consists of the fault zone, the hanging wall, and the footwall, and an erosion cover of 5 km (Figure 5). Such a simplified model of fault-wall rocks-source zone has also been adopted in numerical simulation experiments in previous studies (Li et al., 2017; Huang et al., 2020; Xie et al., 2022). This model was meshed by dividing geological units into grids, ensuring dense divisions near the fault zone and lithological contact surfaces. As a result, a total of 10.92 million cubic cells were generated. These processes were carried out in the GOCAD software. The fault zone and wall rocks were simplified as homogeneous, isotropic, viscoelastic porous media. The specific mechanics and thermodynamics-related parameters in the model are documented in Table 1.
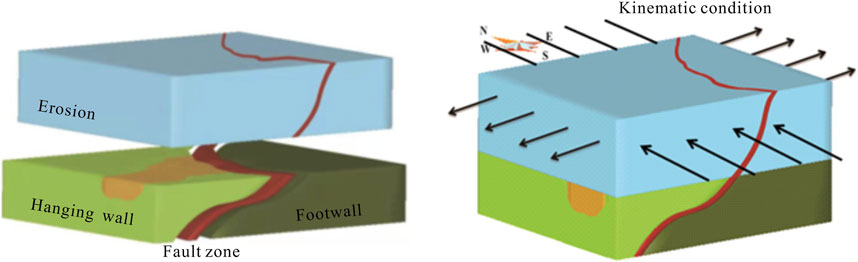
FIGURE 5. Concept model for ore-forming numerical simulation in the Jiaojia gold belt.
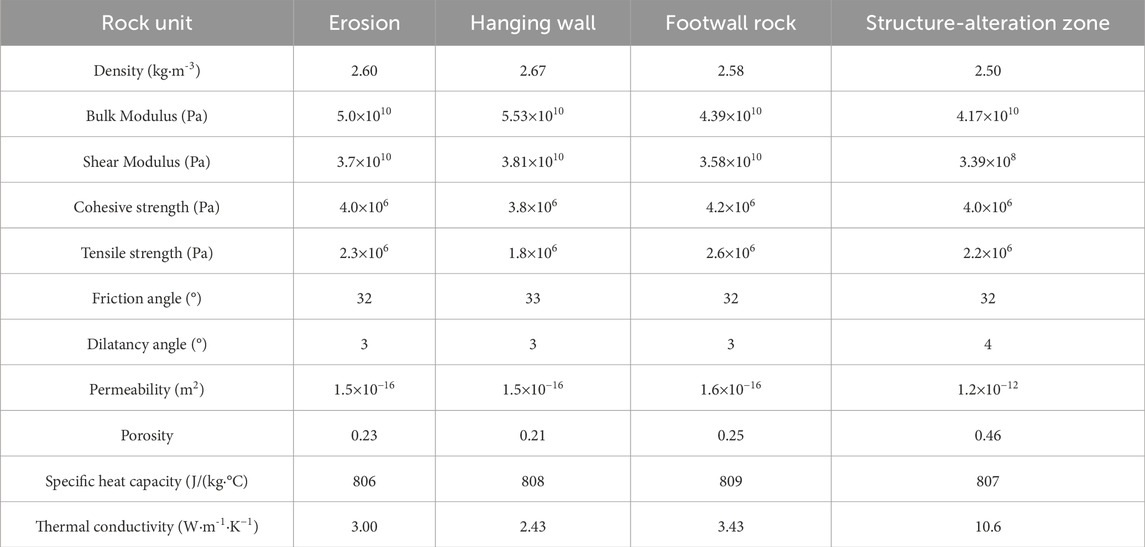
TABLE 1. Parameters of rocks for computational simulation in the Jiaojia gold belt.
Following a general model (Fournier, 1999), hydrostatic pressure gradient was used as the initial pore pressure, and the erosion cover was treated as a fixed pore pressure surface. The initial temperature on the top of the model is 20°C and a gradient of 30°C/km is set in the Jiaodong Group and Granite rocks. The temperature of the fault zone is much higher than wall rocks, and set to 300°C. The two lateral boundaries are both assumed to be impermeable to heat transfer.
The bottom boundary of the model is fixed vertically, but moves freely in the horizontal direction. During deformation simulation, the top boundary is allowed to deform freely both vertically and horizontally. The velocity of the geological strain is mostly in the range of 10–11∼10–17 m/s (Pfiffner and Ramsay, 1982), so this study applied an initial extensional velocity of 10–13 m/s normal to the NW-SE direction boundaries, and a compressional velocity of the same magnitude in the NE-SW direction boundaries. Such a configured model can simulate the structural deformation of the Jiaojia fault during ore-forming period and yield the calculation results of volume strain, shear strain, principal stress, etc.
The above prediction variables are nonlinear, high-dimensional and likely information overlapping, which results in more challenges of predictor variables integration (Xiao et al., 2022; Chen and Xiao, 2023; Liu et al., 2024; Xiao et al., 2024). Facing this issue, we here consider using two machine learning methods to conduct the data abstraction and high-level feature extraction. This can help us find the inherent difference in prospectivity modeling when using different sets of variables.
The Random forest (RF) algorithm is an integrated learning algorithm. Its core concept involves constructing multiple decision trees by randomly selecting features and samples from a pool of decision trees or a set of hierarchically organized restrictions or conditions (Figure 6). These trees are then utilized sequentially, from the root node to the terminal nodes or leaves, to make iterative predictions concerning the phenomena represented by the training data. Each decision tree within a random forest employs a training subset, with as many random selections and replacements as there are trees in the ensemble. This entails using bootstrap aggregation, where roughly 70∼90% of the training samples are employed to formulate predictions, while the remaining is used to assess prediction accuracy. Moreover, random selection of predictor variables takes place for each node and bifurcation in the decision tree. The RF algorithm, as a versatile and robust ensemble learning technique, serves well in classification or regression tasks. Combining multiple decision trees and introducing randomness, it provides robust and accurate predictions, making it an important tool for a variety of practical applications in different domains.
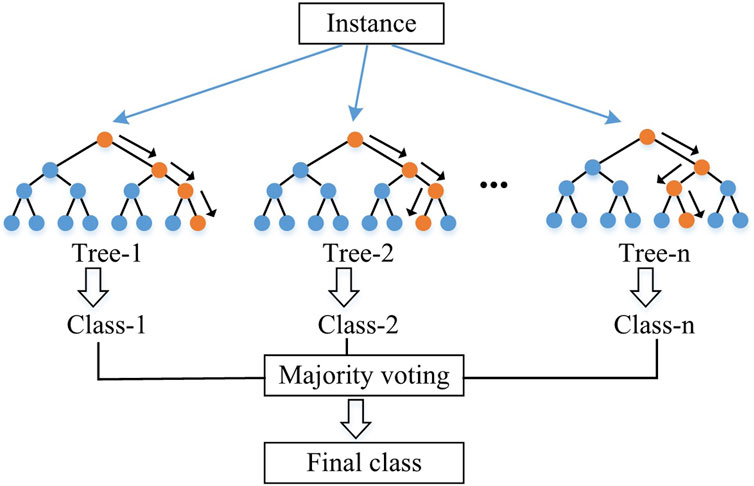
FIGURE 6. Schematic of random forest (RF).
The deep neural network of the multilayer perceptron (MLP) is a powerful and widely used artificial neural network architecture, in which network topology consists of multiple layers, including an input layer, one or more hidden layers, and an output layer (Figure 7). Each layer comprises a set of inter-connected neurons, and the neurons in one layer are fully connected to the neurons in the subsequent layer. The depth of the network is determined by the number of hidden layers, and a deeper network allows for more complex representations and feature extraction.
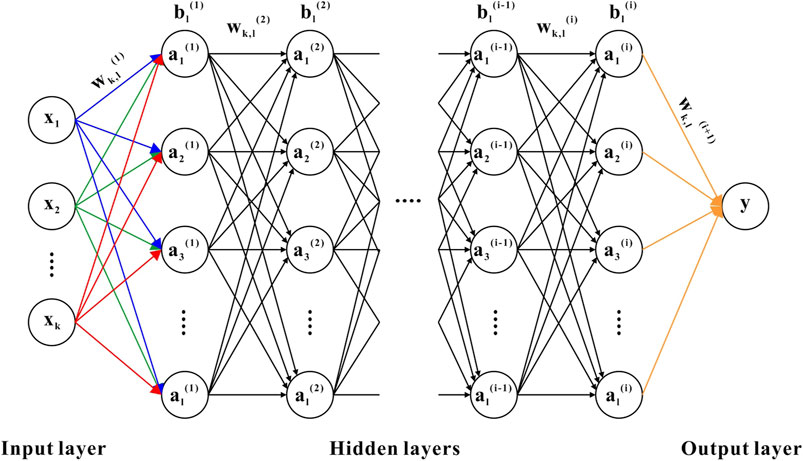
FIGURE 7. Schematic of multilayer perceptron (MLP). It includes an input layer with k neurons per input layer, i hidden layers with l neurons per hidden layer, and an output layer.
At each neuron, the input data is multiplied by connection weights, and the resulting values are summed to compute an activation value. This value is then passed through a non-linear activation function of ReLU (Rectified Linear Unit). Specifically, for the ith layer, lth neuron, its activation value is computed by summing up the combined activation values (
where
Given the gold assay data and ore-controlling information yielded by spatial analysis (e.g., fault dip, dip variation) and ore-forming simulation (e.g., volumetric strain, shear strain), we conducted the 3D prospectivity modeling using RF and MLP, respectively. The 80% of known voxels (38,288), containing ore and non-ore, were selected as inputs for model training, and the other 20% of data were as validation dataset to evaluate the modeling validity and robustness. Here three strategies of prospectivity modeling were used, all variables, only morphology variables, and only simulation variables to test the influence of predictive variables on prediction results. The selection of hyperparameters for the model was aided by the NNI (Neural Network Intelligence), an open-source AutoML (Automated Machine Learning) toolkit developed by Microsoft Research.
The integrated 3D model of the Jiaojia Fault and voxels reveals that gold mineralization within the Jiaojia gold belt extends from the southeast to the northwest across segments such as Qujia, Xincheng, Jiaojia, Shaling, and Sizhuang. The distribution is predominantly in elongated lenticular shapes with a southwest plunging. At the scale of the Jiaojia gold belt, gold is unevenly distributed (Figure 4), with a significant presence in the footwall of the Jiaojia fault, which extends 3,000 m from the surface to the orientation (Figure 8). Notably, high-grade gold mineralization (represented by voxels with grades >4 g/t) is unevenly distributed across the segments, with a higher concentration in the shallow Qujia, Jiaojia, and Shaling segments. Comparatively, the Jiaojia and Shaling segments exhibit more heterogeneity, displaying lower average gold grades but hosting larger areas (Figure 4A).
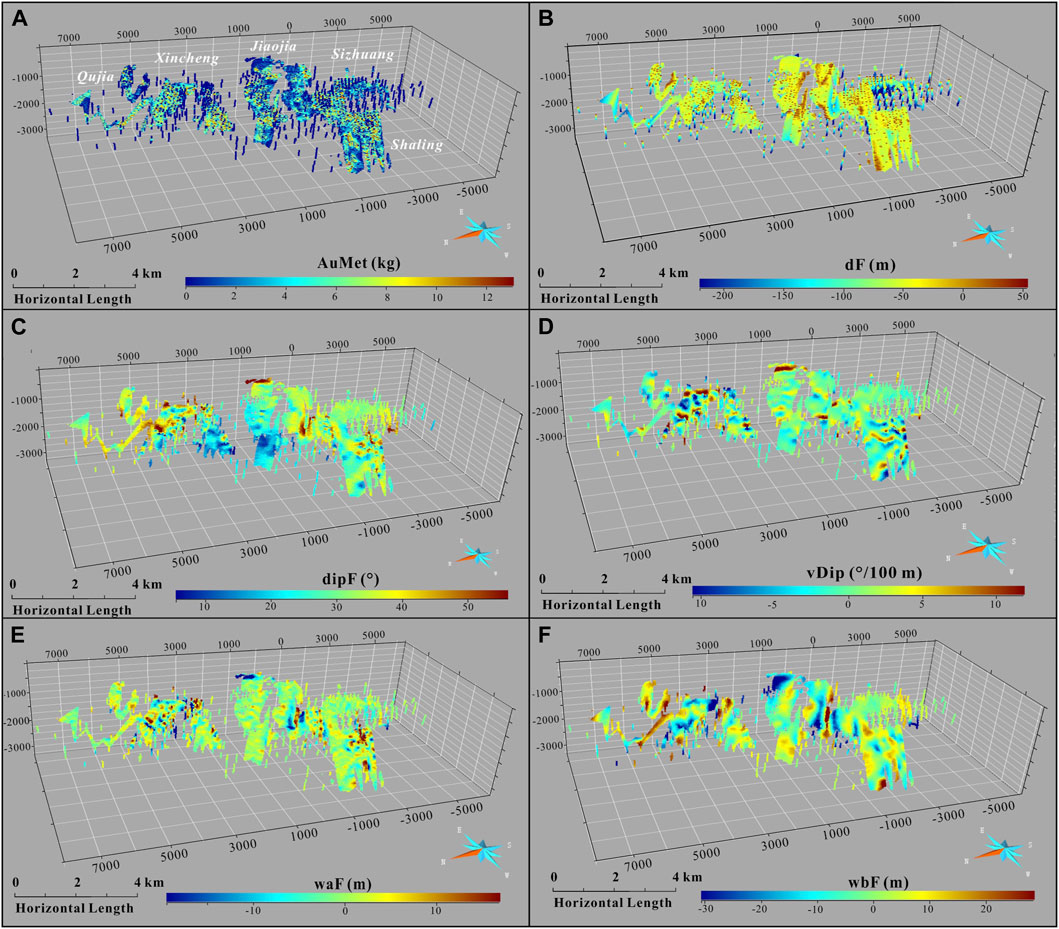
FIGURE 8. 3D models depicting known gold amounts distribution (A) at Jiaojia and the effects of the Jiaojia faults geometric attributes (B–E). (B) distance (dF) where negative values are in the footwall; (C) fault dip (dipF); (D) fault dip variations (vDip); (E), F) fault undulations (waF and wbF).
The structure geometric features have a controlling effect on the mineralization position of orogenic gold deposits (Groves et al., 2018; Cowan, 2020). The Jiaojia fault exhibits localized variations in orientation and dip (Figures 8B–E). Particularly in Qujia, Xincheng, and the shallow part of Jiaojia segments, the morphology of the Jiaojia fault displays a remarkable variation near the boundaries of the mineralized areas (Figure 4B). Intriguingly, gold amounts (AuMet) within the mineralized region do not exhibit a straightforward positive or negative correlation with local dip variations of the Jiaojia fault. Instead, the relationship is more complex and nonlinear (Figures 9B,C). Moreover, the fluctuations in fault dip variations (vDip) are associated with changes in elevation (Figure 8D), implying fault undulation controls on mineralization. This is also manifested by the notable enrichment of gold at the transition from gentle to steep, which is consistent with the fact that most of the voxels are distributed in the range where vDip is slightly greater than 0 (Figure 9C).
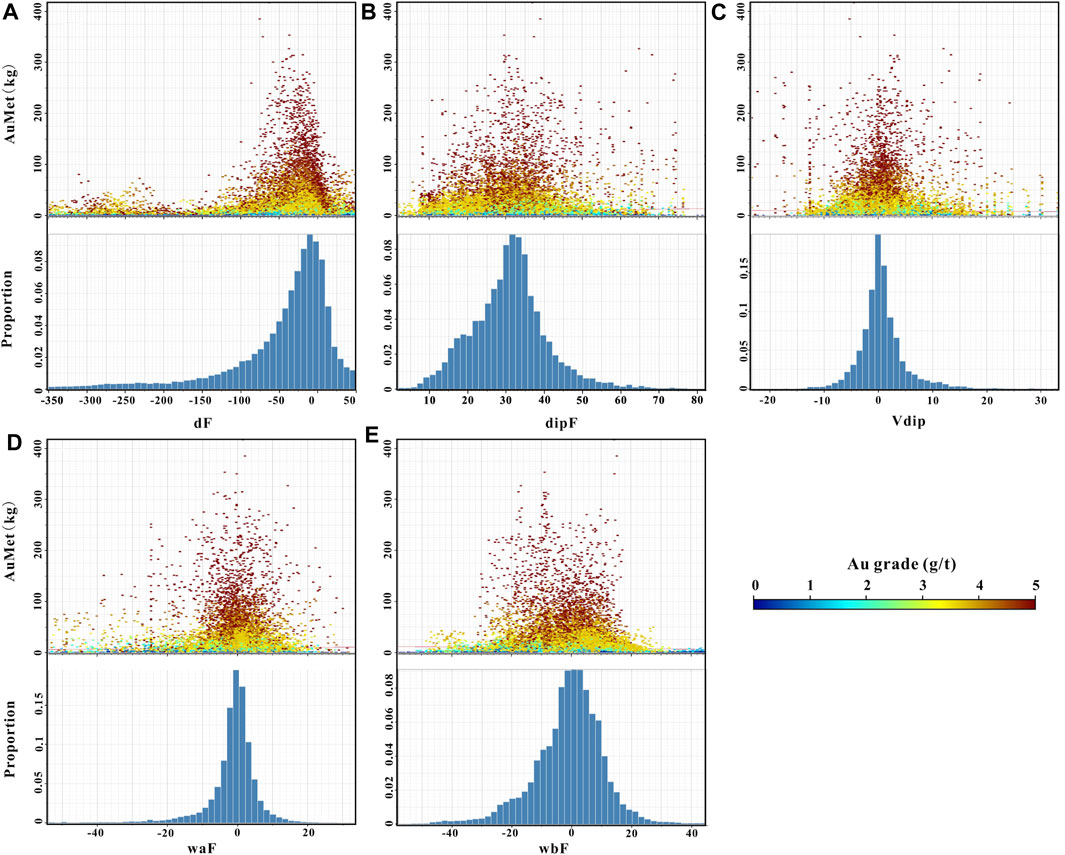
FIGURE 9. Binary-plots (top) and distribution statistics (bottom) of the geometric features of the Jiaojia fault and gold amounts (AuMet). (A) dF vs. AuMet; (B) dipF vs. Au; (C) vDip; (D) waF vs. AuMet; (E) wbF vs. AuMet. The color bar corresponds to gold grade.
In addition, our data show that gold mineralization controlled by the Jiaojia fault is dominantly distributed over a distance range of −330 m–50 m from the fault surface, of which gold mineralization occurs within two distance ranges of −75 ∼ 0 m and −300 ∼ −200 m (Figure 9A). The former is closely associated with intense deformation and alteration near the fault, such as the Jiaojia No. 1 orebody and Sizhuang No. 1 orebody (Mills et al., 2015; Wang et al., 2019). The latter is less commonly distributed, and associated with distal brittle fracture filled with sulfide veins, e.g., Sizhuang No. 3 orebody (Wang et al., 2019). This distal mineralization occurs in Jiaojia, Sizhuang, and deep Shaling segments (Figure 8B). The gold mineralization within the Jiaojia gold belt is particularly concentrated within the dip range of the Jiaojia fault of 20°–40° (Figure 9B), and the dip variation is relatively minor (less than ±10°, Figure 9C), which are features suggesting the gently sloping of the Jiaojia fault. Notably, the gold mineralization exhibits spatial overlap with the undulating parts of the Jiaojia fault (Figures 8E,F), and the voxels are more often distributed in concave-down parts (waF, wbF <0 m; Figures 9D, E). In particular, these fault segments also align spatially with high-grade voxels (Figure 8A). The Jiaojia fault was exposed to NEE-SWW compressed stress during gold mineralization period. The apparent undulations may imply localized stress inhomogeneities during the structural activities, which contributed to the enhancement in permeability or fluid fluxes in local host rocks, thereby facilitating gold precipitation (Henry et al., 2014; Wilson et al., 2016).
The ore-forming simulation results encompass a series of rock and fluid conditions, such as volumetric strain, shear strain, temperature, and fluid flux or divergence (Zhao et al., 2009; 2012; Itasca, 2012), all of which contribute to fluid flow and interaction with rocks and gold precipita-tion. Here we present the primary mineralization-related attributes generated by computational simulation (Figure 10) that are also always used in previous studies on hydrothermal mineral systems (Jessell et al., 2005; Zhang et al., 2008; Zhao, 2015; Li et al., 2018b; Hu et al., 2019; Eldursi et al., 2021; Xie et al., 2022), particularly for volumetric strain, which directly reflects the dilatation or shrinkage of wall rocks, influencing mineralization localization.
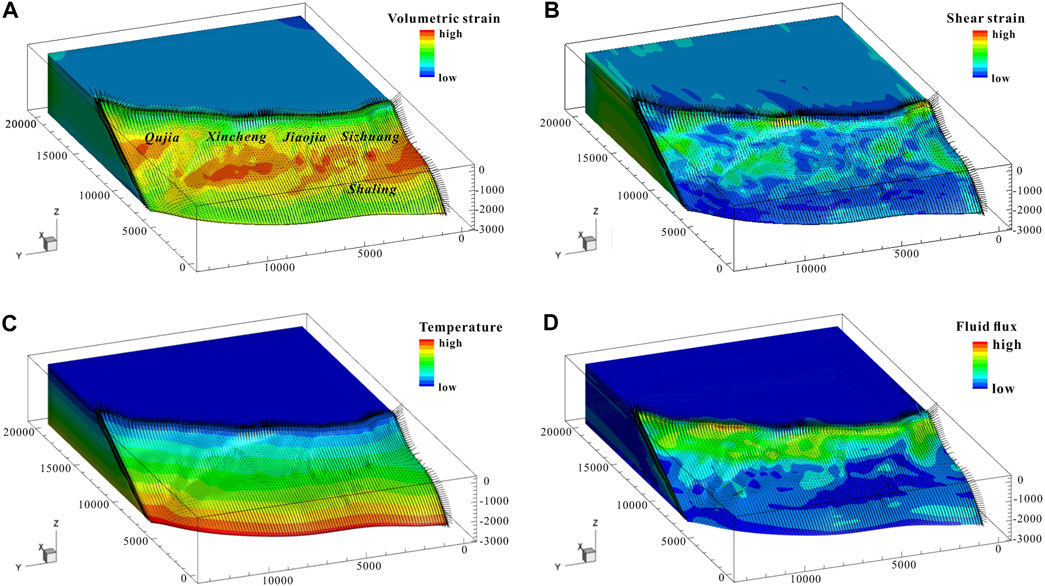
FIGURE 10. Numerical modeling results of volumetric strain (A), shear strain (B), fluid flux (C), and temperature (D). The fluid flow vectors are at a strain rate of 10–an s–s.
Generally, the rock mechanical strain and related fluid flux exhibit noticeable spatial variability (Figures 10A, B, D) whereas the temperature is relatively weakly variable and shows a gradually increased characteristic (Figure 10D). Substantial dilation (positive volumetric strain) and extensive shear are commonly observed in the gentle areas (Figure 10A). This implies that the localization of volume strain and shear strain that further causes rock fracture and deformation is closely attributed to the fault geometry (Wilson et al., 2016). The hydrothermal fluid flows upward along with the Jiaojia fault (Figure 10), supporting a source of gold and fluid derived from deep (Deng et al., 2020a; Liu et al., 2021b).
To better depict these conditions on mineralization voxels, we matched the simulation model of FLAC3D with our 3D orebody voxel model of GoCAD (Figures 11, 12) using a self-developed algorithm, thus adding new attitudes on these voxels. The models show most ore-bearing voxels have a moderate positive volumetric strain range of 0.002%–0.01% (Figure 10A; Figure 11A), consistent with the hypothesis of dilation areas promoting fluid pooling in structural-hydrothermal systems. Notably, the most significant volumetric strain is observed in the Qujia and Xincheng segments, forming a SW-plunging zone (Figure 10A). This is also reflected in the shear strain distribution (Figure 11B) and resembles the dip distribution (Figure 8C). During the ore-forming period, the Jiaojia fault underwent a dextral strike-slip normal deformation at the Linglong metamorphic core complex arching setting (Deng et al., 2015; Deng et al., 2019; Wu et al., 2020). Such a syn-ore structural process improved the rock permeability facilitating fluid flow and infiltration and water-rock interaction (Cox, 2005), especially in the strong shear parts where are gentle and created a fluid channel for flow. This might explain the prevalent oblique ore-shooting plunging in the Jiaojia gold belt (Wang et al., 2019).
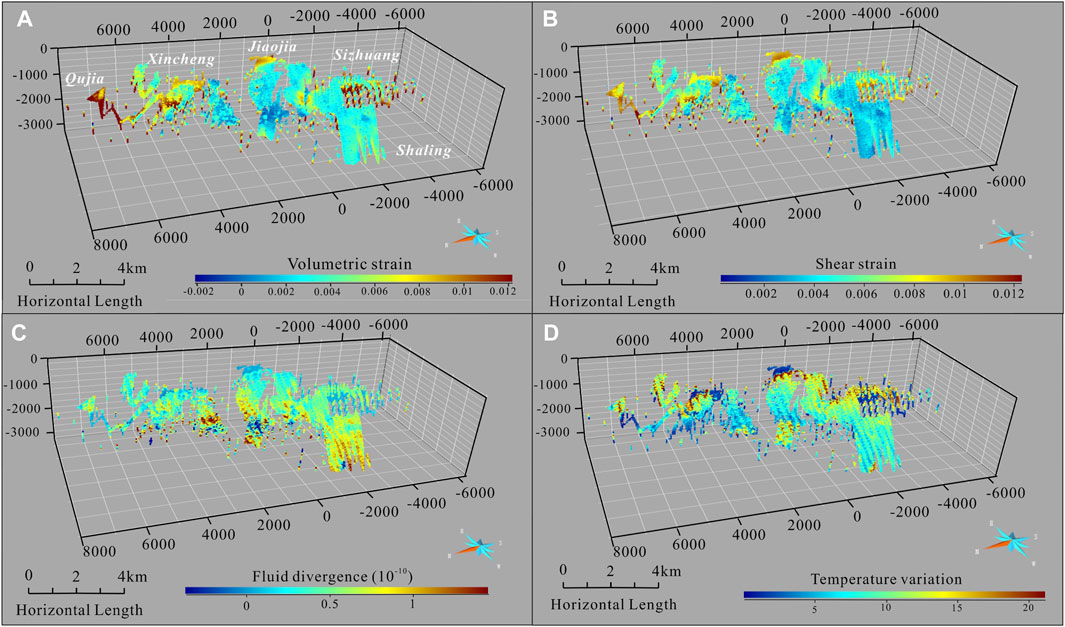
FIGURE 11. 3D voxel models displaying the ore-forming simulation-related attributes of known ore bearing voxels in the Jiaojia gold belt. (A) Volumetric strain; (B) Shear strain; (C) Fluid divergence; (D) absolute values of temperate variations. Note volumetric strain and shear strain are generated by FLAC3D, and fluid divergence and temperature variation are calculated using the Sobel operator. The temperature variations are absolute values. The negative fluid divergence denotes fluid ingress into a voxel, while positive indicates egress.
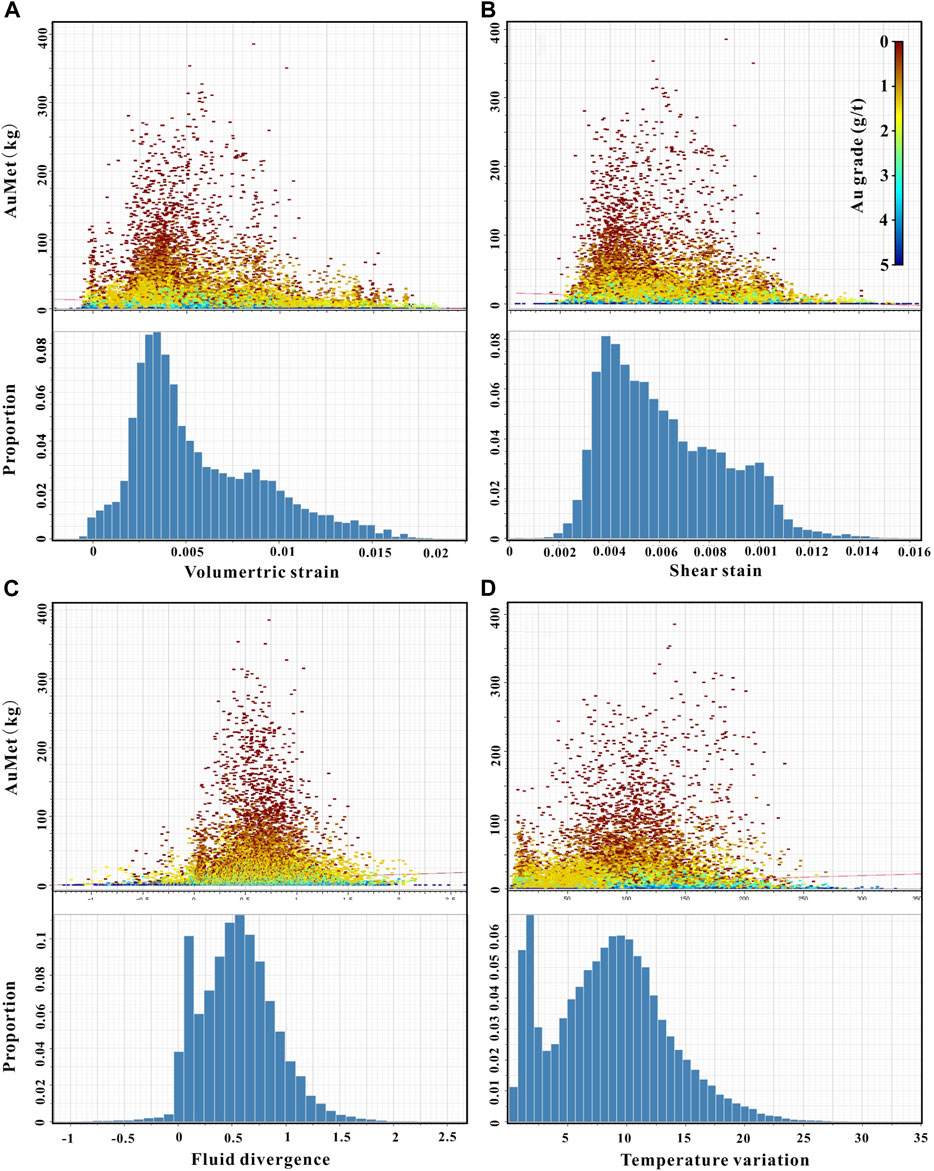
FIGURE 12. Binary-plots (top) and distribution statistics (down) of ore-forming simulation-related attributes of the Jiaojia fault and gold amounts (AuMet). (A) Volumetric strain vs. AuMet; (B) Shear strain vs. Au; (C) Fluid divergence vs. AuMet; (D) Absolute values of temperate variations vs. AuMet. The color bar corresponds to gold grade.
In contrast to the strain conditions, the fluid and temperature conditions influencing gold miner-alization display a different pattern. Almost all ore-bearing voxels showing a positive fluid divergence (Figure 11C; Figure 12C), indicating a prevailing trend of fluid egress for these voxels. Furthermore, it is noteworthy that the deep units relatively distal to the fault have a higher fluid divergence value (Figure 11C), which is probably due to the trending of fluid ingress from surrounding rock. Since the fluid ingress or egress does not directly equate to gold mineralization in an open mineral system, other factors (e.g., pressure fluctuation, lithochemistry) may also play pivotal roles in gold localization. Nonetheless, the majority of the gold at Jiaojia is concentrated within a relatively narrow range of fluid divergence (Figure 12C), suggesting a correlation between them. The distribution of temperature variations is similar to fluid divergence. More than 5°C temperature variations may be conducive to gold mineralization but overall gold, especially high-grade voxels, is scattered and linked to temperature variation (Figure 11C; Figure 12D). This implies that gold precipitation from ore-forming fluid is likely not directly relevant to temperature conditions, which is supported by the relatively small difference temperature in vertically, even several kilometers (Hu et al., 2013; Wen et al., 2016). Notably, these simulation indices at shallow Xincheng and Jiaojia segments show a consistent change (Figure 11), where geometric features (e.g., dip, undulation) are distinctive compared to the surrounding. These results underscore that the fault geometry, rock deformation, fluid flow and geodynamic conditions are intrinsic, synchronous and coupling, which are thus jointly controlling gold distribution.
In summary, gold mineralization at Jiaojia appears to be controlled by the fault geometry and fault-related fluid geodynamic in terms of fluid flow and gold precipitation from fluid. Irrespective of what the process driving gold formation and heterogeneous distribution, the fault morphology and fluid geodynamic indices are reasonably utilized as predictor variables for deep gold exploration.
The prospectivity model performed in this study was evaluated by the receiver operating characteristic (ROC) curves (Fawcett, 2006). The ROC curve, a biplot graphical representation, can test the validity of a binary classification model, which plots the false positive rate (x-axis) vs. the true positive rate (y-axis). In this study, we used the prediction results (true positives, false positives, true negatives, and false negatives) for known verification voxels that include both ore and non-ore units to draw the curve. Figure 13 shows the prospectivity difference between RF and MLP models in the statistical view of ROC curve yielded by our prospectivity modeling. Overall, the MLP model has larger AUC values than RF during three experiments (Figure 13), indicating a superior predictive accuracy. Compared with models using only morphology variables as input, both prospectivity models using only simulation variables yield the smallest AUC values (RF 0.673 and MLP 0.710). This means the ore-forming simulation may lack the critical ore proxy information and is not suitable for direct gold prediction at Jiaojia. Notably, the AUC values of RF models exhibit incremental growth with the addition of individual prediction variable sets (0.673, 0.783, and 0.832). In contrast, the MLP model using all variables demonstrates only minor variation compared to using solely morphology variables (0.831 and 0.824). This implies that RF might incorporate more gold-related information from the ore-forming simulation data into prospectivity models.
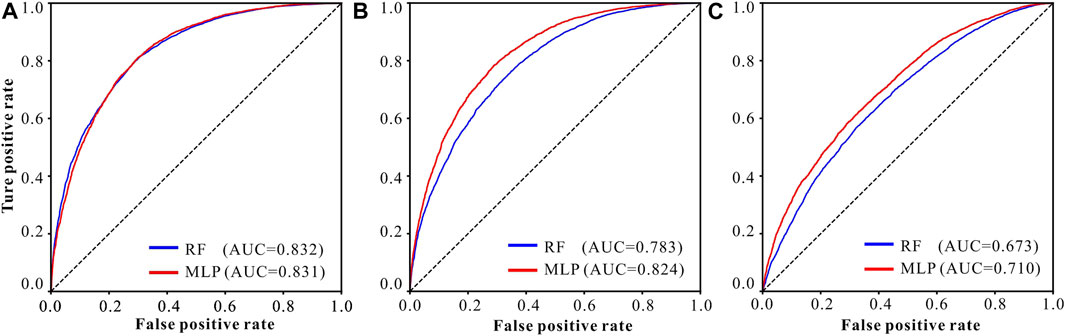
FIGURE 13. Performance comparisons of RF and MLP prospectivity models using different predictive variables through ROC curves. (A) all variables; (B) fault morphology variables; (C) ore-forming simulation variables. Note the AUC (area under the ROC curve) is a commonly used metric to directly evaluate model performance. The AUC value of ideal model performance is close to 1, while an AUC value equal to 0.5 is the equivalent of a random guess.
We also present the prospectivity results of RF and MLP as well as know voxels in a 3D view to assess their difference that statistical techniques may not capture (Figure 14). The results show there are remarkable differences of high-probability in the Jiaojia district. For all variables used for modeling, the MLP model yields many spatially continuous high-potential areas, while the RF model designates the deep areas of Qujia, Jiaojia and Shaling are the best areas for exploration (Figure 14A, B). Obviously, the results of MLP is not well consistent with known ore pattern. The RF and MLP models using only fault morphology variables are generally similar, except for the minor difference in the deep of Jiaojia (Figures 14C, D). When exclusively using ore-forming numerical simulation data, the MLP model shows a weak ability to identify potential mineralization, as indicated by its extensive and dispersed prediction regions that are incongruent with gold mineralization at Jiaojia. In contrast, the RF model identifies the Qujia and Xincheng areas are potential (Figures 14E, F). As displayed in the previous ore-forming simulation work (Huang et al., 2020), the gold targets determined by only simulation data are generally large and continuous in space. This is most likely caused by the low resolution of simplied simulation model and ore-forming processes at the current simulation level. Thus, the ore-forming simulation data can provide clues about gold exploration but is hard to localize the potential mineralization in space and give its possibility.
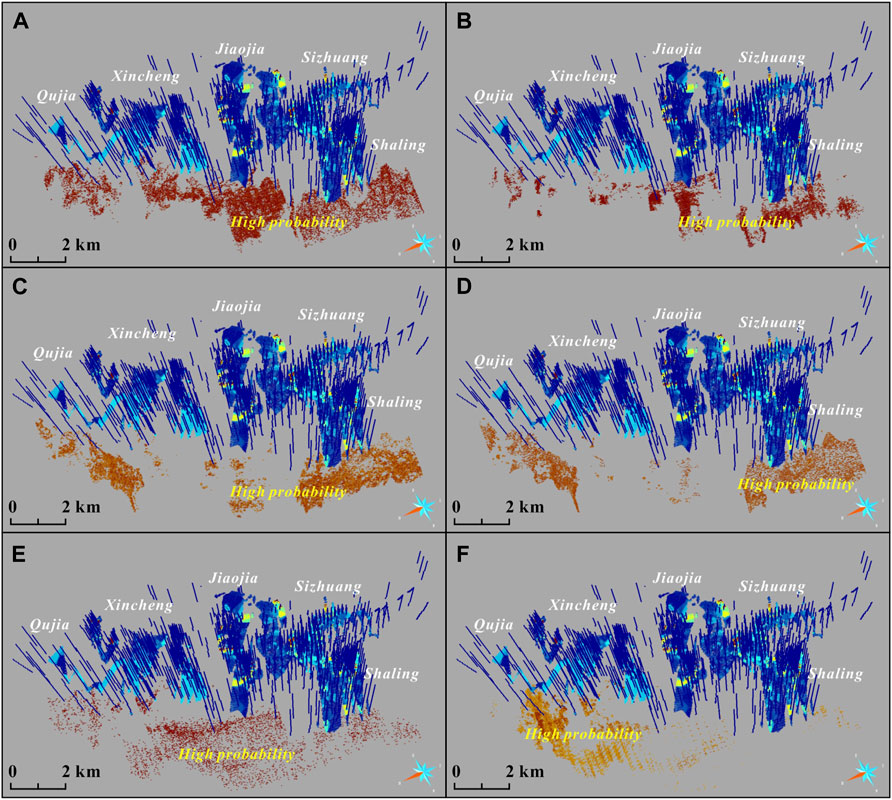
FIGURE 14. Prediction results yielded by MLP (A, C, E) and RF (B, D, F) prospectivity models using different predictive variables by ROC curves. (A–B) all variables; (C–D) fault morphology variables; (E–F) ore-forming simulation variables.
Overall, when using different prediction variables, whether RF and MLP prospectivity models yield similar prediction ability but distinct results. From the above results, the fault morphology features are undoubled critical ore-controlling factors, since both the machine learning models can gen-erate high AUC values (Figure 13) and prospectivity results similar to final results (Figure 14). Although the influence of ore-forming simulation attributes is weakly reflected by ROC curves, the prediction results are greatly improved when integrated it into models. It is especially illustrated in the areas in proximity to known gold mineralization which are spatially continuous and keep ore-shooting direction (Figure 14). As discussed above, the ore-forming simulation results well reflect the hydrothermal fluid flow pattern and geodynamic conditions for gold precipitation, which is in turn reflected by known mineralization patterns, such as ore-shooting or interval distribution. Thus, adding the simulation attributes helps the model refine the results to make it more fit for the known ore pattern. But it also may introduce bias and uncertainties into models. Facing this, the RF model exhibits its advantages over the MLP model (Figure 14) and presents reliable prediction results as stated above. Therefore, the proposed 3D prospectivity modeling method using machine learning of geometric and geodynamic variables is robust and reliable for deep gold exploration, but the choice of machine learning methods needs more comparison in different aspects.
Based on our RF and MLP prospectivity modeling results, we have identified five gold potential areas at the depth of Jiaojia (Figure 15). During this process, we followed the empirical rules of target determination at Jiaodong (Liu et al., 2021a) with a preference for endorsing the overprinting areas. Areas ① and ② are located in the deep and SW deep of known orebodies at the Shaling segments, at elevations ranging from −2000 to −2,500 m. Local areas have been detected by a drillhole of 352zk03 that reveals new orebodies with thicknesses exceeding 23 m and an average grade of 4.83 g/t (Figure 15). Areas ③ are spatially continuous to gold orebodies in the Jiaojia and Xincheng segments, comprising a consistent ore-shooting feature, likely indicating a deep ore-forming fluid source direction. Areas ④ is also sited in the depth of the Xincheng segment and it, combined with known mineralization, presents a parallel ore distribution pattern to areas ③. This possibly indicates two parallel gold enrichment zones at Xincheng. Areas ⑤ is located in the NW and SW stretching farther along the small gold orebodies, where also occurs the large volumetric strain that is favorable for fluid pooling.
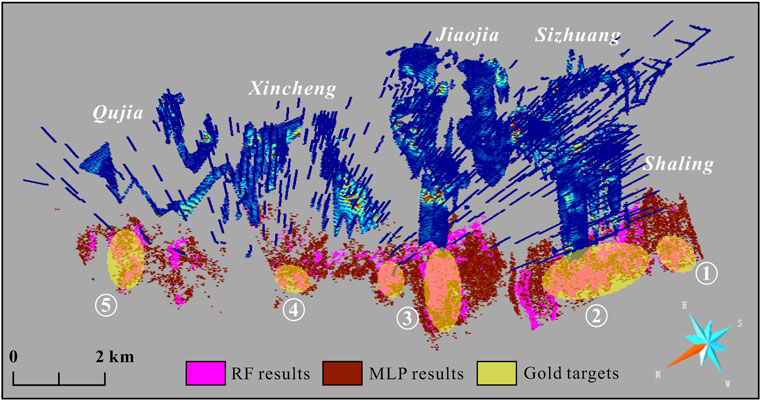
FIGURE 15. Potential gold mineralization areas identified within the Jiaojia district through this study.
(1) A 3D prospectivity modeling approach using machine learning of geometric and geodynamic variables was implemented in the Jiaojia gold belt to evaluate the gold potential at depth. Although the ore-forming simulation may introduce bias and uncertainties into the prospectivity model, the random forest avoids the possible issue and finds the important fluid flow information relative to the multilayer perceptron model. The approach, which encompasses spatial mineralization localization and fluid flow processes, allows for obtaining and incorporating the critical ore-controlling information into prospectivity modeling and then outperforms traditional prospectivity methods.
(2) The significant influence of geometric features of the Jiaojia fault on the spatial distribution of gold mineralization is revealed, including 1) morphological variations of the Jiaojia fault at the margin of the mineralization area; 2) the bimodal distribution of gold with distance from the Jiaojia fault; and 3) the spatial alignment of undulations (especially large scale down-concave) to high-grade gold mineralization.
(3) The numerical modeling results demonstrate that the strain accumulation areas provide the potential to localize late ore fluid flow, but gold local precipitation from fluid may be not solely related to fluid flow process and is probably influenced by other factors. Moreover, the fault morphology appears to least partly dictate the fluid flow pattern in the Jiaojia gold system.
(4) Five gold targets in the Jiaojia gold belt have been identified via our 3D prospectivity models. They are located in the deep of Qujia, Jiaojia and Shaling segments and most of them are generally distributed along shallow known orebodies, likely reflecting deep ore fluid pathways. These areas would benefit the deep gold exploration in the Jiaojia district.
The data analyzed in this study is subject to the following licenses/restrictions: The data analyzed in this study is subject to the following licenses/restrictions: the raw data in our study was obtained from a publicly listed mining company and is subject to a data confidentiality agreement between us and the company. As such, we are unable to provide the raw data for publication. Requests to access these datasets should be directed to Requests to access these datasets should be directed to ZL, emtsaXUwMzIyQGNzdS5lZHUuY24=.
GuC: Writing–original draft. ZL: Writing–original draft. GC: Methodology, Writing–review and editing. SX: Software, Writing–review and editing. XY: Data curation, Investigation, Writing–review and editing. XL: Data curation, Investigation, Writing–review and editing. YC: Methodology, Software, Writing–review and editing. ZH: Methodology, Software, Writing–review and editing. HZ: Methodology, Writing–review and editing. LJ: Methodology, Writing–review and editing.
The author(s) declare financial support was received for the research, authorship, and/or publication of this article. This study was supported by projects of Natural Science Foundation of Hunan Province (No. 2023JJ40715), project (No. KFKT202116) of the Key Laboratory of Gold Mineralization Processes and Resource Utilization, and Shandong Provincial Key Laboratory of Metallogenic Geological Process and Resource Utilization, MNR, and Educational Commission of Hunan Province of China (No. 22A0192).
We thank two reviewers for the constructive comments on our manuscript. Zhenyu Guo and Shuyan Yu are thanked for their assistance for figure presentation and manuscript polish.
Authors XY and XL were employed by Zhaojin Mining Industry Co., Ltd.
The remaining authors declare that the research was conducted in the absence of any commercial or financial relationships that could be construed as a potential conflict of interest.
All claims expressed in this article are solely those of the authors and do not necessarily represent those of their affiliated organizations, or those of the publisher, the editors and the reviewers. Any product that may be evaluated in this article, or claim that may be made by its manufacturer, is not guaranteed or endorsed by the publisher.
Carranza, E. J. M. (2009). Controls on mineral deposit occurrence inferred from analysis of their spatial pattern and spatial association with geological features. Ore Geol. Rev. 35 (3-4), 383–400. doi:10.1016/j.oregeorev.2009.01.001
Chen, J., Jiang, L., Peng, C., Liu, Z., Deng, H., Xiao, K., et al. (2023). Quantitative resource assessment of hydrothermal gold deposits based on 3D geological modeling and improved volume method: application in the Jiaodong gold Province, Eastern China. Ore Geol. Rev. 153, 105282. doi:10.1016/j.oregeorev.2022.105282
Chen, M., and Xiao, F. (2023). Projection pursuit random forest for mineral prospectivity mapping. Math. Geosci. 55, 963–987. doi:10.1007/s11004-023-10070-0
Chen, W., and Xiao, F. (2022). Advances in numerical modeling of metallogenic geodynamics: a review of theories, methods and technologies. Bull. Geol. Sci. Technol. 41 (4), 1–16. (in Chinese with English abstract). doi:10.19509/j.cnki.dzkq.2022.0125
Cowan, E. J. (2020). Deposit-scale structural architecture of the Sigma-Lamaque gold deposit, Canada—insights from a newly proposed 3D method for assessing structural controls from drill hole data. Miner. Deposita 55 (2), 217–240. doi:10.1007/s00126-019-00949-6
Cox, S. F. (2005). Coupling between deformation, fluid pressures, and fluid flow in ore-producing hydrothermal systems at depth in the crust. Econ. Geol. 100, 39–75. doi:10.5382/av100.04
Deng, H., Huang, X., Mao, X., Yu, S., Chen, J., Liu, Z., et al. (2021). Generalized mathematical morphological method for 3D shape analysis of geological boundaries: application in identifying mineralization-associated shape features. Nat. Resour. Res. 31, 2103–2127. doi:10.1007/s11053-021-09975-6
Deng, J., Liu, X., Wang, Q., Dilek, Y., and Liang, Y. (2017). Isotopic characterization and petrogenetic modeling of Early Cretaceous mafic diking—lithospheric extension in the North China craton, eastern Asia. Geol. Soc. Am. Bull. 129 (11-12), 1379–1407. doi:10.1130/b31609.1
Deng, J., Wang, C., Bagas, L., Carranza, E. J. M., and Lu, Y. (2015). Cretaceous–Cenozoic tectonic history of the Jiaojia Fault and gold mineralization in the Jiaodong Peninsula, China: constraints from zircon U–Pb, illite K–Ar, and apatite fission track thermochronometry. Miner. Deposita 50 (8), 987–1006. doi:10.1007/s00126-015-0584-1
Deng, J., Wang, Q., Santosh, M., Liu, X., Liang, Y., Yang, L., et al. (2020a). Remobilization of metasomatized mantle lithosphere: a new model for the Jiaodong gold province, eastern China. Miner. Deposita 55, 257–274. doi:10.1007/s00126-019-00925-0
Deng, J., Yang, L. Q., Groves, D. I., Zhang, L., Qiu, K. F., and Wang, Q. F. (2020b). An integrated mineral system model for the gold deposits of the giant Jiaodong province, eastern China. Earth-Science Rev. 208, 103274. doi:10.1016/j.earscirev.2020.103274
Deng, J., Yang, L. Q., Li, R. H., Groves, D. I., Santosh, M., Wang, Z. L., et al. (2019). Regional structural control on the distribution of world-class gold deposits: an overview from the Giant Jiaodong Gold Province, China. Geol. J. 54 (1), 378–391. doi:10.1002/gj.3186
Eldursi, K., Chi, G., Bethune, K., Li, Z., Ledru, P., and Quirt, D. (2021). New insights from 2-and 3-D numerical modelling on fluid flow mechanisms and geological factors responsible for the formation of the world-class Cigar Lake uranium deposit, eastern Athabasca Basin, Canada. Miner. Deposita 56, 1365–1388. doi:10.1007/s00126-020-00979-5
Fan, H. R., Zhai, M. G., Xie, Y. H., and Yang, J. H. (2003). Ore-forming fluids associated with granite-hosted gold mineralization at the Sanshandao deposit, Jiaodong gold province, China. Miner. Deposita 38 (6), 739–750. doi:10.1007/s00126-003-0368-x
Fawcett, T. (2006). An introduction to ROC analysis. Pattern Recognit. Lett. 27 (8), 861–874. doi:10.1016/j.patrec.2005.10.010
Fournier, R. O. (1999). Hydrothermal processes related to movement of fluid from plastic into brittle rock in the magmatic-epithermal environment. Econ. Geol. 94 (8), 1193–1211. doi:10.2113/gsecongeo.94.8.1193
Gessner, K. (2009). Coupled models of brittle-plastic deformation and fluid flow: approaches, methods, and application to Mesoproterozoic mineralisation at Mount Isa, Australia. Surv. Geophys. 30, 211–232. doi:10.1007/s10712-009-9062-6
Goldfarb, R. J., and Santosh, M. (2014). The dilemma of the Jiaodong gold deposits: are they unique? Geosci. Front. 5 (2), 139–153. doi:10.1016/j.gsf.2013.11.001
Goss, S. C., Wilde, S. A., Wu, F., and Yang, J. (2010). The age, isotopic signature and significance of the youngest mesozoic granitoids in the Jiaodong terrane, Shandong province, North China craton. Lithos 120 (3-4), 309–326. doi:10.1016/j.Lithos.2010.08.019
Groves, D. I., Santosh, M., Goldfarb, R. J., and Zhang, L. (2018). Structural geometry of orogenic gold deposits: implications for exploration of world-class and giant deposits. Geosci. Front. 9 (4), 1163–1177. doi:10.1016/j.gsf.2018.01.006
Guo, L. N., Goldfarb, R. J., Wang, Z. L., Li, R. H., Chen, B. H., and Li, J. L. (2017). A comparison of Jiaojia- and Linglong-type gold deposit ore-forming fluids: do they differ? Ore Geol. Rev. 88, 511–533. doi:10.1016/j.oregeorev.2016.12.003
Haddad-Martim, P. M., Souza Filho, C. R. d., and Carranza, E. J. M. (2017). Spatial analysis of mineral deposit distribution: a review of methods and implications for structural controls on iron oxide-copper-gold mineralization in Carajás, Brazil. Ore Geol. Rev. 81, 230–244. doi:10.1016/j.oregeorev.2016.09.038
Henry, A. D., McInnes, P., and Tosdal, R. M. (2014). Structural evolution of auriferous veins at the Endeavour 42 gold deposit, Cowal mining district, NSW, Australia. Econ. Geol. 109 (4), 1051–1077. doi:10.2113/econgeo.109.4.1051
Hu, F. F., Fan, H. R., Jiang, X. H., Li, X. C., Yang, K. F., and Mernagh, T. (2013). Fluid inclusions at different depths in the Sanshandao gold deposit, Jiaodong Peninsula, China. Geofluids 13 (4), 528–541. doi:10.1111/gfl.12065
Hu, X., Li, X., Yuan, F., Ord, A., Jowitt, S. M., Li, Y., et al. (2019). Numerical simulation based targeting of the magushan skarn Cu–Mo deposit, middle-lower yangtze metallogenic belt, China. Minerals 9 (10), 588. doi:10.3390/min9100588
Huang, J., Deng, H., Mao, X., Chen, G., Yu, S., and Liu, Z. (2023). 3D modeling of detachment faults in the Jiaodong gold province, Eastern China: a Bayesian inference perspective and its exploration implications. Ore Geol. Rev. 154, 105307. doi:10.1016/j.oregeorev.2023.105307
Huang, L., Wang, G., Carranza, E. J. M., Du, J., Li, J., Zhou, Z., et al. (2020). Multi-scale numerical simulation and 3D modeling for deep mineral exploration in the Jiaojia Gold District, China. Nat. Resour. Res. 29 (1), 415–438. doi:10.1007/s11053-019-09608-z
Itasca (2012). FLAC3D 5.0 (fast Lagrangian analysis of continua in 3 dimensions) manual. Minneapolis, Minnesota, USA: Itasca Consulting Group Inc.
Jessell, M. W., Siebert, E., Bons, P. D., Evans, L., and Piazolo, S. (2005). A new type of numerical experiment on the spatial and temporal patterns of localization of deformation in a material with a coupling of grain size and rheology. Earth Planet. Sci. Lett. 239 (3-4), 309–326. doi:10.1016/j.epsl.2005.03.030
Kitt, S., Kisters, A., Vennemann, T., and Steven, N. (2017). Orebody geometry, fluid and metal sources of the omitiomire Cu deposit in the ekuja dome of the damara belt in Namibia. Miner. Deposita 53 (2), 261–276. doi:10.1007/s00126-017-0731-y
Li, L., Santosh, M., and Li, S. R. (2015). The ‘Jiaodong type’ gold deposits: characteristics, origin and prospecting. Ore Geol. Rev. 65, 589–611. doi:10.1016/j.oregeorev.2014.06.021
Li, N., Song, X., Xiao, K., Li, S., Li, C., and Wang, K. (2018a). Part II: a demonstration of integrating multiple-scale 3D modelling into GIS-based prospectivity analysis: a case study of the Huayuan-Malichang district, China. Ore Geol. Rev. 95, 292–305. doi:10.1016/j.oregeorev.2018.02.034
Li, X., Yuan, F., Zhang, M., Jowitt, S. M., Ord, A., Zhou, T., et al. (2019). 3D computational simulation-based mineral prospectivity modeling for exploration for concealed Fe–Cu skarn-type mineralization within the Yueshan orefield, Anqing district, Anhui Province, China. Ore Geol. Rev. 105, 1–17. doi:10.1016/j.oregeorev.2018.12.003
Li, X. C., Fan, H. R., Santosh, M., Hu, F. F., Yang, K. F., Lan, T. G., et al. (2012). An evolving magma chamber within extending Lithosphere: an integrated geochemical, isotopic and zircon U–Pb geochronological study of the Gushan granite, eastern North China Craton. J. Asian Earth Sci. 50, 27–43. doi:10.1016/j.jseaes.2012.01.016
Li, Z., Chi, G., Bethune, K. M., David, T., and Gerard, Z. (2017). Structural controls on fluid flow during compressional reactivation of basement faults: insights from numerical modeling for the formation of unconformity-related uranium deposits in the Athabasca Basin, Canada. Econ. Geol. 112 (2), 451–466. doi:10.2113/econgeo.112.2.451
Li, Z., Chi, G., Bethune, K. M., Eldursi, K., Quirt, D., Ledru, P., et al. (2018b). Numerical simulation of strain localization and its relationship to formation of the Sue unconformity-related uranium deposits, eastern Athabasca Basin, Canada. Ore Geol. Rev. 101, 17–31. doi:10.1016/j.oregeorev.2018.07.004
Li, Z., Chi, G., Bethune, K. M., Eldursi, K., Thomas, D., Quirt, D., et al. (2018c). Synchronous egress and ingress fluid flow related to compressional reactivation of basement faults: the Phoenix and Gryphon uranium deposits, southeastern Athabasca Basin, Saskatchewan, Canada. Miner. Deposita 53, 277–292. doi:10.1007/s00126-017-0737-5
Liu, L., Li, J., Zhou, R., and Sun, T. (2016). 3D modeling of the porphyry-related Dawangding gold deposit in south China: implications for ore genesis and resources evaluation. J. Geochem. Explor. 164, 164–185. doi:10.1016/j.gexplo.2015.11.002
Liu, Y., Li, Z. X., Laukamp, C., West, G., and Gardoll, S. (2013). Quantified spatial relationships between gold mineralisation and key ore genesis controlling factors, and predictive mineralisation mapping, St Ives Goldfield, Western Australia. Ore Geol. Rev. 54, 157–166. doi:10.1016/j.oregeorev.2013.03.007
Liu, Z., Chen, J., Mao, X., Tang, L., Yu, S., Deng, H., et al. (2021a). Spatial association between orogenic gold mineralization and structures revealed by 3D prospectivity modeling: a case study of the Xiadian gold deposit, Jiaodong Peninsula, China. Nat. Resour. Res. 30, 3987–4007. doi:10.1007/s11053-021-09956-9
Liu, Z., Guo, Z., Wang, J., Wang, R., Shan, W., Zhong, H., et al. (2023). Three-dimensional mineral prospectivity modeling with the integration of ore-forming computational simulation in the xiadian gold deposit, eastern China. Appl. Sci. 13, 10277. doi:10.3390/app131810277
Liu, Z., Hollings, P., Mao, X., Lawley, C. J. M., Yang, B., and Tang, L. (2021b). Metal remobilization from country rocks into the Jiaodong-type orogenic gold systems, Eastern China: new constraints from scheelite and galena isotope results at the Xiadian and Majiayao gold deposits. Ore Geol. Rev. 134, 104126. doi:10.1016/j.oregeorev.2021.104126
Liu, Z., Mao, X., Jedemann, A., Bayless, R. C., Deng, H., Chen, J., et al. (2021c). Evolution of pyrite compositions at the Sizhuang gold deposit, Jiaodong Peninsula, Eastern China: implications for the genesis of Jiaodong-type orogenic gold mineralization. Minerals 11 (4), 344. doi:10.3390/min11040344
Liu, Z., Yu, S., Deng, H., Jiang, G., Wang, R., Yang, X., et al. (2024). 3D mineral prospectivity modeling in the Sanshandao goldfield, China using the convolutional neural network with attention mechanism. Ore Geol. Rev. 164, 105861. doi:10.1016/j.oregeorev.2023.105861
Mao, J., Wang, Y., Li, H., Pirajno, F., Zhang, C., and Wang, R. (2008). The relationship of mantle-derived fluids to gold metallogenesis in the Jiaodong Peninsula: evidence from D–O–C–S isotope systematics. Ore Geol. Rev. 33 (3–4), 361–381. doi:10.1016/j.oregeorev.2007.01.003
Mao, X., Liu, P., Deng, H., Liu, Z., Li, L., Wang, Y., et al. (2023a). A novel approach to three-dimensional inference and modeling of magma conduits with exploration data: a case study from the jinchuan Ni–Cu sulfide deposit, NW China. Nat. Resour. Res. 32 (3), 901–928. doi:10.1007/s11053-023-10183-7
Mao, X., Qu, X., Liu, Z., Huang, J., Hollings, P., Du, P., et al. (2022). Geochemistry and isotopic characteristics of apatite and zircon from late jurassic granites in the Jiaobei terrane, east China: implications for petrogenesis and geodynamic setting. Front. Earth Sci. 10, 850440. doi:10.3389/feart.2022.850440
Mao, X., Ren, J., Liu, Z., Chen, J., Tang, L., Deng, H., et al. (2019). Three-dimensional prospectivity modeling of the Jiaojia-type gold deposit, Jiaodong Peninsula, Eastern China: a case study of the Dayingezhuang deposit. J. Geochem. Explor. 203, 27–44. doi:10.1016/j.gexplo.2019.04.002
Mao, X., Tang, M., Deng, H., Chen, J., Liu, Z., and Wang, J. (2023b). Using association rules analysis to determine favorable mineralization sites in the Jiaojia gold belt, Jiaodong Peninsula, East China. Front. Earth Sci. 11, 1174017. doi:10.3389/feart.2023.1174017
Mao, X., Zhang, W., Liu, Z., Ren, J., Bayless, R. C., and Deng, H. (2020). 3D mineral prospectivity modeling for the low-sulfidation epithermal gold deposit: a case study of the Axi gold deposit, Western Tianshan, NW China. Minerals 10 (3), 233. doi:10.3390/min10030233
Mills, S. E., Tomkins, A. G., Weinberg, R. F., and Fan, H. R. (2015). Anomalously silver-rich vein-hosted mineralisation in disseminated-style gold deposits, Jiaodong gold district, China. Ore Geol. Rev. 68, 127–141. doi:10.1016/j.oregeorev.2014.12.014
Nguemhe Fils, S. C., Mimba, M. E., Nyeck, B., Nforba, M. T., Kankeu, B., Njandjock Nouck, P., et al. (2020). GIS-based spatial analysis of regional-scale structural controls on gold mineralization along the bétaré-oya shear zone, eastern Cameroon. Nat. Resour. Res. 29 (6), 3457–3477. doi:10.1007/s11053-020-09695-3
Nielsen, S. H. H., Cunningham, F., Hay, R., Partington, G., and Stokes, M. (2015). 3D prospectivity modelling of orogenic gold in the Marymia Inlier, Western Australia. Ore Geol. Rev. 71, 578–591. doi:10.1016/j.oregeorev.2015.02.001
Oliver, N. H., McLellan, J. G., Hobbs, B. E., Cleverley, J. S., Ord, A., and Feltrin, L. (2006). 100th anniversary special paper: numerical models of extensional deformation, heat transfer, and fluid flow across basement-cover interfaces during basin-related mineralization. Econ. Geol. 101, 1–31. doi:10.2113/gsecongeo.101.1.1
Oliver, T. A., Malaya, N., Ulerich, R., and Moser, R. D. (2014). Estimating uncertainties in statistics computed from direct numerical simulation. Phys. Fluids 26 (3). doi:10.1063/1.4866813
Perrouty, S., Lindsay, M. D., Jessell, M. W., Aillères, L., Martin, R., and Bourassa, Y. (2014). 3D modeling of the Ashanti Belt, southwest Ghana: evidence for a litho-stratigraphic control on gold occurrences within the Birimian Sefwi Group. Ore Geol. Rev. 63, 252–264. doi:10.1016/j.oregeorev.2014.05.011
Pfiffner, O.-A., and Ramsay, J. (1982). Constraints on geological strain rates: arguments from finite strain states of naturally deformed rocks. J. Geophys. Res. Solid Earth 87 (B1), 311–321. doi:10.1029/jb087ib01p00311
Serra, J., and Vincent, L. (1992). An overview of morphological filtering. Circuits, Syst. Signal Process. 11, 47–108. doi:10.1007/bf01189221
Shan, H., and Zhai, M. (2020). Petrogenesis of archean TTG-series rocks from the Jiaodong complex, eastern China: implications for crustal evolution in the North China craton. J. Asian Earth Sci. 197, 104368. doi:10.1016/j.jseaes.2020.104368
Shan, H., Zhai, M., Oliveira, E. P., Santosh, M., and Wang, F. (2015). Convergent margin magmatism and crustal evolution during Archean-Proterozoic transition in the Jiaobei terrane: zircon U–Pb ages, geochemistry, and Nd isotopes of amphibolites and associated grey gneisses in the Jiaodong complex, North China Craton. Precambrian Res. 264, 98–118. doi:10.1016/j.precamres.2015.04.008
Shan, W., Mao, X., Liu, Z., Deng, H., Tang, L., Wang, D., et al. (2023). Computational simulation of the ore-forming processes associated with the Sanshandao-Haiyu gold belt, Jiaodong Peninsula, eastern China: implications for the duration of ore formation. Front. Earth Sci. 11, 1154945. doi:10.3389/feart.2023.1154945
Song, M., Li, S., Santosh, M., Zhao, S., Yu, S., Yi, P., et al. (2015). Types, characteristics and metallogenesis of gold deposits in the Jiaodong Peninsula, eastern North China craton. Ore Geol. Rev. 65, 612–625. doi:10.1016/j.oregeorev.2014.06.019
Song, M., Song, Y., Ding, Z., Wei, X., Sun, S., Song, G., et al. (2019). The discovery of the Jiaojia and the Sanshandao giant gold deposits in Jiaodong Peninsula and discussion on the relevant issues. Geotect. Metallogenia 43 (1), 92–110. doi:10.16539/j.ddgzyckx.2019.01.008
Song, M., Wang, B., Song, Y., Li, J., Zheng, J., Li, S., et al. (2023). Spatial coupling relationship between faults and gold deposits in the Jiaodong ore concentration area and the effect of thermal doming-extension on mineralisation. Ore Geol. Rev. 153, 105277. doi:10.1016/j.oregeorev.2022.105277
Stoch, B., Anthonissen, C. J., McCall, M. J., Basson, I. J., Deacon, J., Cloete, E., et al. (2017). 3D implicit modeling of the Sishen Mine: new resolution of the geometry and origin of Fe mineralization. Miner. Deposita 53 (6), 835–853. doi:10.1007/s00126-017-0784-y
Tang, J., Zheng, Y.-F., Wu, Y.-B., Gong, B., and Liu, X. (2007). Geochronology and geochemistry of metamorphic rocks in the Jiaobei terrane: constraints on its tectonic affinity in the Sulu orogen. Precambrian Res. 152 (1-2), 48–82. doi:10.1016/j.precamres.2006.09.001
Unger, G., Zimmermann, R., and Gloaguen, R. (2018). 3D modeling of the epembe (Namibia) Nb-Ta-P-(LREE) carbonatite deposit: new insights into geometry related to rare metal enrichment. Minerals 8 (12), 600. doi:10.3390/min8120600
Wang, G., Li, R., Carranza, E. J. M., Zhang, S., Yan, C., Zhu, Y., et al. (2015a). 3D geological modeling for prediction of subsurface Mo targets in the Luanchuan district, China. Ore Geol. Rev. 71, 592–610. doi:10.1016/j.oregeorev.2015.03.002
Wang, J., Mao, X., Peng, C., Chen, J., Deng, H., Liu, Z., et al. (2023). Three-dimensional refined modelling of deep structures by using the level set method: application to the Zhaoping detachment fault, Jiaodong Peninsula, China. Math. Geosci. 55 (2), 229–262. doi:10.1007/s11004-022-10031-z
Wang, S. R., Yang, L. Q., Wang, J. G., Wang, E. J., and Xu, Y. L. (2019). Geostatistical determination of ore shoot plunge and structural control of the Sizhuang world-class epizonal orogenic gold deposit, Jiaodong Peninsula, China. Minerals 9 (4), 214. doi:10.3390/min9040214
Wang, Y., Zhou, Y., Xiao, F., Wang, J., Wang, K., and Yu, X. (2020). Numerical metallogenic modeling and support vector machine methods applied to predict deep mineralization: a case study from the Fankou Pb-Zn ore deposit in northern Guangdong. Geotect. Metallog. 44 (2), 222–230. (in Chinese with English abstract). doi:10.16539/j.ddgzyckx.2020.02.006
Wang, Z. L., Yang, L. Q., Guo, L. N., Marsh, E., Wang, J. P., Liu, Y., et al. (2015b). Fluid immiscibility and gold deposition in the Xincheng deposit, Jiaodong Peninsula, China: a fluid inclusion study. Ore Geol. Rev. 65, 701–717. doi:10.1016/j.oregeorev.2014.06.006
Wen, B. J., Fan, H. R., Hu, F. F., Liu, X., Yang, K. F., Sun, Z. F., et al. (2016). Fluid evolution and ore genesis of the giant Sanshandao gold deposit, Jiaodong gold province, China: constrains from geology, fluid inclusions and H–O–S–He–Ar isotopic compositions. J. Geochem. Explor. 171, 96–112. doi:10.1016/j.gexplo.2016.01.007
Wilson, C. J., Osborne, D. J., Robinson, J. A., and Miller, J. M. (2016). Structural constraints and localization of gold mineralization in leather jacket lodes, ballarat, victoria, Australia. Econ. Geol. 111 (5), 1073–1098. doi:10.2113/econgeo.111.5.1073
Wu, X., Zhu, G., Yin, H., Su, N., Lu, Y., Zhang, S., et al. (2020). Origin of low-angle ductile/brittle detachments: examples from the cretaceous Linglong metamorphic core complex in eastern China. Tectonics 39 (9), e2020TC006132. doi:10.1029/2020tc006132
Xiang, J., Xiao, K., Carranza, E. J. M., Chen, J., and Li, S. (2019). 3D mineral prospectivity mapping with random forests: a case study of Tongling, Anhui, China. Nat. Resour. Res. 29 (1), 395–414. doi:10.1007/s11053-019-09578-2
Xiao, F., Chen, W., Wang, J., and Oktay, E. (2022). A hybrid logistic regression: gene expression programming model and its application to mineral prospectivity mapping. Nat. Resour. Res. 31, 2041–2064. doi:10.1007/s11053-021-09918-1
Xiao, F., Chen, X., and Cheng, Q. (2024). Combining numerical modeling and machine learning to predict mineral prospectivity: a case study from the Fankou Pb-Zn deposit, southern China. Appl. Geochem. 160, 105857. doi:10.1016/j.apgeochem.2023.105857
Xiao, F., Cheng, Q., Hou, W., and Agterberg, F. P. (2023). Three-dimensional prospectivity modeling of Jinshan Ag-Au deposit, southern China by weights-of-evidence. J. Earth Sci. 2023. doi:10.1007/s12583-023-1822-6
Xiao, F., and Wang, K. (2021). Faults and intrusion occurrence control on copper mineralization in Dexing porphyry copper deposit in Jiangxi, China: a perspective from stress deformation-heat transfer-fluid flow coupled numerical modeling. Earth Sci. Front. 28 (3), 190–207. (in Chinese with English abstract). doi:10.13745/j.esf.sf.2021.1.14
Xiao, K. Y., Li, N., Alok, P., Holden, E. J., Leon, B., and Lu, Y. J. (2015). GIS-based 3D prospectivity mapping: a case study of Jiama copper-polymetallic deposit in Tibet, China. Ore Geol. Rev. 71, 611–632. doi:10.1016/j.oregeorev.2015.03.001
Xie, S., Mao, X., Liu, Z., Deng, H., Chen, J., and Xiao, K. (2022). Determining the paleostress regime during the mineralization period in the Dayingezhuang orogenic gold deposit, Jiaodong Peninsula, eastern China: insights from 3D numerical modeling. Minerals 12 (5), 505. doi:10.3390/min12050505
Yang, L., Deng, J., Guo, R., Guo, L., Wang, Z., Chen, B., et al. (2016b). World-class Xincheng gold deposit: an example from the giant Jiaodong gold province. Geosci. Front. 7 (3), 419–430. doi:10.1016/j.gsf.2015.08.006
Yang, L. Q., Deng, J., Wang, Z. L., Guo, L. N., Li, R. H., Groves, D. I., et al. (2016a). Relationships between gold and pyrite at the Xincheng gold deposit, Jiaodong Peninsula, China: implications for gold source and deposition in a brittle epizonal environment. Econ. Geol. 111 (1), 105–126. doi:10.2113/econgeo.111.1.105
Yu, X., Yang, D., Li, D., Dan, W., Xiong, Y., Chi, N., et al. (2019). Mineralization characteristics and geological significance in 3000m depth of Jiaojia gold metallogenic belt, Jiaodong Peninsula. Acta Petrol. Sin. 39 (9), 2893–2910. doi:10.18654/1000-0569/2019.09.18
Yuan, F., Li, X., Zhang, M., Jowitt, S. M., Jia, C., Zheng, T., et al. (2014). Three-dimensional weights of evidence-based prospectivity modeling: a case study of the baixiangshan mining area, ningwu basin, middle and lower yangtze metallogenic belt, China. J. Geochem. Explor. 145, 82–97. doi:10.1016/j.gexplo.2014.05.012
Zhang, L., Weinberg, R. F., Yang, L. Q., Groves, D. I., Sai, S. X., Matchan, E., et al. (2020a). Mesozoic orogenic gold mineralization in the Jiaodong Peninsula, China: a focused event at 120 ± 2 Ma during cooling of pregold granite intrusions. Econ. Geol. 115 (2), 415–441. doi:10.5382/econgeo.4716
Zhang, M., Zhou, G., Shen, L., Zhao, W., Liao, B., Yuan, F., et al. (2019). Comparison of 3D prospectivity modeling methods for Fe-Cu skarn deposits: a case study of the Zhuchong Fe-Cu deposit in the Yueshan orefield (Anhui), eastern China. Ore Geol. Rev. 114, 103126. doi:10.1016/j.oregeorev.2019.103126
Zhang, Y., Schaubs, P., Zhao, C., Ord, A., Hobbs, B., and Barnicoat, A. (2008). Fault-related dilation, permeability enhancement, fluid flow and mineral precipitation patterns: numerical models. Geol. Soc. Lond. Spec. Publ. 299 (1), 239–255. doi:10.1144/sp299.15
Zhang, Z., Zhang, J., Wang, G., Carranza, E. J. M., Pang, Z., and Wang, H. (2020b). From 2D to 3D modeling of mineral prospectivity using multi-source geoscience datasets, wulong gold district, China. Nat. Resour. Res. 29 (1), 345–364. doi:10.1007/s11053-020-09614-6
Zhao, C. (2015). Advances in numerical algorithms and methods in computational geosciences with modeling characteristics of multiple physical and chemical processes. Sci. China Technol. Sci. 58, 783–795. doi:10.1007/s11431-015-5784-5
Zhao, C., Hobbs, B., and Ord, A. (2022). Investigating porosity structure effects on hydrothermal mineralization patterns within permeable horizontal layers of fluid-saturated rocks: semi-analytical approach through generic models. Ore Geol. Rev. 150, 105116. doi:10.1016/j.oregeorev.2022.105116
Zhao, C., Hobbs, B. E., and Ord, A. (2009). Fundamentals of computational geoscience: numerical methods and algorithms. Berlin, Germany: Springer Science & Business Media, 122.
Zhao, C., Reid, L. B., and Regenauer-Lieb, K. (2012). Some fundamental issues in computational hydrodynamics of mineralization: a review. J. Geochem. Explor. 112, 21–34. doi:10.1016/j.gexplo.2011.10.005
Keywords: 3D modeling, ore-forming simulation, 3D prospectivity modeling, gold exploration, Jiaojia gold belt
Citation: Chen G, Liu Z, Chen G, Xie S, Yang X, Li X, Chen Y, Hao Z, Zhong H and Jiang L (2024) Deep gold prospectivity modeling in the Jiaojia gold belt, Jiaodong Peninsula, eastern China using machine learning of geometric and geodynamic variables. Front. Earth Sci. 12:1308426. doi: 10.3389/feart.2024.1308426
Received: 06 October 2023; Accepted: 15 January 2024;
Published: 26 January 2024.
Edited by:
Claudia Belviso, National Research Council (CNR), ItalyReviewed by:
Pura Alfonso, Universitat Politecnica de Catalunya, SpainCopyright © 2024 Chen, Liu, Chen, Xie, Yang, Li, Chen, Hao, Zhong and Jiang. This is an open-access article distributed under the terms of the Creative Commons Attribution License (CC BY). The use, distribution or reproduction in other forums is permitted, provided the original author(s) and the copyright owner(s) are credited and that the original publication in this journal is cited, in accordance with accepted academic practice. No use, distribution or reproduction is permitted which does not comply with these terms.
*Correspondence: Guodong Chen, Y2hlbmd1b2Rvbmdka3lAc2hhbmRvbmcuY24=
Disclaimer: All claims expressed in this article are solely those of the authors and do not necessarily represent those of their affiliated organizations, or those of the publisher, the editors and the reviewers. Any product that may be evaluated in this article or claim that may be made by its manufacturer is not guaranteed or endorsed by the publisher.
Research integrity at Frontiers
Learn more about the work of our research integrity team to safeguard the quality of each article we publish.