 Diwen Dong
 Hui Tao
 Zengxin Zhang
 Sanjit Kumar Mondal
94% of researchers rate our articles as excellent or good
Learn more about the work of our research integrity team to safeguard the quality of each article we publish.
Find out more
ORIGINAL RESEARCH article
Front. Earth Sci., 08 February 2024
Sec. Atmospheric Science
Volume 12 - 2024 | https://doi.org/10.3389/feart.2024.1286012
This article is part of the Research TopicModelling, Simulating and Forecasting Regional Climate and Weather, volume IIView all 8 articles
Introduction: Heatwaves (HWs) are the serious natural disaster that exert great impacts on human health and social economy. Projecting future changes in HWs is crucial for the development of effective adaptation strategies.
Method: This study investigates the variations of HWs in Xinjiang for three time periods (near-term, mid-term, and long-term) under four Shared Socioeconomic Pathways (SSP1-2.6, SSP2-4.5, SSP3-7.0, and SSP5-8.5) using multi-model ensemble (MME). To enhance confidence in HWs projection, we evaluate the performance of 17 climate models in simulating HWs in terms of interannual variability and spatial patterns using interannual variability skill score (IVS) and distance between indices of simulation and observation (DISO), respectively, and generate MME using the overall performance.
Results: Compared to the observed data, the overall performance of MME outperforms most of individual models, although many models effectively capture the characteristics of HWs. Projections indicate that HWs in Xinjiang will become more longer lasting and severe. Specifically, heatwave frequency (HWF) and heatwave duration (HWD) are projected to reach 7.5 times and 61 days, respectively, in the long-term under the SSP5-8.5 scenario. The spatial distribution of HWs exhibits significant heterogeneity, with high value regions primarily distributed in eastern Xinjiang and the eastern part of southern Xinjiang. Although the HWs area is projected to expand under all scenarios, the spatial pattern is anticipated to remain largely unchanged.
Conclusion: These findings provide a comprehensive assessment of future variations in HWs, which are necessary for improving regional adaptive capacity to extreme heat risk.
Heatwaves (HWs) are broadly defined as periods of abnormally high temperatures (Schoetter et al., 2014). Over the past few decades, severe HWs have occurred in many regions, such as Europe (2003), Australia (2009), Russia (2010) and China (2013) (Joughin et al., 2004; Barriopedro et al., 2011; McEvoy et al., 2012). In certain areas, HWs are considered the deadliest natural hazard, causing greater economic damage, loss of life, and property destruction than any other natural hazard (Anderson and Bell, 2011; Xiao et al., 2017). In addition, HWs can result in crop failure and increased fire risk (Zampieri et al., 2017; Libonati et al., 2022). According to the Sixth Assessment Report (AR6) of the Intergovernmental Panel on Climate Change (IPCC), the global surface temperature has risen by approximately 1.09°C from 2011 to 2020, compared to the period of 1850–1900 (IPCC, 2021). This will increase the frequency, intensity and duration of HWs in most regions (Argüeso et al., 2016). While the increase in HWs is a widespread problem, regional disparities exist in terms of frequency and duration.
Global climate models (GCMs) serve as reliable tools for comprehending the climate system, reproducing its historical patterns, and projecting future changes (Eyring et al., 2016). The Coupled Model Intercomparison Project (CMIP) represents the most extensive database of climate models and forms the foundation for the IPCC assessment reports. Currently, CMIP is in Phase 6 (CMIP6), which boasts a more comprehensive experimental design compared to its predecessors, incorporating enhancements in physical processes and higher spatial resolution (Stouffer et al., 2017). Although CMIP6 models have an increased degree of freedom by including more processes and couplings, they still exhibit regional biases when compared with observations (Gutmann et al., 2014; Koteswara Rao et al., 2022). For instance (Hirsch et al., 2021), evaluate CMIP6 models’ capability to simulate global HWs characteristics over the period 1950–2014 and find that most models underestimate frequency while showing regional underestimations or overestimations of duration, average intensity, and cumulative intensity. To address these limitations, the NASA Earth Exchange Global Daily Downscaled Projections (NEX-GDDP) expands the set of variables through the statistical downscaling method and releases the latest version of NEX-GDDP data (NEX-GDDP-CMIP6), based on the GCM output from the CMIP6 (Thrasher et al., 2022). The NEX-GDDP-CMIP6 significantly contributes to climate change projection studies and offers higher temporal and spatial resolution than other climate data products like HadEX3 or the Berkeley Earth daily climate (Murali et al., 2023). In short, the NEX-GDDP-CMIP6 dataset has been widely used in regional climate change research, especially in extreme climates (Al-Bakri et al., 2021; Shao et al., 2023). Thus, this study aims to project regional scale HWs by using the latest released NEX-GDDP-CMIP6 dataset.
The reliability of future climate change projections is heavily influenced by uncertainties in GCMs (Khan et al., 2020). Multi-model ensemble (MME) is considered one of the most effective ways to reduce uncertainties (Mehr and Kahya, 2017). Various methods for generating MME exist, with equal-weighted average and unequal weighted average being commonly employed. In the former, each model within the ensemble is assigned an identical weight. The latter method utilizes the historical relationship between observations and simulations to determine the weights, which reflect the simulation level of the model (Smith and Chandler, 2009). Although equal-weighted average has been used in some projection studies, it has often been questioned for not taking into account differences in uncertainty among ensemble members (Plecha and Soares, 2020). In the research by Christensen et al. (Christensen et al., 2010), climate change information generated through regional climate models performance metrics does not provide sufficient evidence that the weighted average provides a better description of the mean climate state than equal-weighted average. Despite the dispute, the climate modeling community generally agrees that all IPCC-recognized models have weaknesses and strengths, and their performance is similar at the global scale while significantly different at the regional scale (Chen et al., 2017). Consequently, the approach of weighting climate models according to their performance is more prevalent in regional studies.
HWs in Xinjiang are characterized by a wide range of effects, long duration, high intensity, early occurrence, and late termination (Mao et al., 2016; Liu et al., 2021). The melt snow and ice floods triggered by HWs in July 2014 caused 6 deaths, 300 hm2 of grassland damage, and economic losses amounting to 1.4 million (Zhang et al., 2021). In addition, HWs can result in reduced yields of growing crops such as cotton and corn, as well as increased energy consumption for water and electricity in (Xin et al., 2008). The occurrence of extreme climate events in Xinjiang has far-reaching consequences, not only affecting the local natural environment and socio-economic factors but also impacting Central China and Eastern China (Zhang et al., 2013; Yu et al., 2014). Accordingly, the projection of HWs in Xinjiang holds significant importance for sustainable socio-economic development. However, it is noteworthy that most climate extreme projections in Xinjiang have predominantly focus on extreme temperatures. For instance (Zhang et al., 2022), find that CMIP6 reasonably reproduces the temperature in Xinjiang, and (Guan et al., 2022) project an increase in extreme warm events in Xinjiang based on CMIP6 model simulations. Several large regional scale projection studies have also suggest the higher likelihood of more frequent, prolonged, and intense HWs in Xinjiang as global warming (Guo et al., 2016; Yang et al., 2020). Nonetheless, the systematic examination specifically targeting the variability of HWs in Xinjiang has been lacking. Furthermore, previous studies have primarily considered temperature alone in defining HWs, overlooking the critical factor of relative humidity within the context of the warming-wetting trend.
Hence, this study aims to systematically project the variations of HWs in Xinjiang, incorporating both air temperature and relative humidity considerations. The objective of this study is to investigate the variation of HWs in Xinjiang, utilizing the high-resolution observation dataset and the latest release of the NEX-GDDP-CMIP6. Firstly, the HWs simulation capability of the 17 climate models is evaluated using a high-resolution daily gridded meteorological dataset. Secondly, MME is generated using a weighted average based on the interannual variability and spatial patterns performance of individual models. Finally, the variation of HWs in Xinjiang is projected under the warming climate. These findings of this study aim to furnish a scientific foundation for enhancing the disaster prevention and mitigation capabilities in Xinjiang while promoting sustainable development in the region.
Xinjiang is located in the hinterland of the Asia-Europe continent, far from the sea, and is an important part of the arid Central Asia. As the largest province in China, Xinjiang covers an area of 166 × 104km2, and occupies one-sixth of the total land of China. The region has the temperate continental climate with low precipitation, sufficient sunshine and strong evaporation. The topography is characterized by “Three Mountains and Two Basins,” with the Kunlun Mountains, the Tarim Basin, the Tianshan Mountains, the Junggar Basin and the Altay Mountains (Figure 1). According to the topography, Xinjiang is usually divided into the southern Xinjiang (SXJ), northern Xinjiang (NXJ), and eastern Xinjiang (EXJ). The Taklimakan Desert in the Tarim Basin (China’s largest desert) and the Gurbantunggut Desert in the Junggar Basin (China’s second-largest desert) are the main heat sources in Xinjiang. As an important supply base for grain and cotton production and the largest province for animal husbandry in China, Xinjiang is very sensitive to climate change (Wang et al., 2014; Shi et al., 2022; Zeng et al., 2022). Therefore, strengthening the knowledge of climate patterns and improving the response capacity to climate change is crucial to the sustainable development of Xinjiang.
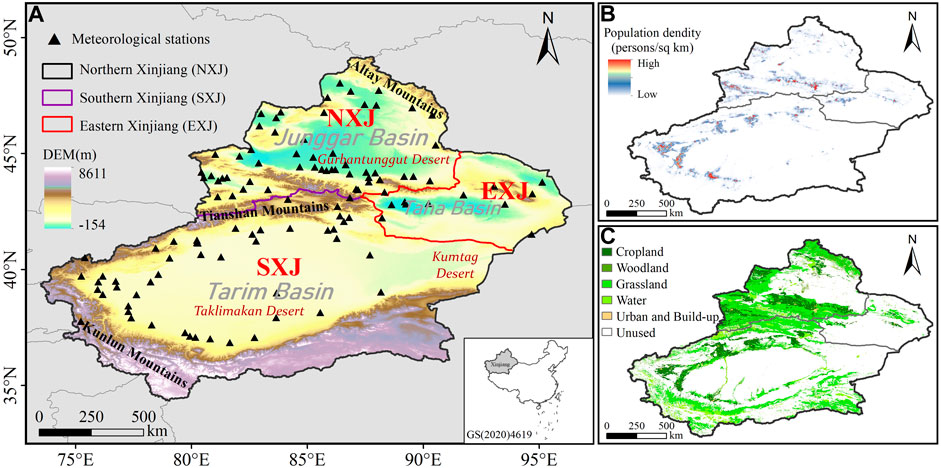
FIGURE 1. Maps of the study region. (A) The location of Xinjiang and the distribution of meteorological stations. (B) Population density of Xinjiang in 2020. (C) Land-use types of Xinjiang in 2020.
To evaluate the ability of the model in simulating HWs during the reference period (1995–2014), we employ the CN05.1 gridded daily maximum temperature and relative humidity by the China Meteorological Data Service Center (http://data.cma.cn). This dataset offers high spatial resolution (0.25°×0.25°) is produced by Wu and Gao based on meteorological observations from more than 2,400 stations in China by interpolation of thin-plate smoothing splines and angular distance weighting method (Wu and Gao, 2013). Due to the long time series and the high quality of the data, CN05.1 has been widely used in previous research on climate change and extreme events in China (Zhu et al., 2020; Zhang et al., 2023).
Projection data are obtained from the latest version of the NASA Earth Exchange Global Daily Downscaled Projections dataset (NEX-GDDP-CMIP6, https://www.nccs.nasa.gov/services/data-collections/land-based-products/nex-gddp-cmip6), with a resolution of 0.25°×0.25°. The NEX-GDDP-CMIP6 dataset is based on the GCMs output from the CMIP6 (Thrasher et al., 2022). The dataset includes 4 Shared Socioeconomic Pathway (SSP) scenarios (SSP1-2.6, SSP2-4.5, SSP3-7.0, and SSP5-8.5) for the period 2015–2100. In this study, 17 models available for each scenario in the dataset (Table 1) are used to generate MME for projection.

TABLE 1. Basic information for the NEX-GDDP-CMIP6 dataset used in this study.
HWs are abnormally hot weather process that lasts for several days. This study adopts the heat wave index (HI) proposed by Huang et al. (Huang et al., 2011) as the judge of HWs. The index can be calculated as follows:
Where,
The torridity index (
in which
The critical value of torridity (
Where
We focus on the variability of HWs in terms of both frequency and duration. Heatwave frequency (HWF) is the number of heatwaves that occur in a year. Heatwave duration (HWD) is defined as the longest yearly heatwaves (Dong et al., 2021).
The interannual variability of the simulations relative to the observations is assessed by the interannual variability skill score (IVS) (Chen et al., 2011), which is calculated as follows:
Where
Distance between Indices of Simulation and Observation (DISO) is a new comprehensive statistical index which can quantify the overall performance of the different models against the observed values (Hu et al., 2019). Compared with the widely used Taylor diagram, DISO can quantitatively describe the accuracies of the models in different perspectives by statistical metrics, such as the correlation coefficient (R), the absolute error (AE), and the root-mean-square error (RMSE). These statistical metrics are calculated using the following equations:
Where the observed values
The smaller value of DISO, the model performs better and vice versa.
The overall performance of models is evaluated by the comprehensive rating metric (
MME is generated based on the
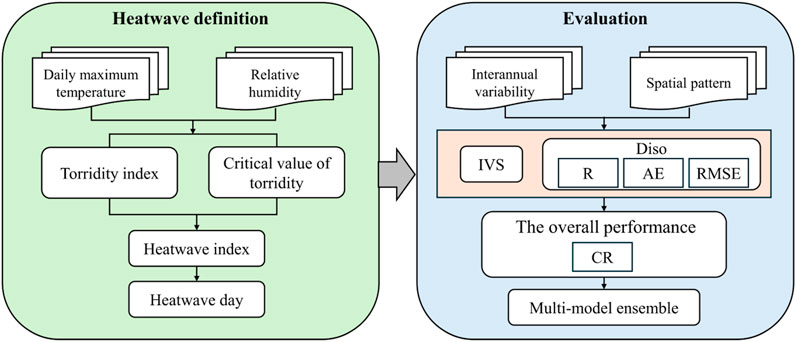
FIGURE 2. Multi-model ensemble flowchart.
The performance of simulation models is usually evaluated by comparing their outputs with historical observations before projecting future climate change. Figure 3A illustrates the bias in simulating HWs between individual models and observations during the historical period, with biases ranging from −2.3 to 1.2 days. Most models exhibit biases of less than 1 day, with MIROC6 displaying the largest bias and EC-Earth3 the smallest. Figure 3B presents the model skill scores of individual models for simulating the interannual variability of HWs in Xinjiang. All climate models display IVS values below 0.03, the optimal model for simulating interannual variability is GFDL-ESM4.
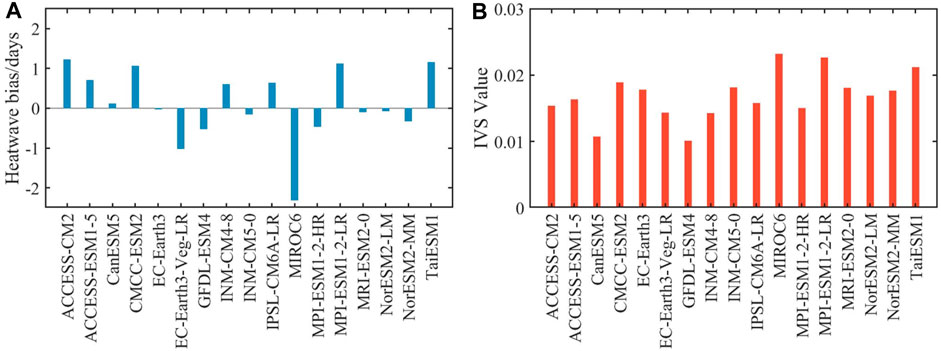
FIGURE 3. (A) Bias in simulating heatwaves between individual models and observations, and (B) model skill scores of the interannual variability.
Figure 4 represents the spatial distribution of HWs based on observations and 17 climate model simulations during the period 1995–2014. According to the observed data, most regions of Xinjiang have suffered from HWs during the historical period, and the spatial pattern of HWs exhibits significant spatial heterogeneity. The total number of heatwave days in most regions ranging from 5 to 35 days, while regions with higher values exceeding 35 days are primarily concentrated in EXJ and eastern part of SXJ. The climate models generally capture the spatial characteristics of HWs well in comparison to observations. Despite a general alignment in the area of HWs and the spatial distribution of high value regions between climate model simulations and observed data, biases persist in certain regions. To assess the capability of individual models to simulate the spatial patterns of HWs in Xinjiang, we employ DISO, a statistical index that can quantify the simulation capability, by using the metrics R, AE and RMSE. According to the magnitude of the DISO values, the ranking of model simulation capabilities is illustrated in Figure 5. Unlike the model with the optimal ability in simulating interannual variability of HWs, MIROC6 emerges as the model with the optimal ability to simulate spatial patterns.
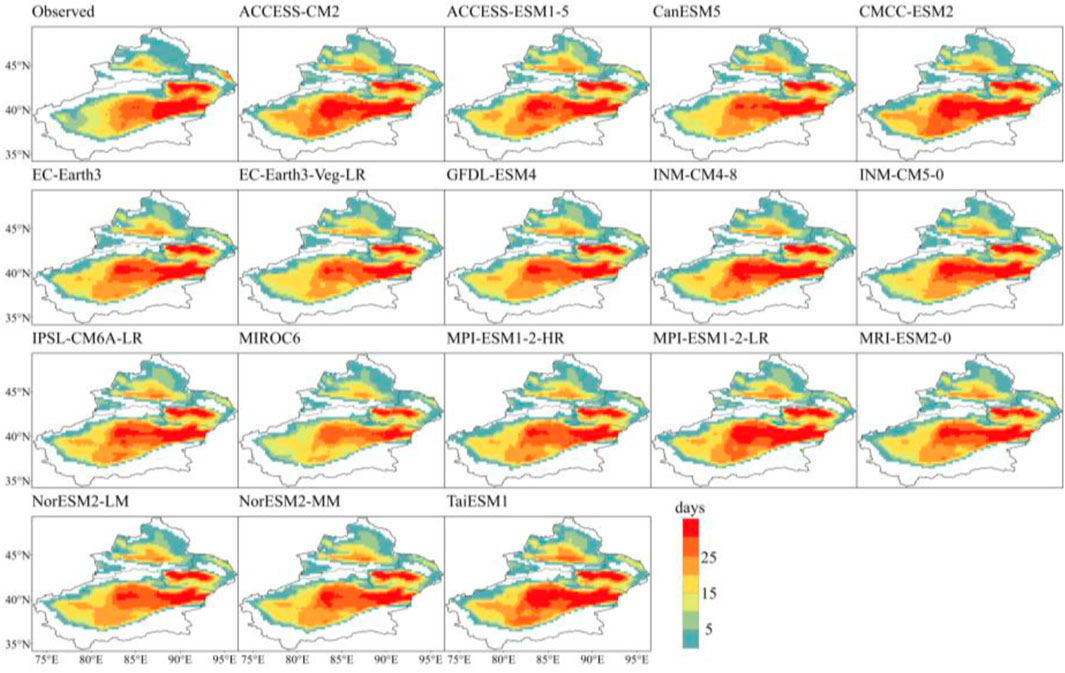
FIGURE 4. Spatial distribution of annual mean heatwave days in Xinjiang from observations and 17 climate model simulations during the period 1995–2014.
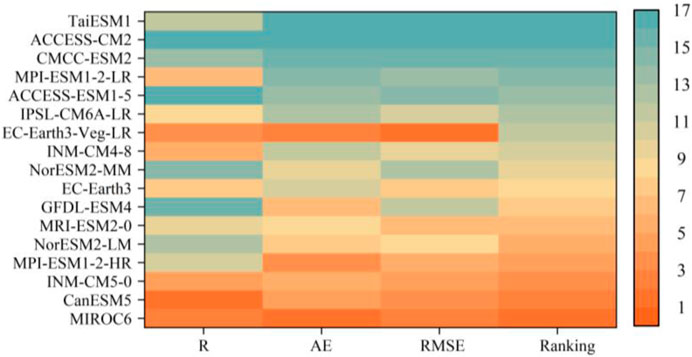
FIGURE 5. Statistical metrics of 17 climate models in capturing spatial patterns of heatwaves in Xinjiang during the period 1995–2014.
By combining the IVS and DISO rankings, we calculate the

FIGURE 6. Rader maps of weights based on the performance of the 17 climate models.
We compare the simulation capabilities of the MME both interannual variability and spatial distribution with individual models within the ensemble. As shown in Figure 7A, the MME exhibits IVS value of 0.013, indicating a weaker performance compared to CanESM5 and GFDL-ESM4 in simulating interannual variability in HWs. Despite this, MME surpasses the vast majority of individual models in simulating interannual variability. Assessing the MME’s ability to capture spatial patterns of HWs, as indicated by the DISO value, it outperforms all ensemble models except MIROC6 and CanESM5 (Figure 7B). Combining the performance of simulation capabilities in terms of interannual variability and spatial patterns, MME performs better than most individual models in simulating HWs in Xinjiang.
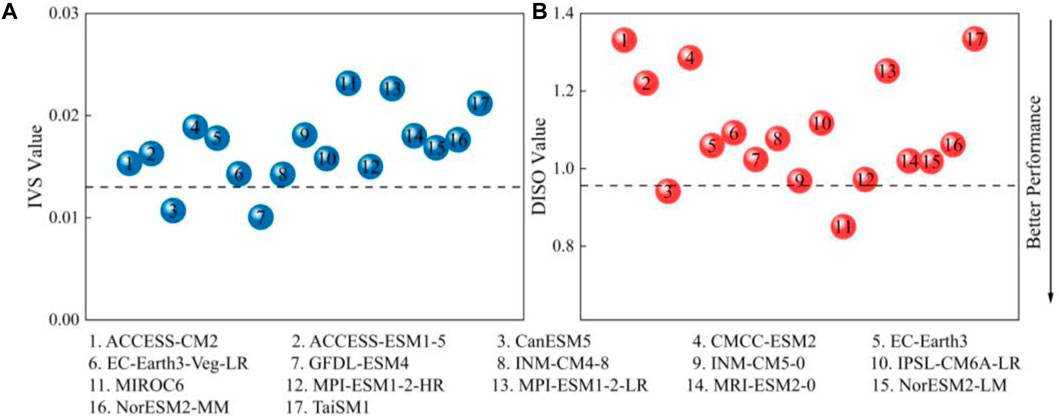
FIGURE 7. Scatter diagram of the model performance. (A) IVS and (B) DISO. The horizontal dashed lines indicate the value of MME.
HWF in Xinjiang during the reference period is 5.5 times, and the HWF during the projection period shows an increase compared to the reference period, but the change is slight (Figure 8A). The minimum (6.3 times) and maximum values (7.9 times) of the HWF in Xinjiang for the projection time period occur in the near-term under the SSP1-2.6 and in the long-term under the SSP3-7.0 scenario, respectively. The NXJ is the region with the lowest HWF in the reference period, at 3.5 times. Over time, HWF in NXJ demonstrates the consistent increase, with the highest value occurring in the long-term under the SSP5-8.5 scenario, peaking at 8.4 times (Figure 8B). The maximum HWF values in both SXJ (Figure 8C) and EXJ (Figure 8D) are observed in the long-term, reaching 8 and 8.2 times, respectively. In summary, HWF does not exhibit significant differences across regions and scenarios over the projection period.
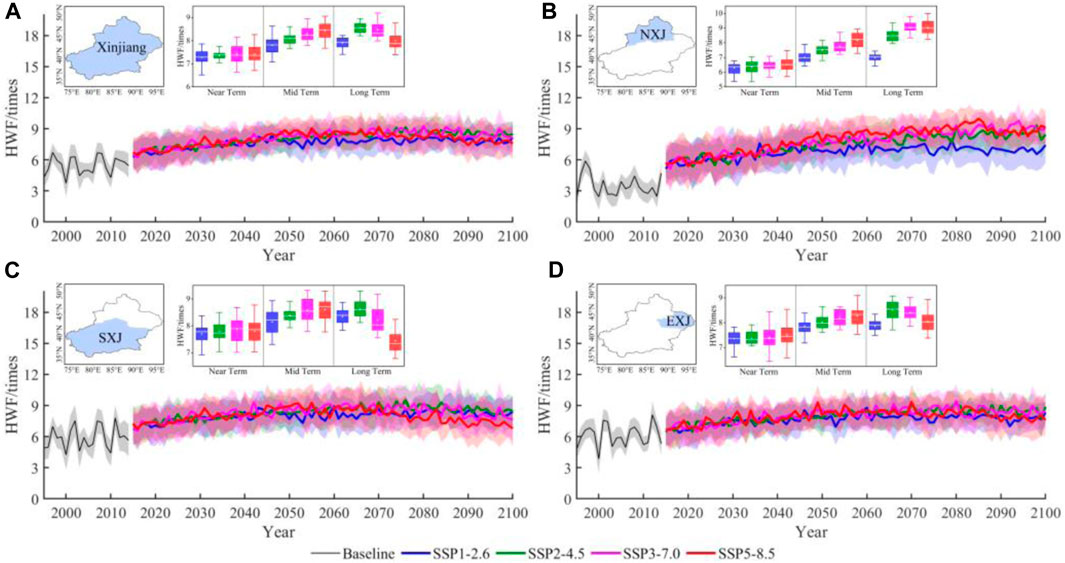
FIGURE 8. Temporal series of HWF in (A) Xinjiang, (B) NXJ, (C) SXJ, and (D) EXJ during 1995–2100. Solid lines denote the mean annual HWF estimated across the 17 models. The shaded area denotes the uncertainty range (±1 standard deviation range of model annual averages). From the bottom to the top of a box, the horizontal lines represent the minimum, first (lower) quartile, mean, third (upper) quartile and maximum, respectively.
Compared with the reference period, HWD increased in Xinjiang during the projection period (Figure 9A). Notably, HWD consistently exhibits higher values under the high emission scenario compared to the low and moderate emission scenarios. Under the SSP1-2.6, SSP2-4.5, SSP3-7.0, and SSP5-8.5 scenarios, HWD in Xinjiang is projected to reach 13.8, 13.2, 13.7, and 15 days in the near-term, respectively, and is expected to further increase to 16.8, 26.9, 43.9, and 61 days in the long-term. It can be observed that the most significant changes in HWD occur under the SSP5-8.5 scenario. Besides the evident differences in HWD between scenarios, there are also noticeable variations between regions. For instance, HWD in SXJ (Figure 9C) under the SSP5-8.5 scenario is projected to increase to 72.4 days in the long-term, while in NXJ (Figure 9B), it is anticipated to reach 38.3 days. The evaluation of HWD under the scenarios in EXJ (Figure 9D) follows the consistently increasing trend over time, similar to other regions. Overall, HWD is projected to increase in Xinjiang with rising SSP scenarios.
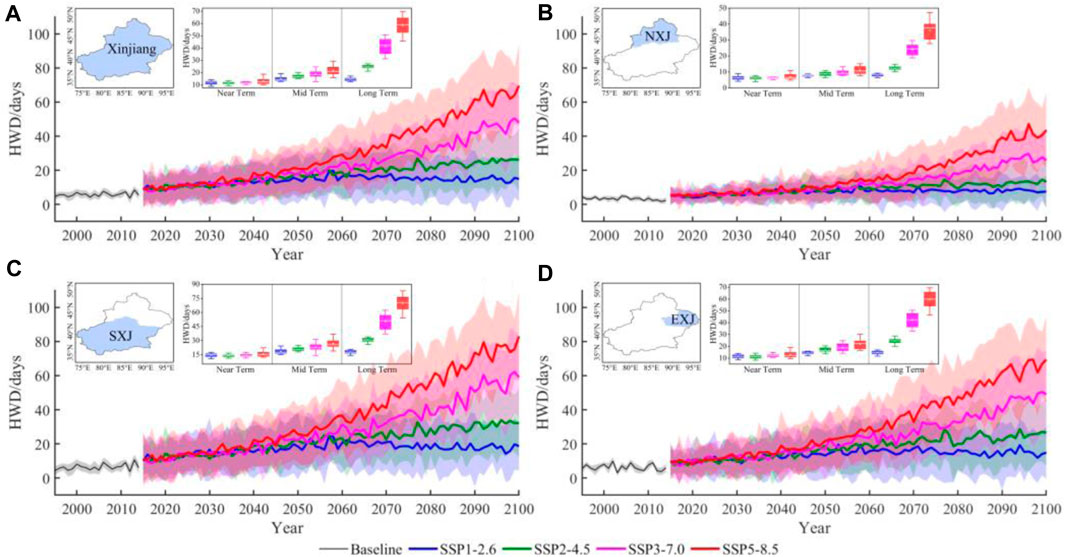
FIGURE 9. Temporal series of HWD in (A) Xinjiang, (B) NXJ, (C) SXJ, and (D) EXJ during 1995–2100. Solid lines denote the mean annual HWD estimated across the 17 models. The shaded area denotes the uncertainty range (±1 standard deviation range of model annual averages). From the bottom to the top of a box, the horizontal lines represent the minimum, first (lower) quartile, mean, third (upper) quartile and maximum, respectively.
Figure 10 illustrates the probability distribution of HWF for different periods under various scenarios. In comparison to the reference period, it is evident that the maximum value of the future probability density distribution consistently shifts to the right across all regions of Xinjiang, indicating an increase in HWF in the future. Among them, the most significant changes are observed in NXJ. During the reference period, the maximum probability density of HWF in NXJ is recorded at 1.1 times (Figure 10A). However, under the SSP3-7.0 and SSP5-8.5 scenarios, the maximum probability density of HWF significantly increases in the long-term, reaching values between 8–12 times. In SXJ and EXJ, the maximum probability density of HWF occurrence during the reference period is 7.1 and 7.5 times, respectively (Figures 10B,C). In SXJ, the highest probability density of HWF occurrence is concentrated within the range of 6.7–9.2 times. The maximum values of the probability density of the occurrence of HWF in EXJ are concentrated between 7 and 9.5 times. Compared to the reference period, HWF exhibits an increase in NXJ, with the most significant increase occurring along the periphery of the Junggar Basin (Figure 11). Unlike NXJ, HWF decreased in certain areas of SXJ and EXJ. Notably, the regions experiencing decreased HWF are predominantly situated in areas with frequent HWs during the reference period.
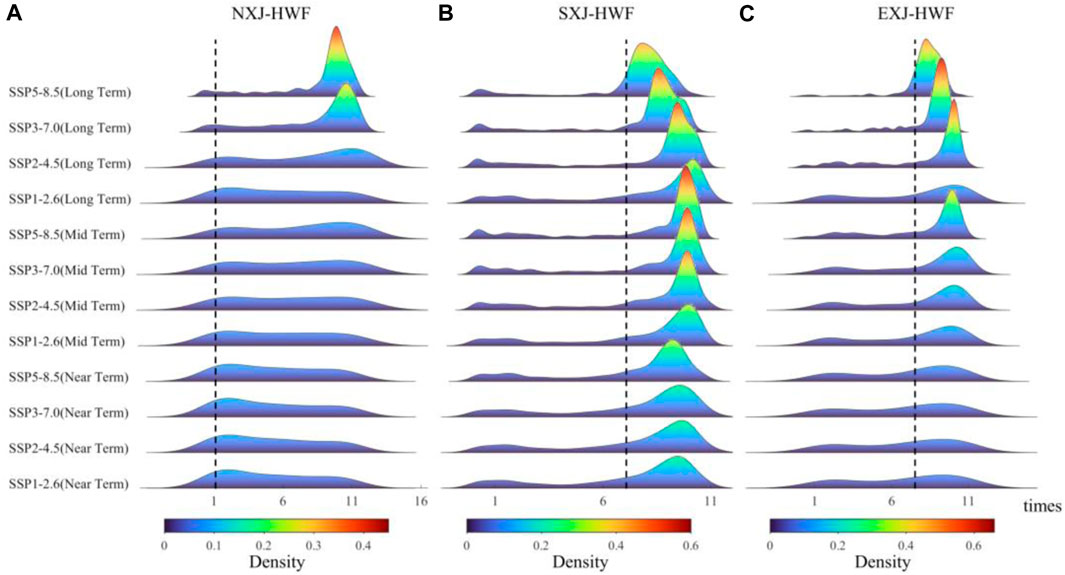
FIGURE 10. Kernel fit to the histograms of the probability of HWF in (A) NXJ, (B) SXJ, and (C) EXJ. The black dashed line denotes the maximum density of HWF in the reference period.
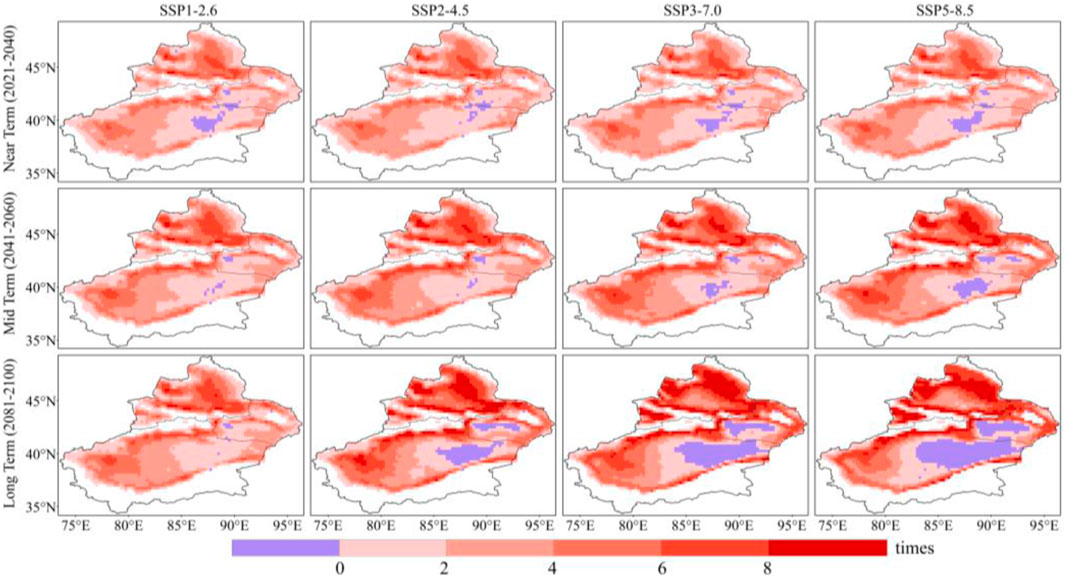
FIGURE 11. Projected changes of HWF in Xinjiang from MME under different SSP scenarios, relative to the reference period (1995–2014).
Similar to the HWF projection, the probability density of HWD exhibits the rightward shift in future periods. The highest values of the probability density of HWD occurrence in NXJ vary significantly in the long-term under the SSP3-7.0 and SSP5-8.5 scenarios (Figure 12A). In SXJ, HWD with the highest probability density of occurrence during the reference period is 5.2 days, which is projected to increase to between 17 and 80 days during the projection period (Figure 12B). Compared to the reference period, the most significant changes of HWD in EXJ are observed in the long-term under the SSP3-7.0 and SSP5-8.5 scenarios (Figure 12C).
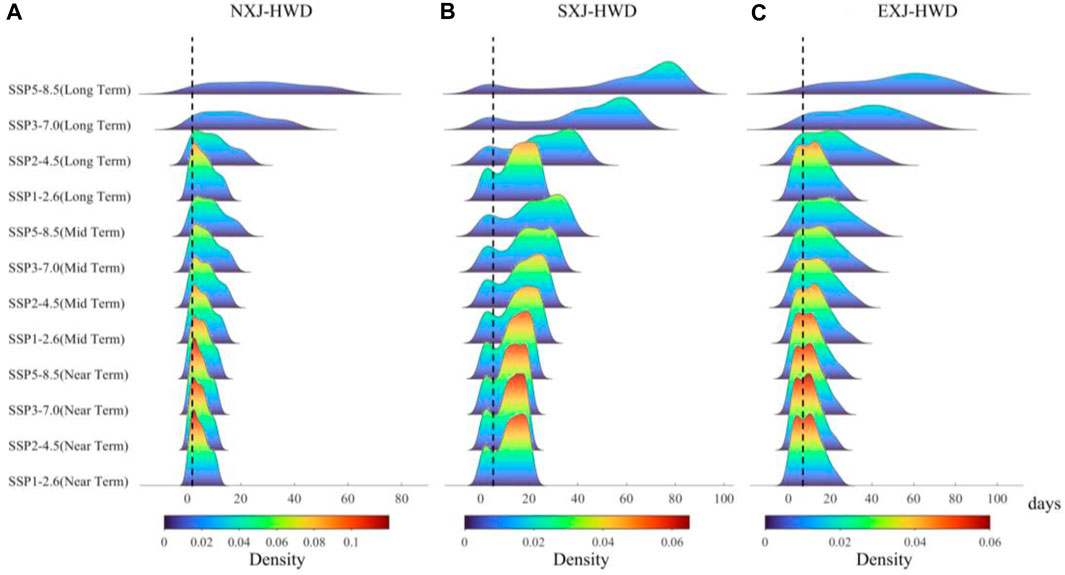
FIGURE 12. Kernel fit to the histograms of the probability of HWD in (A) NXJ, (B) SXJ, and (C) EXJ. The black dashed line denotes the maximum density of HWD in the reference period.
From the perspective of spatial, HWD are projected to increase in nearly all regions of Xinjiang (Figure 13). There is significant spatial heterogeneity in the increase of HWD under SSP scenarios in the near-term compared to the reference period. Regions that had sever HWs in the reference period show notable increases in the near-term under the SSP scenarios, such as EXJ and the eastern part of SXJ. During the mid-term and long-term, HWD will continually increase under the SSP scenario. In addition to the increase in HWD in regions where HWs have historically occurred, some regions that have never experienced HWs are likely to be hit in the future. Overall, HWD will increase in Xinjiang in the future, and the region affected by HWs is also expected to expand in size.
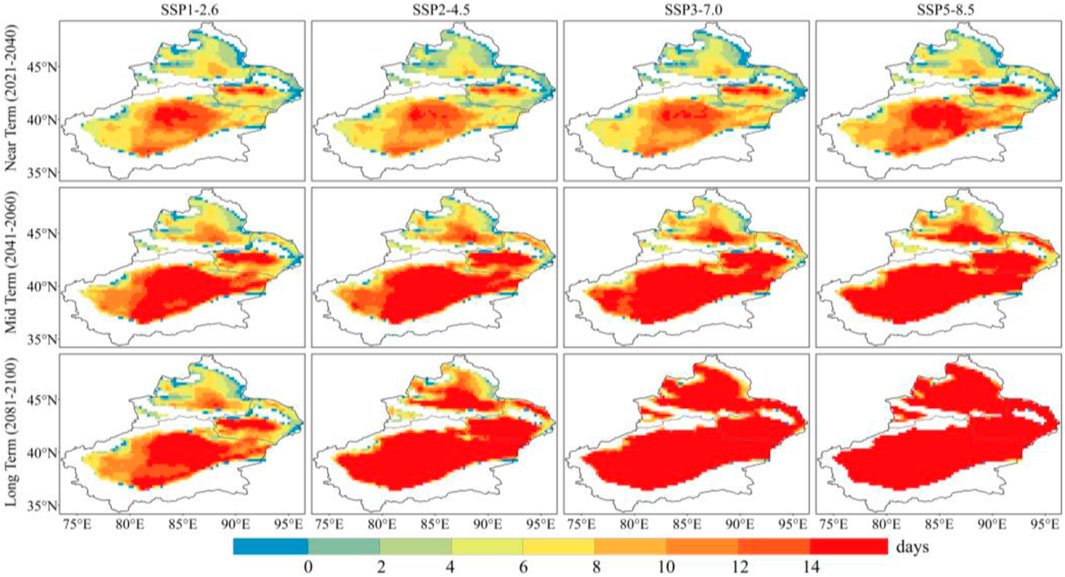
FIGURE 13. Same as Figure 11, but for HWD.
This study evaluates the capability of 17 climate models to simulate HWs in Xinjiang in terms of both interannual variability and spatial patterns in combination with CN05.1 data. The results indicate that the models which perform well in simulating interannual variability do not excel in capturing spatial patterns. Conversely, those that capture spatial patterns well are poor at interannual variability. In short, there is no single model that can be considered ideal, as is the case with many of the existing findings (Akinsanola et al., 2021; Yazdandoost et al., 2021). To improve the accuracy of the simulation of the model, MME is generated based on the overall performance of the model. When comparing the MME’s ability to simulate HWs with that of individual models within the ensemble, it is clear that MME may not be optimal in simulating interannual variability or spatial patterns, but its overall performance exceeds that of most of the individual models.
Projection studies have indicated that Xinjiang is tend to experience more frequent and severe HWs. There are increases in HWF compared to the reference period, but the changes are slight. However, HWD exhibits the significant and sustained increase over time. Numerous studies on HWs projection have shown a significant increasing trend in both HWF and HWD (Li et al., 2019). Differently, HWF in Xinjiang varies slightly over time and under SSP scenarios. This is related to the prolongation of HWD, which hinders the increase in HWF. The variation in HWF is more pronounced in NXJ compared to the SXJ and EXJ, which may be related to the higher temperature increase in NXJ (Zhang et al., 2023). In addition, NXJ with higher socio-economically development and greater human activity intensity, is more sensitive to climate change than other regions in Xinjiang (Zhang et al., 2016). As the SSP scenarios increase, HWs are expected to intensify in the near future, consistent with the findings of Wei et al., 2023. Particularly, HWD is projected to reach 61 days in the long-term under the SSP5-8.5 scenario. This implies that the current rare HWs will become more common in the near future under the SSP5-8.5 scenario. Overall, HWs in Xinjiang show an increasing trend, and the increase in HWs is mainly expressed through the prolongation of HWD.
Spatially, the distribution characteristics of HWs in Xinjiang coincide with the unique topographic features of the “Three Mountains and Two Basins” in the region. The topography of the closed basin, hills, and Gobi, which easily absorb solar radiation, result in regions of high value of HWF and HWD are mainly located in the EXJ, southern parts of NXJ, and the Tarim Basin (Shi et al., 2006). In this study, it is observed that high mountains such as the Kunlun Mountains, Tianshan Mountains, and Altay Mountains have never been affected by HWs and are projected to be unaffected by HWs until the end of this century. This finding is inconsistent with the results of (Liu et al., 2021), and the disparity may be attributed to the use of different definitions of HWs. Given the “warming-wetting” climate trend in Xinjiang, relying solely on the relative threshold of air temperature to identify HWs may lead to underestimating the intensity of HWs in regions with high relative humidity and may also result in the broader scope (Chen et al., 2020). The spatial distribution of HWs is not only influenced by regional geographical conditions but also by atmospheric circulation. SXJ and EXJ are in the area of subsidence movement of the Iranian High, and when subsidence airflow prevails, the structure of the atmosphere is stable, which is conducive to the emergence of HWs. The spatial distribution of HWs in Xinjiang is characterized by more occurrences in the south and less in the north, and more in the east and less in the west. HWs are projected to increase in most regions of Xinjiang with the increase of the SSP scenarios and over time, with HWD in the long-term under the SSP5-8.5 scenario expected to exceed 30 days. This is consistent with the result that most regions of the world produce more severe HWs in the future scenario and increase faster in SSP5-8.5 (Sun et al., 2014). In conclusion, the affected area and intensity of HWs in Xinjiang are projected to increase in the future, while the spatial distribution pattern will remain basically unchanged.
The problem of uncertainty lies at the heart of projection studies. MME is an effective method to reduce uncertainty (Parsons et al., 2021). The critical consideration in utilizing MME is how to combine models, various weighting schemes include equal weighting, performance weighting, performance weighting with bias removed, reliability ensemble averaging, independent weighting, and non-negative least squares regression (Elvidge et al., 2023). In this study, to enhance the reliability of projections, we evaluate the simulation capabilities of individual models in terms of interannual variability and spatial patterns are assessed. MME are subsequently generated based on the combined performance. To further reduce projection uncertainty, future studies should explore diverse ensemble schemes and employ preferred ranking strategy to construct MMEs with optimal performance.
HWs changes and their adverse impacts have attracted widespread attention. Studies at the regional scale are essential to improve understanding of local HWs variability and to facilitate the development of climate change adaptation strategies. In this study, we evaluate the ability of 17 climate models to simulate HWs in Xinjiang in terms of interannual variability and spatial patterns. Additionally, we project changes in HWs under different SSP scenarios based on the MME. The results indicate that most models successfully reproduce HWs in Xinjiang. In comparison to individual models, the comprehensive performance of MME exceeds that of most of the individual models. The projections using the MME suggest that the prolongation of HWD may lead to more severe HWs in Xinjiang, with more pronounced variations expected in the distant future as opposed to the near future. Spatially, the distribution characteristics of HWs in Xinjiang are closely related to the unique topographic features of the “Three Mountains and Two Basins” in the region, with significant spatial heterogeneity. The high-value regions are primarily distributed in the EXJ and the eastern part of SXJ. In the future, we anticipate an increase in both the extent and intensity of HWs in Xinjiang, while the spatial distribution pattern is projected to remain largely unchanged.
Publicly available datasets were analyzed in this study. This data can be found here: NEX-GDDP-CMIP6, https://www.nccs.nasa.gov/services/data-collections/land-based-products/nex-gddp-cmip6.
DD: Conceptualization, Data curation, Software, Writing–original draft, Writing–review and editing. HT: Funding acquisition, Project administration, Validation, Writing–review and editing. ZZ: Validation, Writing–review and editing. SM: Writing–review and editing.
The author(s) declare financial support was received for the research, authorship, and/or publication of this article. This study was supported by the Key Laboratory Opening Foundation of Xinjiang Uygur Autonomous Region, China (2023D04048) and the Innovation and Development Project of China Meteorological Administration (CXFZ2024J037).
The authors declare that the research was conducted in the absence of any commercial or financial relationships that could be construed as a potential conflict of interest.
All claims expressed in this article are solely those of the authors and do not necessarily represent those of their affiliated organizations, or those of the publisher, the editors and the reviewers. Any product that may be evaluated in this article, or claim that may be made by its manufacturer, is not guaranteed or endorsed by the publisher.
Akinsanola, A. A., Ongoma, V., and Kooperman, G. J. (2021). Evaluation of CMIP6 models in simulating the statistics of extreme precipitation over Eastern Africa. Atmos. Res. 254, 105509. doi:10.1016/j.atmosres.2021.105509
Al-Bakri, J., Farhan, I., Al-Qinna, M., Al-Karablieh, E., Bergouli, K., and McDonnell, R. (2021). Assessment of climate changes and their impact on barley yield in mediterranean environment using NEX-GDDP downscaled GCMs and DSSAT. Earth Syst. Environ. 5, 751–766. doi:10.1007/s41748-021-00238-1
Anderson, G. B., and Bell, M. L. (2011). Heat waves in the United States: mortality risk during heat waves and effect modification by heat wave characteristics in 43 U.S. communities. Environ. Health Perspect. 119, 210–218. doi:10.1289/ehp.1002313
Argüeso, D., Di Luca, A., Perkins-Kirkpatrick, S. E., and Evans, J. P. (2016). Seasonal mean temperature changes control future heat waves. Geophys. Res. Lett. 43, 7653–7660. doi:10.1002/2016gl069408
Barriopedro, D., Fischer, E. M., Luterbacher, J., Trigo, R. M., and Garcia-Herrera, R. (2011). The hot summer of 2010: redrawing the temperature record map of Europe. Science 332, 220–224. doi:10.1126/science.1201224
Chen, J., Brissette, F. P., Lucas-Picher, P., and Caya, D. (2017). Impacts of weighting climate models for hydro-meteorological climate change studies. J. Hydrology 549, 534–546. doi:10.1016/j.jhydrol.2017.04.025
Chen, W., Jiang, Z., and Li, L. (2011). Probabilistic projections of climate change over China under the SRES A1B scenario using 28 AOGCMs. J. Clim. 24, 4741–4756. doi:10.1175/2011jcli4102.1
Chen, X., Li, N., Huang, C., Liu, J., and Zhang, Z. (2020). Projection of heatwaves by the combined impact of humidity and temperature in China. Prog. Geogr. 39, 36–44. doi:10.18306/dlkxjz.2020.01.004
Christensen, J. H., Kjellström, E., Giorgi, F., Lenderink, G., and Rummukainen, M. (2010). Weight assignment in regional climate models. Clim. Res. 44, 179–194. doi:10.3354/cr00916
Dong, Z., Wang, L., Sun, Y., Hu, T., Limsakul, A., Singhruck, P., et al. (2021). Heatwaves in southeast Asia and their changes in a warmer world. Earth's Future 9, 1992. doi:10.1029/2021ef001992
Elvidge, S., Granados, S. R., Angling, M. J., Brown, M. K., Themens, D. R., and Wood, A. G. (2023). Multi-model ensembles for upper atmosphere models. Space Weather. 21, 3356. doi:10.1029/2022sw003356
Eyring, V., Bony, S., Meehl, G. A., Senior, C. A., Stevens, B., Stouffer, R. J., et al. (2016). Overview of the coupled model intercomparison project Phase 6 (CMIP6) experimental design and organization. Geosci. Model Dev. 9, 1937–1958. doi:10.5194/gmd-9-1937-2016
Guan, J., Yao, J., Li, M., Li, D., and Zheng, J. (2022). Historical changes and projected trends of extreme climate events in Xinjiang, China. Clim. Dyn. 59, 1753–1774. doi:10.1007/s00382-021-06067-2
Guo, X., Huang, J., Luo, Y., Zhao, Z., and Xu, Y. (2016). Projection of heat waves over China for eight different global warming targets using 12 CMIP5 models. Theor. Appl. Climatol. 128, 507–522. doi:10.1007/s00704-015-1718-1
Gutmann, E., Pruitt, T., Clark, M. P., Brekke, L., Arnold, J. R., Raff, D. A., et al. (2014). An intercomparison of statistical downscaling methods used for water resource assessments in the United States. Water Resour. Res. 50, 7167–7186. doi:10.1002/2014wr015559
Hirsch, A. L., Ridder, N. N., Perkins-Kirkpatrick, S. E., and Ukkola, A. (2021). CMIP6 MultiModel evaluation of present-day heatwave attributes. Geophys. Res. Lett. 48, 95161. doi:10.1029/2021gl095161
Hu, Z., Chen, X., Zhou, Q., Chen, D., and Li, J. (2019). DISO: a rethink of Taylor diagram. Int. J. Climatol. 39, 2825–2832. doi:10.1002/joc.5972
Huang, Z., Chen, H., and Tian, H. (2011). Research on the heat wave index. Meteorol. Mon. 37, 345–351.
IPCC (2021). “Summary for policymakers”. Available at: www.ipcc.ch/report/ar6/wg1/downloads/report/IPCC_AR6_WGI_SPM.pdf.
Joughin, I., Abdalati, W., and Fahnestock, M. (2004). Large fluctuations in speed on Greenland's Jakobshavn Isbrae glacier. Nature 432, 608–610. doi:10.1038/nature03130
Khan, N., Shahid, S., Ahmed, K., Wang, X., Ali, R., Ismail, T., et al. (2020). Selection of GCMs for the projection of spatial distribution of heat waves in Pakistan. Atmos. Res. 233, 104688. doi:10.1016/j.atmosres.2019.104688
Koteswara Rao, K., Lakshmi Kumar, T. V., Kulkarni, A., Chowdary, J. S., and Desamsetti, S. (2022). Characteristic changes in climate projections over Indus Basin using the bias corrected CMIP6 simulations. Clim. Dyn. 58, 3471–3495. doi:10.1007/s00382-021-06108-w
Li, Z., Guo, X., Yang, Y., Hong, Y., Wang, Z., and You, L. (2019). Heatwave trends and the population exposure over China in the 21st century as well as under 1.5 °C and 2.0 °C global warmer future scenarios. Sustainability 11, 3318. doi:10.3390/su11123318
Libonati, R., Geirinhas, J. L., Silva, P. S., Russo, A., Rodrigues, J. A., Belém, L. B. C., et al. (2022). Assessing the role of compound drought and heatwave events on unprecedented 2020 wildfires in the Pantanal. Environ. Res. Lett. 17, 015005. doi:10.1088/1748-9326/ac462e
Liu, J., Ren, Y., Tao, H., and Shalamzari, M. J. (2021a). Spatial and temporal variation characteristics of heatwaves in recent decades over China. Remote Sens. 13, 3824. doi:10.3390/rs13193824
Liu, L., Liu, P., Zhang, W., Si, W., and Qiao, X. (2021b). Variation characteristics of extreme warm events from 1961 to 2017 and projection for future scenarios in Xinjiang, China. Arid Zone Res. 38, 1590–1600. doi:10.13866/j.azr.2021.06.11
Mao, W., Chen, P., and Shen, Y. (2016). Characteristics and effects of the extreme maximum air temperature in the summer of 2015 in Xinjiang under global warming. J. Glaciol. Geocryol. 38, 291–304. doi:10.7522/j.issn.1000-0240.2016.0032
McEvoy, D., Ahmed, I., and Mullett, J. (2012). The impact of the 2009 heat wave on Melbourne's critical infrastructure. Local Environ. 17, 783–796. doi:10.1080/13549839.2012.678320
Mehr, A. D., and Kahya, E. (2017). Climate change impacts on catchment-scale extreme rainfall variability: case study of rize province, Turkey. J. Hydrologic Eng. 22, 1477. doi:10.1061/(asce)he.1943-5584.0001477
Murali, G., Iwamura, T., Meiri, S., and Roll, U. (2023). Future temperature extremes threaten land vertebrates. Nature 615, 461–467. doi:10.1038/s41586-022-05606-z
Parsons, L. A., Amrhein, D. E., Sanchez, S. C., Tardif, R., Brennan, M. K., and Hakim, G. J. (2021). Do multi-model ensembles improve reconstruction skill in paleoclimate data assimilation? Earth Space Sci. 8, 1467. doi:10.1029/2020ea001467
Plecha, S. M., and Soares, P. M. M. (2020). Global marine heatwave events using the new CMIP6 multi-model ensemble: from shortcomings in present climate to future projections. Environ. Res. Lett. 15, 124058. doi:10.1088/1748-9326/abc847
Schoetter, R., Cattiaux, J., and Douville, H. (2014). Changes of western European heat wave characteristics projected by the CMIP5 ensemble. Clim. Dyn. 45, 1601–1616. doi:10.1007/s00382-014-2434-8
Shao, D., Li, H., Wang, J., Hao, X., and Niu, L. (2023). Adaptability analysis of snow in the Zhangjiakou competition zone of the Beijing Olympic Winter Games for the next 30 years. J. Hydrology Regional Stud. 46, 101358. doi:10.1016/j.ejrh.2023.101358
Shi, N., Qiu, X., Cao, X., Mai, Z., Zhu, X., Li, N., et al. (2022). Molecular and serological surveillance of getah virus in the Xinjiang Uygur autonomous region, China, 2017-2020. Virol. Sin. 37, 229–237. doi:10.1016/j.virs.2022.02.004
Shi, Y., Shen, Y., Kang, E., Li, D., Ding, Y., Zhang, G., et al. (2006). Recent and future climate change in northwest China. Clim. Change 80, 379–393. doi:10.1007/s10584-006-9121-7
Smith, I., and Chandler, E. (2009). Refining rainfall projections for the Murray Darling Basin of south-east Australia—the effect of sampling model results based on performance. Clim. Change 102, 377–393. doi:10.1007/s10584-009-9757-1
Stouffer, R. J., Eyring, V., Meehl, G. A., Bony, S., Senior, C., Stevens, B., et al. (2017). CMIP5 scientific gaps and recommendations for CMIP6. Bull. Am. Meteorological Soc. 98, 95–105. doi:10.1175/bams-d-15-00013.1
Sun, Y., Zhang, X., Zwiers, F. W., Song, L., Wan, H., Hu, T., et al. (2014). Rapid increase in the risk of extreme summer heat in Eastern China. Nat. Clim. Change 4, 1082–1085. doi:10.1038/nclimate2410
Thrasher, B., Wang, W., Michaelis, A., Melton, F., Lee, T., and Nemani, R. (2022). NASA global daily downscaled projections, CMIP6. Sci. Data 9, 262. doi:10.1038/s41597-022-01393-4
Wang, Y., Luo, G., Zhao, S., Han, Q., Li, C., Fan, B., et al. (2014). Effects of arable land change on regional carbon balance in Xinjiang. Acta Geogr. Sin. 69, 110–120. doi:10.11821/dlxb201401011
Wei, J., Wang, W., Wang, G., Cao, M., Yang, L., Zhang, S., et al. (2023). Projecting the changes in multifaceted characteristics of heatwave events across China. Earth's Future. 11, 3387. doi:10.1029/2022ef003387
Wu, J., and Gao, X.-J. (2013). A gridded daily observation dataset over China region and comparison with the other datasets. Chin. J. Geophysics-Chinese Ed. 56, 1102–1111. doi:10.6038/cjg20130406
Xiao, J., Spicer, T., Jian, L., Yun, G. Y., Shao, C., Nairn, J., et al. (2017). Variation in population vulnerability to heat wave in western Australia. Front. Public Health 5, 64. doi:10.3389/fpubh.2017.00064
Xin, Y., Chen, H., Li, Y., Zhang, X., Lei, G., and Bo, L. (2008). Analysis on the spatiotemporal change and multi scale abrupt change of high temperature days in north Xinjiang. Arid Zone Res. 25, 438–446. doi:10.13866/j.azr.2008.03.009
Yang, Y., Jin, C., and Ali, S. (2020). Projection of heat wave in China under global warming targets of 1.5 °C and 2 °C by the ISIMIP models. Atmos. Res. 244, 105057. doi:10.1016/j.atmosres.2020.105057
Yazdandoost, F., Moradian, S., Izadi, A., and Aghakouchak, A. (2021). Evaluation of CMIP6 precipitation simulations across different climatic zones: uncertainty and model intercomparison. Atmos. Res. 250, 105369. doi:10.1016/j.atmosres.2020.105369
Yu, M., Li, Q., Hayes, M. J., Svoboda, M. D., and Heim, R. R. (2014). Are droughts becoming more frequent or severe in China based on the Standardized Precipitation Evapotranspiration Index: 1951-2010? Int. J. Climatol. 34, 545–558. doi:10.1002/joc.3701
Zampieri, M., Ceglar, A., Dentener, F., and Toreti, A. (2017). Wheat yield loss attributable to heat waves, drought and water excess at the global, national and subnational scales. Environ. Res. Lett. 12, 064008. doi:10.1088/1748-9326/aa723b
Zeng, Q., Man, X., Dai, Y., and Liu, H. (2022). Pseudomonas spp. enriched in endophytic community of healthy cotton plants inhibit cotton verticillium wilt. Front. Microbiol. 13, 906732. doi:10.3389/fmicb.2022.906732
Zhang, J., Luo, J., and Wang, R. (2021). Combined analysis of the spatiotemporal variations in snowmelt (ice) flood frequency in Xinjiang over 20 years and atmospheric circulation patterns. Arid Zone Res. 38, 339–350. doi:10.13866/j.zar.2021.02.05
Zhang, J., You, Q., Ren, G., and Ullah, S. (2023a). Substantial increase in human-perceived heatwaves in eastern China in a warmer future. Atmos. Res. 283, 106554. doi:10.1016/j.atmosres.2022.106554
Zhang, S., Pu, Z., and Li, J. (2013). The spatial-temporal variation of sunshine duration in Xinjiang during 1961-2010. Acta Geogr. Sin. 68, 1481–1492. doi:10.11821/dlxb201311004
Zhang, W., Jingli, X., and Yao, J. (2023b). The difference between new and old climate states and its influence on climate operation in Xinjiang. Desert Oasis Meteorology 17, 1. doi:10.12057/j.issn.1002-0799.2023.05.017
Zhang, X., Hua, L., and Jiang, D. (2022). Assessment of CMIP6 model performance for temperature and precipitation in Xinjiang, China. Atmos. Ocean. Sci. Lett. 15, 100128. doi:10.1016/j.aosl.2021.100128
Zhang, Y., Ge, Q., Jiang, F., and Zheng, J. (2016). Evolution characteristics of the extreme high and low temperature event in north Xinjiang in 1961 - 2010. Sci. Geogr. Sin. 36, 296–302. doi:10.13249/j.cnki.sgs.2016.02.017
Keywords: heatwave, projection, CMIP6, SSPs, Xinjiang
Citation: Dong D, Tao H, Zhang Z and Mondal SK (2024) Projected heatwaves in Xinjiang Uygur autonomous region, China. Front. Earth Sci. 12:1286012. doi: 10.3389/feart.2024.1286012
Received: 30 August 2023; Accepted: 15 January 2024;
Published: 08 February 2024.
Edited by:
Martin Stendel, Danish Meteorological Institute (DMI), DenmarkReviewed by:
Chao Gao, Ningbo University, ChinaCopyright © 2024 Dong, Tao, Zhang and Mondal. This is an open-access article distributed under the terms of the Creative Commons Attribution License (CC BY). The use, distribution or reproduction in other forums is permitted, provided the original author(s) and the copyright owner(s) are credited and that the original publication in this journal is cited, in accordance with accepted academic practice. No use, distribution or reproduction is permitted which does not comply with these terms.
*Correspondence: Hui Tao, dGFvaHVpQG1zLnhqYi5hYy5jbg==
Disclaimer: All claims expressed in this article are solely those of the authors and do not necessarily represent those of their affiliated organizations, or those of the publisher, the editors and the reviewers. Any product that may be evaluated in this article or claim that may be made by its manufacturer is not guaranteed or endorsed by the publisher.
Research integrity at Frontiers
Learn more about the work of our research integrity team to safeguard the quality of each article we publish.