 Bor-Shouh Huang1*
 Chin-Shang Ku1
 Chin-Jen Lin1
 Ya-Ju Hsu1
 Tien-Chi Liu2Jann-Yenq Liu2,3Yen-Ling Eileen Chen4Da-Yi Chen4Treng-Shi Huang5Juen-Shi Jiang4
- 1Academia Sinica Institute of Earth Sciences, Taipei, Taiwan
- 2Department of Space Science and Engineering, National Central University, Taoyuan, Taiwan
- 3Center for Astronautical Physics and Engineering, National Central University, Taoyuan, Taiwan
- 4Central Weather Administration Seismological Center, Taipei, Taiwan
- 5Central Weather Administration Weather Forecast Center, Taipei, Taiwan
On 15 January 2022, a massive underwater volcano erupted in the Tonga region, releasing a significant amount of volcanic ash and gases into the atmosphere. The United States Geological Survey (USGS) estimated the seismic source to have a surface wave magnitude (Ms) of 5.8. This eruption was observed from space, and the resulting atmospheric shockwave swept across the Pacific Ocean. Reports from various locations worldwide indicated rapid fluctuations in air pressure following this event. Taiwan, situated in the western Pacific, approximately 8,500 km from the eruption source, observed significant changes. During this volcanic eruption, both rapid air pressure changes and several significant changes in the Earth’s physical parameters were observed in Taiwan. The Tonga eruption is a unique event, and comprehensive observations provide an opportunity to explore and explain the mechanisms behind this extreme event. Data from ground surface air pressure gauges, coastal tide gauges, underwater pressure gauges, infrasound sensors, digital microphones, and seismometers were collected. These data were analyzed to identify their origin and explain their interactions. The results of this study first present the detailed propagation characteristics of air pressure waves in the Taiwan region and verify the occurrence of a specific tsunami phenomenon caused by the atmospheric disturbance from the Tonga eruption. It follows a distinct mechanism, explaining its arrival time and wave height distribution around Taiwan, which is different from conventional tsunamis of tectonic origins, which are formed by rapid changes in water caused by earthquakes or underwater landslides.
1 Introduction
On 15 January 2022, a large underwater violent volcano erupted in Tonga that sent volcanic ash and gases more than 57 km into the atmosphere (https://www.usgs.gov/centers/pcmsc/news/depth-surprising-tsunamis-caused-explosive-eruption-tonga). The United States Geological Survey (USGS) estimated the eruption to have a surface wave magnitude of 5.8 (https://earthquake.usgs.gov). The eruption, which was well captured from space, sent atmospheric shock waves rippling across the Pacific Ocean. For example, the Himawari B08 and the NOAA’s GOES-West satellite images show the wave disturbed characteristics of the atmosphere, like air temperature and water vapor, as it traveled at a speed near 0.31 km/sec (Liu et al., 2022). The eruption was reported to be heard more than 2,000 km away in New Zealand and 9,700 km away in Alaska (Berman, 2022). Satellites captured a very wide eruption column and shock waves propagating across the Pacific Ocean. The eruption was reported to induce tsunamis in Tonga (waves up to 15 m), Fiji, Samoa, Vanuatu, and along the Pacific Rim, with damaging tsunamis in New Zealand, Japan, the United States, Chile, and Peru (Kubota et al., 2022).
Many places reported perturbations in local pressure following this event. A pressure wavefront was measured by weather stations around the world with several hPa variations across observation sites (Burt, 2022). This phenomenon is explained as the atmospheric shock wave in the form of Rayleigh–Lamb waves emanating from the volcanic island, radiating outward at close to the speed of sound (Viktorov, 1967). The sound heard in New Zealand and Alaska was the generated sonic boom that traveled a long distance. The traveling waves have also been reported to reach into the ionosphere (Zhang et al., 2022). The violent Earth near-surface explosion was expected to send many types of waves through Earth’s atmosphere: infrasound waves, Lamb waves, acoustic-gravity waves, and tsunamis across the Pacific Ocean (Kong et al., 2022; Kubota et al., 2022). The multiple Earth responses and interactive mechanisms from each observed specific phenomenon need to be explored in greater detail to integrate the global measurements and interpret the different observed aspects of this event.
The island of Taiwan is located in the western Pacific at a distance of approximately 8,500 km from the explosion source (Figure 1). It represents a very young arc-continental margin collision zone (Wu, 1978). Large earthquakes reveal the nature of the intense, ongoing intra-plate deformation. The tectonic evolution constructed a large variation in island topography and nearby bathymetry. A similarly complex continental-ocean interactive atmosphere environment of the western Pacific makes Taiwan an area prone to various natural disasters. In order to explore, monitor, assess, and mitigate these disasters, Taiwan has strategically placed various instruments on its neighboring islands and ocean bottoms to monitor regional weather, earthquakes, and tsunamis with high spatial density. These sensors help track significant atmospheric, hydrospheric, and solid Earth changes. During this volcano eruption, the fast variation in the Earth’s system was well-monitored, and recorded data were provided to investigate a detailed regional response to this unique event. The observations from Taiwan’s dense array contribute to the global dataset and provide a means to analyze the detailed response to this eruption across Taiwan.
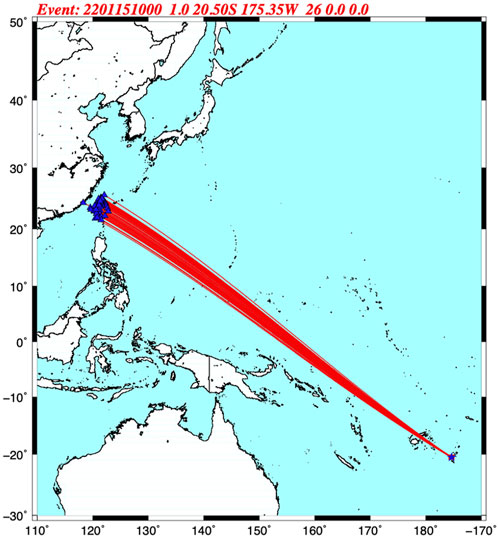
Figure 1. Map to show the great circle paths (red lines) of the atmospheric shock wave that traveled across the Pacific Ocean from the Tonga eruption source (blue start symbol) to receivers (red triangle symbols) located in the Taiwan region.
In this study, we report various instrument records and analyses by an array of techniques to document individual observed phenomena and interpret the interaction of the Earth's responses to this event. The results of this study first present the detailed propagation characteristics of rapid air pressure changes in the Taiwan region and verify the occurrence of a specific tsunami phenomenon caused by the atmospheric disturbance from the Tonga eruption. This tsunami follows a distinct mechanism, explaining its arrival time and amplitude distribution around Taiwan, which is different from conventional tsunamis of tectonic origins formed by rapid changes in water caused by earthquakes or underwater landslides.
2 Observations of the 2022 Tonga eruptions in Taiwan
Multidisciplinary instruments have been installed on Taiwan to monitor and assess natural hazards and provide early warnings of the Earth’s responses. Although the Tonga volcano eruption is not a regular monitoring target of those sensors, it was nevertheless well-recorded by many of them. In this study, we have retrieved the data from air pressure gauges, coastal tidal gauges, ocean bottom hydro-pressure gauges, infrasound sensors, digital microphones, and seismometers. Observations span responses and interactions of the air, water and ground. Individual recordings are described in the following sections.
2.1 Air pressure changes
In Taiwan, to offer accurate weather conditions and predictions, the Central Weather Bureau (CWB), renamed the Central Weather Administration (CWA) in September 2023, set up 580 surface weather stations equipped with pressure gauges that transmit automatically. To resolve the air pressure change in this Tonga event, we collected the ground surface air pressure data from the climate database of the CWB in Taiwan with a sample rate of 1 min or 10 min (Figure 2). Other limited high sampling rate air pressure data (100 samples per second) were collected from the Broadband Array in Taiwan for Seismology (BATS) network (https://bats.earth.sinica.edu.tw/), which is co-sited with broadband seismic stations. Both the high sampling rate barometers and the infrasound sensors of BATS were originally designed to record seismo-acoustic signals and link to ground motion and earthquake sound studies. The collected infrasound records in Taiwan from the Tonga volcano eruption are displayed in Figure 3.
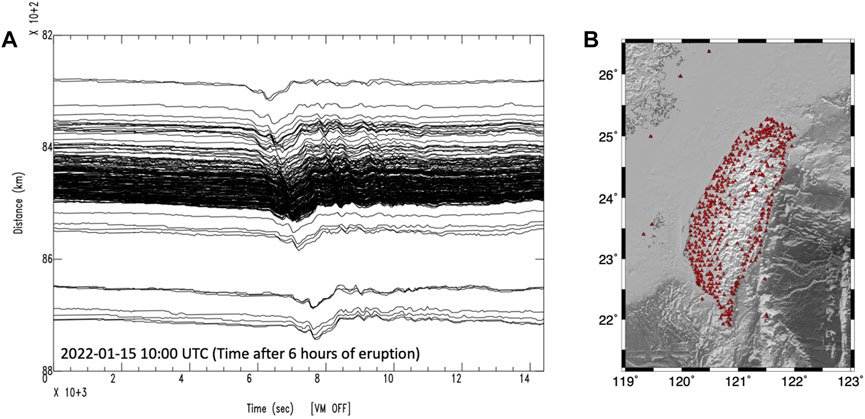
Figure 2. (A) Record section of air pressure waveforms for the Tonga eruption (Figure 1) recorded by the CWB weather stations in Taiwan and surrounding islands with a sampling rate of 1 min or 10 min. (B) Location map of the CWB weather stations (red triangles). The starting time of the recording section is noted in the lower left corner of this panel and is the same as others in this article.
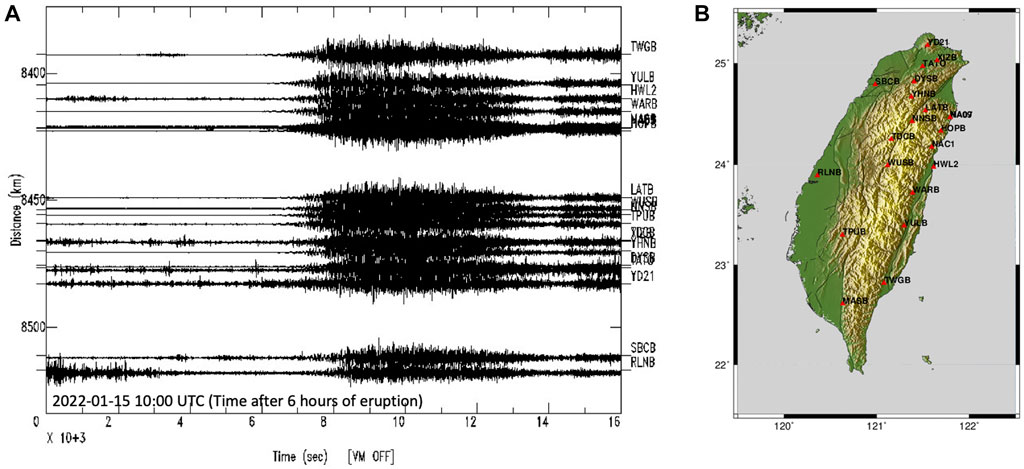
Figure 3. (A) Section of air pressure waveforms for the Tonga eruption source recorded by the infrasound sensors of the BATS seismic network. (B) Location map of infrasound sensors (red triangles with four-character station codes).
2.2 Sea surface height and bottom pressure changes
The sea surface variation is usually obtained by both the tidal gauges on the coast and pressure gauges on the ocean bottom. The tidal gauge data used in this study were obtained from the tsunami monitoring stations of CWB and are depicted in Figure 4. The recording sampling rate for each tidal gauge is 6 min. The stations of Figure 4A are grouped on the eastern and southwestern coasts of Taiwan. The collected tidal gauge data with high signal-to-noise ratios (SNRs) are displayed in Figure 4B. Stations located on the western coast (Figure 4C) recorded low SNR tsunami waveforms (Figure 4D). In Taiwan, a cable-based ocean bottom seismometer (OBS) network, named the Marine Cable Hosted Observatory (MACHO), was constructed and began operation at the end of 2011 (https://gdms.cwa.gov.tw/network_cwasn.php). The offshore monitoring system improved the locating capability for offshore earthquakes and tsunamis monitored off north-eastern Taiwan. The update system of this offshore observatory is an inline cable-based, ocean-bottom system that includes a broadband seismometer, two strong-motion sensors, and a pressure gauge. Tonga volcano eruption data from each cable OBS (Figure 5) have been examined. The data showed significant tsunami signals recorded in pressure gauges and limited resolved signals from both velocity and acceleration seismometers.
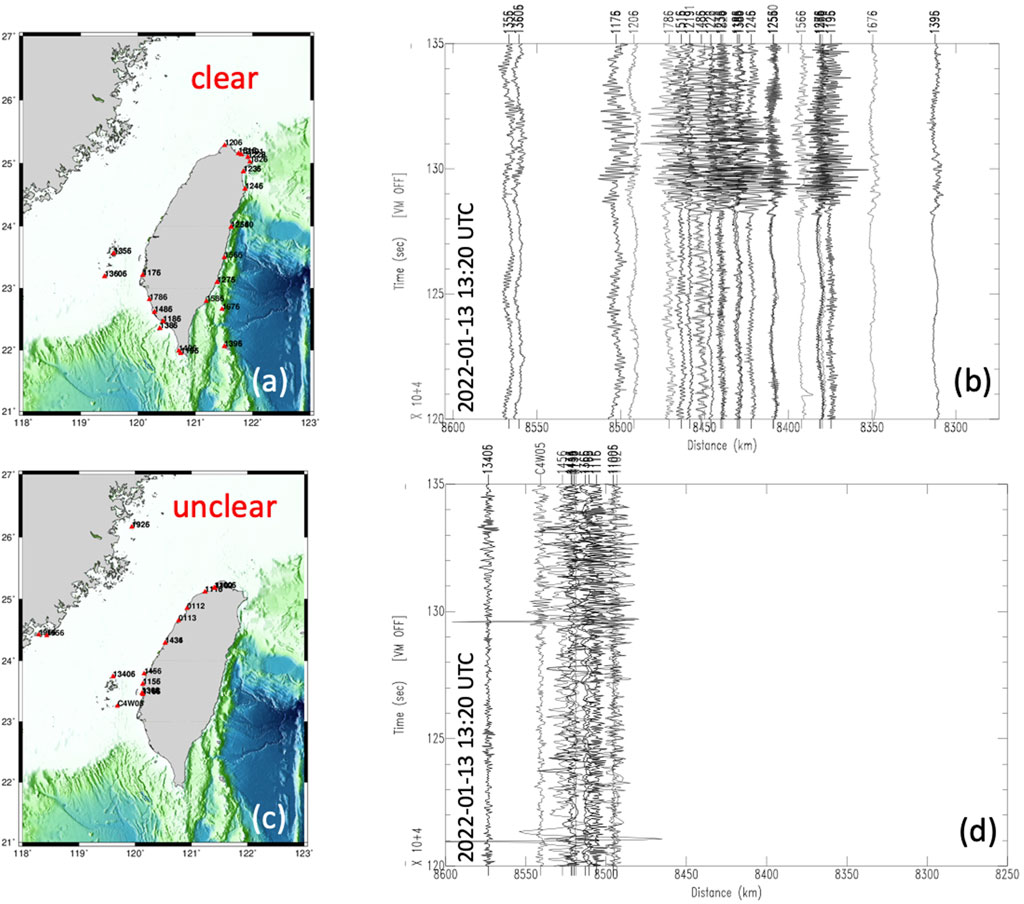
Figure 4. (A) Location map of the CWB tidal gauge stations (red triangles with station codes) that recorded clear (high SNR) tsunami waveforms of the Tonga eruption. (B) Sections of tsunami waveforms from stations with clear signals. (C) Location map of the CWB tidal gauge stations that recorded unclear (low SNR) tsunami waveforms of the Tonga eruption. (D) Sections of tsunami waveforms from stations with unclear signals.
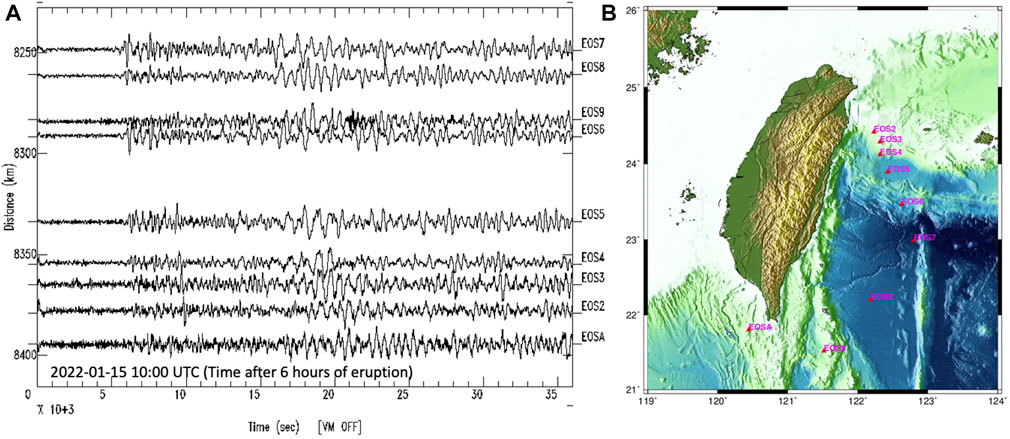
Figure 5. (A) Sections of pressure gauge waveforms for the Tonga eruption source recorded by the OBS pressure gauge sensors of the CWB-OBS network. (B) Location map of recorded pressure gauge stations (red triangles with station codes).
2.3 Air-to-ground coupled waves
Because of the strong coupling between the atmosphere and the ground, the global broadband seismic stations have clearly recorded the energy of the Tonga eruption (Matoza et al., 2022) as they did in Taiwan (Shih et al., 2023). In this study, we collected all available seismo-acoustic observations from broadband stations in the Taiwan region. Most came from the BATS. These 28 network-equipped permanent broadband stations are designed to cover a variety of research demands. All permanent stations are equipped with state-of-the-art very-broadband and strong-motion sensors and 24/26-bit digital recorders. Other collected broadband seismic data came from the Formosa array with high spatial density located in northern Taiwan (Lin et al., 2021) and the Central Weather Bureau Seismic Network (CWBSN), which were designed for earthquake early warning, monitoring, and seismic hazards mitigation with stations covering the entire Taiwan island and its surrounding islands (https://gdms.cwa.gov.tw). The characteristics of recorded data are long-period signals with large amplitude in the E-W component (Figure 6A). All selected broadband stations (Figure 6B) are capable of internet connection for immediate retrieval of real-time data and continuous recordings.
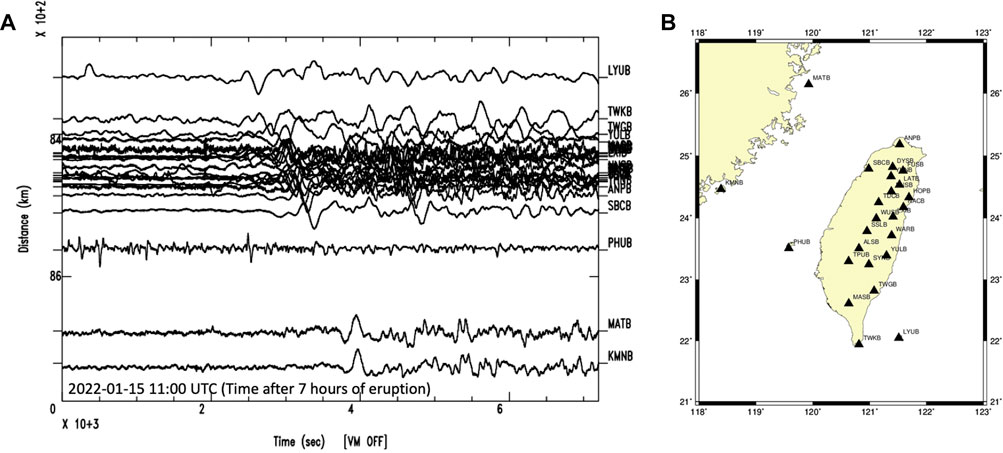
Figure 6. (A) Sections of E-W component seismograms for the Tonga eruption source recorded by the BATS broadband seismic network. (B) Location map of recorded stations (black triangles). All selected stations were equipped with BATS Trillium 240 or Trillium120 seismometers with the same design and similar instrument responses.
2.4 Explosion sound waves
In the Hualien area in eastern Taiwan, there were reports of people hearing earthquake sounds before the earthquakes occurred (Chang et al., 1991). A high-precision digital microphone was installed at the CWB Hualien meteorological station in 2021. It operates as a continuous recording mode to passively detect earthquake sounds. This instrument has been operating continuously up to the present. The Tonga eruption was reported to be heard more than 2,000 km away in New Zealand; booms were also heard in the Yukon in Canada, and a series of bangs were heard around Anchorage, Alaska, approximately 9,700 km away from the volcano (Berman, 2022). The distance between Taiwan and the epicenter of the Tonga eruption is approximately 8,500 km, similar to the distances from the above locations. During the eruption period, the digital microphone in the CWB Hualien station operated well, and any available signals were recorded by this device. Other observatory instruments co-located with this device include infrasound recorders and air pressure gauges. Tide gauges and broadband seismometers can be found in some nearby stations. The digital microphone observation data from the Hualien station may provide information for investigating whether explosion sounds were specifically heard in the Taiwan region. The waveforms recorded by the digital microphone and infrasound sensor at the same site are plotted in Figure 7. However, the waveforms do not have sufficient resolution to support the detection of similar eruption sounds in Taiwan.
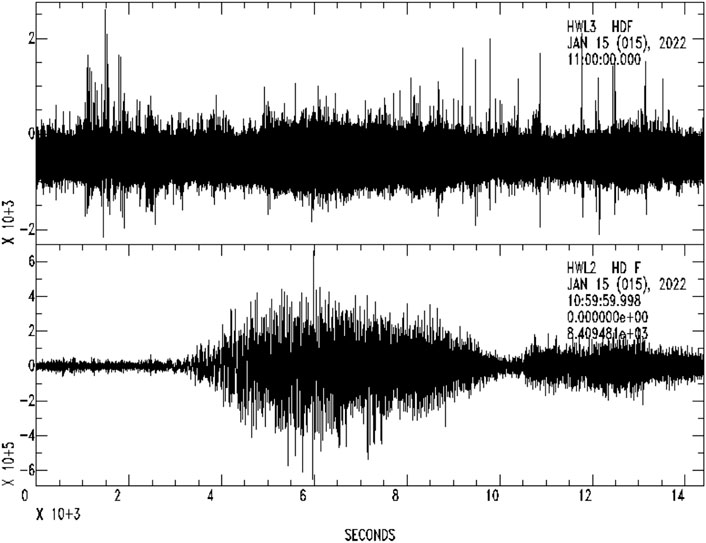
Figure 7. Digital microphone (upper) and infrasound sensor (lower) waveforms commonly recorded at the CWB Hualien weather station (shown as HWL2 in Figure 3) of the 2022 Tonga eruption. The recordings begin at 2022-01-15 11:00 UTC (7 h after eruption). The vertical axis is normalized to the maximum digital counts, and no corrections have been made to the instrument responses. These are similar to the other record plots reported in this article.
3 Analyses and results
3.1 Atmospheric pressure waves
In this study, we first report the propagation of the Tonga eruption shock wave across Taiwan island in terms of a set of two-dimensional (2-D) snapshots (Figure 8) from 19:00 to 20:50 Taipei time zone (UT+8), 15 January 2022. The ground surface air pressure variabilities in Taiwan during the Tonga eruption were well-monitored and recorded by the densely distributed detectors of the CWB pressure gauges (Figure 2B). The wave characteristics were calculated using a sequence of the instantaneous maps of air pressure at each observation site, as shown in Figure 2A. The air pressure has been defined by a color bar to present its spatial variation. In general, we could identify a dominant air pressure variation propagating Taiwan from the SE to the NW direction with an amplitude greater than 3 hPa, following a small rippling. The accurate incident angle and apparent velocity of this passing air pressure wave are identified by the time-domain beamforming method (Rost and Thomas, 2002), an array process method used for seismic waveform analysis. The determined input azimuth and speed of the crossing wave train are 126° from the North and 0.30 km/sec, respectively. Its values are quite stable during this observation period (Figure 9). The horizontal propagation speed represents the air sound speed of the ground surface. It is consistent with the report of the atmospheric pressure shock wave (or the Rayleigh–Lamb wave) characteristics from the eruption source region that traveled all over the globe (Kubota et al., 2022).
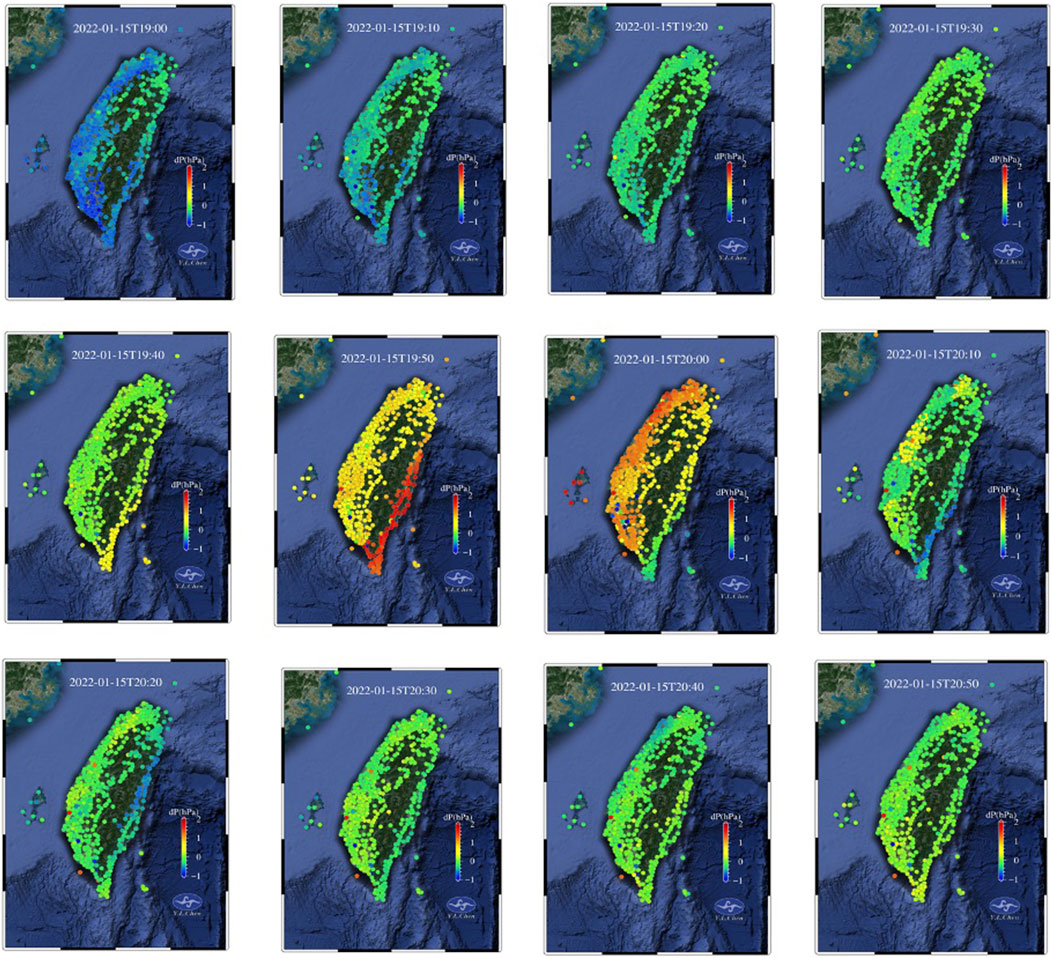
Figure 8. Air pressure change snapshots at different propagation times at 10-min intervals from 19:00 to 20:50 Taipei time zone (UT+8), 15 January 2022. The color bars (from −1 hPa to 2 hPa) present the relative spatial variation in air pressure on recorded stations (circle symbols).
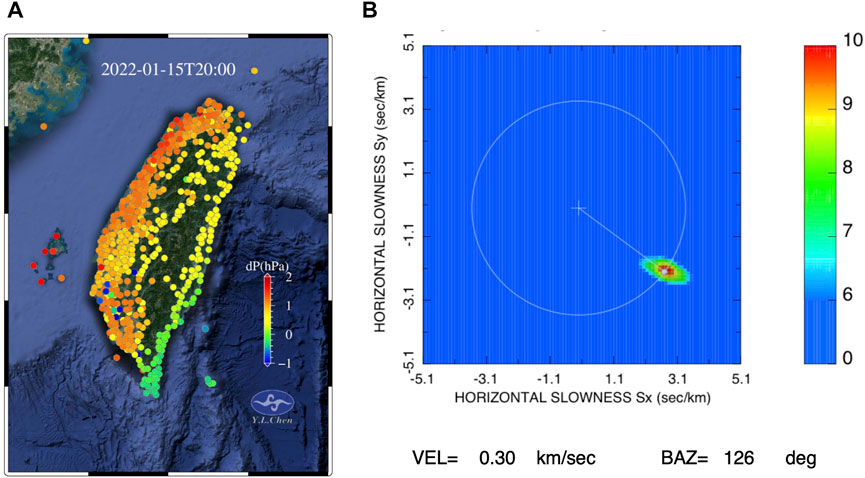
Figure 9. (A) Snapshot of the selected time window for the beamforming analysis. (B) The plot shows the beam power normalized to its maximum value as a function of slowness (EW and NS) for the selected array time traces covered during the time window of (A). The maximum energy is indicated by the white solid symbol with an apparent velocity of 0.3 km/sec. The determined back azimuth for the source–receiver combination is 126° in the direction of the map center and maximum energy.
During this eruption period, an additional 20 infrasound instruments belonging to the BATS seismic network in the Taiwan region recorded this event (Figure 3). Figure 10 displays recorded data from the WARB seismic station located in eastern Taiwan. The same figure presents data from a co-located barometer. Both instruments record parameters related to changes in the Earth's surface air pressure, with the infrasound instrument designed to focus on high-frequency variations in environmental pressure, featuring a high sampling rate (100 samples per second by BATS). Figure 10 shows that the observed atmospheric pressure variations exhibit significant frequency dispersion, with the low-frequency portions propagating at a faster speed (barometer channel) and presenting the characteristic of a guide wave (Viktorov, 1967). However, atmospheric research mainly concentrates on investigating the physical phenomena of slow pressure changes in the atmosphere, typically utilizing a low sampling rate (sampling rates of 1 min or 10 min). As a result, conventional barometer records are unable to resolve features of rapid atmospheric pressure variations. By incorporating simultaneous observations from the infrasound sensor and the barometer, combined monitoring can effectively expand the frequency range of Earth’s system for observing environmental pressure changes. This presents a potential and significant application value for exploring unknown responses of the Earth’s system in the future.
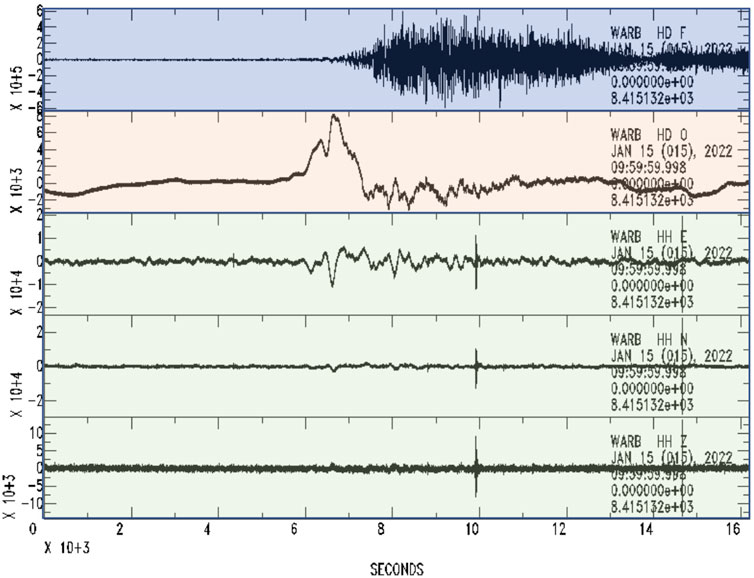
Figure 10. Comparison of the co-site records of infrasound (first), barometer (second), and the E-W, N-S and vertical component waveforms of the broadband seismometer at the WARB station of the BATS seismic network (Figure 6). The recordings begin at 2022-01-15 10:00 UTC (6 h after eruption).
3.2 Tsunami
The Tonga eruption, which caused significant atmospheric pressure changes on land, also resulted in variations in sea surface height (Figure 4) and underwater pressure along eastern Taiwan (Figure 5). In this study, three tidal gauge stations located in Hualien Harbor in eastern Taiwan were selected for comparison with the atmospheric pressure record from the nearby Hualien Meteorological Station (HWL2 in Figure 3) (Figure 11). The comparison reveals that the passing wave that caused notable atmospheric pressure changes also produced similar variations in the sea surface height over time. Both exhibit variations with a simple pulse and long-period feature. The fast water level fluctuations were previously reported from the origin of the Rayleigh–Lamb wave excited by this event (Kubota et al., 2022). However, the records from the tidal gauge are relatively complex, showing sustained high-frequency oscillations approximately 2 h after the initial wave arrival (as shown in Figures 4, 11). Based on the computation prediction of shallow water wave equations, the later arrivals are consistent with the arrival time of the conventional tsunami wave propagation over the Pacific region (https://www.usgs.gov/media/images/predicted-travel-times-classic-tsunami-waves-triggered-eruption-hunga-tonga-hunga) and the same as were reported to arrive Taiwan (https://news.ltn.com.tw/news/life/breakingnews/3802642).
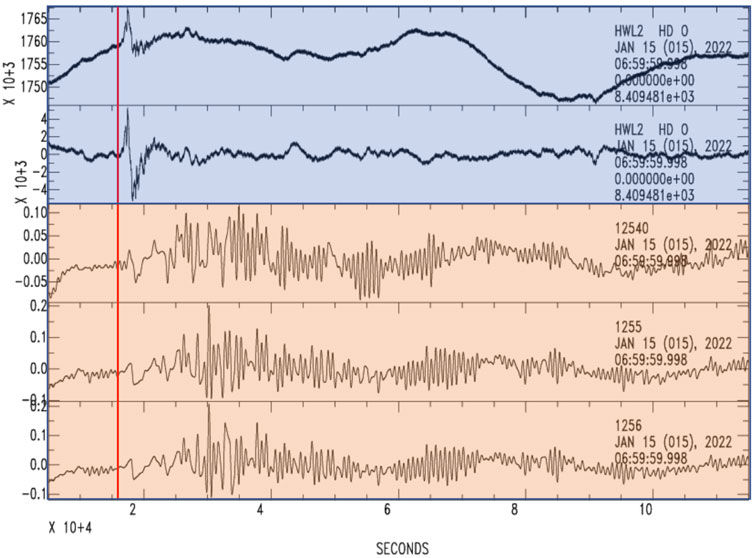
Figure 11. Comparison of the barometer waveforms recorded (original and filtered waveforms are listed in the first and second traces) at the CWB Hualien weather station (HWL2 in Figure 3) and three tidal gauge records at its nearby Hualien Harbor. The vertical red line indicates the identified time of the first arrival of air pressure changes from the eruption source. The recordings begin at 2022-01-15 07:00 UTC (3 h after eruption).
In this study, data from OBS pressure sensors (Figure 5) were integrated with subset data from atmospheric pressure sensors at stations surrounding the coastline of Taiwan. These data were used to create a time-distance record section from the eruption source of Tonga volcano to observed stations in Taiwan (Figure 12). The processed results indicate that both underwater pressure gauges and atmospheric pressure barometers recorded the same perturbation from the distant volcanic eruptions. Additionally, as shown in Figure 5, all OBS pressure sensors also recorded the later-arriving conventional tsunamis.
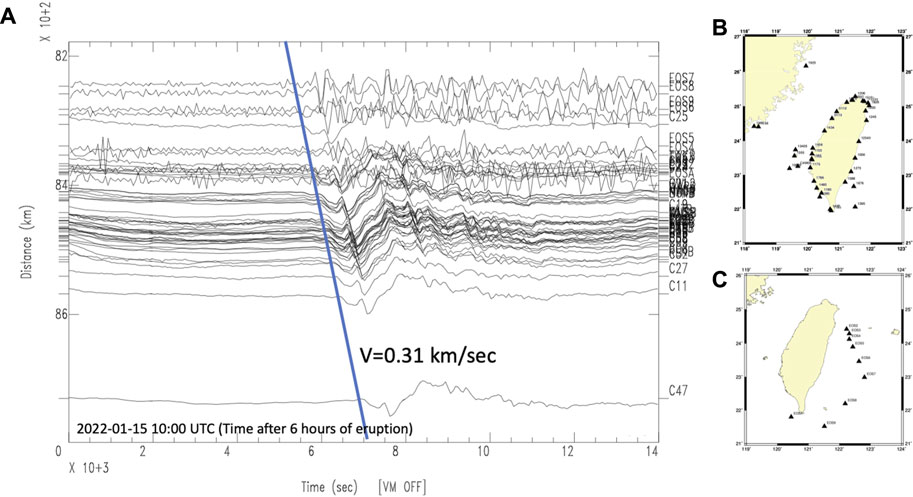
Figure 12. (A) Combined record section of the seafloor pressure gauge and ground surface air pressure waveforms from the Tonga eruption recorded by the CWB OBS and weather networks. The blue line indicates an apparent velocity of 0.31 km/s. (B) Location map of selected CWB weather stations and (C) OBS stations (black triangles).
3.3 Ground response
In this study, BATS broadband seismic data were selected to compare the infrasound sensor and barometer responses to the Tonga eruption at various seismic stations. The consistent response observed at the BATS broadband seismic stations was significant oscillation in the east-west component (Figures 10, 13B). However, further examination of the responses of different types of seismometers revealed that different seismometer models responded very differently to similar air pressure changes. Figure 13 illustrates observation data from two different types of seismic stations: the HWLB seismic station equipped with a low-sensitivity seismometer (VSE-355G3) and the MASB seismic station equipped with a high-sensitivity seismometer (Streckeisen STS-1). Both seismic stations are equipped with the same accuracy infrasound instruments and air pressure gauges. Figure 13 shows that the infrasound and pressure variations recorded at both seismic stations are generally consistent, indicating minimal differences in the input air pressure wave across the two stations. However, the three-component seismograms recorded by the VSE-355G3 significantly differ from those of the STS-1. The underlying mechanism for this discrepancy will be discussed in the following section.
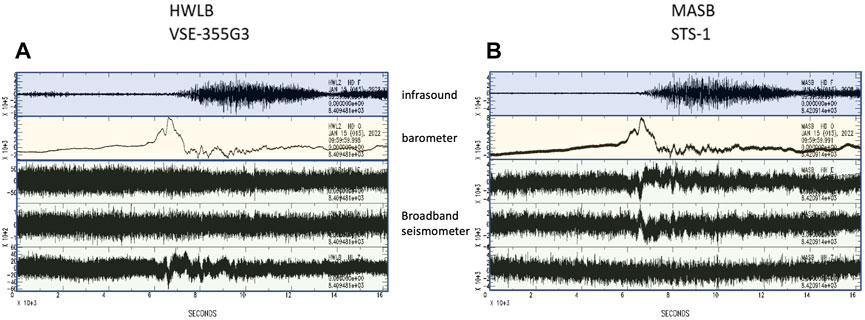
Figure 13. Comparison of the co-site records (infrasound, barometer, and broadband seismometer) at the HWLB (A) and MASB (B) stations of the BATS seismic network (Figure 3). Both stations are equipped with the same type of infrasound instruments and air pressure gauges. The HWLB station is equipped with a low-sensitivity seismometer (VSE-355G3), and the MASB station is equipped with a high-sensitivity seismometer (STS-1). The recordings begin at 2022-01-15 10:00 UTC (6 h after eruption). The trace list order is the same as in Figure 10.
4 Discussion
Taiwan has deployed various instruments with high spatial density to monitor regional weather, typhoon, earthquakes, tsunamis, and long-term environmental changes. On 15 January 2022, we observed the atmospheric pressure disturbances and tsunamis across Taiwan Island and its surrounding regions in response to the Tonga volcanic eruption. This Tonga eruption was a unique event that was commonly and simultaneously recorded by those sensors and well-reported in real time. Significant changes in Earth’s systems were individually monitored within the domains of the atmosphere, hydrosphere, and solid Earth. The observations from Taiwan contribute to the dataset to verify the global air pressure and tsunami disturbances across Taiwan and also provide an antenna to examine the detailed response of this giant eruption in the Taiwan region. Comprehensive observations confirm that atmospheric pressure disturbances propagate at a speed close to the Earth’s surface air sound speed (0.3 km/sec), entering Taiwan from the southeast at an azimuth of 126° (Figures 8, 9) and presenting a dispersion feature (Figure 10). Beamforming analysis indicates a stable propagation direction and apparent speed for the entire wave train.
Additionally, significant sea surface height variations (or tsunamis) were observed during this event, as shown in Figures 4, 5. Traditionally, tsunamis are thought to originate from underwater seismic source dislocations or landslides causing vast seawater variations, with their propagation speed governed by the shallow water wave equation, typically lower than the speed of sound. Conventional sea surface heights are usually detected using tide gauges or seafloor pressure gauges. The sea surface variations caused by this mechanism are often minimally correlated with atmospheric pressure changes. However, in the case of the Tonga volcano eruption event, the initial times of tide gauge and barometer signals along the coast of Taiwan show significant consistency (as shown in the example in Figure 11), indicating that the variations in sea level (tsunami signals) were synchronized with surface atmospheric pressure changes. Comparing the sea level change signals during the Tonga volcano eruption event recorded by seafloor pressure gauges and the coastal tidal gauges (Figure 12), it is evident that the initial tsunami wave propagated at the speed of sound. Given the unique tsunami propagation phenomena jointly presented by various observational data collected in this study, a novel mechanism is needed to explain the origin of the tsunami. This study suggests that the hypothesis of Rayleigh–Lamb waves generated by the eruption of gases into the atmosphere following the Tonga underwater volcanic eruption, which propagated globally (Kubota et al., 2022; Matoza et al., 2022), aligns with the observed atmospheric pressure disturbances in Taiwan (Figures 8, 9). The analyses of sea surface variations obtained from tide gauges and seafloor pressure gauges are indirectly indicative of the existence of this new form of tsunami wave, which is likely generated by the Rayleigh–Lamb waves. Furthermore, a detailed examination of atmospheric pressure changes in the Taiwan region (Figure 8) shows that although the wavefront of the Rayleigh–Lamb waves is uniform in the eastern part of Taiwan (snapshot, T=19:50), its amplitudes exhibit spatial variation in the western and southwestern regions of Taiwan after passing through (snapshots, T=20:00, T=20:10). This characteristic is observed in a similar variation pattern when observing the tsunami signals (a high signal-to-noise ratio in the eastern and southern coasts and a low signal-to-noise ratio in the western coast of Taiwan) (Figure 4). This phenomenon may indicate that the propagation of Rayleigh–Lamb waves is influenced by the topography of the central mountain range of Taiwan (a wide mountain range located at the island’s center with the highest elevation of approximately 4,000 m), simultaneously suggesting that this tsunami propagation is not controlled by the depth of the seawater. However, further in-depth simulation and analysis are required to verify this phenomenon conclusively.
In the past, seismologists were familiar with atmospheric sources of seismic waves mainly originating from high-frequency acoustic waves produced by nuclear explosions, chemical explosions, sonic booms from meteorites, or man-made aircraft, as well as infrasound waves emitted by volcanic eruptions (Kanamori et al., 1991; Qamar, A., 1995; Pilger et al., 2021; Watson et al., 2022). When they reach the Earth’s surface and impact the ground, these atmospheric acoustic waves generate various types of seismic waves (body and surface waves) that propagate along the ground. Alternatively, atmospheric acoustic waves can interact directly with the Earth’s surface near seismometers, resulting in ground vibrations recorded by the seismometers (Edwards et al., 2008). Broadband seismometers have been designed to isolate changes in atmospheric pressure to eliminate baseline drifts caused by long-period pressure variations. For seismic observations, other types of atmospheric pressure changes are generally considered minor, and their impact on seismometers is typically ignored due to an airtight housing (https://doi.org/10.2312/GFZ.NMSOP-2_ch5). However, the high-intensity, transient atmospheric pressure changes generated by the 2022 eruption of the Tonga volcano, a phenomenon rarely observed and reported in seismic observations, posed extreme conditions. Under such conditions, the inadequate airtightness of the seismometer or deformation of the casing may lead to changes in the measurements of the sensor, translating into non-real seismic signals recorded by the seismometer, especially in the case of long-period signals (Alejandro et al., 2020). Analyses of this study indicate that such huge variation affects three-component seismometer waveforms within different types of seismometers (Figure 13) in different ways. The VSE-355G3 (HWLB) sensors respond to the vertical components, and the STS-1 sensors (MASB) respond to two horizontal components. The recordings from the seismometers could represent either genuine ground motion caused by atmospheric pressure changes or merely the direct influence of atmospheric pressure changes on seismometer sensors, meaning that the recorded waveforms might not necessarily be related to actual ground motion but rather represent the seismometer’s instantaneous response. After a detailed examination of the seismometer (VSE-355G3) of station HWLB, we speculate the vertical mass experienced a variable buoyancy due to the weak airtightness of the sensor during huge air pressure changes. The STS-1 sensors of station MASB have a perfect glass-bell design to isolate air pressure change; however, their casings and bases could be affected by the huge transient atmospheric pressure change. This physical deformation translates as ground tilt recorded by seismometer horizontal components. The phenomena revealed in this study and the non-realistic ground motion signals shown by seismometers have been previously discussed (Beauduin et al., 1996; Alejandro et al., 2020). This highlights elements that should be seriously considered in future seismic observations under extreme conditions (such as observing earthquakes on other planets).
In Taiwan, both meteorological and seismic observation networks provide ground surface atmospheric pressure data and serve different research purposes. The meteorological network offers data with high spatial resolution, while the seismic network provides a small amount of high temporal sampling rate data and infrasound observations, extending the high-frequency information on atmospheric pressure changes. To analyze this Tonga eruption event, this study collected and analyzed a variety of observational data, marking the first integration of atmospheric, oceanic, and solid Earth observational data in Taiwan for an interdisciplinary research objective. Experience suggests that there is room for improvement in data recording methods and increased data sampling rates in the pursuit of unexplored territory. The collected data both facilitates in-depth analysis and interpretation in different fields and provides opportunities for interdisciplinary research, broadening the scope of study and fostering the emergence and growth of new fields.
5 Conclusion
We collected a variety of observations in Taiwan, marking one of the initial integrated studies of recorded data from the atmosphere, ocean, and solid Earth to study the unique 2022 Tonga volcano eruption. Based on dense array observations, we present the propagation characteristics of the induced air pressure changes across Taiwan and verify the occurrence of a specific tsunami phenomenon caused by the atmospheric disturbance from this eruption. We suggest that the hypothesis of Rayleigh–Lamb waves generated by the dispersal of gases into the atmosphere following the Tonga underwater volcanic eruption (Kubota et al., 2022; Matoza et al., 2022) presents a distinct mechanism to explain Taiwan observations. However, the observed lateral variations in air pressure and tsunami wave height around Taiwan need to be explored further.
Data availability statement
The original contributions presented in the study are included in the article/supplementary material; further inquiries can be directed to the corresponding author.
Author contributions
B-SH: conceptualization, formal analysis, writing–original draft, writing–review and editing, data curation, and investigation. C-SK: data curation, formal analysis, software, and writing–review and editing. C-JL: conceptualization, data curation, and writing–review and editing. Y-JH: data curation and writing–review and editing. T-CL: data curation and writing–review and editing. J-YL: conceptualization, data curation, investigation, writing–review and editing, and methodology. Y-LC: data curation, visualization, and writing–review and editing. D-YC: data curation and writing–review and editing. T-SH: data curation, writing–review and editing, and visualization. J-SJ: data curation and writing–review and editing.
Funding
The author(s) declare financial support was received for the research, authorship, and/or publication of this article. This study was supported by Academia Sinica, under grant AS-TP-110-M02; the Central Weather Administration, under grant MOTC-CWB-112-E-02; and the National Science and Technology Council, Taiwan, under grant NSTC 111-2116-M-001-011.
Acknowledgments
The authors wish to express their appreciation to the Central Weather Administration and Academia Sinica for providing data used in this study.
Conflict of interest
The authors declare that the research was conducted in the absence of any commercial or financial relationships that could be construed as a potential conflict of interest.
Publisher’s note
All claims expressed in this article are solely those of the authors and do not necessarily represent those of their affiliated organizations, or those of the publisher, the editors, and the reviewers. Any product that may be evaluated in this article, or claim that may be made by its manufacturer, is not guaranteed or endorsed by the publisher.
References
Alejandro, A. C. B., Ringler, A. T., Wilson, D. C., Anthony, R. E., and Moore, S. V. (2020). Towards understanding relationships between atmospheric pressure variations and long-period horizontal seismic data: a case study. Geophys. J. Int. 223, 676–691. doi:10.1093/gji/ggaa340
Beauduin, R., Lognonne, P., Montagner, J. P., Cacho, S., Karczewski, J. F., and Morand, M. (1996). The effects of the atmospheric pressure changes on seismic signals or how to improve the quality of a station. Bull. Seism. Soc. Am. 86 (6), 1760–1769. doi:10.1785/bssa0860061760
Berman, A. (2022). Volcano eruption near Tonga causes booms heard by Alaskans nearly 6000 miles away. Anchorage, Alaska: Anchorage Daily News. (January 16, 2022).
Burt, S., 2022, Multiple airwaves crossing Britain and Ireland following the eruption of Hunga Tonga-Hunga Ha’apai on 15 January 2022. Weather77. doi:10.1002/wea.4182(March2022)
Chang, Y.-C., Wang, C., and Wen, K. L. (1991). Earthquake sounds from aftershocks following the 1986 May 20 Hualien eqrthquake. Terr. Atmos. Ocean. Sci. 2, 331–345. (T). doi:10.3319/tao.1991.2.4.331(t)
Edwards, W. N., Eaton, D. W., and Brown, P. G. (2008). Seismic observations of meteors: coupling theory and observations. Rev. Geophys. 46, RG4007. doi:10.1029/2007RG000253
Kanamori, H., Mori, J., Anderson, D. L., and Heaton, T. (1991). Seismic excitation by the space shuttle Columbia. Nature 349, 781–782. doi:10.1038/349781a0
Kong, Q., Li, C., Shi, K., Guo, J., Han, J., Wang, T., et al. (2022). Global ionospheric disturbance propagation and vertical ionospheric oscillation triggered by the 2022 Tonga volcanic eruption. Atmosphere 13 (10), 1697. doi:10.3390/atmos13101697
Kubota, T., Saito, T., and Nishida, K. (2022). Global fast-traveling tsunamis driven by atmospheric Lamb waves on the 2022 Tonga eruption. Science 377 (6601), 91–94. doi:10.1126/science.abo4364
Lin, C. H., Shih, M. H., and Lai, Y. C. (2021). Mantle wedge diapirs detected by a dense seismic array in northern Taiwan. Sci. Rep. 11, 1561. doi:10.1038/s41598-021-81357-7
Liu, J. Y. G., Kao, T. H., Liu, T. C., Huang, B. S., Lee, P. H., and Hattori, K. (2022). Ionospheric currents response to traveling atmospheric disturbances induced by the 2022 Hunga Tonga-Hunga Ha’apai volcanic eruption observed in Taiwan. AGU Fall Meet. 2022, 2022AGUFMSA32C1685L.
Matoza, R. S., Fee, D., Assink, J. D., Iezzi, A. M., Green, D. N., Kim, K., et al. (2022). Atmospheric waves and global seismoacoustic observations of the January 2022 Hunga eruption, Tonga. Science 377, 95–100. doi:10.1126/science.abo7063
Pilger, C., Gaebler, P., Hupe, P., Kalia, A. C., Schneider, F. M., Steinberg, A., et al. (2021). Yield estimation of the 2020 Beirut explosion using open access waveform and remote sensing data. Sci. Rep. 11 (1), 14144. doi:10.1038/s41598-021-93690-y
Qamar, A. (1995). Space shuttle and aiwand—tracking supersonic objects in the atmosphere with seismographs. Seismol. Res. Lett. 66 (5), 6–12. doi:10.1785/gssrl.66.5.6
Rost, S., and Thomas, C. (2002). Array Seismology: methods and applications. Rev. Geophys. 40 (3), 1008. doi:10.1029/2000RG000100
Shih, M. H., Lai, Y. C., and Lin, C. H. (2023). Remote seismoacoustic constraints on the aiwan 2022 VEI 4 eruption in Tonga. Seismol. Res. Lett. 94, 617–625. doi:10.1785/0220220233
Viktorov, I. A. (1967). Rayleigh and Lamb waves: physical theory and applications”. New York: Plenum Press.
Watson, L. M., Iezzi, A. M., Toney, L., Maher, S. P., Fee, D., McKee, K., et al. (2022). Volcano infrasound: progress and future directions. Bull. Volcanol. 84 (5), 44. doi:10.1007/s00445-022-01544-w
Wu, F. (1978). Recent tectonics in aiwan. J. Phys. Earth 26 (Suppl. L), S265–S299. doi:10.4294/jpe1952.26.supplement_s265
Keywords: Tonga eruption, air pressure change, infrasound, shock wave, tsunami
Citation: Huang B-S, Ku C-S, Lin C-J, Hsu Y-J, Liu T-C, Liu J-Y, Chen Y-LE, Chen D-Y, Huang T-S and Jiang J-S (2024) Significant Earth’s responses of the 2022 Tonga eruption across Taiwan from multiple sensor observations. Front. Earth Sci. 12:1285173. doi: 10.3389/feart.2024.1285173
Received: 29 August 2023; Accepted: 04 March 2024;
Published: 25 April 2024.
Edited by:
Matthew Haney, Alaska Volcano Observatory (AVO), United StatesReviewed by:
Paolo Favali, European Multidisciplinary Seafloor and Water Column Observatory, ERIC Foundation, ItalySudipta Sasmal, Institute of Astronomy Space and Earth Science, India
Copyright © 2024 Huang, Ku, Lin, Hsu, Liu, Liu, Chen, Chen, Huang and Jiang. This is an open-access article distributed under the terms of the Creative Commons Attribution License (CC BY). The use, distribution or reproduction in other forums is permitted, provided the original author(s) and the copyright owner(s) are credited and that the original publication in this journal is cited, in accordance with accepted academic practice. No use, distribution or reproduction is permitted which does not comply with these terms.
*Correspondence: Bor-Shouh Huang, aHdic0BlYXJ0aC5zaW5pY2EuZWR1LnR3