 Ehsan Abolfazli
 Ryan Osborn1†
 Kyle Strom
94% of researchers rate our articles as excellent or good
Learn more about the work of our research integrity team to safeguard the quality of each article we publish.
Find out more
ORIGINAL RESEARCH article
Front. Earth Sci. , 21 February 2024
Sec. Marine Geoscience
Volume 12 - 2024 | https://doi.org/10.3389/feart.2024.1268992
This article is part of the Research Topic Cohesive Sedimentary Systems: Dynamics and Deposits - Volume II View all 4 articles
Muddy sediment constitutes a major fraction of the suspended sediment mass carried by the Mississippi River. Thus, adequate knowledge of the transport dynamics of suspended mud in this region is critical in devising efficient management plans for coastal Louisiana. We conducted laboratory tank experiments on the sediment suspended in the lower reaches of the Mississippi River to provide insight into the flocculation behavior of the mud. In particular, we measure how the floc size distribution responds to changing environmental factors of turbulent energy, sediment concentration, and changes in base water composition and salinity during summer and winter. We also compare observations from the tank experiments to in situ observations. Turbulence shear rate, a measure of river hydrodynamic energy, was found to be the most influential factor in determining mud floc size. All flocs produced at a given shear rate could be kept in suspension down to shear rates of approximately 20 s−1. At this shear rate, flocs on the order of 150–200 μm and larger can settle out. Equilibrium floc size was not found to depend on sediment concentration; flocs larger than 100 μm formed in sediment concentrations as low as 20 mgL−1. An increase in salinity generated by adding salts to river water suspensions did not increase the flocculation rate or equilibrium size. However, the addition of water collected from the Gulf of Mexico to river-water suspensions did enhance the flocculation rate and the equilibrium sizes. We speculate that the effects of Gulf of Mexico water originate from its biomatter content rather than its ion composition. Floc sizes in the mixing tanks were comparable to those from the field for similar estimated turbulent energy. Flocs were found to break within minutes under increased turbulence but can take hours to grow under conditions of reduced shear in freshwater settings. Growth was faster with the addition of Gulf of Mexico water. Overall, the experiments provide information on how suspended mud in the lower reaches of the Mississippi might respond to changes in turbulence and salinity moving from the fluvial to marine setting through natural distributary channels or man-made diversions.
Sediment carried by rivers to deltas and estuaries plays a role in shaping the ecosystem and geomorphology of coastal regions. For large low-land rivers, fine muddy sediments, sediment with a diameter smaller than 63 μm, can constitute a significant fraction of the total mass delivered to the terminal end of the fluvial system. These fine sediments have a unique characteristic that separates them from sand or gravel in that they can undergo continuous aggregation and breakup cycles whereby the suspended particles aggregate or disaggregate to grow or shrink in size. This process is known as flocculation. Flocculation alters the shape and size and, therefore, the settling velocity of mud particles, also known as “flocs” (e.g., Eisma, 1986; Droppo and Ongley, 1994). This means that the flocculation process can exert significant control on the sediment transport dynamics of the suspended mud (e.g., Ross and Mehta, 1989; Lamb et al., 2020). Therefore, being able to understand the drivers of flocculation and model their influence on settling velocity is necessary for accurate prediction of sediment movement in coastal regions that are rich in mud. The purpose of this study is to examine the flocculation properties of the mud in physical water samples taken from the Mississippi River (Louisiana, United States).
The Mississippi River is the largest river in the United States both by length and discharge. It carries an estimated annual load of 200–500 million tons of sediment down to the coastal region of Louisiana (Blum and Roberts, 2009). The river, therefore, plays a significant role in both shaping the coastal landscape of the region and influencing the marine ecosystems in the northern Gulf of Mexico (GoM). These areas are drawing increasing attention because of their high sea level rise (compared to the global average), subsidence, and the increasing frequency of tropical storms and river floods all of which threaten the livelihood of coastal communities and the economy of the region (Britsch and Dunbar, 1993; Chan and Zoback, 2007; Ingebritsen and Galloway, 2014). These compounding threats have led to the development and implementation of coastal management plans aimed at mitigating these adverse effects. For instance, in the state of Louisiana, the “Coastal Master Plan” aims to reduce flood risks and support the infrastructure that is necessary for a healthy and functioning coast (Sprague et al., 2023). An integral part of these plans is the installation of sediment diversions that would re-connect the Mississippi River and its suspended sediment with the surrounding bays, marshes, and floodplains in a controlled way to facilitate subaerial land growth and marsh nourishment. The sediment diversion plans cannot succeed without a sufficient understanding of the nature of the sediment carried by the Mississippi River. Over 90% of the Mississippi River sediment reaching the GoM is estimated to be mud (Allison et al., 2012). Therefore, knowledge of the flocculation state of the suspended mud in the lower Mississippi River, and how it might respond to changes in turbulence and salinity as it passes through diversion structures, plays an important role in devising effective coastal management and restoration plans that rely heavily on assessing the fate of the sediment transported to the US GoM coasts.
Recent in situ observations from the lower reaches of the Mississippi River have shown that the mud suspended in the main channel and its distributaries is flocculated long before reaching any saltwater intrusion, and that the freshwater floc sizes can be significant enough to initiate deposition within distributary channels as shear stress drops moving seaward (Osborn et al., 2021; 2023; Dunne et al., 2024). Mud can, and is expected to, be flocculated in many freshwater settings (e.g., Droppo et al., 1997; Droppo, 2001; Lamb et al., 2020), but these observations highlight the need to understand mud flocs in both fresh and saline environments within the Mississippi River. This is true both for understanding natural processes and for predicting the fate of fine sediment passing through proposed diversion structures. For example, observations suggest that the suspended mud boundary condition for a distributary channel or diversion project is a flocculated state in equilibrium with the river conditions. Suspensions passing through a diversion structure would then likely encounter higher than average turbulence conditions (potentially breaking pre-existing flocs) within the diversion followed by a decay in turbulence and an increase in salinity as the freshwater jet or plume enters a larger embayment (possibly leading to floc growth). How floc sizes respond to the changes in turbulence, salinity, and organic matter moving from the river to the deltaic embayment will strongly influence whether or not diverted mud settles and aids in land building or is instead advected farther from shore and lost to deeper waters.
Much is known about the general drivers of floc growth and breakup. For example, turbulence, clay mineralogy, suspended sediment concentration, salt levels, and the type and concentration of organic material present within a suspension are all known to play a role, at least in some settings, in establishing the aggregation and breakup dynamics of flocs and the ultimate equilibrium size distribution at a steady state condition (a state where aggregation and breakup are balanced). In general, mud flocs that can stay in suspension grow in size as turbulence drops and salinity (at least up to some critical saturation level) and organic matter (specifically in the form of microbial Extracellular Polymeric Substances (EPS)) increase (e.g., Gibbs, 1985; Eisma, 1986; Droppo et al., 1997; Manning and Dyer, 1999; Maggi, 2009; Mietta et al., 2009; Verney et al., 2009; 2011; Lai et al., 2018; Lee et al., 2019; Abolfazli and Strom, 2023b). Yet, while much is known about the general drivers of flocculation, our ability to effectively model mud floc sizes at a given location in space and time remains limited. One reason for this is that flocculation studies are often performed on synthetic mixtures of commercial clay and proxies for river, estuary, or marine-derived organics. Such studies are useful in building our fundamental understanding of flocculation dynamics and allowing for repeatable experiments. However, because of the site-specific nature of sediment and organic mixtures of natural muds, there remains a need to characterize the flocculation behavior of mud suspensions tied to specific locations.
In this study, we characterize the response of Lower Mississippi River freshwater mud suspensions to changes in turbulence and salinity in a series of controlled laboratory experiments that were paired with field measurements during the summer of 2020 and winter of 2021; during these sample periods, the river discharge and suspended sediment concentration were approximately equal between seasons. During the field surveys, we used an in situ floc camera system (i.e., the FlocARAZI (Osborn et al., 2021)) to examine the flocculation state of the sediment suspended in the river (Dunne et al., 2024; Osborn et al., 2023). While the in situ observations are valuable in accessing the state of mud flocculation, they can only provide snapshots of the flocs at a particular place and time. As such, the data are limited in their ability to explore the evolution of the size distribution as environmental drivers vary temporally and/or spatially. Thus, to provide additional insight into the dynamics of mud flocs in the lower Mississippi River, we conducted controlled laboratory experiments to investigate the response of mud floc size distributions to variations in environmental conditions.
In particular, we here pursue three objectives. The first objective is to determine the drivers that are most influential in setting the size distribution of suspended mud as it moves from a freshwater river to a saline embayment where turbulence, salinity, and sediment concentration all co-vary. These factors have been historically known to drive flocculation, but the extent to which each on their own and together affects flocculation of suspended Mississippi River mud is unexplored.
Secondly, we seek to assess the time scale of floc size adjustment to changes in flow and water chemistry/biology alterations. The flocculation process involves the aggregation and breakup of assemblages of inorganic and organic particles (e.g., Mehta, 1986). The balance between these two processes can lead to an equilibrium in the floc population. However, the timescale over which floc populations evolve is not yet well understood, yet is likely important in determining mud dispersal patterns from diversion structures.
Thirdly, we use the paired laboratory and field measurements to examine whether the floc characteristics from laboratory mixing tank experiments are comparable to those observed in the field. Laboratory experiments can provide data on mud flocs that are more controlled compared to field observations and the experiments can capture the time evolution of a particular floc population rather than only grabbing snapshots in time and space as provided by field observations. Such data can greatly contribute to efforts on flocculation model development and calibration. The downside to laboratory experiments is that they inevitably study flocs in a simulated environment rather than the natural environment in which flocs form and travel. As such, one is always left with the question of how relatable the laboratory measurements are to field situations. Conducting the laboratory experiment as a part of a larger project that included in situ observations (Osborn et al., 2023) provided us with an excellent opportunity to examine if the experiments conducted in flocculation tanks are translatable to natural systems. If so, repeatable flocculation experiments can be used to provide realistic data that are helpful for flocculation model parameterization and calibration.
To meet the objectives, we conducted laboratory experiments on water samples taken from the lower Mississippi River and the Gulf of Mexico. The experiments were conducted in the flocculation chambers of Abolfazli and Strom (2023b) and Abolfazli and Strom (2022) wherein turbulence and salinity can be controlled and varied systematically. In the experiments, the size distribution of the suspended particles and the water turbidity were measured continuously to provide the data needed to evaluate how changes in turbulence, water source, salinity, and suspended solids concentration influenced the growth, breakup, and equilibrium size distributions of the mud aggregates.
Water samples that contained suspended sediment were collected from the Mississippi River as part of the broader study outlined in Osborn et al. (2023). These water samples consisted of grab samples of surface river water collected from the sampling boat at the end of each day on the water. The samples were taken back onshore, stored in a fridge overnight, and used in experiments presented in this paper the following day. Locations on the river from which water samples were collected include the Bonnet Carré Spillway (BCS) upstream of New Orleans, Louisiana, in the main channel of the river near Venice, Louisiana (VMC), within the Baptiste Collette Bayou (BCB), the South Pass (SP), and from the plume region of the Mississippi River in the near-shore regions of the Gulf of Mexico (GoM) (Figure 1). Sampling took place from 24 June to 2 July 2020 and from 9 to 14 January 2021.
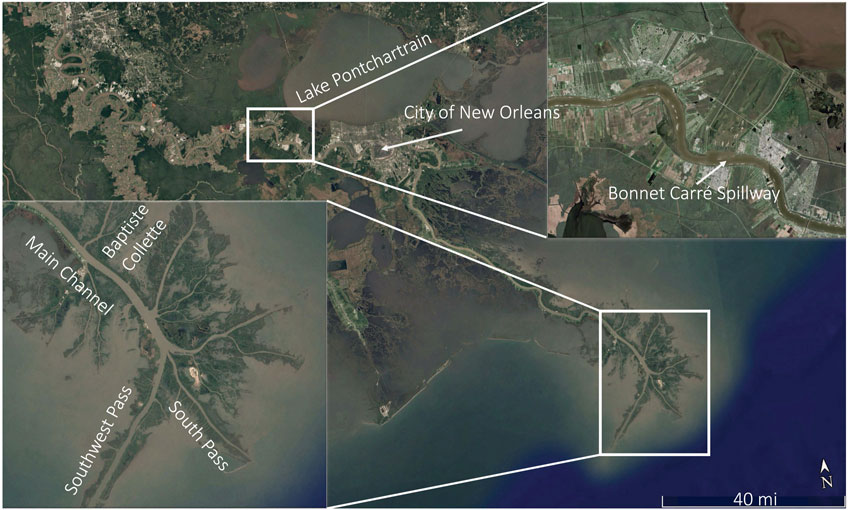
FIGURE 1. Water and sediment sampling locations in the lower Mississippi River and Bonnet Carré Spillway, Louisiana.
The water and suspended solids composition varied across the experiments due to the nature of the sampling method used (Table 1). Two significant types of base water samples were ones for which a measurable background salinity, S0, was present within the sample (S0 > 0.5 psu) and ones for which no measurable background salinity was present (S0 = 0 psu, with specific conductance of 200–400 μS cm−1). Samples for which a background salinity was present came from near the mouth of South Pass and the surface plumes in the GoM emanating from South and Southwest passes. For this reason, we consider that samples for which a measurable background salinity was present contained some amount GoM water mixed with fresh Mississippi River water. We therefore refer to the salt type or source in these experiments as GoM salt. Samples for which S0 was measured at approximately 0 psu (specific conductance of 200–400 μS cm−1) were considered to contain only fresh Mississippi River water.
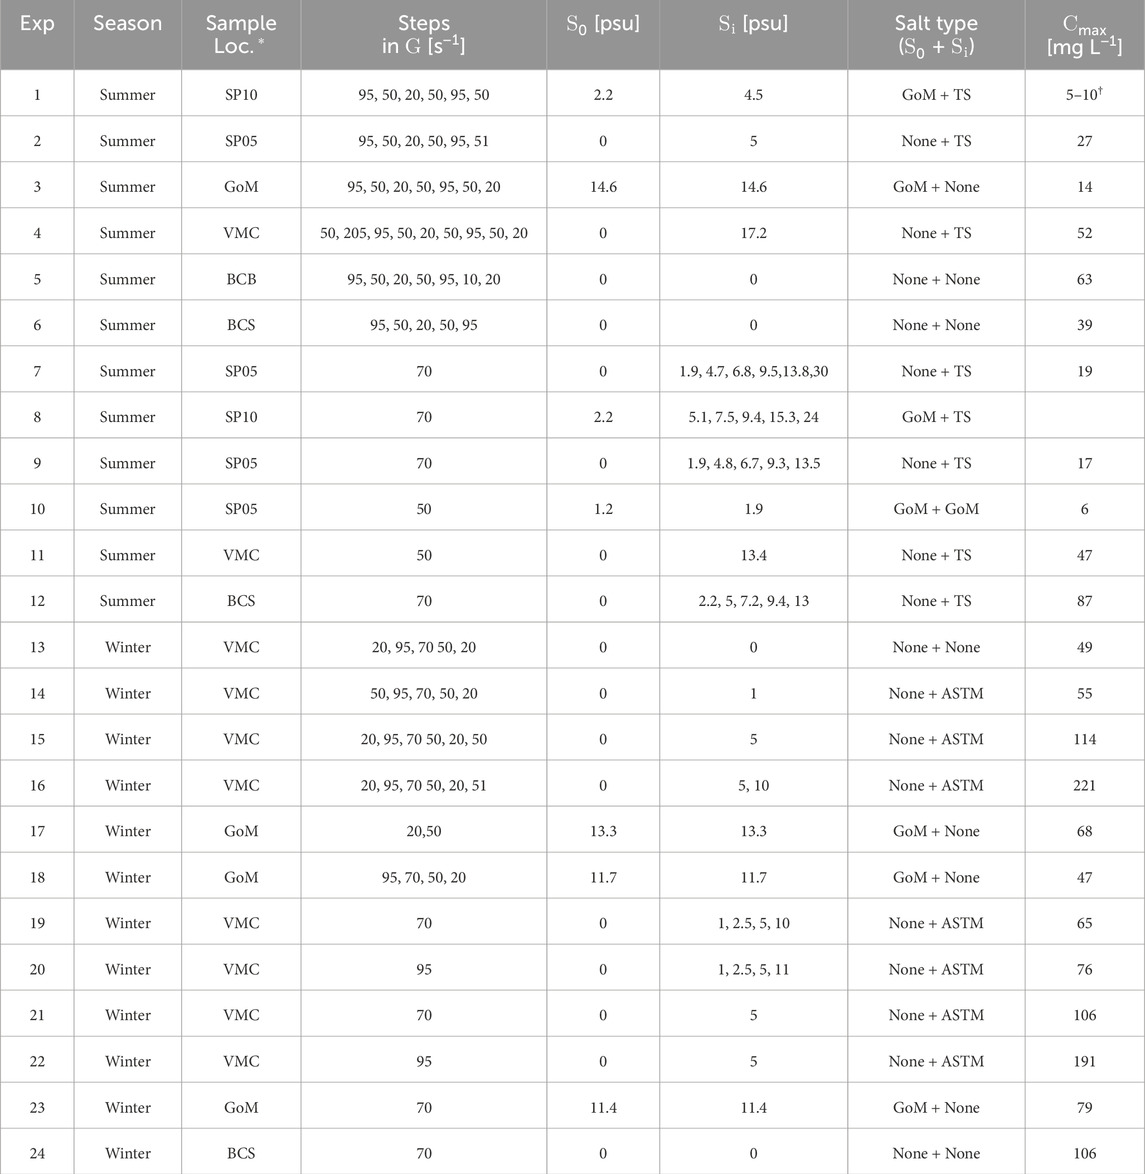
TABLE 1. Conditions for each experiment. S0 is the baseline salinity the sample started with, and Si is the salinity at step i after salt was added. The type of salt present in the baseline and in each added step is given in the last column. *SP: South Pass (numbers represent station location within the pass), GoM: Gulf of Mexico, VMC: Venice Main Channel, BC: Baptiste Collette Bayou, BCS: Bonnet Carré Spillway.†The concentration range is an estimated value based on visual inspection because the NTU to SSC calibration equations yielded −8 mg L−1 using the measured turbidity.
All water column samples contained some amount of suspended mineral sediment and suspended and dissolved organic material. A limited number of total organic carbon (TOC) measurements were made on the water samples as a whole using a TOC analyzer. TOC values from the BCS and VMC regions varied from 2.8 to 4.1 mg L−1 whereas the GoM plume samples contained 1.7 mg L−1 of TOC. No mineralogical measurement of the suspended sediment was made, but Mississippi River clays are known to be rich in smectite/montmorillonite (60%–80%) and illite (%20–%30) and relatively poor in kaolinite and chlorite (combined 10%–20%) (Griffin, 1962; Sionneau et al., 2008).
Suspended solids concentration (SSC or C) in the experiments varied from approximately 10–200 mg L−1 with the majority of the experiments being conducted in the range of C = 30–100 mg L−1 (Table 1). The C values reported in the table reflect the maximum concentration observed by an optical backscatter sensor (OBS) during the mixing tank experiments. The reported C values were obtained using the NTU to C [in mg L−1] calibration equation, C = 2.68(NTU) − 33.9 with R2 = 0.95. The calibration was developed with paired OBS readings and physical samples; details on the procedure used to develop the calibration are provided below in Section 2.4. The disaggregated grain size measurements indicated that the d50 of primary particle size distribution was 13 μm (Osborn et al., 2023).
Collected water samples were put into a 13 L mixing tank for the flocculation tests. The mixing tank was equipped with an overhead mixer and a paddle that allowed for varying turbulence shear rates (G) within the tank. A camera system, consisting of a camera, an objective, and a LED light source was used to capture floc images while in suspension (Figure 2). The camera had a 2080 × 1,552 pixel, 8 mm CMOS sensor with a 2X magnification objective and was capable of imaging particles in the size range of 10–1,000 μm (1.28 μm/pixel resolution). Images of the particles in suspension were taken at a rate of 1 Hz. The flocculation chamber is described in detail in Tran and Strom (2017). The images were then processed with a script based on the procedure outlined in Keyvani and Strom (2013) that provides the area of each identified, in-focus, floc. Floc sizes, df, and volumes, Vf, were calculated based on an equivalent circular diameter,
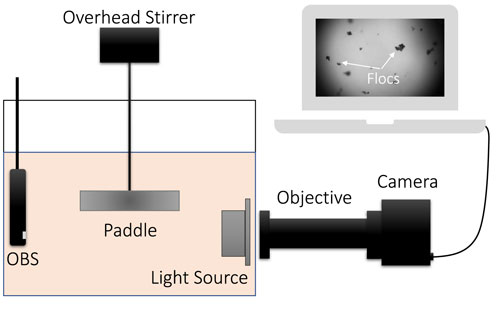
FIGURE 2. A schematic of the experimental setup.
The three research questions we aimed to explore with the experiments were: 1) how do changes in turbulence and salinity (S) impact floc size, 2) how fast does the floc population respond to increases and decreases in turbulence, and 3) how do floc sizes generated in a laboratory mixing tank compare to flocs observed in situ for similarly estimated values of turbulent shear rate? These questions were all explored by measuring the floc size population time history in the mixing tanks while turbulent shear rate and salinity were varied. In some experiments, salinity was held constant while the turbulent shear rate was varied. We will refer to these experiments as the Turbulence-focused experiments. In other runs, we held mixing conditions constant and varied the salinity, i.e., the Salinity-focused experiments. Table 1 provides a summary of all of the experimental conditions. As an outcome of running the experiments on different river and plume water samples collected during summer and winter, the experiments also provide the opportunity to explore how differences in season (summer vs. winter) and water or salt type (i.e., fluvial Mississippi River, fluvial Mississippi River plus added salts, and fluvial Mississippi River water plus GoM water) influence flocculation properties.
The turbulence-focused experiments aimed to simulate the reduction in turbulence progressing downriver through the distributary channels and into wider and saltier embayments. In these experiments, turbulence (G) was reduced over time in a stepwise manner while other drivers were kept constant to measure floc growth. In most experiments, shear was also systematically increased following the step down in G to measure the breakup response of flocs. Increases in G were achieved by increasing the mixing tank paddle rotation rate, and decreases were achieved by reducing the paddle rotation rate.
The goal of the salinity-focused experiments was to determine how increases in salt influenced the floc size and growth rate of the Mississippi River water samples (to mimic the increase in salinity as river water moves from a fluvial to a marine setting). As mentioned above, all mixing-tank samples started as either fresh Mississippi River water sample (S0 = 0 psu) or as a brackish mix of fluvial Mississippi River water and GoM water (S0 > 0 psu). For the salinity-focused experiments, additional salt was added incrementally to these base water samples.
We used three different salt types or sources to achieve these stepped increases in salinity, i.e., table salt (NaCl), an ASTM-grade sea salt substitute (produced by Lake Products Company LLC, Florissant, MO, United States), and additional GoM water. Due to our limited access to the GoM during the field surveys, only a few experiments were dedicated to examining the effects of saltwater collected from the GoM on freshwater flocs.
Table salt and GoM water were added to bases of both fresh Mississippi River water and Mississippi River + GoM mixes during the experiments of summer 2020. Table 1 differentiates the base and added salt type. During the winter 2021 experiments, we solely added ASTM sea salt (referred to herein as “ASTM” salt or “sea salt”) to both fresh and GoM-influenced base water mixtures. In addition to its main component, NaCl, the sea salt contains nine other chemicals that provide several mono- and divalent ions other than Na+1 and Cl−1. We were motivated to switch from using table salt to ASTM sea salt in the second round of experiments (carried out in winter 2021) by observations made from the summer 2020 experimental data and results from (Abolfazli and Strom, 2022). From the summer 2020 experiments, we observed a distinct difference in flocculation between water mixtures that contained Mississippi River water and GoM water and those that contained Mississippi River water and table salt. At the time, we attributed the difference in flocculation behavior to a difference in ion composition between table salt and sea salt because (Abolfazli and Strom, 2022) had shown that the type of salt ions present in water can strongly influence the size and settling properties of the mud flocs. We therefore switched to using the ASTM sea salt during January 2021 to be as close as possible to seawater in terms of ion concentration.
A total of 24 tank experiments were conducted over the two sampling seasons. Some of the tank experiments had equivalent time histories in G and S but others were different one from another. The reason for this is that without prior knowledge of the general flocculation behavior and response time, i.e., the time to equilibrium under changes in mixing or water and salt content, it was not possible to determine an exact set of G and S time histories to adequately explore the full flocculation behavior space. One major constraint on the study was time. Based on previous work, we did not consider it reasonable to experiment on a water sample for more than 1 day if we wanted to ensure that the biological state of the suspension was not significantly altered from that within the river. Therefore, to explore the flocculation behavior space, we ran experiments that proceeded at different levels of G and S for different amounts of time and in different G step orders. Table 1 provides a summary of the various steps in G and S used within each experiment.
While specific time series values of G and S varied from experiment to experiment, all tank experiments proceeded through three standard phases. In the first phase, the water sample was poured into the mixing chamber and the paddle speed was set as high as it could go without sloshing water out (somewhere around an estimated G of 400 s−1). During this time, the OBS was turned on and the camera system was initiated. In phase two (the primary phase of the experiment), the mixer was reduced to the first specified shear step. Time equal to zero in all of the time series plots corresponds to the instant when the mixer was changed from the very high state to one of the specified shear states of 20, 50, 70, or 95 s−1. The exact time series in G and S varied in each experiment as discussed above and below and outlined in Table 1. After each experiment, the third phase of the experiments commenced to obtain data to build the NTU to SSC calibration. To do this, the mixer was again turned up to a high rotation speed to resuspend any sediment that had been deposited during phase two, and the OBS was used to collect data and produce an average NTU value for the suspension. Following logging of the OBS data, a physical sample of the suspension was collected to obtain the SSC value through filtration, drying, and weighing (Osborn et al., 2023).
The results below are presented in the following order: general observations from time series measurements, equilibrium floc size data under different tank and sample conditions, rates of change to a new equilibrium, and the comparison between the laboratory and field measurements. We note here that all of the data on floc size that we present comes from our camera systems, and that these systems are not able to characterize the volume or size of particles that sit below the resolution of system. A reasonable practical limit on what can be measured is only particles greater than 15 μm in diameter.
The primary outputs of the experiments were 1) images from which the suspended particle size distribution can be obtained and 2) turbidity as a function of time. For the paper, we primarily present photo samples and the d50 and d84 of the distributions, either with time or at equilibrium, rather than the full particle size distributions. Figure 3 presents the time series for three experiments: Exp03, Exp13, and Exp09. Each panel depicts the applied turbulent shear rate and salinity time series along with the response of the floc size statistics d50 and d84 and the overall suspension concentration with time. Exp03 and Exp13 are turbulence-focused experiments, where G varies while S is constant at S0. Exp09 is a salinity-focused experiment, where G is constant while S varies with time. The base water sample in the top panel (Exp03) contains GoM water. Neither the base water sample nor any of the added salt in either Exp13 or Exp09 have any GoM water. Space does not permit us to plot the time series for each experiment, but plots and code to generate plots and explore the data are provided in the database associated with this paper (Abolfazli and Strom, 2023a) (see data availability statement to access the files).
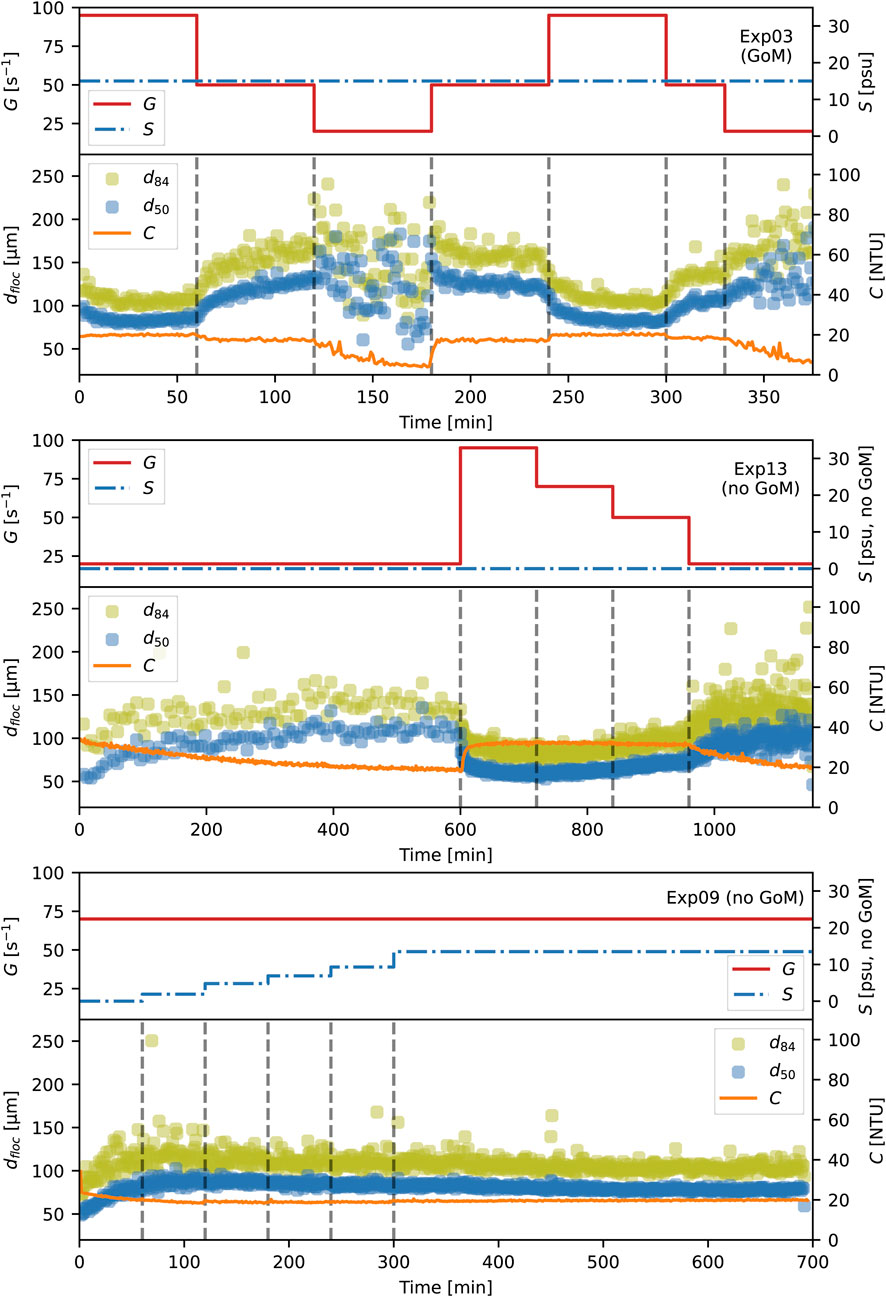
FIGURE 3. Examples of the data obtained in the experiments from two turbulence-focused experiments (Exp03 and Exp13, top two panels) and one salinity-focused experiment (Exp09, bottom panel).
A few qualitative observations can be made from the sample time series. The first is that floc size can respond to changes in G or S through growth or breakup and that the size will increase or decrease until it reaches an “equilibrium” value where d50 and d84 become relatively constant in time if G and S do not change. The second is that floc size is inversely related to shear. In the Exp03 and Exp13 panels of Figure 3, reductions in G lead to increases in the d50 and d84 of the suspended flocs while increases in G produce reductions in both. The largest flocs are consistently observed at the lowest shear used, i.e., G = 20 s−1, and the smallest flocs are consistently associated with the largest shear G = 95 s−1. A third observation is that concentration within the tank remains relatively unchanged for G ≥ 50 s−1. However, settling takes place for G ≤ 20, leading to a decrease in the suspension C with time at these shear rates.
The three general observations made from the sample time series are generally true across all experiments, and they corroborate real-time observations made from the images and visual inspection of the tanks during data acquisition. For example, one could observe the settling of sediment within the tank for G ≤ 20 and it was visually evident that flocs in suspension were largest when shear was set to G = 20 s−1.
Another observation apparent from watching the images during data collection, though not readily apparent in the three sample time series, was that the nature of the suspended particle size distribution was markedly different with and without the presence of some amount of GoM water (either within the base water sample or as water added to increase the base sample’s salinity). This visual observation made during data collection is backed by the quantitative data discussed below. It is the basis for presenting the remainder of the results broken out into three different water types, i.e., freshwater (S = 0 psu), saline but no GoM water present (S > 0 psu, no GoM), and saline with some amount of GoM water present (S > 0 psu with GoM).
Here we present data on the characteristic length of the equilibrium floc size distribution, d50e, as a function of the environmental drivers of water type and salinity, turbulence, and suspended sediment concentration. A time-invariant floc size distribution is thought to represent a condition of equilibrium where, on average, the floc breakup rate is equal to the floc aggregation rate. Whether or not this condition was reached at any step in G or S within the experiment was subjectively determined by examining the floc d50 time series. If d50 appeared to be constant, or approaching a constant value, then the average d50 value during that time was taken to be the equilibrium size associated with that particular water and sediment sample at that particular level of G and S, i.e., d50e. For example, the end of the growth and breakup phases at G = 50 s−1 in Exp03 (on either side of the first G = 20 s−1 step) would be taken as the equilibrium value. Equilibrium values associated with a particular G and S were only used once per experiment. For example, in Exp03, single equilibrium values for G = 20, 50, and 95 s−1 are calculated. Equilibrium values of d50 were not obtained for every step in G or S since there were cases where it appeared that the d50 would change if given more time. Equilibrium d50 values were extracted from several G = 20 s−1 where the longer-term average appeared to be constant even though variation from minute to minute was large due to settling. These d50e values are highlighted as potentially being limited by settling.
As mentioned above, changes in turbulent shear rate, G, during the experiments resulted in changes in suspended floc size (Figure 3). Lowering the shear produced larger flocs and raising the shear produced smaller flocs. As expected, this same pattern is reflected in the equilibrium floc size d50e (Figure 4). Considering all water types and salinity, the average d50e at G = 20 s−1 is d50e-avg = 106 μm (average of 8 values), and the average value at G = 95 is d50e-avg = 62 μm (average of 8 values). Figure 4 shows that equilibrium sizes for the runs where GoM water is present are higher on average than those for which GoM water is not present (both S = 0 and S > 0). Average equilibrium d50e values at G = 20 s−1 when GoM water is present is d50e-avg = 123 μm (average of 3 values), whereas the average for non GoM water at any salinity is d50e-avg = 97 μm (a difference of 26 μm or roughly 20%). Similarly, d50e-avg = 76 μm at G = 95 s−1 for cases with GoM water is present compared to d50e-avg = 59 μm for non GoM water cases.
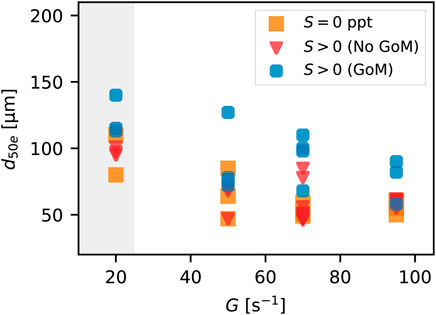
FIGURE 4. Equilibrium d50e values from all experiments as a function of turbulent shear rate and salt or water type (markers). The gray region indicates the zone for which settling within the tank occurs.
Settling occurred within the tank when shear was lowered to G = 20 s−1. The settling was particularly strong for cases where GoM water was present (settling rate data is shown in the following sections). For this reason, we have highlighted all equilibrium size data at G = 20 s−1 as potentially being impacted or limited by settling. By this, we mean that it is possible that given an infinite time in suspension (no gravitational settling), the equilibrium floc size at G = 20 s−1 might have been larger than what is reported in the figures. It is possible that flocs around 200 μm in diameter and larger could not be kept in suspension within the tank at this shear rate (note that d50 and d84 begin to overlap at G = 20 s−1 in the Exp03 time series of Figure 3). Therefore, the equilibrium size might be more reflective of an equilibrium size that can be kept in suspension than it is the ultimate maximal equilibrium floc size for a suspension without settling.
The presence of GoM water resulted in larger flocs overall relative to the cases without GoM water. This was true irrespective of salinity. Comparing images and flocs size distributions of mixtures with and without GoM water showed that the presence of GoM water caused the disaggregated particles to become incorporated into flocs (Figure 5). This led to a tightening of the size distribution and moved it towards larger sizes overall (Figure 6).
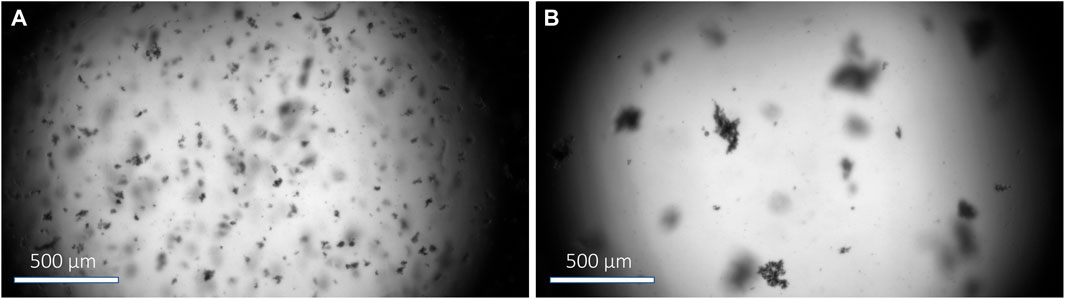
FIGURE 5. Sample floc images at equilibrium for a shear rate of G = 20 s−1. Salinity measurements for the sea salt panel (A) and GoM panel (B) experiments were 4.8 and 13.3 psu, respectively.
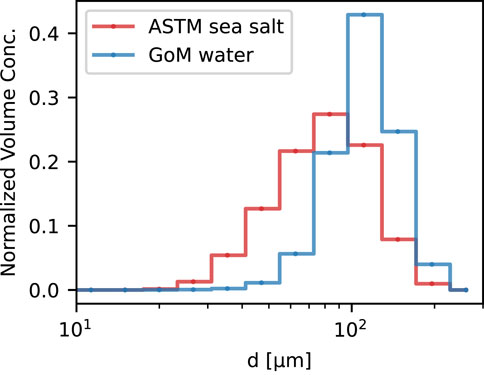
FIGURE 6. Normalized volume concentration distributions at equilibrium (G = 20 s−1) for the case of ASTM sea salt added to Mississippi River water and GoM water added to Mississippi River water. The particle size distributions corresponding to the experiments from which Figure 5 was generated.
Unexpectedly, an increase in salinity generated by adding salts (whether the salt was table salt or ASTM sea salt) did not lead to a pronounced change in floc size population or d50 even up to S values of more than 26 psu. Exp09 in Figure 3 (bottom panel) shows that d50 did not increase along with the stepped increases in S under a constant turbulent shear rate of G = 70 s−1. Similar behavior was observed at other shear rates. Figure 7 shows d50 at equilibrium as a function of S for shear rates of G = 20, 50, 70, and 95 s−1. The plots show little difference between the freshwater samples (S = 0 psu) and the cases for which S > 0 psu but without any GoM water. This was true regardless of the amount of table or ASTM salt added. Instead, the largest difference observed was between samples with and without GoM water. Within the GoM data, it appears that larger floc sizes at G = 20 s−1 might be associated with higher salinities. However, a trend in the data is difficult to decipher with the limited number of data points.
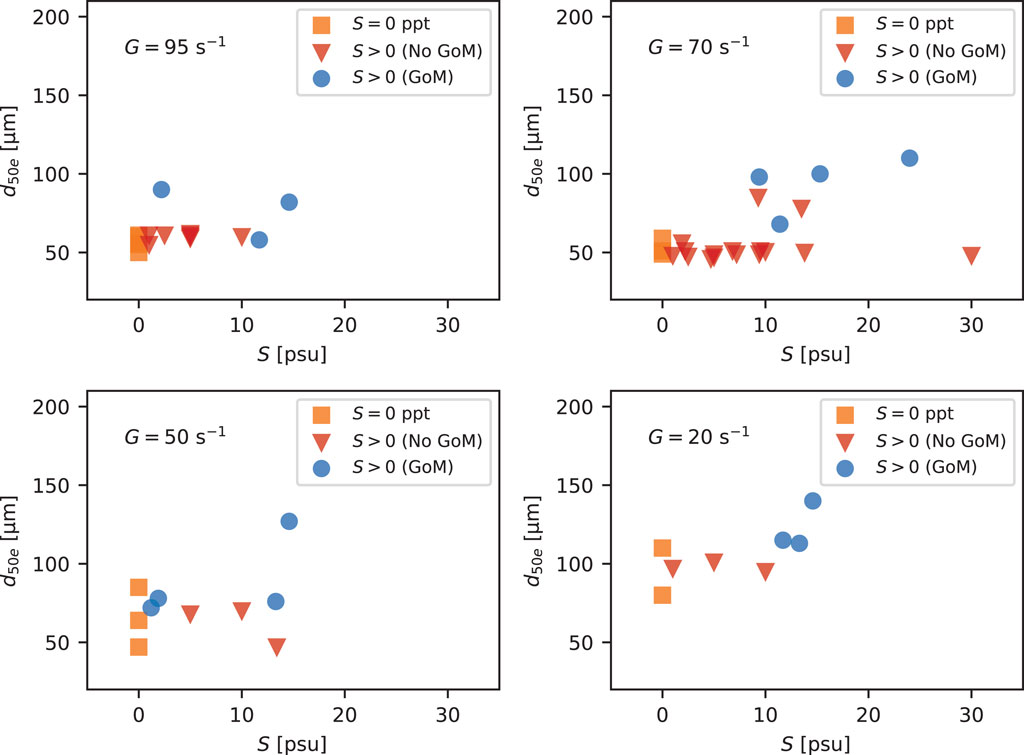
FIGURE 7. Normalized volume concentration distributions at equilibrium (G = 20 s−1) for the case of ASTM sea salt added to Mississippi River water and GoM water added to Mississippi River water.
Figure 8 shows the equilibrium d50 values extracted from the time series data as a function of C and water type. Through settling and resuspension, concentration can also be a function of G. For this reason, the d50e vs. C data is shown for each level of G. C at equilibrium was calculated as the average of the concentration at the beginning of the step in G or S and the end of the step in G and S. Within the figure, the maximum and minimum concentrations for the step are shown as plus and minus horizontal bars. Figure 8 shows no systematic relationship between d50e and C within any G group. In general, larger flocs were associated with lower G and correspondingly lower concentration values.
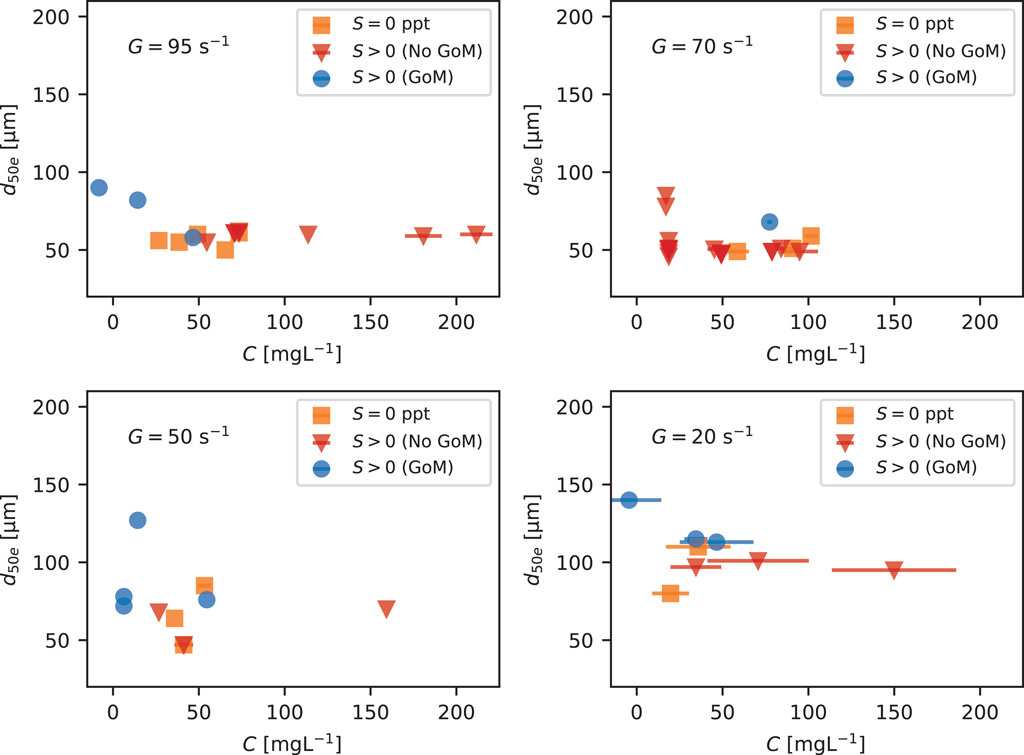
FIGURE 8. Equilibrium d50 versus C at different G values. Colors and markers indicate water or salt type.
In most cases for G > 20 s−1, little to no settling occurred. However, significant settling did occur at G = 20 s−1 in many cases. The rate of change in C over a particular step in G or S was calculated as the concentration at the beginning of the time step minus the concentration at the end of the step divided by the total time of the step. This deposition rate, −dC/dt, at G = 20 s−1 was then plotted against the average floc size and salinity during that period to see if the differences in settling rate could be linked to changes in size or density of the flocs (Figure 9). In general, cases with larger flocs and higher salinity produced higher rates of settling. In particular, flocs formed with some amount of GoM water had the highest rates of settling. We expect that this is due to the larger-sized flocs more so than a change in floc density.
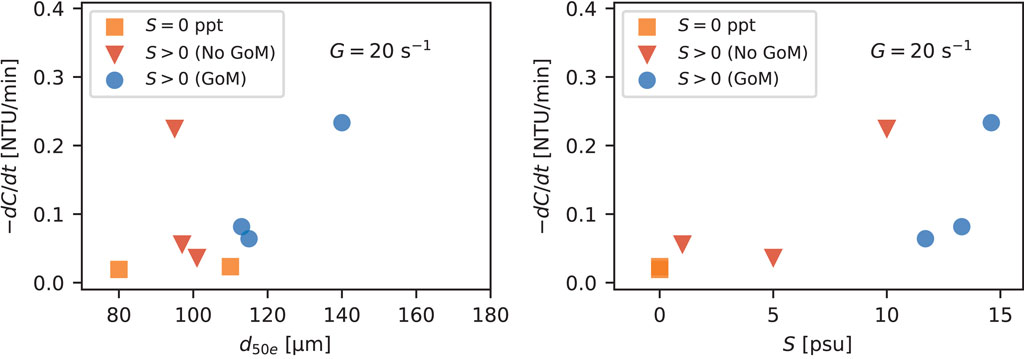
FIGURE 9. Settling rate, −dC/dt, as a function of d50e (left) and salinity (right). Colors and markers indicate water or salt type.
The results presented in the sections above correspond to when flocs had reached an equilibrium. But how fast is equilibrium reached during times of growth (decreasing shear) and breakup (increasing shear)? Here we look at the time needed to go from a state of high mixing to equilibrium at low mixing and then from that low mixing level to a high shear. Time to equilibrium through growth varied across experiments, but flocs in all suspensions generally reached an equilibrium in size within 7 h going from a state of high mixing to a state of low mixing. To illustrate this, data experiments 13, 14, 15, and 17 are shown in Figure 10. In experiments 13, 14, and 15, the first step of the second phase of the experiment was run for 600 min (10 h) to ensure that equilibrium through growth was reached (e.g., Exp13 in Figure 3). Cases for which some GoM water was present (e.g., Exp17) reached equilibrium much faster (usually 2 h or less) than cases for which no GoM water was present (Exp13, 14, and 15, sometimes taking up to 7 h to reach equilibrium). Across all experiments, flocs reached an equilibrium through breakup faster (Figure 10 right panel) than through growth (Figure 10 left panel); usually reaching a near equilibrium value within 15–30 min. Furthermore, the time to equilibrium through breakup did not vary significantly with whether or not GoM water was present.
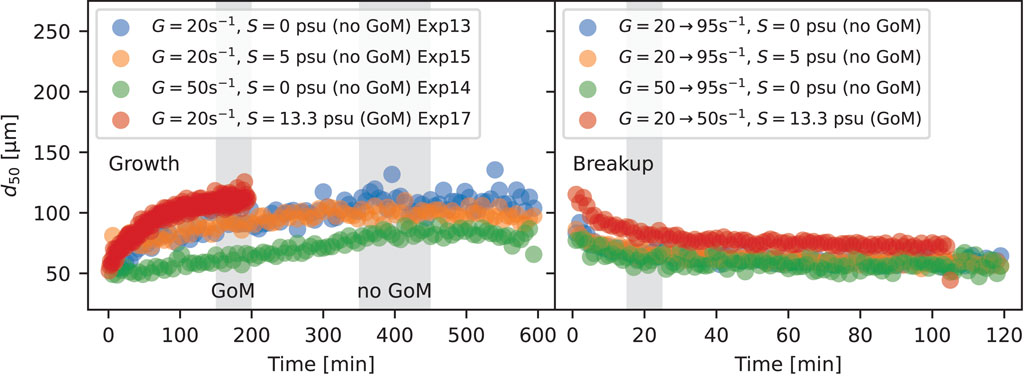
FIGURE 10. Time series of d50 illustrating the time flocs need to reach an equilibrium in size during growth following reduced turbulent shear from a dissaggregated condition (left) and breakup during increased turbulent shear (right).
The in situ observations of Osborn et al. (2023) from the freshwater portions of the main channel of the Mississippi River (at BCS and VMC) show that floc size increased moving downstream from the BCS to the VMC locations, presumably due to a reduction in turbulence, and that flocs in each location were larger during summer than they were in winter, presumably due to differences in the organic material type. Figure 11 shows the laboratory and field floc size data as a function of G and salt type for both summer and winter.
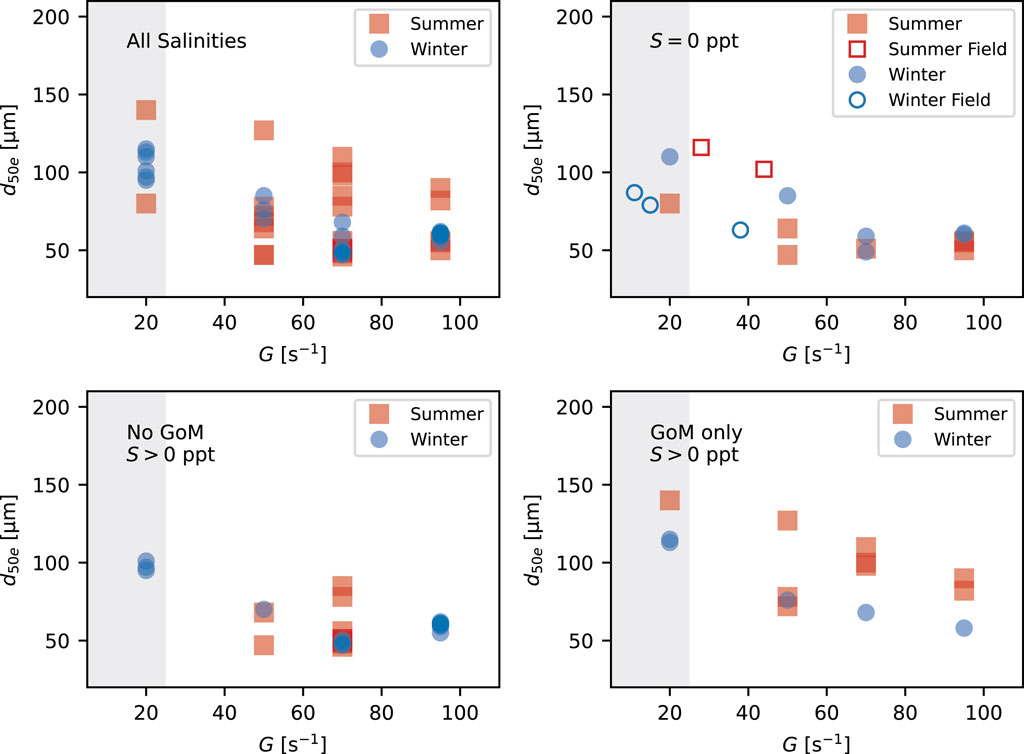
FIGURE 11. Comparison between average equilibrium d50 values by turbulent shear rate obtained from the laboratory experiments and FlocARAZI. The shaded extent indicates the region of potential settling-impacted sizes.
In general, the in situ FlocARAZI-measured sizes are within the range of sizes measured in the laboratory for corresponding estimated values of G. However, the FlocARAZI sizes are slightly larger than their freshwater laboratory counterparts in summer and slightly lower in winter. Thein-situ measures of seasonal changes better match the GoM-influenced flocs from the laboratory experiments.
Considering all water or salt types, the laboratory data do not show a seasonal trend in size. A larger range of floc sizes for a given G was observed in the summer relative to the winter, but winter d50e values are comparable to the overall average of the summer-time values when all water or salt times are grouped together. Breaking the data apart by whether or not there is salt and whether or not water from the GoM is present shows no consistent seasonal signal in floc size for the non-GoM data, i.e., S = 0 psu and S > 0 psu (no GoM). However, on average, sizes are larger for a given G during summer than they are during winter in the samples for which some GoM water was present.
Mud flocculation can be influenced by many factors relating to the hydrodynamic, chemical, biological, and sediment properties of the suspension. In this study, we investigated or otherwise noted the effects of multiple drivers of the nature of equilibrium Mississippi River flocs: turbulence, salinity (including NaCl vs sea salt substitute), water type (including Gulf of Mexico organics), suspended sediment concentration, and settling.
The strongest effect on equilibrium floc size in the experiments belonged to the turbulent shear rate in the tank. Considering that river hydrodynamics plays a major role in bringing unflocculated particles together, breaking flocs up due to mechanical stress, and providing the upward force to keep material in suspension, it is reasonable to conclude that turbulence has a first-order effect on floc size at both the laboratory and field scales.
Within the water column, floc sizes increase as turbulent energy decreases as long as the material can be kept in suspension. As turbulence decreases, floc size and settling velocity will also increase. At a cross-over point, further decreases in turbulent energy will lead to a decrease in the floc size that can be kept in suspension and hence a decrease in the overall average suspended floc size and settling velocity. This behavior has been well documented in many other computational, laboratory, and field studies, e.g., Winterwerp, 1998; Winterwerp et al., 2006; Mietta et al., 2009; Zhang et al., 2022; Dunne et al., 2024. Here we simply note that settling generally occurred at G = 20 s−1 for flocs in the size range of 150–200 μm in diameter.
Even though settling occurred at a shear rate of G = 20 s−1, the largest flocs observed in the experiments always occurred at G = 20 s−1. We therefore consider G = 20 s−1 to be near the cross-over value in G where floc size is maximized.
Given that floc sizes continually increased with a decrease in G in the experiments, we were able to fit a simplified Winterwerp (1998) equilibrium model for d50e, similar to that presented in Osborn et al. (2023), across the full range of G values tested. Models similar to this are based on the idea that floc equilibrium sizes are proportional to the Kolmogorov micro length scale, η (with η ∝ G−1/2). These types of relationships work as long as the suspended material can be kept in suspension infinitely (no settling). We, therefore, expect that it would not be sufficient to describe the size of the material in suspension for G < 20 s−1.
G not only controlled the equilibrium floc size and settling vs. non-settling conditions in the tank but also observed a G dependence in the floc growth rate from an unflocculated state. We observed that flocs grew faster at G = 20 s−1 than they did at G = 50, 70, or 95 s−1.
Due to the limitations of our experiments, we were not able to independently examine the effect of SSC on floc size. Part of this was a result of running experiments on river water samples (for which we could not control SSC), and part of this is a general reflection of the fact that turbulence and SSC are often inversely related at shears for which floc growth becomes substantial; for example, we observed settling at G = 20 s−1.
Figure 8 is a plot of the equilibrium median floc size plotted against water column SSC (obtained through the NTU calibration). All data is grouped by shear rate and differentiated by water source or salt type. We note two observations concerning SSC and floc size associated with the figure. The first is that lower concentrations are generally associated with lower values of G. The second is that for the same G, larger values of SSC are not associated with larger floc sizes; in general, floc sizes associated with higher SSC values at the same level of G encompass the midpoint to lower-end values of equilibrium size observed in this study. From these data, we conclude the SSC does not present an order-one control on floc size.
While we were not able to independently vary G and C at lower shear rates, we find that G presents a stronger control on the equilibrium floc size. The largest flocs observed were sometimes at the lower values of SCC observed because these lower values of SSC corresponded to conditions of low shear. For example, we observed that flocs grew to their largest sizes at G = 20 s−1 even though concentration dropped strongly due to settling. Whether or not flocs could have grown to even larger sizes if concentration had not dropped remains unknown. The data simply show an increase in floc size with a decrease in turbulence even though there is a corresponding drop in concentration.
Increased salinity is thought to enhance mud flocculation. Here, an artificial increase in salinity, either via the addition of table salt or specifically formulated sea salt, was found to have no to limited effect on the mud flocs, at least at shear rates of 20, 50, 70 and 95 s−1. Floc sizes did not grow with the addition of salts. This result was unexpected and is in contrast to what we have observed in other laboratory studies (Abolfazli and Strom, 2022; 2023b), where natural river mud has responded to increased salinity through the addition of salts to deionized (DI) and natural stream water, leading to enhanced flocculation.
In our previous experiments, mud was added to pre-mixed saltwater (Abolfazli and Strom, 2022; 2023b). Whereas in the experiments on the Mississippi River water suspension, salt was added to a pre-mixed river water suspension. Therefore, we considered that one possible reason for a lack of response to increased salinity from table or ASTM sea salt with the Mississippi River suspended might have been due to the order in which sediment or salt was added to the water.
To test if the order in which sediment and salt are added (sediment into salt water compared to salt into a freshwater mud suspension) could alter the flocculation response, we ran an additional set of mixing tank experiments. These supplementary experiments used mud collected from the bed of the main channel of the Mississippi River at Venice, Louisiana (VMC) during the 2021 winter survey (the mud bed likely developed before the survey dates due to the presence of a marine salt wedge, see Osborn et al. (2023) for details). The mud was first added to one of two base water types without any added salt in the mixing tank. Flocs were then allowed to grow for 1 hour before being subjected to high mixing for 15 min to initialize the suspension. Following this, the shear in the tank was set to G = 35 s−1 and left until an equilibrium size was reached; time equal to zero in the experiment is the start of the period of mixing at G = 35 s−1 following breakup. After equilibrium was reached with the base water and mixing rate, salt was added in small increments to increase salinity from 0 up to 7 psu while G was kept constant. The base water types used were DI water and natural stream water sourced from Stroubles Creek in southwest Virginia, United States. The Stroubles Creek water sampling location was just downstream of the “Duck Pond” on the Virginia Tech campus. The water samples contained very little to no suspended sediment, but both the pond and creek are known to contain high levels of algae at times. Results from the experiment are summarized in Supplementary Figure S1. An experiment was also run using DI water and VMC bed mud at two different mixing rates and very small steps in S (Supplementary Figure S2).
As expected, the floc size distribution responded to both the turbulent energy in the tank (larger flocs at lower G values) and the addition of ASTM sea salt. Every increase in salinity level in both the DI and natural stream water increased the d50 and d84 of the suspended flocs. This continued up to a level of S = 4 psu (see Supplementary Figures). Notably, the response to an increase in salinity was stronger in the experiment using natural stream water (Supplementary Figure S1). The response to salt was also more apparent at lower shear rates.
Because we observed an increase in floc size with the addition of salt in the supplementary experiment (regardless of the order in which the salt was added and regardless of shear rate), we conclude that the lack of response, or growth in floc size, in the Mississippi River water experiments with the addition of table or ASTM sea salt was not because we added salt to a river water mixture instead of adding sediment to a saltwater mixture. Furthermore, the difference in the response between the case with DI water and the case with natural stream water highlights a key finding that we also observed in Abolfazli and Strom (2023b). That observation is that the presence of certain natural organic matter boosts the flocculation-enhancing potential of added salts by creating entangled complexes of organic, inorganic, and ionic material.
We suggest that considering the effect of salt on flocculation with and without the presence of algae-based organics in the water is important for interpreting the primary data on the flocculation of suspended Mississippi River sediment we presented in the Results. Although an increase in salinity through the addition of salts did not result in floc growth within the Mississippi River water, adding water collected from the brackish sections of the Mississippi River plume did notably enhance the incorporation of discrete unflocculated particles into flocs and increase the overall average floc size. Given that we did not observe similar enhancements even with the addition of ASTM-specific sea salt to the Mississippi River freshwater, we speculate that the flocculation-enhancing effects of the brackish water were due not only to a change in ion concentration and composition but also, and perhaps primarily, due to a change in the type of organic matter present. Organic matter is present in the Mississippi River, but its composition might not be as conducive to promoting aggregation as the algae-rich water found in the fresh and saltwater mixing zone or in the pond water feeding Stroubles Creek (e.g., Amon and Benner, 1998; Verney et al., 2009; Lee et al., 2017).
The Mississippi River is extremely nutrient-rich. So much so that it has been historically linked to eutrophication (Turner and Rabalais, 1994) and the formation of a vast dead zone in the northern GoM (Rabalais et al., 2002). The dead zone is the hypoxic region harmful to marine life the forms due to algae blooms and their subsequent degradation. When the nutrients reach the nutrient-deprived marine microorganisms, a spike in production of biomatter is inevitable (Cloern et al., 2014). Therefore, we speculate that the most important contribution of seawater to the freshwater mixture was not the presence of salt as much as it was the presence of algal material. Long strands of algae in the saltwater were visually evident in the images captured by the camera during summer. These microorganisms can both produce binding agents that enhance aggregation of suspended particles (Figure 12C) and become entangled in the floc structure itself (Figure 12D). A similar increase, but in the vertical, of chlorophyll-a concentration was observed along a salt wedge where the interaction between freshwater and seawater occurs in the Yura Estuary, Japan by Watanabe et al. (2014).

FIGURE 12. Comparison between effects of (A, B) sea salt at and (C, D) water collected from the Gulf of Mexico. Presence of algae in the water sample collected from GoM and their entanglement in floc structure are evident in panels (C) and (D). All samples images are at a shear rate of G = 20 s−1.
Another reason for the weakened effects of salinity in our experiments could have been due to the differences in scale between the flocculation tank and the Mississippi River. We observed that a fraction of the flocs larger than 120–200 μm settle out of the suspension, particularly at lower turbulent shear rate (i.e., G = 20 s−1). This is different from the Mississippi River in which vertical eddies and circulations keep flocs in suspension longer. Although our experience shows that our flocculation tank setup is capable of keeping flocs with d50 in the range of 180–220 μm in suspension, the presence of silt particles in the Mississippi River flocs is likely to cause them to be heavier and harder to keep in suspension at lower shear rates.
Osborn et al. (2023) showed that, all else being considered, flocs imaged using FlocARAZI in the Mississippi River were larger in summer than in winter. This was attributed to the temperature-driven effects on the type and concentration of the organic matter in the water that can promote mud flocculation more in summer than in winter. However, in the laboratory experiments, the average summertime and wintertime freshwater equilibrium floc size at the shear rate of G = 20 s−1 were 80 and 110 μm, respectively (Figure 11). At G = 50 s−1, the wintertime and summertime average equilibrium floc size at were comparable (85 μm in winter compared to 55 μm in summer). Very little difference between summer and winter was observed at G = 70 and 95 s−1. Taken together, we conclude that the seasonal effect on floc size observed in the in situ sampling was not present in the tank experiments or that our sample size is too small. This might be partly due to the fact that we conducted our experiments at room temperature (19°C–21°C). While we expect that the organic and ion concentration of the water in the river was the same as that in the tank, perhaps the binding mechanism is dependent on temperature in some way.
We observed that Mississippi River mud flocs needed a number of hours to grow from a dissaggregated state and reach an equilibrium in size (Figure 10). This means at it may take freshwater flocs within the river many 10 s of km to re-grow to their full potential if broken down into smaller constituents by regions of high mixing. The time and length scales of adjustment when some amount of GoM water is present might be much shorter, perhaps by a factor of 4 or more. Additional work is needed to fully understand how fast flocs might respond to changes in shear and GoM salinity as river water passes out through a diversion and into embayments with marine water, but the presence of salt and marine organics will speed the adjustment process. The adjustment time scale was much shorter in the case of floc breakup for both cases with and without GoM water (on the order of 10 s of min or length scales of 1 s–100 s of meters). It is therefore reasonable to expect that flocs can break locally in regions of high shear with the river. This highlights the need to ensure the flocculation models implemented in coupled model are temporally resolved enough to capture floc dynamics.
Given the rapid changes in global climate and, inevitably, the geomorphology of the northern coasts of the GoM, knowledge of the flocculation dynamics of the suspended mud in the lowest reaches of the Mississippi River is more critical than ever in devising efficient coastal preservation and restoration plans. In this study, we presented the findings of a series of experiments conducted during two field campaigns in the lower Mississippi River in 2020 and 2021. We found that river hydrodynamics is the main factor in driving mud floc size and determining whether or not the mud can be kept in suspension or will deposit. While increased salinity alone (via added salt) did not significantly affect floc sizes or growth rates, adding GoM water to fresh Mississippi River water samples was very effective in enhancing flocculation and increasing the floc size and settling rate. Considering that we did not observe a similar response in flocculation with the addition of ASTM sea salt, it is reasonable to expect that the organic matter native to the fluvial to marine transition zone contributes greatly to the incorporation of suspended particles into flocs, formation of flocs
The original contributions presented in the study are included in the article/Supplementary Materials, further inquiries can be directed to the corresponding author. Data associated with the paper are available at https://github.com/FlocData/Data-Abolfazli-et-al-Mississippi (Abolfazli and Strom, 2023a).
EA: Conceptualization, Data curation, Investigation, Methodology, Resources, Visualization, Writing–original draft, Writing–review and editing, Formal Analysis. RO: Data curation, Supervision, Writing–review and editing, Conceptualization, Investigation. KD: Conceptualization, Investigation, Methodology, Resources, Writing–review and editing. JN: Conceptualization, Funding acquisition, Investigation, Methodology, Resources, Writing–review and editing. KS: Conceptualization, Data curation, Formal Analysis, Funding acquisition, Methodology, Project administration, Resources, Supervision, Writing–original draft, Writing–review and editing.
The author(s) declare financial support was received for the research, authorship, and/or publication of this article. Funding for this work was provided by the National Science Foundation through grant EAR-1801142.
We are incredibly grateful to Eric Barefoot, Thomas Ashley, and Robert Mahon for all of the help they provided during the field sampling collection effort. The U.S. Army Corps of Engineers (USACE) Bonnet Carré Spillway Office provided us with excellent operational support during our two visits to the spillway. We are also grateful for the time and efforts provided by the three reviewers of the manuscript. Their questions and suggestions during the review process all help to improve the analysis and presentation of the work.
The authors declare that the research was conducted in the absence of any commercial or financial relationships that could be construed as a potential conflict of interest.
All claims expressed in this article are solely those of the authors and do not necessarily represent those of their affiliated organizations, or those of the publisher, the editors and the reviewers. Any product that may be evaluated in this article, or claim that may be made by its manufacturer, is not guaranteed or endorsed by the publisher.
The Supplementary Material for this article can be found online at: https://www.frontiersin.org/articles/10.3389/feart.2024.1268992/full#supplementary-material
Abolfazli, E., and Strom, K. (2022). Deicing road salts may contribute to impairment of streambeds through alterations to sedimentation processes. ACS ES&T Water 2, 148–155. doi:10.1021/acsestwater.1c00300
Abolfazli, E., and Strom, K. (2023a). Flocdata/data-2023-abolfazli-strom. Zenodo: Zenodo. doi:10.5281/zenodo.10371783
Abolfazli, E., and Strom, K. (2023b). Salinity impacts on floc size and growth rate with and without natural organic matter. J. Geophys. Res. Oceans 128, e2022JC019255. doi:10.1029/2022jc019255
Allison, M. A., Demas, C. R., Ebersole, B. A., Kleiss, B. A., Little, C. D., Meselhe, E. A., et al. (2012). A water and sediment budget for the lower Mississippi–Atchafalaya River in flood years 2008–2010: implications for sediment discharge to the oceans and coastal restoration in Louisiana. J. Hydrology 432-433, 84–97. doi:10.1016/j.jhydrol.2012.02.020
Amon, R., and Benner, R. (1998). Seasonal patterns of bacterial abundance and production in the Mississippi River plume and their importance for the fate of enhanced primary production. Microb. Ecol. 35, 289–300. doi:10.1007/s002489900084
Blum, M. D., and Roberts, H. H. (2009). Drowning of the Mississippi Delta due to insufficient sediment supply and global sea-level rise. Nat. Geosci. 2, 488–491. doi:10.1038/ngeo553
Britsch, L. D., and Dunbar, J. B. (1993). Land loss rates: Louisiana coastal plain. J. Coast. Res. 9, 324–338.
Chan, A. W., and Zoback, M. D. (2007). The role of hydrocarbon production on land subsidence and fault reactivation in the Louisiana coastal zone. J. Coast. Res. 23, 771–786. doi:10.2112/05-0553
Cloern, J. E., Foster, S. Q., and Kleckner, A. E. (2014). Phytoplankton primary production in the world’s estuarine-coastal ecosystems. Biogeosciences 11, 2477–2501. doi:10.5194/bg-11-2477-2014
Droppo, I. G. (2001). Rethinking what constitutes suspended sediment. Hydrol. Process. 15, 1551–1564. doi:10.1002/hyp.228
Droppo, I. G., Leppard, G. G., Flannigan, D. T., and Liss, S. N. (1997). The freshwater floc: a functional relationship of water and organic and inorganic floc constituents affecting suspended sediment properties. Water, Air, Soil Pollut. 99, 43–53. doi:10.1007/bf02406843
Droppo, I. G., and Ongley, E. D. (1994). Flocculation of suspended sediment in rivers of southeastern Canada. Water Res. 28, 1799–1809. doi:10.1016/0043-1354(94)90253-4
Dunne, K. B. J., Nittrouer, J. A., Abolfazli, E., Osborn, R., and Strom, K. (2024). Hydrodynamically-driven deposition of mud in river systems. Geophysical Research Letters. doi:10.1029/2023GL107174
Eisma, D. (1986). Flocculation and de-flocculation of suspended matter in estuaries. Neth. J. Sea Res. 20, 183–199. doi:10.1016/0077-7579(86)90041-4
Gibbs, R. J. (1985). Estuarine flocs: their size, settling velocity and density. J. Geophys. Res. Oceans 90, 3249–3251. doi:10.1029/jc090ic02p03249
Griffin, G. M. (1962). Regional clay-mineral facies—products of weathering intensity and current distribution in the northeastern gulf of Mexico. Geol. Soc. Am. Bull. 73, 737–767. doi:10.1130/0016-7606(1962)73[737:rcfowi]2.0.co;2
Ingebritsen, S. E., and Galloway, D. L. (2014). Coastal subsidence and relative sea level rise. Environ. Res. Lett. 9, 091002. doi:10.1088/1748-9326/9/9/091002
Keyvani, A., and Strom, K. (2013). A fully-automated image processing technique to improve measurement of suspended particles and flocs by removing out-of-focus objects. Comput. Geosciences 52, 189–198. doi:10.1016/j.cageo.2012.08.018
Lai, H., Fang, H., Huang, L., He, G., and Reible, D. (2018). A review on sediment bioflocculation: dynamics, influencing factors and modeling. Sci. total Environ. 642, 1184–1200. doi:10.1016/j.scitotenv.2018.06.101
Lamb, M. P., de Leeuw, J., Fischer, W. W., Moodie, A. J., Venditti, J. G., Nittrouer, J. A., et al. (2020). Mud in rivers transported as flocculated and suspended bed material. Nat. Geosci. 13, 566–570. doi:10.1038/s41561-020-0602-5
Lee, B. J., Hur, J., and Toorman, E. A. (2017). Seasonal variation in flocculation potential of River Water: roles of the organic matter pool. Water 9, 335. doi:10.3390/w9050335
Lee, B. J., Kim, J., Hur, J., Choi, I. H., Toorman, E. A., Fettweis, M., et al. (2019). Seasonal dynamics of organic matter composition and its effects on suspended sediment flocculation in river water. Water Resour. Res. 55, 6968–6985. doi:10.1029/2018wr024486
Maggi, F. (2009). Biological flocculation of suspended particles in nutrient-rich aqueous ecosystems. J. Hydrology 376, 116–125. doi:10.1016/j.jhydrol.2009.07.040
Manning, A. J., and Dyer, K. R. (1999). A laboratory examination of floc characteristics with regard to turbulent shearing. Mar. Geol. 160, 147–170. doi:10.1016/s0025-3227(99)00013-4
Mehta, A. J. (1986). “Characterization of cohesive sediment properties and transport processes in estuaries,” in Estuarine cohesive sediment dynamics. Lecture notes on coastal and estuarine studies (New York: Springer), 290–325.
Mietta, F., Chassagne, C., Manning, A., and Winterwerp, J. (2009). Influence of shear rate, organic matter content, pH and salinity on mud flocculation. Ocean. Dyn. 59, 751–763. doi:10.1007/s10236-009-0231-4
Osborn, R., Dillon, B., Tran, D., Abolfazli, E., Dunne, K. B. J., Nittrouer, J. A., et al. (2021). FlocARAZI: an in-situ, image-based profiling instrument for sizing solid and flocculated suspended sediment. J. Geophys. Res. Earth Surf. 126, e2021JF006210. doi:10.1029/2021jf006210
Osborn, R., Dunne, K. B. J., Ashley, T., Nittrouer, J. A., and Strom, K. (2023). The flocculation state of mud in the lowermost freshwater reaches of the Mississippi river: spatial distribution of sizes, seasonal changes, and their impact on vertical concentration profiles. J. Geophys. Res. Earth Surf. 128, e2022JF006975. doi:10.1029/2022jf006975
Rabalais, N. N., Turner, R. E., and Wiseman, W. J. (2002). Gulf of Mexico hypoxia, aka the dead zone. Annu. Rev. Ecol. Syst. 33, 235–263. doi:10.1146/annurev.ecolsys.33.010802.150513
Ross, M. A., and Mehta, A. J. (1989). On the mechanics of lutoclines and fluid mud. J. Coast. Res. 1989, 51–62.
Sionneau, T., Bout-Roumazeilles, V., Biscaye, P., Van Vliet-Lanoe, B., and Bory, A. (2008). Clay mineral distributions in and around the Mississippi river watershed and northern gulf of Mexico: sources and transport patterns. Quat. Sci. Rev. 27, 1740–1751. doi:10.1016/j.quascirev.2008.07.001
Sprague, H., Nelson, T., Weikmann, A., Norman, D., and Gong, D. (2023). 2023 draft coastal master plan: project definition. Version I.
Tran, D., and Strom, K. (2017). Suspended clays and silts: are they independent or dependent fractions when it comes to settling in a turbulent suspension? Cont. Shelf Res. 138, 81–94. doi:10.1016/j.csr.2017.02.011
Turner, R. E., and Rabalais, N. N. (1994). Coastal eutrophication near the Mississippi river delta. Nature 368, 619–621. doi:10.1038/368619a0
Verney, R., Lafite, R., and Brun-Cottan, J.-C. (2009). Flocculation potential of estuarine particles: the importance of environmental factors and of the spatial and seasonal variability of suspended particulate matter. Estuaries coasts 32, 678–693. doi:10.1007/s12237-009-9160-1
Verney, R., Lafite, R., Brun-Cottan, J. C., and Le Hir, P. (2011). Behaviour of a floc population during a tidal cycle: laboratory experiments and numerical modelling. Cont. Shelf Res. 31, S64–S83. doi:10.1016/j.csr.2010.02.005
Watanabe, K., Kasai, A., Antonio, E. S., Suzuki, K., Ueno, M., and Yamashita, Y. (2014). Influence of salt-wedge intrusion on ecological processes at lower trophic levels in the Yura Estuary, Japan. Estuar. Coast. Shelf Sci. 139, 67–77. doi:10.1016/j.ecss.2013.12.018
Winterwerp, J. C. (1998). A simple model for turbulence induced flocculation of cohesive sediment. J. hydraulic Res. 36, 309–326. doi:10.1080/00221689809498621
Winterwerp, J. C., Manning, A. J., Martens, C., De Mulder, T., and Vanlede, J. (2006). A heuristic formula for turbulence-induced flocculation of cohesive sediment. Estuar. Coast. Shelf Sci. 68, 195–207. doi:10.1016/j.ecss.2006.02.003
Keywords: flocculation, Gulf of Mexico, Mississippi River, mud, sediment
Citation: Abolfazli E, Osborn R, Dunne KBJ, Nittrouer JA and Strom K (2024) Flocculation characteristics of suspended Mississippi River mud under variable turbulence, water and salt sources, and salinity: a laboratory study. Front. Earth Sci. 12:1268992. doi: 10.3389/feart.2024.1268992
Received: 28 July 2023; Accepted: 22 January 2024;
Published: 21 February 2024.
Edited by:
Andrew James Manning, HR Wallingford, United KingdomReviewed by:
Carl Friedrichs, William & Mary’s Virginia Institute of Marine Science, United StatesCopyright © 2024 Abolfazli, Osborn, Dunne, Nittrouer and Strom. This is an open-access article distributed under the terms of the Creative Commons Attribution License (CC BY). The use, distribution or reproduction in other forums is permitted, provided the original author(s) and the copyright owner(s) are credited and that the original publication in this journal is cited, in accordance with accepted academic practice. No use, distribution or reproduction is permitted which does not comply with these terms.
*Correspondence: Kyle Strom, c3Ryb21AdnQuZWR1
†Ryan Osborn, U.S. Department of Agriculture, Natural Resources Conservation Service, Boise, ID, United States
Disclaimer: All claims expressed in this article are solely those of the authors and do not necessarily represent those of their affiliated organizations, or those of the publisher, the editors and the reviewers. Any product that may be evaluated in this article or claim that may be made by its manufacturer is not guaranteed or endorsed by the publisher.
Research integrity at Frontiers
Learn more about the work of our research integrity team to safeguard the quality of each article we publish.