 Rizwan Sadiq
 Zainab Akhtar
 Steve Peterson
 Katelyn Keegan2
 Muhammad Imran
 Ferda Ofli
94% of researchers rate our articles as excellent or good
Learn more about the work of our research integrity team to safeguard the quality of each article we publish.
Find out more
BRIEF RESEARCH REPORT article
Front. Earth Sci., 06 April 2023
Sec. Geohazards and Georisks
Volume 11 - 2023 | https://doi.org/10.3389/feart.2023.990930
This article is part of the Research TopicAdvances in the Assessment, Monitoring and Mitigation of Multi-Hazard Risks for Critical InfrastructuresView all 4 articles
Social media can play an important role in current-day disaster management. Images shared from the disaster areas may include objects relevant to operations. If these objects are identified correctly, they can offer a preliminary damage assessment report and situational awareness for response and recovery. This research is carried out in collaboration with a Community Emergency Response Team (CERT) to understand the state-of-the-art object detection model’s capability to detect objects in multi-hazard disaster scenes posted on social media. Specifically, 946 images were collected from social media during major earthquake and hurricane disasters. All the images were inspected by trained volunteers from CERT and, 4,843 objects were analyzed for applicability to specific functions in disaster operations. The feedback provided by the volunteers helped determine the existing model’s key strengths and weaknesses and led to the development of a disaster object taxonomy relevant to specific disaster support functions. Lastly, using a subset of classes from the taxonomy, an instance segmentation dataset is developed to fine-tune state-of-the-art models for damage object detection. Empirical analysis demonstrates promising applications of transfer learning for disaster object detection.
In the aftermath of a large-scale disaster, it is important to assess the impacted area to identify obstacles and hazards that may impede response or present risk to the safety of both victims and responders. During disasters over the past decade, social media has provided immediate raw data from eyewitnesses (Purohit and Peterson, 2020), including imagery. These images can show damages and hazards valuable for responders preparing to deploy into the area. For example, designating and operating safe staging areas. Many studies have been conducted to gather, annotate, and analyze the social media disaster images to determine the disaster type, damage severity level, and humanitarian impact, among others (Nguyen et al., 2017; Alam et al., 2018; Mouzannar et al., 2018; Li et al., 2019; Alam et al., 2020; Weber et al., 2020).
While these studies mainly focused on classifying the image into different categories, they fail to consider each individual object’s importance within the image to disaster support functions. Although some researchers attempted to detect objects affected by fire (Antzoulatos et al., 2020) and other disaster types (Asif et al., 2021), their research lacks participation and guidance from emergency managers.
Targeted objects in social media images can aid humanitarian organizations in identifying, planning, and implementing immediate actions. This multidisciplinary collaboration amongst computer scientists, emergency managers, and volunteers attempt to aid response and speed recovery in hurricanes and earthquakes. In addition to seeking evidence that supports the strengths and weaknesses of object detection models, this work explores whether an artificial intelligence model can detect and label relevant objects in disaster images. We focus on transportation and debris management-related support functions, because of their frequent involvement in response and recovery during both earthquakes and hurricanes. As an example, an image containing visual evidence of obstructions on a roadway may consequently disrupt transportation routes during response thus forcing responders to find alternate routes into the disaster area.
Our underlying hypothesis is that although current state-of-the-art object detection models perform well in detecting intact/undamaged objects, their performance degrades significantly when exposed to damaged objects, which are common to observe during a disaster event. Additionally, these current models were not developed for nor designed by emergency managers and thus lack a quantity of terms relevant to functions performed during response and recovery. For this purpose, a group of skilled volunteers from CERT analyzed the output of off-the-shelf models to determine the accuracy of the predictions they make. The feedback provided by experts helps us determine key strengths and weaknesses of the state-of-the-art deep learning model in detecting and categorizing objects. Furthermore, we propose an extensive disaster object taxonomy that can be used in future studies to annotate new datasets for objects affected during a disaster and training deep learning models tailored for recognizing damaged objects during a disaster. Lastly, using a small subset of classes from the taxonomy, we annotate the first-of-its-kind disaster object dataset to train deep learning models for the instance segmentation task. Our quantitative analysis reveals significant performance improvements for the detection of damaged objects when fine-tuned on our dataset.
Our contributions in this paper are as follows.
1) To the best of our knowledge, this is the first attempt to test and improve the performance of state-of-the-art object detection models for damaged object detection.
2) Conducted a comprehensive qualitative analysis of the strengths and weaknesses of state-of-the-art object detection models in disaster scenarios.
3) Developed a disaster object taxonomy for disaster response by involving emergency managers.
4) Developed a first-of-its-kind damaged object instance segmentation dataset and performed empirical analysis to highlight models’ weaknesses and strengths when fine-tuned.
This work aims to understand the effectiveness of deep learning-based object detection models to detect objects in a disaster scene. These models can be helpful to the community during natural disasters by providing real-time damage assessments. The detection and localization of damaged objects can be used to guide rescue and relief operations, as well as to direct resources to the areas that need them most. But, in order to build such models by computer scientists, humanitarian experts need to identify the most important objects and the impact types for rescue, response, and damage assessment.
To perform the data analysis, 1,000 test images were selected from the MEDIC dataset (Alam et al., 2021). MEDIC was chosen due to its diversity in event coverage and availability of damage severity labels. Images with damage severity levels “severe or mild” and event types “hurricane, typhoon, and earthquake” were included in this study. For better visual analysis, images with resolution less than 500×500 pixels were excluded. Later, a manual inspection was performed to warrant the quality and relevancy of the selected images for the study. The final dataset consists of 946 images where 476 images are from earthquakes and 470 images from hurricane events.
Deep learning models can identify objects in an image in one of these ways: i) Object Detection (Girshick et al., 2014) where the model detects the object and its corresponding bounding box; ii) Semantic Segmentation (Girshick et al., 2014) where the model performs per-pixel prediction for each class by treating multiple objects of the same class as a single entity; iii) Instance Segmentation (Dai et al., 2016) where the model also performs per-pixel prediction of specified classes, but treats multiple objects of the same class as distinct individual instances; and, iv) Panoptic Segmentation (Kirillov et al., 2019b) where the model combines the concept of semantic and instance segmentation and assigns two labels (a semantic label and an instance id) to each of the pixels.
For quality assessment, we chose 11 off-the-shelf state-of-the-art open-source models. It is important to note that for quality assessment of these models, we did not perform any model training, and only those models were included in this study, where corresponding trained weights were available. For the object detection task, we chose YOLOv51 and Soft Teacher (Xu et al., 2021) trained on the COCO dataset (Lin et al., 2014), and Faster R-CNN (Ren et al., 2015) trained on the PASCAL-VOC dataset (Vicente et al., 2014). For the semantic segmentation task, we chose BEiT (Bao et al., 2021) and MaskFormer (Cheng et al., 2021) trained on the ADE20K dataset (Zhou et al., 2017), MaskFormer trained on the Cityscapes dataset (Cordts et al., 2016), and MaskFormer trained on the Mapillary Vistas dataset (Neuhold et al., 2017). For the panoptic segmentation task, we chose MaskFormer trained on the ADE20K dataset and Panoptic FPN (Kirillov et al., 2019a) trained on the COCO-Stuff dataset (Caesar et al., 2018). For the instance segmentation task, we chose Mask R-CNN (He et al., 2017) trained on the Cityscapes dataset and Mask R-CNN trained on the LVIS dataset (Gupta et al., 2019). Figure 1 illustrates the output of all the models on a sample image.
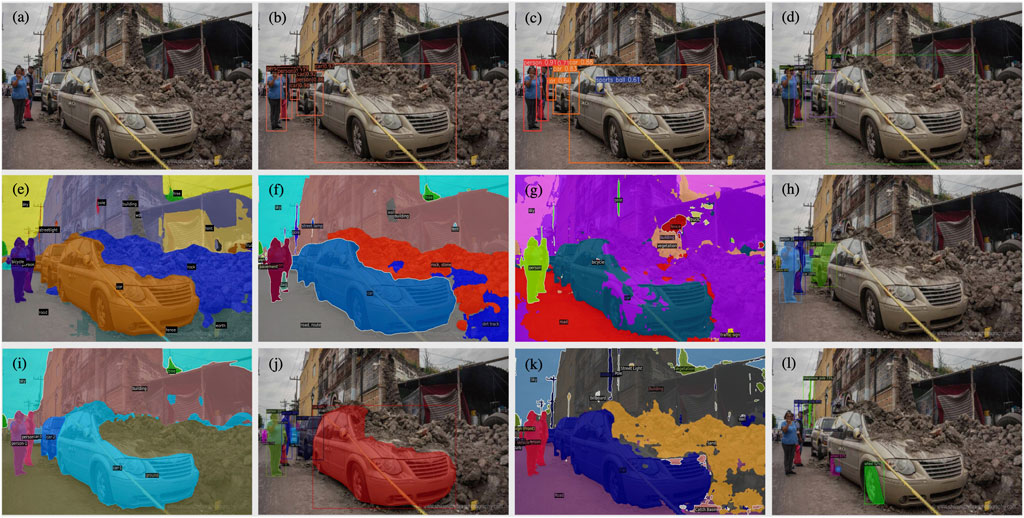
FIGURE 1. (A) Input image; Object Detection: (B) YOLOv5 on COCO, (C) Soft Teacher on COCO, (D) Faster R-CNN on PASCAL-VOC; Semantic Segmentation: (E) BEiT on ADE20K, (F) MaskFormer on ADE20K, (G) MaskFormer on Cityscapes (K) MaskFormer on Mapillary Vistas; Panoptic Segmentation: (I) MaskFormer on ADE20K (J) Panoptic FPN on COCO-Stuff; Instance Segmentation: (H) Mask R-CNN on Cityscapes (L) Mask R-CNN on LVIS.
After manually analyzing the predictions of each model on an initial set of 50 images, we decided to use the MaskFormer model trained on the ADE20K dataset for panoptic segmentation as our final model for analyzing the complete set of 946 images. We selected this model due to its ability to predict many outdoor objects (e.g., buildings, bridges, cars, roads, trees, etc.) where the majority of them are instance-based with the exception of buildings as seen in Figure 1I. Moreover, this model produced much smoother segmentation masks around varying object sizes and scales, and did not include noisy and irrelevant objects like curb and catch basin as seen in Figure 1K. One common shortcoming of the existing scene segmentation datasets (e.g., ADE20K, Cityscapes, Mapillary Vistas, and COCO-Stuff) is that they do not provide instance-level annotations of objects such as buildings and houses. Access to instance-level delineation can influence decision-making for responders. As an example, within an earthquake disaster scene, the quantity and different types of damaged structures could assist search and rescue team preparations for extricating trapped victims.
Eight volunteers from a Community Emergency Response Team (CERT)2 were carefully selected by a Certified Emergency Manager (CEM®).3 The CEM® designation is an internationally recognized professional certification for emergency managers earned by demonstrating a strong understanding of the emergency management field through knowledge, experience, work history, training, education, and professional contributions. All eight volunteers were previously trained in basic disaster response skills such as fire safety, light search and rescue, and disaster medical operations prior to the qualitative analysis. The CEM® briefed the volunteers on the goal of the analysis and trained them on how to use the user interface. The training was accomplished through a live demonstration of the interface using disaster images. Volunteers were split into two teams, with one team assigned earthquake images, and the other team assigned hurricane images.
The trained volunteers were instructed to assess all the objects identified or missed by the model using an instance-based approach. In other words, if there are three cars in the image, the volunteer was required to assess each car separately. The assessment of each object involved five types of human analysis. First, the volunteer identified whether the object was damaged or not (Yes or No). Secondly, they determined how easy it was to detect the object from a human perspective (Easy, Relatively Easy, Difficult, or Very Difficult). Thirdly, they assessed the accuracy of the model detection (Correct, Partially Correct, Incorrect, or Missed). In instances where the model incorrectly predicted an object, e.g., a car is mislabeled as a boat, the volunteers were instructed to input this error as an entry where the object is a ‘boat’, and the model prediction is ‘incorrect’. They were also expected to add another entry highlighting the object missed by the model, e.g., the object is a ‘car’, and the model detection is ‘missed’. To gain insights into how a volunteer concluded their assessment on an object, a feedback section was included for them to enter any observations pertaining to the evaluated object. Lastly, the volunteers identified the applicability of the object to transportation and/or debris management support functions.
To assist the human assessment of disaster object detected or missed by the model, a user interface was carefully designed to gather qualitative feedback from volunteers, as seen in Figure 2. Each of the eight volunteers was given individual page links with unique images to be assessed. For each image, the volunteers were instructed to analyze all the objects detected by the model and for any objects missed by the model to gather the following information for each object.
1) Damage: Whether the object shows any sign of damage or not, where the user has to select either “Yes” or “No.”
2) Human Detection: How easy it is to detect the object by the human eye, where the user has to select one of the following: “Easy,” “Relatively Easy,” “Difficult,” or “Very Difficult.”
3) Model Detection: How accurate the model detected the object, where the user has to select one of the following: “Correct,” “Partially Correct,” “Incorrect,” or ”Missed.”
4) Feedback: User feedback on the overall assessment of the object, where the input field has no word limit.
5) Mission Area Focus: Identifying whether an object impedes response operations, where the user can select “Transportation” and/or “Debris Management.” The user also has the option to select “Unable to Determine or N/A.”
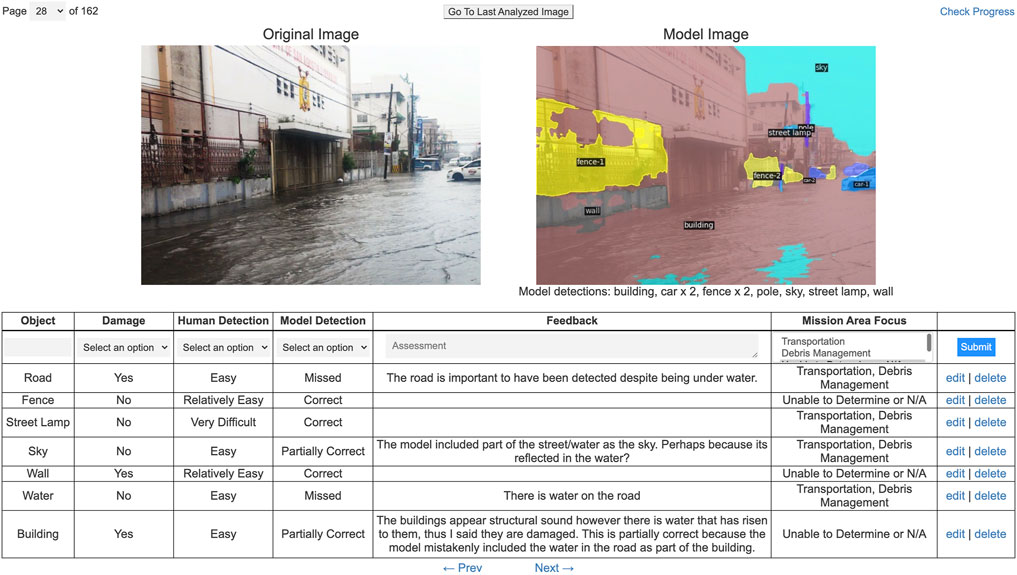
FIGURE 2. Web user interface.
Once the user fills in their evaluation for an object and clicks the submit button, their response gets saved to Redis, a NoSQL database. Once the insertion is complete, a retrieval request is made to immediately visualize the saved responses in the table below. Users also have the option to edit and delete their responses. The following features have been implemented to ensure maximum usability.
• Clicking on the original or model image opens the image in a new tab so users can easily zoom in.
• List of detected objects summarized under the model image.
• Page number is a dropdown field to not only show the current page but to allow users to easily navigate to any page/image they desire
• The “Go To Last Analyzed Image” button takes the user to where they last left off
• The “Check Progress” button opens a new window showing an “Assessed” and “Not Assessed” column. “Assessed” shows all the page numbers where they have inputted at least one record, whereas “Not Assessed” shows all the page numbers which have been untouched. This will help in identifying any missed pages.
The volunteers identified and assessed 2,344 objects for earthquakes and 2,499 objects for hurricanes from a pool of 946 disaster images. To ensure all the volunteer responses were standardized, we first conducted a quality assessment before analyzing all the responses.
In order to validate how well the evaluation protocol was followed by all the volunteers, the CEM® re-assessed 40 randomly selected images as ground truth which was then compared to the volunteers’ assessments. This helped us to identify discrepancies such as incorrectly identified objects and completely missed objects. Specifically, we found that 62% of objects assessed by the volunteers matched with the ground truth (i.e., true positives), whereas the volunteers identified 5% of the objects incorrectly (i.e., false positives) and failed to identify 33% of the objects in the ground truth (i.e., false negatives). Moreover, we computed Cronbach’s Alpha (Cronbach, 1951) to measure the consistency between volunteers and ground truth across damage (0.85), human detection (0.98), and model detection (−0.61) assessments. The scores for damage and human detection indicate strong agreement. However, the model detection score shows almost no agreement due to two varying styles of volunteers, stringently or leniently. These varying styles led to disagreements in the model detection assessments, where some volunteers who are very strict would put ‘incorrect’ when the prediction is slightly off, as compared to lenient volunteers who would put ‘correct’.
Some objects have a significant gap in quantity between hurricanes versus earthquakes. This indicates that not all disaster types are the same, and therefore, object relevancy can differ or is dynamic. For example, trees, houses and water are three objects with the highest differential favouring hurricanes, as this disaster brings flooding, which is not often observed in earthquake images. Whereas, for earthquakes, the top two objects include persons and debris, which is explainable as earthquakes cause structural collapses resulting in rubble and debris that search and rescue teams (person) dig through in search of survivors. A complete list of differentials can be found in the Supplementary Material.
Our analysis provided us with some further insights into the differences between the two disasters. For example, earthquake-induced debris such as damaged buildings and bridges are localized and do not spread across wider regions. In contrast, hurricane debris is an accumulation of multiple sources of damage, i.e., destroyed structures, trees, household objects, etc., which can spread out great distances. Another difference we identified is that the damage from earthquakes is more often apparent than hurricane damage. Earthquake images show clear signs of damage, e.g., a destroyed building, cracked roads, broken poles, and damaged cars. On the other hand, hurricane images show objects submerged in water, e.g., buildings, cars, poles, vegetation, etc., that do not appear damaged. Apart from these differences, we also observed some similarities between model predictions across both disaster types. The model tends to consider the context of other objects in the image and tries to connect one object to another; for example, the model often correlates the ground with stones, sidewalk with person, floor to ceiling, and road to vehicle. We also observed that the model struggles to accurately classify objects when the weather is hazy or when the image is taken from an aerial view.
Object detection models are trained for specific tasks (e.g., autonomous driving), and the taxonomy is tailored for that specific task. In this study, we focused on analyzing the strengths and weaknesses of the model’s detection for objects relevant to disasters only. We chose to ignore the objects (e.g., indoor objects) which are irrelevant for disaster response. While the most common strengths and weaknesses are summarized below, the full list of objects considered for inclusion in the taxonomy can be found in the Supplementary Material.
1) Buildings that are easy to detect by humans and have zero to medium damage are accurately predicted by the model whether the building is in the far distance or nearby.
2) In most cases, undamaged vehicles are accurately predicted (at certain angles when the whole vehicle is seen) by the model whether the object is in the foreground or in a very far distance (where the object is very small).
3) Model can correctly predict undamaged/slightly damaged road in the presence of road markings, separator, guardrail, and vehicles.
4) Model can successfully predict and differentiate between different types of agriculture, e.g., trees, palm trees, grass, plant, etc.
1) Debris causes other object predictions to be inaccurate.
2) Larger objects can overshadow the prediction of other relatively smaller objects.
3) Due to higher variations in flood water, e.g., muddy water, clear water, water with debris, etc., model predictions are not always correct.
4) Vehicles and other objects almost fully submerged in water or fully/partially damaged, makes it hard for the model predictions.
5) Damage level to the object affects the performance of the model prediction, i.e., higher the damage, poorer the performance.
In assessing the 946 earthquake and hurricane disaster images for object relevance using 150 pre-existing model-generated objects, we discovered nearly half were related to interior objects, disqualifying them from being relevant to transportation and/or debris removal operations. At the conclusion of the assessment, volunteers had generated additional relevant objects leading to the determination that a disaster object class and sub-class taxonomy was needed. Given the scope, magnitude, and complexity (Hughes et al., 2014) of earthquakes and hurricanes, compounded by the number of varying disaster response support functions4 often found in such large-scale disasters, we limited the building of a taxonomy using disaster object classes and sub-classes relevant to transportation and debris management. We were able to create three classes and 10 sub-classes, which together contained 106 relevant objects. The following steps were conducted in generating the taxonomy.
1) A complete list of objects from both disasters with their counts were recorded.
2) A relevancy score was assigned to each object where the following scale was used: 3 = relevant to both transportation and debris removal; 2 = relevant to one and not the other; 1 = potentially relevant to some other disaster operation; 0 = irrelevant to any disaster operation.
3) Objects with low frequency and zero relevance were excluded from further analysis.
4) Each remaining object was assigned to its corresponding class, considering it can be applicable to one or more support functions.
The first class “Natural and Living” consists of two sub-classes. The Natural sub-class contains 11 objects, e.g., sky, mountain, and hill, whereas the Living sub-class contains four objects: person, victim, dog, and other animals. The second class “Transportation, Infrastructure and Utilities” consists of three sub-classes. The Transportation sub-class contains land, maritime, and aerial transportation where only the land transportation is sub-divided into three categories, where objects are classified as light/medium vehicles, heavy vehicles, or emergency response vehicles. In total, 17 objects are identified across the three types of transportation with an addition of seven inanimate objects and one other vehicle object. The Infrastructure sub-class consists of seven objects, e.g., structure, bridge, highway, and tower, whereas the Utilities sub-class contains eleven objects, e.g., utility pole, power lines, cables, and transformer. The third class “Debris Removal, Response, Shelter” consists of four sub-classes and a debris category. The objects in the Structural sub-class can solely be a structure, e.g., house, a component of a structure, e.g., wall, or a material used to build the structure, e.g., brick. Therefore, this sub-class is sub-divided into Structure, Components and Materials where a total of 32 objects are included. The Response Equipment sub-class consists of nine objects which are also sub-divided into three categories to differentiate heavy, light and emergency equipment. The Shelter sub-class consists of five objects, e.g., tent, and tarp. The Communication sub-class only contains satellite dishes. Of the 106 objects in the taxonomy, 59 objects were identified by humans, e.g., transformers, rescue/response vehicles, and fire hydrant, whereas the remaining 47 objects were already part of the model. Refer to Supplementary Material for the hierarchical diagram of taxonomy where the human-identified objects are highlighted with an asterisk and the objects are color coded based on the relevancy score. A full hierarchal diagram of disaster object taxonomy can be seen in the Supplementary Material.
Although building models for damaged object detection requires bigger efforts in terms of annotating a large-scale dataset with damaged objects and their impact types, this section lays down a foundation for this bigger goal by demonstrating the effectiveness of transfer learning to fine-tune state-of-the-art object-detection models on a small dataset consisting of both undamaged and damaged objects. To this end, this section presents details of data annotation of damaged objects in disaster images, models fine-tuning, and their results.
Of all 946 images used for the qualitative analysis, we randomly selected 500 images (250 from earthquakes + 250 from hurricanes) to perform manual annotations of individual objects. Specifically, paid workers from the Amazon Mechanical Turk (AMT) platform were tasked to perform instance segmentation. Out of all classes presented in the taxonomy (described in Section 4), the manual annotation was restricted to six classes, namely,: bridge, building, road, car, pole, and tree. For each class, we also introduced a damaged version of it (e.g., damaged bridge, damaged car, damaged building). In total, 12 classes were used for the manual annotation. These classes were selected based on their frequency of occurrence in the disaster images and also by taking into consideration the amount of damage incurred by an object. All 500 images were annotated by AMT workers. Next, we visually inspect all the annotations and separate a subset of 30 images as a test set (by preserving the occurrence of each class) for the performance evaluation. The remaining 470 images are used as our training set. In total, 7,331 and 558 labeled instances of all classes appear in the training and test sets, respectively. The distribution of the labels can be found in the Supplementary Material.
Two experiments are performed to empirically evaluate the performance of off-the-shelf models for damage object detection. First, existing models are used as-is (without fine-tuning) to perform instance segmentation. However, in the second experiment, models are first fine-tuned before the evaluation. Two state-of-the-art instance segmentation models, i.e., 1) Mask-RCNN with Resent-50-FPN trained over the COCO dataset and 2) Mask2Former with Resnet50 trained over the Cityscapes dataset are used for these experiments. Initial weights of both models are obtained from the Detectron2 library. Average Precision (AP) is used to evaluate the performance of the models. It is worth noting that no instance segmentation models exist which can identify structural objects such as buildings, bridges, walls, poles. Thus, the only overlapping class where we can compare the models’ performance in damage scenes is “Car”. Therefore, in our first experiment, we use both models (without fine-tuning) for comparing their performance on different variations of the car class, i.e., Car with damaged and undamaged instances, Car with undamaged, and Car with damaged instances. However, in the second experiment, we fine-tune both models using the training set and measure their performance for all 12 classes on the test set.
Table 1 presents the results of both off-the-shelf models (i.e., without fine-tuning) when applied to different variations of the car class, i.e., damaged, undamaged, and a combination of both. Although both models yield reasonable performance on undamaged car instances (i.e., the second row in Table 1), they perform poorly for damaged car instances (i.e., the third row in Table 1). As these models are not trained on damaged car objects, their low performance is justified. However, can these models be fine-tuned to improve their damaged object detection performance? Our next experiment exactly answers this question, as described below.
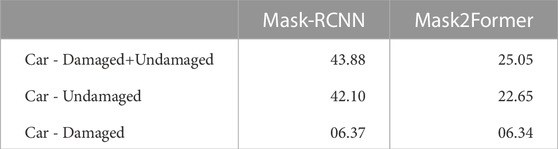
TABLE 1. Performance in terms of AP’s of off-the-shelf instance segmentation models (without fine-tuning) on different variations of Car class instances.
Table 2 presents the results of the fine-tunned models for all 12 classes. The instance segmentation performance of both models is reasonable for undamaged classes except building, tree, road, and pole classes. As the main focus of this experiment is to determine the effectiveness of fine-tuned models for detecting damaged objects, we observe a substantial improvement in the case of the damaged car class. Recall that the APs of both models without fine-tuning were 6.37 for Mask-RCNN and 6.34 for Mask2Former (as shown in the third row of Table 1). However, the fine-tuned versions of the models yield significantly higher APs for the damaged car class, which are 40.13 for Mask-RCNN and 57.52 for Mask2Former (as shown in Table 2). Additionally, the damaged road class observes a high AP compared to the undamaged road. While the damaged building class observers reasonably better performance, the damaged tree, and damaged pole classes are on the lower end.
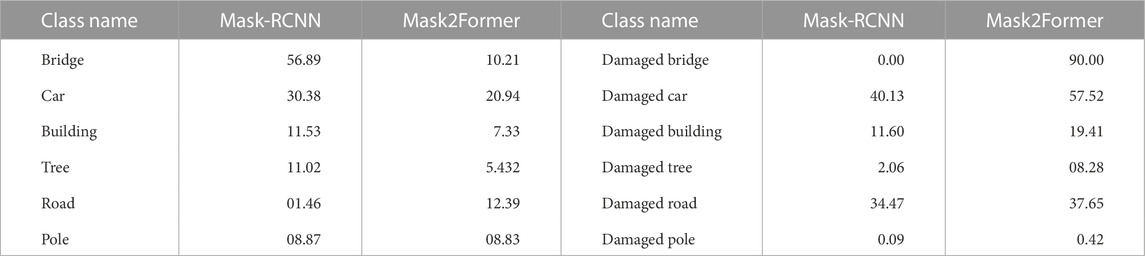
TABLE 2. Class-wise AP for fine-tuned Mask-RCNN and Mask2Former over the test set.
The reason for car performance degradation after fine-tuning can be explained by considering them as two not easily separable classes. Since the original off-the-shelf models were trained with tens of thousands of intact/undamaged cars, they perform well in that case. But, when the model is fine-tuned with the inclusion of damaged car instances, it causes confusion between cars and damaged cars, especially when the damage is not clearly visible enough, hence affecting the performance of intact cars. But for damaged cars, fine-tuned models outperformed off-the-shelf models by a long margin (57% vs. 6%). Figure 3 presents the visual predictions of ground-truth vs. model predictions over the test set from Mask-RCNN and Mask2Former. It is apparent that models perform a decent job in differentiating damaged objects from undamaged ones. Both models show promising capability to perform under different lighting conditions (3 (b,c)). These results clearly support the need for a new dataset and a new taxonomy tailored for disaster-related objects.
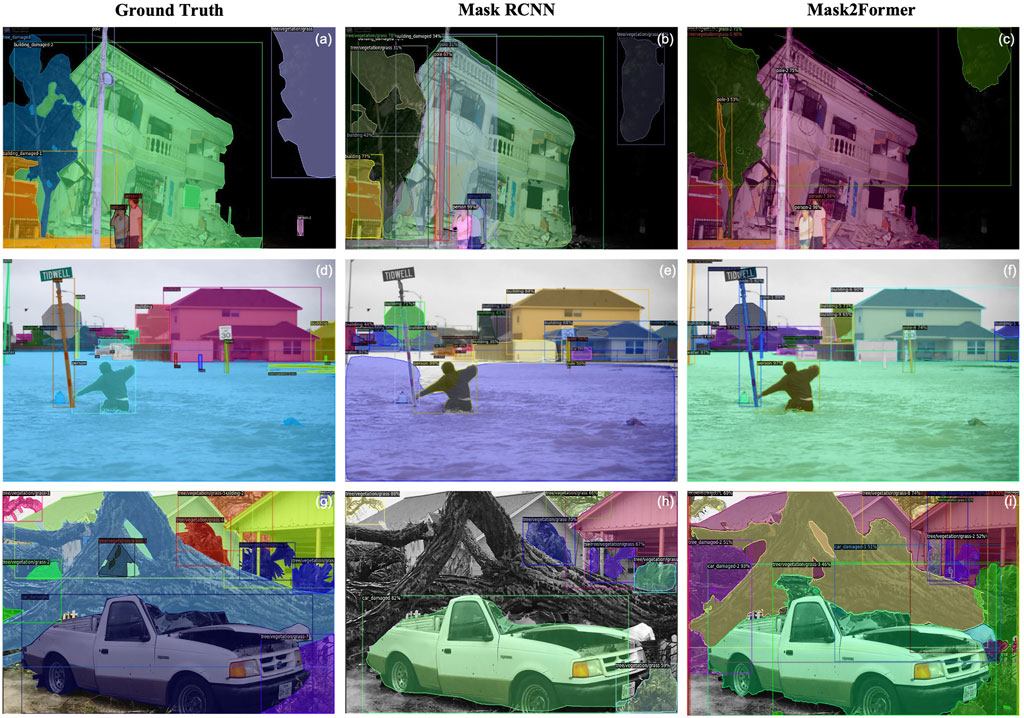
FIGURE 3. Ground-truth annotations (A,D and G); Mask-RCNN instance segmentation model predictions (B,E and H); Mask2Former instance segmentation model predictions (C,F and I).
This study was performed to emphasise on the need of a object detection during disaster events. A qualitative approach was taken to involve a CEM® to train volunteers from a CERT to assess the performance of an existing object detection model in predicting objects in earthquake and hurricane images. Through an extensive analysis of all the volunteer assessments, key strengths and weaknesses of the model were identified which then led to the development of a disaster taxonomy consisting of 106 object classes. A quantitative comparison of state of the art off-the-shelf models trained without any disaster related images was also conducted with the models fine tuned with images exhibiting enough damage. This analytical study led us to believe that there is a need to collect more data in line with the object categories related to disaster scenario, to develop a dataset more relevant to disaster operations which has not been fully developed yet. This dataset can then be used to further enhance the current deep learning models for disaster object detection. While this study focused on two disaster response support functions, it would be worth replicating the study for different support functions such as “Search and Rescue” and “Communications.” The assessments from this new study can be merged with this paper’s findings to create a more comprehensive taxonomy with objects being valuable across multiple other disaster operation functions besides transportation and debris management.
The original contributions presented in the study are included in the article/Supplementary Material, further inquiries can be directed to the corresponding author.
MI, FO, RS, and ZA contributed to the conception and design of the study. AE and RS organized the database. RS performed the experimental setup for quantitative and qualitative analysis. SP and KK contributed to setting up volunteers and performing qualitative analysis. All authors contributed to the manuscript writeup, revision, read, and approved the submitted version."
This publication was made possible by BFC grant #BFC03-0630-190011 from the Qatar National Research Fund (a member of Qatar Foundation). The findings herein reflect the work, and are solely the responsibility, of the authors. The authors would like to gratefully acknowledge the financial support of the project Re-Energize Governance of Disaster Risk Reduction and Resilience for Sustainable Development (Re-Energize DR3) provided by the Belmont Forum’s first disaster-focused funding call DR3 CRA Joint Research, which was supported by the Ministry of Science and Technology (MOST) of Chinese Taipei in partnership with funders from Brazil (FAPESP), Japan (JST), Qatar (QNRF), the United Kingdom (UKRI), and the US (NSF).
The authors declare that the research was conducted in the absence of any commercial or financial relationships that could be construed as a potential conflict of interest.
All claims expressed in this article are solely those of the authors and do not necessarily represent those of their affiliated organizations, or those of the publisher, the editors and the reviewers. Any product that may be evaluated in this article, or claim that may be made by its manufacturer, is not guaranteed or endorsed by the publisher.
The Supplementary Material for this article can be found online at: https://www.frontiersin.org/articles/10.3389/feart.2023.990930/full#supplementary-material
1ultralytics/yolov5: v6.0
3https://www.iaem.org/certification/intro
4https://www.fema.gov/emergency-managers/national-preparedness/frameworks/response
Alam, F., Ofli, F., and Imran, M. (2018). “CrisisMMD: Multimodal twitter datasets from natural disasters,” in Proceedings of the International AAAI Conference on Web and Social Media ICWSM. doi:10.1609/icwsm.v12i1.14983
Alam, F., Ofli, F., Imran, M., Alam, T., and Qazi, U. (2020). “Deep learning benchmarks and datasets for social media image classification for disaster response”. In 2020 IEEE/ACM International Conference on Advances in Social Networks Analysis and Mining (ASONAM), pages 151–158. doi:10.1109/asonam49781.2020.9381294
Alam, F., Alam, T., Hasan, M., Hasnat, A., Imran, M., Ofli, F., et al. (2021). Medic: A multi-task learning dataset for disaster image classification. arXiv preprint arXiv:2108.12828.
Antzoulatos, G., Giannakeris, P., Koulalis, I., Karakostas, A., Vrochidis, S., and Kompatsiaris, I. (2020). A multi-layer fusion approach for real-time fire severity assessment based on multimedia incidents. In ISCRAM, pages 24–27.
Asif, A., Khatoon, S., Hasan, M. M., Alshamari, M. A., Abdou, S., Mostafa Elsayed, K., et al. (2021). Automatic analysis of social media images to identify disaster type and infer appropriate emergency response. J. Big Data 8 (1), 83–28. doi:10.1186/s40537-021-00471-5
Bao, H., Dong, L., and Wei, F. (2021). Beit: Bert pre-training of image transformers. arXiv preprint arXiv:2106.08254.
Caesar, H., Uijlings, J., and Ferrari, V. (2018). “Coco-stuff: Thing and stuff classes in context.” In 2018 IEEE/CVF Conference on Computer Vision and Pattern Recognition CVPR, pages 1209–1218. doi:10.1109/cvpr.2018.00132
Cheng, B., Schwing, A., and Kirillov, A. (2021). Per-pixel classification is not all you need for semantic segmentation. In NeurIPS.
Cordts, M., Mohamed, O., Ramos, S., Rehfeld, T., Enzweiler, M., Benenson, R., et al. (2016). “The cityscapes dataset for semantic urban scene understanding.” In 2016 IEEE Conference on Computer Vision and Pattern Recognition (CVPR), IEEE, pages 3213–3223.
Cronbach, L. J. (1951). Coefficient alpha and the internal structure of tests. Psychometrika 16 (3), 297–334. doi:10.1007/bf02310555
Dai, J., He, K., and Sun, J. (2016). “Instance-aware semantic segmentation via multi-task network cascades.” In 2016 IEEE Conference on Computer Vision and Pattern Recognition (CVPR), pages 3150–3158. doi:10.1109/cvpr.2016.343
Girshick, R., Donahue, J., Darrell, T., and Malik, J. (2014). “Rich feature hierarchies for accurate object detection and semantic segmentation.” In 2014 IEEE Conference on Computer Vision and Pattern Recognition CVPR, pages 580–587. doi:10.1109/cvpr.2014.81
Gupta, A., Dollar, P., and Girshick, R. (2019). “Lvis: A dataset for large vocabulary instance segmentation.” In 2019 IEEE/CVF Conference on Computer Vision and Pattern Recognition (CVPR), pages 5356–5364. doi:10.1109/cvpr.2019.00550
Hughes, A. L., Peterson, S., and Palen, L. (2014). Social media in emergency management. In issues in disaster science and management: A critical dialogue between scientists and emergency managers. FEMA in Higher Education Program.
Kirillov, A., Girshick, R., He, K., and Dollár, P. (2019a). Panoptic feature pyramid networks. In CVPR, pages 6399–6408.
Kirillov, A., He, K., Girshick, R., Rother, C., and Dollár, P. (2019b). “Panoptic segmentation,” in 2019 IEEE/CVF Conference on Computer Vision and Pattern Recognition (CVPR), 9404–9413. doi:10.1109/cvpr.2019.00656
Li, X., Caragea, D., Caragea, C., Imran, M., and Ofli, F. (2019). “Identifying disaster damage images using a domain adaptation approach.” In ISCRAM.
Lin, T-Y., Maire, M., Belongie, S., Hays, J., Perona, P., Ramanan, D., et al. (2014). “Microsoft COCO: Common objects in context.” In Computer Vision – ECCV 2014,Lecture Notes in Computer Science, pages 740–755. doi:10.1007/978-3-319-10602-1_48
Mouzannar, H., Rizk, Y., and Awad, M. (2018). Damage identification in social media posts using multimodal deep learning. In ISCRAM.
Neuhold, G., Tobias, O., Bulo, S. R., and Kontschieder, P. (2021). “The mapillary vistas dataset for semantic understanding of street scenes.” In 2017 IEEE International Conference on Computer Vision (ICCV), pages 4990–4999. doi:10.1109/iccv.2017.534
Nguyen, D. T., Ofli, F., Imran, M., and Mitra, P. (2017). “Damage assessment from social media imagery data during disasters.” In Proceedings of the 2017 IEEE/ACM International Conference on Advances in Social Networks Analysis and Mining 2017 ASONAM. doi:10.1145/3110025.3110109
Purohit, H., and Peterson, S. (2020). “Social media mining for disaster management and community resilience,”. 978-3-030-48099-8 in Big data in emergency management: Exploitation techniques for social and mobile data. Editor Rajendra Akerkar (Cham: Springer), 93–107. doi:10.1007/978-3-030-48099-8_5
Ren, S., He, K., Girshick, R., and Sun, J. (2015). “Faster R-CNN: Towards real-time object detection with region proposal networks,” in IEEE Transactions on Pattern Analysis and Machine Intelligence NeurIPS, 39 6, 1137–1149. doi:10.1109/tpami.2016.2577031
Vicente, S., Carreira, J., Agapito, L., and Batista, J. (2014). “Reconstructing PASCAL VOC” In 2014 IEEE Conference on Computer Vision and Pattern Recognition CVPR, pages 41–48. doi:10.1109/cvpr.2014.13
Weber, E., Marzo, N., Papadopoulos, D., Biswas, A., Lapedriza, A., Ofli, F., et al. (2020). Detecting natural disasters, damage, and incidents in the wild. Comput. Vis. – ECCV 2020,Lecture Notes Comput. Sci., 331–350. doi:10.1007/978-3-030-58529-7_20
Xu, M., Zhang, Z., Han, H., Wang, J., Wang, L., Wei, F., et al. (2021). End-to-end semi-supervised object detection with soft teacher. arXiv preprint arXiv:2106.09018.
Keywords: object detection, instance segmentation, disaster management, social media, deep learning, disaster object taxonomy
Citation: Sadiq R, Akhtar Z, Peterson S, Keegan K, El-Sakka A, Imran M and Ofli F (2023) Towards fine-grained object-level damage assessment during disasters. Front. Earth Sci. 11:990930. doi: 10.3389/feart.2023.990930
Received: 11 July 2022; Accepted: 08 March 2023;
Published: 06 April 2023.
Edited by:
Francesca Bozzoni, Fondazione Eucentre, ItalyReviewed by:
Teng Wu, University at Buffalo, United StatesCopyright © 2023 Sadiq, Akhtar, Peterson, Keegan, El-Sakka, Imran and Ofli. This is an open-access article distributed under the terms of the Creative Commons Attribution License (CC BY). The use, distribution or reproduction in other forums is permitted, provided the original author(s) and the copyright owner(s) are credited and that the original publication in this journal is cited, in accordance with accepted academic practice. No use, distribution or reproduction is permitted which does not comply with these terms.
*Correspondence: Rizwan Sadiq, cnNhZGlxQGhia3UuZWR1LnFh
Disclaimer: All claims expressed in this article are solely those of the authors and do not necessarily represent those of their affiliated organizations, or those of the publisher, the editors and the reviewers. Any product that may be evaluated in this article or claim that may be made by its manufacturer is not guaranteed or endorsed by the publisher.
Research integrity at Frontiers
Learn more about the work of our research integrity team to safeguard the quality of each article we publish.