 Samuel J. Robb
 Brandon M. Boucher2
 James E. Mungall
 Jacob J. Hanley
94% of researchers rate our articles as excellent or good
Learn more about the work of our research integrity team to safeguard the quality of each article we publish.
Find out more
ORIGINAL RESEARCH article
Front. Earth Sci., 29 August 2023
Sec. Economic Geology
Volume 11 - 2023 | https://doi.org/10.3389/feart.2023.819109
This article is part of the Research TopicOre Formation and Critical Metal Deposits: Geological Contribution to the Clean Energy TransitionView all 6 articles
The first part of this article can be found here: 10.3389/feart.2023.819129 (DOI). Occurrences of significant concentrations of platinum-group elements (PGE) in porphyry deposits have seen limited attention and the geochemical controls on their deposition are poorly understood. New Afton is a late Triassic alkalic Cu-Au porphyry deposit situated 10 km west of Kamloops, British Columbia with Pt and Pd enrichments locally exceeding 30 ppm. Primary PGE deposition accompanied hypogene Cu-Au mineralization linked to potassic alteration, with Pt and Pd deportment dominated by their inclusion in early Ni- and Co-rich pyrite with secondary amounts of platinum-group minerals (PGM) mertieite-II, isomertieite > temagamite, and kotulskite. Secondary hydrothermal alteration of hypogene PGE-rich pyrite promoted remobilization of PGE, creating vein-controlled PGE enrichment where essentially all Pt and Pd are hosted by PGM dominated by temagamite > mertieite-II, and sperrylite, leaving behind complementary PGE-depleted domains. Thermodynamic modelling shows that primary co-precipitation of Pt with Co and Pd with Ni can be explained solely through the cooling of a hydrothermal system, regardless of whether the mineralizing fluid was a brine or a low-density vapour. Pd and Pt were transported from an underlying magma reservoir into the porphyry system by a magmatic-hydrothermal fluid as Cl− complexes. Pt-rich cobaltian pyrite formed at the highest temperatures, whereas Pd-rich nickeliferous pyrite formed at somewhat lower temperatures. Zonation of metals in pyrite suggests that PGE were incorporated in pyrite under conditions of fluctuating fluid temperatures during transport and cooling of orthomagmatic fluids during the main Cu-Au mineralization stage. There exists a hitherto overlooked potential for significant Pt and Pd mineralization in early hypogene pyrite that may be spatially separated from visible Cu mineralization, especially in potassic or ultrapotassic systems.
The New Afton mine is an alkalic Cu-Au porphyry deposit located approximately 10 km west of Kamloops, British Columbia. It is one of several alkalic porphyry deposits directly associated with the Late Triassic Iron Mask batholith in the Quesnel terrane of the Intermontane Belt (Logan & Mihalynuk, 2005). The mine has been in production since 2012 and is expected to continue producing until 2030. Current proven and probable reserves at New Afton are 47.3 Mt grading 0.66 g/t Au, 1.9 g/t Ag, and 0.77% Cu with an additional measured and indicated resource of 57 Mt grading 0.61 g/t Au, 2.1 g/t Ag, and 0.74% Cu (Lecuyer et al., 2020). New Afton is currently mined as an underground block caving operation and is situated below the historic Afton open pit mine, which was operated by Teck Corporation from 1978 until 1991. Prior to its acquisition by New Gold Inc the deposit was known to host potentially economic to sub-economic grades of platinum-group elements (PGE), particularly Pd (Thompson et al., 2002; Nixon, 2003).
Porphyry deposits containing Cu and Au are generated by mantle-sourced arc magmas with subalkaline to strongly alkaline affinities (Lang et al., 1995; Richards, 2011), which are commonly referred to as alkalic in the sense of MacDonald and Katsura (1964). The fertility of these arc magmas requires the removal of chalcophile elements from the mantle sulfide phases to the melt. Gold concentrations in the mantle are estimated at 1 ppb (McDonough & Sun, 1995; Saunders et al., 2018) and platinum-group element (PGE) concentrations are estimated at 6 ppb Pt and 5 ppb Pd (Barnes et al., 2015), with sulfide phases as the main hosts of these metals. Melting the mantle at oxidizing conditions destabilizes and removes sulfide phases, and the coexisting melt may then be enriched in Pt, Pd, and Au by an order of magnitude relative to their primitive mantle values (Mungall, 2002; Mungall et al., 2006). Palladium and Pt are mobile as both bisulfide and chloride complexes in hydrothermal fluids at temperatures, oxygen fugacities (fO2), and acidities (pH) relevant to conditions of porphyry formation (e.g., Hanley, 2005). If the PGE can be effectively transported from their mantle source to upper crustal levels, in a similar manner to Au, then these fertile, mantle-derived magmas with the potential to form Cu and Au porphyry deposits may also have the potential to form deposits of Pt and Pd.
The regional and local geological setting of New Afton is described in some detail in a companion paper (Boucher et al., 2023). New Afton is one of several Cu-Au porphyry deposits associated with the Iron Mask batholith (Figure 1). The batholith is a polyphase, silica-saturated alkalic intrusive complex that intruded the sedimentary and volcanic rocks of the coeval Nicola Group during the Late Triassic (Snyder & Russell, 1993). It is considered to consist of four distinct phases, from oldest to youngest: Pothook diorite, Hybrid Unit, Cherry Creek monzonite, and the Sugarloaf diorite (Stanley et al., 1994). At the New Afton property all Iron Mask phases apart from the Hybrid Unit are present; the Cherry Creek monzonite is the main intrusive phase, emplaced in the Nicola Group volcanic rocks ca. 204.5 ± 0.6 Ma (Figure 1; Mortensen et al., 1995). Individual strata of the Nicola Group in the New Afton area have not been correlated due to the large amount of alteration and structural modification. The group consists of picritic and andesitic flows, monomictic and polymictic tuffs and breccias. Along the eastern margin of the deposit, the Cherry Creek monzonite is in fault contact with a massive unit the mine geologists refer to as “picrite” (Figure 2), but which should better be classified as ankaramite due to the high modal abundance of clinopyroxene phenocrysts. The flow is thought to have acted as a chemical buffer during volatile exsolution by interacting with CO2-enriched fluids leading to the precipitation of Cu-Fe sulfides and focusing mineralization within the volcanic units east of the “picrite” (Nixon, 2003). The emplacement of the monzonite was controlled by a set of northeast trending faults named the Hanging wall fault (HWF), Footwall fault (FWF), and J-fault. The HWF strikes northeast, dipping along the contact of the picrite with the Nicola Group volcanic rocks.
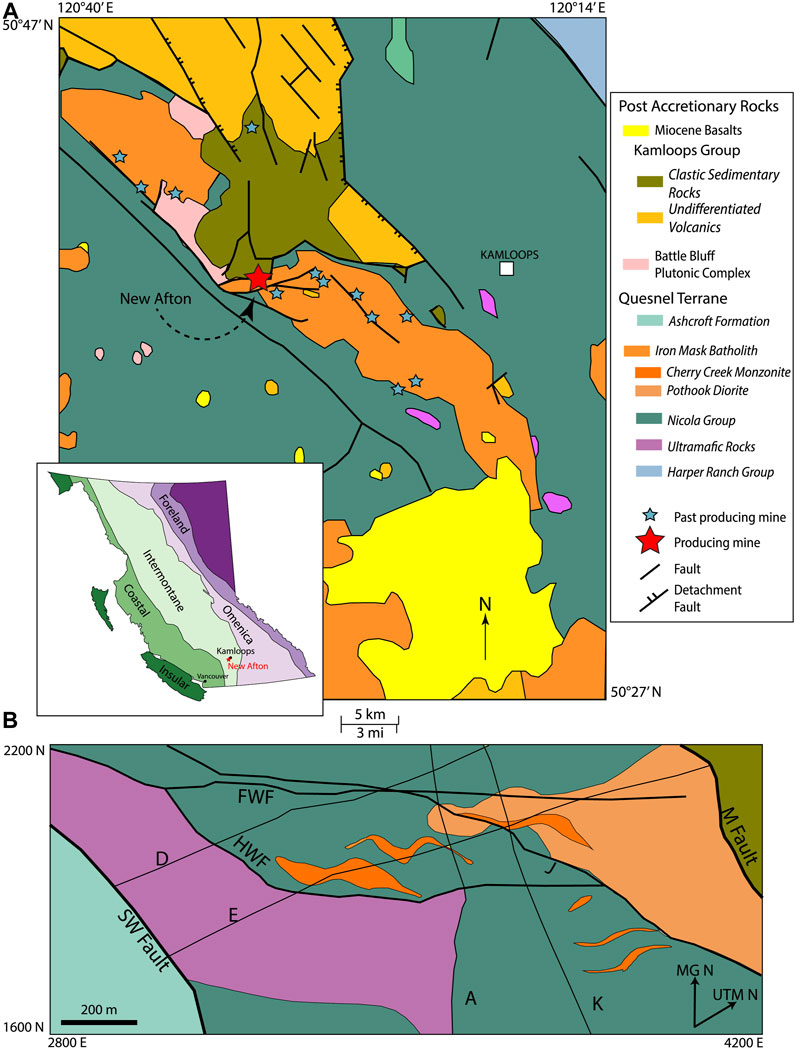
FIGURE 1. Regional and local geology around New Afton. (A) Regional geology around the Iron Mask batholith compiled from data from the British Columbia Geological Survey (Monger and McMillan, 1989). (B) Deposit geology around the New Afton mine property at −600 m below the surface. The coordinates of the deposit map are in Mine Grid, which is a 40 rotation of the UTM grid. Letters denote the fault names used by the New Gold geologists. Reproduced from Lipske and Wade (2014). Inset: Map of British Columbia and the five morphogeological belts that make up the Canadian Cordillera.
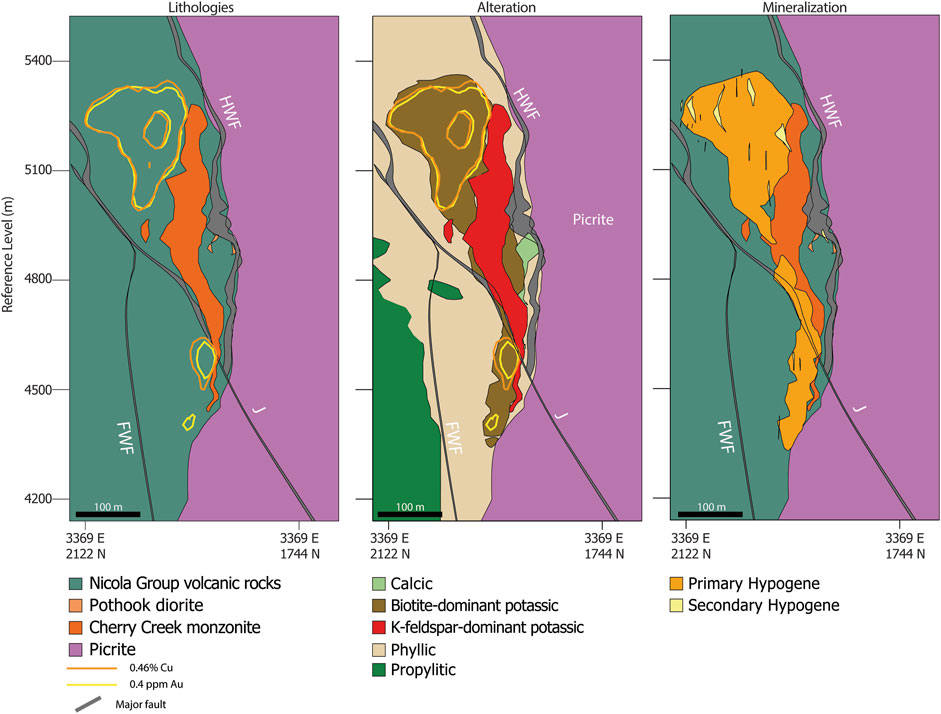
FIGURE 2. Cross sections of the New Afton deposit facing east showing major lithologies, alteration, and mineralization domains. The major pre-mineralization, regional faults (HWF, FWF, and J) are shown in each cross section. Copper and Au grade shells are plotted and are closely associated with the Cherry Creek monzonite and biotite-dominant potassic alteration. Depths are present in mine reference level, with the surface located at −5700 m.
Alteration paragenesis follows a model of early calcic and potassic alteration outward to propylitic assemblages (Lipske and Wade, 2014). Calcic alteration is characterized by large magnetite + apatite + actinolite veins with local pink potassium feldspar staining along their margins. The veins are generally a few centimeters to several meters wide but may reach up to 100 m in some localities (Lipske et al., 2018). Potassic alteration is defined by the assemblage K-feldspar-biotite ± magnetite ± quartz, and further subdivided as biotite-dominant and K-feldspar-dominant, based on the altered lithology (Lipske and Wade, 2014). Potassic-altered volcanic rocks of the Nicola Group are characterized by biotite > K-feldspar whereas K-feldspar-dominant potassic alteration is generally restricted to the Cherry Creek monzonite. In general, the potassic alteration halo is found adjacent to the northern margin of the Cherry Creek monzonite (Figure 2). Later phyllic alteration consists of the assemblage muscovite-carbonate-quartz-pyrite, encompassing a large portion of the deposit, and is predominately controlled by high-angle structures (Figure 2; Lipske et al., 2018). Late argillic alteration consists of kaolinite and white mica and is generally restricted to high angle faults crosscutting previously altered rocks.
Primary Cu-Au hypogene mineralization at New Afton is associated with biotite-dominant potassic alteration in Nicola Group volcanic rocks (Figure 2). Copper mineralization is present as chalcopyrite and local chalcopyrite + bornite. Gold is present as small inclusions of native Au and electrum in chalcopyrite and pyrite. A secondary hypogene mineralization event that was accompanied by argillic alteration occurred in the Late Jurassic ca. 155 Ma (unpublished whole-rock K-Ar date; Lipske et al., 2018), overprinting primary Cu-Au mineralization. Secondary hypogene mineralization is defined by the presence of tennantite-tetrahedrite as a part of the stable secondary mineral assemblage. A supergene enrichment zone containing native Cu occurs at the shallow levels.
Previous studies have documented elevated PGE concentrations and platinum-group minerals (PGM) in Cu flotation concentrates and bulk samples of alkaline and calc-alkaline porphyry deposits (Eliopoulos & Economou-Eliopoulos, 1991; Tarkian & Koopmann, 1995; Tarkian & Stribrny, 1999; Thompson et al., 2002; Auge et al., 2005; Economou-Eliopoulos, 2005). Potentially economic to sub-economic grades of PGE have been observed in alkalic deposits of the Canadian Cordillera, such as Mt. Milligan (LeFort et al., 2011), Galore Creek (Thompson et al., 2002), Whiterocks Mountain (Nixon and Carbno, 2001), and New Afton/Afton (Nixon, 2003; Garagan, 2014; Boucher et al., 2023; companion paper), but PGE source, transportation, and depositional controls remain enigmatic. The aim of this study is to elucidate the transportation and deposition of PGE in porphyry systems. Here, we show that hydrothermal PGE mineralization at New Afton occurred during the main stage of primary Cu-Au precipitation but was susceptible to secondary hydrothermal remobilization.
The samples used in this study are half core and quarter core from drill holes collected by New Gold Inc between 2001 and 2017. Samples from this archive were selected with guidance from the exploration department and through analysis of the New Afton drill assay database. Core samples with Pd concentrations >0.4 ppm over the 2-m assay interval were selected. These samples were taken from drill holes where Pd was either correlated with Au ± Cu or showed no correlation to any precious metal. The selected 2-m core intervals were then subsampled for separate lithologies at lengths between 5 and 30 cm. Overall, a total of 226 samples were collected from 23 drill holes that covered the vertical extent of the deposit (Figure 3).
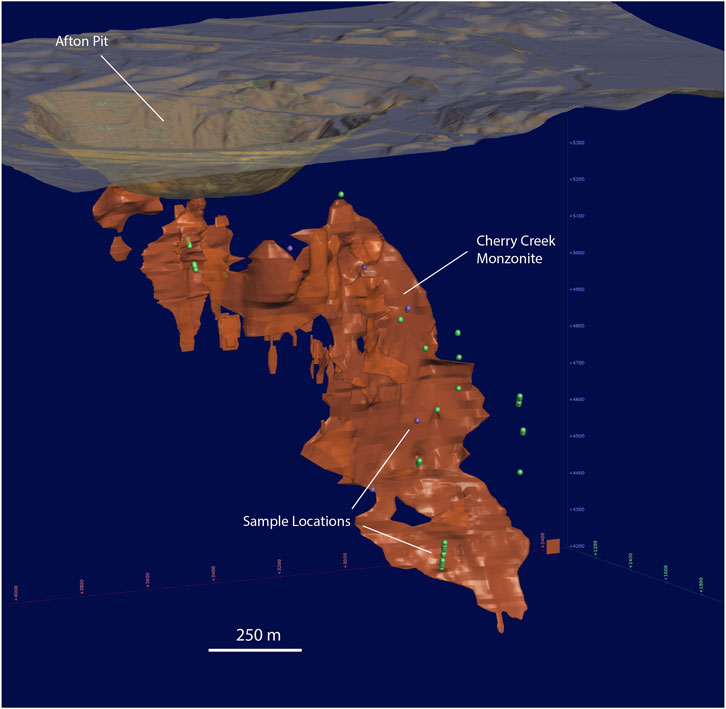
FIGURE 3. Locations of samples (at depth) used in this study. The figure shows the location of the collected samples in green (purple points are the locations of samples used for LA-ICPMS maps), against the Cherry Creek monzonite (orange). The historic Afton pit is above the shallowest parts of the porphyry.
A total of 218 samples were analyzed for their precious metal concentrations using Pb fire assay at Activation Laboratories in Ancaster, Ontario. The method allows for the accurate measurement of Au, Pt, and Pd with detection limits of 1 ppb, 0.1 ppb, and 0.1 ppb, respectively. An additional 6 samples were analyzed for precious metals at Geoscience Laboratories, Ontario Geological Survey, Sudbury, Ontario by solution ICP-MS after preconcentration by Ni-fire assay. The fire assay results were used to select a subset of 56 samples for petrographic analysis using a conventional transmitted and reflected light microscope.
Polished thin sections from representative samples of all styles of mineralization were scanned for platinum-group minerals (PGM) using a JEOL 6610LV scanning electron microscope (SEM) at the University of Ottawa, and a TESCAN MIRA 3 LMU VPS field emission SEM at Saint Mary’s University. Compositional analyses of some PGM were acquired on a JEOL JXA-8230 SuperProbe electron probe microanalyzer (EPMA) with 5 tunable wavelength dispersive spectrometers at the University of Ottawa. The PGM were analyzed for S, Pt, Pd, Fe, Cu, Hg, Sb, Te, Ag, and As using a 20 keV beam with a 40 nA current and 20 s count time for each element. The compositions of other PGM were determined using a TESCAN MIRA 3 LMU Variable Pressure Schottky Field Emission SEM at Saint Mary’s University, utilizing an Oxford Instruments X-max 80 mm2 silicon drift detector for energy dispersive spectroscopy (EDS) and involving a spectral collection time of 60 s per analysis. Routine analytical conditions were 25 kV accelerating voltage, 40 μA beam current, and a 17 mm working distance. The software package INCA (ETAS Embedded Systems Canada Inc.) was used for X-ray spectral analysis and quantification of PGM compositions.
SEM-based mineral liberation analysis (MLA) was conducted on three samples at Queen’s University in Kingston, Ontario following a two-step scanning protocol on polished thin sections. The instrument used was the FEI-MLA Quanta 650 FEG-ESEM with MAPS software. The protocol involved an initial 3-h scan (preliminary, major mineral phase) and a second 5-h scan focusing on areas containing high density precious metal and accessory minerals identified in the initial scan. Scanning was done to resolve grains as small as 0.1 μm. Collected spectral data were categorized into compositional groups, and then each domain was assigned a mineral species through comparisons with species in an in-house MLA database. The resulting data (PGE mineral identification, grain sizes and total species area, and locking relationships) were utilized in combination with SEM data for the same samples to generate a mass balance calculation for the proportion of PGE hosted within PGM (as a % of total PGE from assay). Data were collected from both Group 1 and 2 samples.
Statistical sorting and tests were conducted on the whole rock fire assay data (this study) and LA-ICPMS analyses of pyrite (Boucher et al., 2023; companion paper). The statistical analyses were completed in MATLAB® and Python.
Statistical sorting and tests were conducted on the whole rock fire assay data. Palladium, Pt, Au, and Pd-Au ratios determined via fire assay were sorted into statistically similar groups using k-means clustering. The method creates a group of k clusters from a set of n observations (where k ≤ n) by minimizing the total variance within each cluster. To determine the optimum number of clusters to use for the dataset, we iteratively maximized the mean silhouette number, or, informally, the average similarity of data within a cluster compared to other clusters, from 2 to 10 clusters. The optimum number of clusters given the fire assay data was found to be 3 (Supplementary Figure S1), a choice which was further supported by the textural and mineralogical similarities between samples within each of the three groups.
A principal component analysis (PCA) of the LA-ICPMS data for pyrite was performed to elucidate the statistical relationships between trace elements within the pyrite, recognized as an important host for the PGE (Boucher et al., 2023; companion paper). The analysis takes n observations of m variables as input, or each trace element analyzed in this case, and transforms them into a set of linearly independent variables, or principal components. The resulting principal components are weighted linear combinations of the input variables and are placed in descending order based on how much of the total variance of the dataset is contained within the component, such that principal component 1 (PC1) contains the largest proportion of the total variance, PC2 the second largest, and so on. Therefore, we can use only the first few principal components to describe most of the variance in the dataset. The loading of an input variable on a principal component is the weight of that variable within the component. The score of an observation is the value of the principal component given that observations data as input. The trace element data in this study were all recast to elemental molar values and log10-transformed prior to PCA such that the data are normally distributed.
The spatial distribution of PGE at New Afton was investigated on the deposit scale using the 3D geological modelling software Leapfrog Geo™ and the drill database provided by New Gold, Inc. Probability grade shells were created using radial basis function (RBF) interpolation with a predefined cut-off grade to create the indicator variable. High assay values were clipped using a top-cut value and the data were log-transformed prior to interpolation. A global trend oriented with a dip of 90, dip azimuth of 5, and a pitch of 70 and ellipsoid axis ratios of 3:2:1 was applied to the data to match the general shape of the ore body. The data were then interpolated using a spheroidal interpolant function that applies spatial weights to the data and estimates the grade shell boundaries.
Block kriging was performed to constrain the mineralizing domain of Pd, determine its spatial distribution, and to accurately estimate the amount of metal added to the system during hypogene enrichment. Spatial weightings used in the interpolation were estimated by computing anisotropic 3D variograms for each interpolated element. Spherical variogram models were used, and their parameters were determined by iteratively rotating the anisotropy ellipsoid to maximize the variogram sill along each axis. Variography was performed on normal-score transformed values and the variogram models were back-transformed prior to interpolation. Platinum assays are commonly at or below detection limit and higher values suffer from an extreme nugget effect. After back-transforming the Pt variogram model the nugget was only slightly lower than the total sill and so Pt tonnages could not be accurately estimated (Chiles and Delfiner, 2012).
Two separate block models were produced: one which encompassed the entire property and another that was constrained only to areas affected by hypogene (Cu-Au) mineralization as identified by core logging. The hypogene zone model was created to determine the spatial association and distribution of Pd in the deposit using blocks with a length of 5 m along each axis. Investigation of contact plots of mineralized domains, alteration domains, and lithological domains shows that Pd mineralization was primarily associated with whole rock hypogene mineralization. The property scale model was created to estimate the overall metal and sulfur enrichment at New Afton using blocks with a length of 10 m in each direction. Both models were validated using E-W, N-S, and depth swath plots against concurrently produced nearest neighbor and inverse-distance interpolations along with comparison of grade-tonnage curves between each method of interpolation. Metal grades interpolated on the property scale domain within the hypogene zone are compared against kriged grade interpolations constrained by the hypogene domain and were in reasonable agreement with one another; property-scale grades in general are lower due to the diluting effects of unmineralized domains outside the ore zone. The results are not representative of a resource calculation and are presented only as an order-of-magnitude evaluation of distal porphyry enrichment.
Fire assayed samples exhibited a wide range of Pt, Pd, and Au concentrations (Supplementary Figure S2). Samples range between 0.2 and 37800 ppb Pt, 0.5–33600 ppb Pd, and 3–18600 ppb Au. The data for Pt and Pd are both highly skewed to the left with a skewness of 14.3 and 7.1, respectively. Pd concentrations average 943 ppb, significantly higher than that of Pt at 228 ppb. Au is significantly more enriched on average than Pt and Pd, with an average of 1259 ppb. Calculated Pd/Au ratios of the assayed samples show three distinct populations within the data (Supplementary Figure S3). K-means clustering of Pt, Pd, Au, and Pd/Au in the assayed samples placed the samples into three groups: 1) high Pd, low Pd/Au (i.e., Au-rich samples), 2) high Pd, high Pd/Au (Au-poor samples), and 3) low Pd, variable Pd/Au (Figure 4). The fire assay data are summarized in Supplementary Table S1.
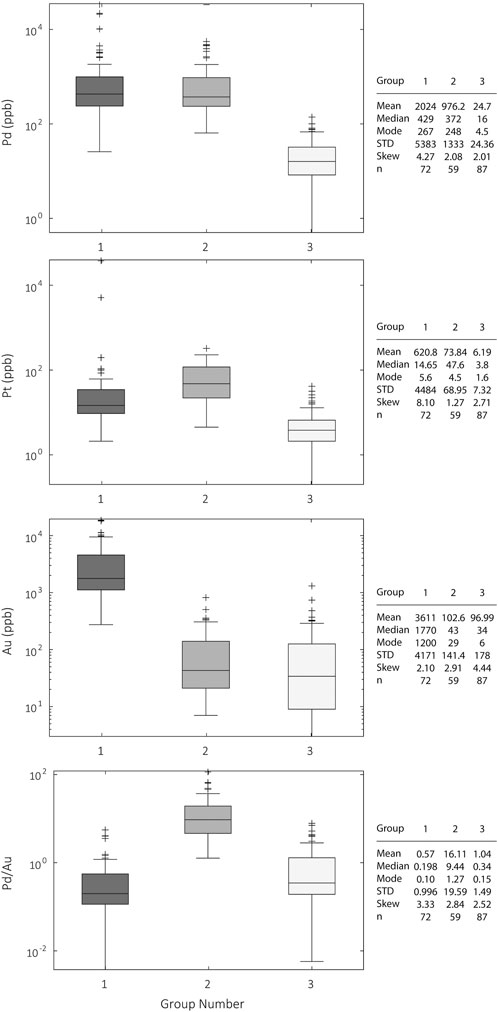
FIGURE 4. Distribution of Pd, Pt, and Au in the grouped samples. The data were grouped using a k-means clustering algorithm. Three clusters were selected as being the optimum number of clusters for the dataset, determined by iteratively maximizing the silhouette number for a range of cluster sizes and backed by mineralogical and textural similarities between samples in each group. The central line in each box is the median of the data and the top and bottom of the boxes are representative of the 75th and 25th percentiles. The whiskers correspond to ±2.7σ; outliers are all data plotted beyond the whiskers. The statistics of each group and shown on the right side of the figure. The sample groups are organized into: (1) high Pd, low Pd/Au, (2) high Pd, high Pd/Au, and (3) low Pd. The groups are considered to reflect different processes controlling Pd remobilization and deposition.
The k-means algorithm had no a priori information on the petrography of the samples prior to clustering. The sample groups (Group 1, Group 2, and Group 3) determined through k-means clustering are all distinct from one another, while the samples within each individual group are petrologically similar. Petrographic descriptions of the groups that were defined by k-means statistics are given below.
Samples in Group 1 are characterized by the presence of weakly to strongly disseminated, or vein-controlled chalcopyrite ± pyrite (Figure 5). Most of the samples in Group 1 have primary potassic alteration that may be variably overprinted by muscovite and/or clay minerals. Potassic alteration is dominated by K-feldspar and biotite with albite, quartz, and chlorite. Chlorite occurs either as an early alteration mineral replacing mafic phenocrysts from the host rock or as the retrograde alteration product, with Fe-Mg carbonates, of primary biotite; fine to coarse grained biotite is generally present in potassic-altered volcanic rocks that host hypogene sulfide mineralization, but is not consistently correlated with PGE enrichment and in many cases is altered to chlorite and carbonates. Strong potassic alteration, restricted to vein contacts where K-feldspar is the dominant alteration phase, is distinguished from potassic-altered monzonite by the lack of primary igneous textures (Figures 5A,B). Phyllic overprinting of early potassic alteration in Group 1 is marked by the breakdown of early feldspar to white mica and quartz (Figure 5B). Pyrite precipitated along with potassic alteration is characterized by an association with chalcopyrite and the mineral assemblage K-feldspar-biotite-chlorite-quartz (Figures 5A–D). The crystals are generally small (<75 µm) with a subhedral to euhedral cubic habit. Pyrite grains deposited during the later phyllic stage of alteration are large (>1 mm) and euhedral with cubic and dodecahedral habits surrounded by quartz and white mica. Magnetite-apatite veins with potassic alteration haloes are found in some samples, with magnetite having undergone partial martitization to hematite (Figure 5D).
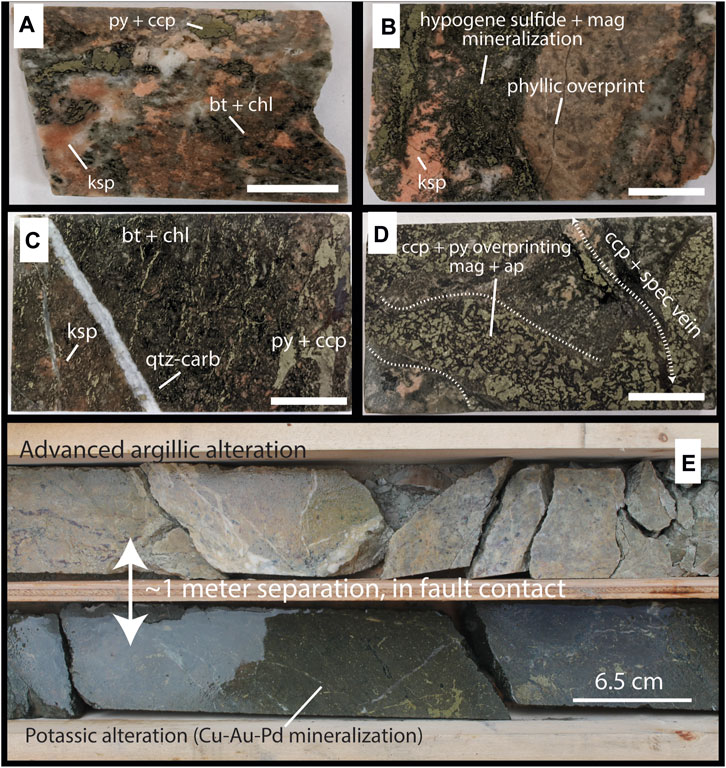
FIGURE 5. Representative Group 1 samples. The scale bars in (A) D are all 1 cm. Mineral abbreviations are: Ap—apatite, Bt—biotite, Carb—carbonate, Ccp—chalcopyrite, Chl—chlorite, Ksp—k-feldspar, Mag—magnetite, Py—pyrite, Qtz—quartz, Spec—specularite. (A) Hypogene sulfide mineralization surrounded by potassium feldspar dominant potassic alteration with biotite and chlorite. (B) Hypogene sulfide mineralization associated with potassium feldspar alteration in contact with volcanic rocks selectively overprinted by white mica and quartz. (C) Biotite dominant alteration with chalcopyrite + pyrite flooding. Early biotite is partially retrograde altered to chlorite. The sample is cut by a late quartz-carbonate vein with no visible surrounding alteration. (D) Early magnetite-apatite vein overprinted with primary hypogene Cu-Au-PGE mineralization, crosscut by a later chalcopyrite-specularite vein. (E) Potassically altered volcanic rocks (biotite-dominant) with chalcopyrite and pyrite (Cu-Au-Pd mineralization) in fault contact with highly argillic altered rocks whose primary lithology is completely overprinted.
All Group 1 samples were hosted by both monomictic and polymictic tuffs and andesite flows of the Nicola Group. Andesitic lavas are identified by the presence of relict amphibole, pyroxene, and feldspar phenocrysts within the altered samples. The samples within Group 1 may be found proximal to large scale brittle faults and fractures, but in these examples the cataclasite remains unmineralized with respect to PGE. Where Pd enrichment is spatially associated with later argillic alteration, the mineralization consistently occurs within potassic-altered volcanics in fault contact with the argillic alteration or within earlier hypogene sulfide assemblages; Group 1 PGE mineralization is hosted within sulfide-rich volcanic rocks where early potassic alteration has not been completely overprinted by later phyllic and argillic alteration (Figure 5E). Although some Group 1 samples are also associated with partially oxidized magnetite-apatite veins, they are distinguished from those in Group 2 by their association with early potassic alteration and abundant primary sulfide mineralization that is notably absent in all Group 2 samples.
All samples in Group 2 were located in the upper levels of the deposit, slightly below the supergene zone, and close to monzonite dykes. Group 2 samples are characterized by the presence of partially martitized magnetite, apatite, and carbonates (Figures 6A–C). Primary alteration facies are obscured by late structurally controlled carbonate alteration.
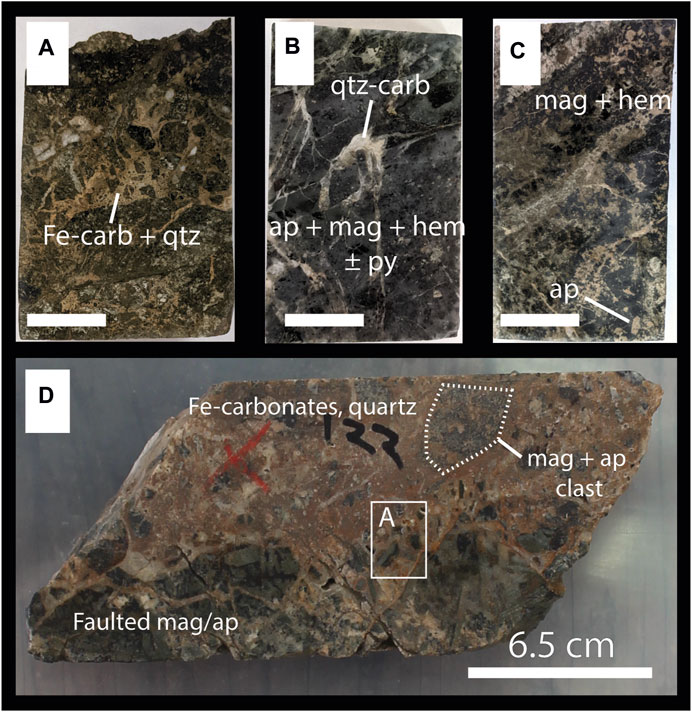
FIGURE 6. Representative Group 2 samples. The scale bars in (A–C) are all 1 cm. Mineral abbreviations are: Ap—apatite, Carb—carbonate, Hem—hematite, Mag—magnetite, Qtz—quartz. The group is dominated by early magnetite-apatite lodes that have been variably faulted and fractured and modified by late CO2-rich fluids. (A–C) Thin section blocks showing variations in mineralogy and textures involving carbonate fracture infill and breccia matrix hosting variably martitized magnetite-apatite-sulfide fragments. (D) Drill core segment showing massive carbonate-quartz matrix hosting magnetite-apatite breccia fragments. Area highlighted in white box corresponds to thin section area shown in frame (A).
Group 3 samples share similar mineralogical and textural characteristics as those in Group 2 except that magnetite has typically undergone complete martitization to hematite. The Group 2 and 3 samples are in direct contact with or within carbonate-cemented breccia, rubble, and fault gouge in the upper portions of the deposit (Figure 6D). Fe-rich carbonate minerals fill grain fractures and surround partially or fully martitized magnetite crystals. Chalcopyrite is generally absent in most samples but, where it is present, occurs only as fine, sporadic disseminations.
Samples of Cherry Creek monzonite tend to be extremely depleted in all precious metals relative to the mineralized portions of the deposit. However, in all analyzed monzonite samples, Pt, Pd, and Au were well above average continental crust concentrations. The monzonite is typically more enriched in both Pt and Pd relative to Au, unlike the primary hypogene mineralization associated with it. On average, the monzonite samples average 10.2 ppb Pt, 11.2 ppb Pd, and 7.8 ppb Au. In general, the monzonite is silica-undersaturated and predominantly consists of hematite-dusted alkali feldspar and plagioclase crystals and minor biotite. Miarolitic cavities approximately 2 cm in diameter are present within the center of the monzonite at the upper levels of the deposit and decrease in size and abundance moving outwards towards the edges of the stock. The quasi-spherical cavities contain a mineral assemblage of actinolite, chlorite, and minor epidote consistent with an outer propylitic alteration assemblage. A series of steeply dipping parallel veins with the same alteration mineralogy also appear within the center of the intrusion. The monzonite samples are all characterized by pervasive K-feldspar-dominant alteration with minor biotite. White micas are found along the contacts of the outer propylitic veins and miarolitic cavities. In all monzonite samples primary igneous textures and fabrics are visible and well preserved (Figure 7). Distinct textural changes occur laterally across the monzonite in the upper parts of the deposit. (Figure 7).
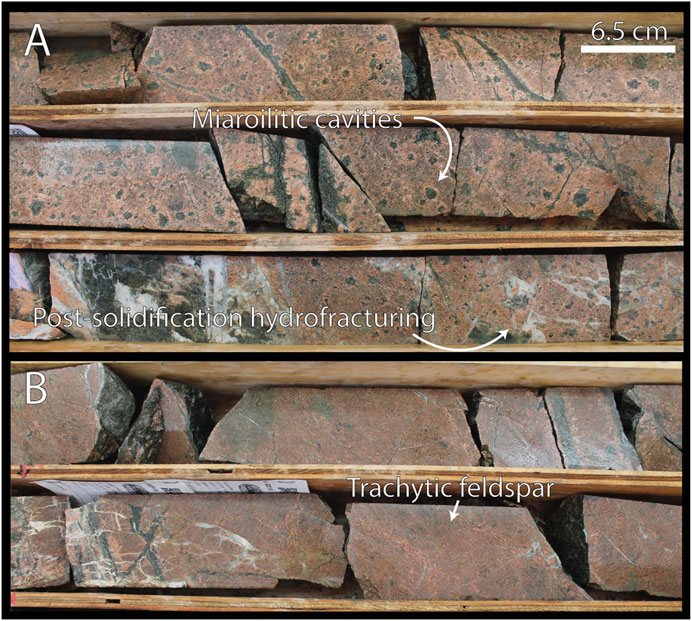
FIGURE 7. Cherry Creek monzonite as seen in drill core. The top photo (A) is in the center of a monzonite dyke in the upper levels of the deposit, (B) is approximately 10 m from the center, near the hornfelsed contact with Nicola volcanics. Abundant miarolitic cavities are present in the center of the intrusion accompanied by a set of parallel propylitic alteration veins. Primary igneous textures are visible in the samples, including the preservation of trachytic feldspars in (B). Post-solidification hydrofracturing with quartz-carbonate infill in present throughout the monzonite.
Thirty-one petrographic thin sections were selected for SEM imaging and EPMA/FE-SEM analysis based on their PGE concentrations and alteration lithofacies to identify the host minerals of PGE mineralization. Platinum-group minerals (PGM) were found in 15 of the 31 analyzed thin sections and are summarized in Supplementary Table S2. The PGM identified were dominantly temagamite (Pd3HgTe3), isomertieite (Pd11Sb2As2), mertieite-II [Pd8 (Sb,As)3], cooperite [(Pt,Pd)S], naldrettite (Pd2Sb), sperrylite (PtAs2), and unknown Pd-As-Sb(-Hg) phases. Moncheite [(Pt, Pd)(Te,Bi)2] and kotulskite [Pd (Te,Bi)2-x] were also observed (2 grains) but these Bi-bearing phases are rare, and the mineralogy is dominated by the Pd-Pt-Sb-As-Te-Hg phases. Samples that assayed Pd ± Pt each greater than 1 ppm with abundant sulfide mineralization (Group 1 samples) typically host visible PGM. Group 2 samples, characterized by elevated Pd and low Au along with the presence of martite and apatite, generally host fewer visible PGM grains. The grain size of the individual PGM identified varied between <1 μm and 90 μm and showed variable morphologies.
Group 1 samples with abundant disseminated sulfides or sulfide flooding host PGM either within chalcopyrite or along the grain boundary contacts of chalcopyrite and pyrite (Figure 8A). The Group 1 samples with visible (under petrographic microscope and/or SEM) PGM are listed in Supplementary Table S2. Individual PGM grains vary in size throughout the sample group but are on average larger than PGM found in Group 2. The largest grains occur along chalcopyrite-pyrite interfaces whereas smaller grains typically occur as stand-alone inclusions within chalcopyrite. Ag-telluride minerals (e.g., hessite) and electrum commonly occur associated with the PGM (Figures 8B,C). Pyrite is associated with samples that host PGM and is present as wispy stringers or euhedral grains within chalcopyrite (Figure 8D).
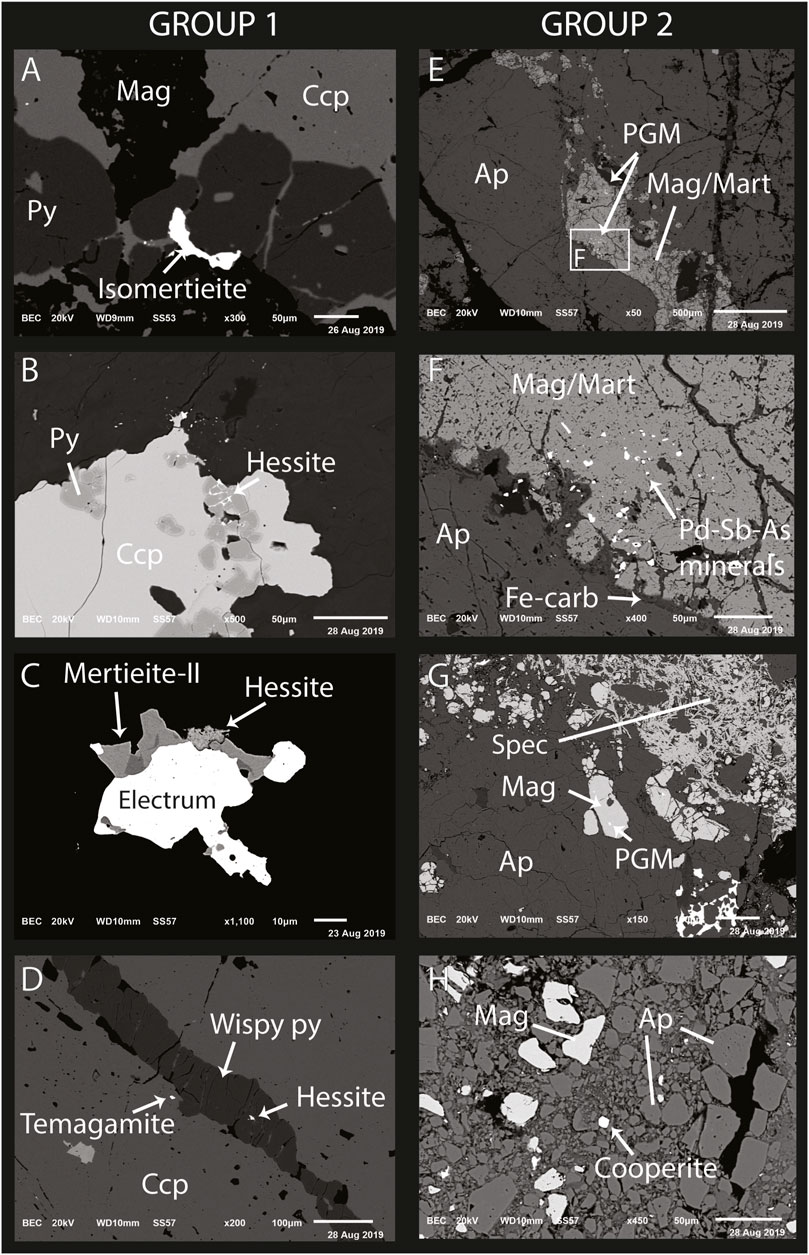
FIGURE 8. SEM-BSE images of platinum-group minerals from sample groups 1 and 2. Mineral abbreviations are: Ap—apatite, Carb—carbonate, Ccp—chalcopyrite, Mag—magnetite, Mart—martite, Py—pyrite, Spec—specularite (hematite). Platinum-group minerals (PGM) in Group 1 samples are associated with sulfide minerals (A–D), often occurring along chalcopyrite-pyrite grain boundaries (A and B) and intergrown with electrum and hessite (B and C). Group 2 samples, characterized predominately by the presence of magnetite and apatite (E–H), host their PGM as inclusions in partially martitized magnetite (E–G), in association with Fe-carbonates (F) and often near areas of structural modification (H).
Sample AF8103-052A hosts the largest PGM grains (e.g., Figure 8A) and also returned the highest assay values for Pt and Pd, at 37.8 ppm and 33.6 ppm, respectively. Individual PGM grains up to 90 μm occur along the contacts of chalcopyrite and pyrite with magnetite. Samples 052A and 052B are both polymictic volcaniclastic rocks characterized by pervasive alteration consisting of K-feldspar, biotite, and chlorite, in the clasts and chalcopyrite-pyrite overprinting of earlier magnetite-apatite veins. In both samples, PGM were restricted to the areas of sulfide flooding, with the clasts partially altered to white mica unmineralized with respect to PGE.
Platinum-group minerals were identified in four Group 2 samples (Supplementary Table S2). Samples UA7606-056, AF0135-122, and UA50-241.2 from the carbonate-healed faulted margins of massive, brecciated magnetite-apatite lodes (e.g., Figure 8D). Fe-carbonate alteration is present along magnetite grain boundaries and fractures. The PGM in sample AF0135-122 are located within pervasive magnetite between large apatite crystals, as well as within the carbonate-filled margins along magnetite grains (Figures 8E–G). Platinum-group minerals in UA7906-056 occur both in magnetite, in a similar style to the PGE mineralization in sample AF0135-122, and as discrete grains within brecciated apatite (Figure 8H). The Pd-rich PGM analyzed on the SEM (EDS) in samples AF0135-122 and UA7906-056 had no detectable concentrations of Pt. Rather, Pt mineralization was concentrated in a few sparse grains of cooperite (PtS). Sample EA13041-111 lacks the pervasive magnetite-apatite alteration of samples UA7606-056 and AF0135-122 and was instead dominated by K-feldspar crystals surrounded by chlorite. Platinum-group element mineralization in sample EA13041-111 is hosted by disseminated grains of mertieite-II and temagamite that form simple intergrowths with finely disseminated chalcopyrite.
The compositions of PGM from seven samples were quantified using EPMA and FE-SEM, with EMPA analyses (Supplementary Table S3) in fair agreement with the semiquantitative EDS analyses of PGM grains on the SEM, so SEM data are presented where EPMA data are absent. In general, Pd-bearing PGM are deficient in Pt. Temagamite has no detectable Pt in any analyzed grains. Isomertieite and mertieite-II has minor enrichments in Pt, up to 0.4 wt%, compared with 70 wt% Pd, on average. The main Pt-bearing phase (cooperite, Pt/Pd = 11.15) was only identified in one sample. All grains, except for cooperite, have detectable amounts of Ag, with the largest concentrations in isomertieite and mertieite-II. Two electrum grains were measured (Au = −82 wt%) and have elevated Pd concentrations of 0.25 and 0.27 wt%, respectively.
Mineral phases that occur in association with the PGM include an array of Ag-Au-Te-Bi-Se-Hg-Pb phases. These minerals were identified by SEM-EDS (and representative analyses provided in Supplementary Table S3) as hessite (Ag2Te), empressite (AgTe), petzite (Ag3AuTe2), kurilite (Ag8Te3Se), coloradoite (HgTe), kawazulite [Bi2 (Te, Se,S)3], bohdanowiczite (AgBiSe2), clausthalite (PbSe), and tellurobismuthite (Bi-Te). The Ag-Au-Te-Se-Hg phases dominate the assemblages, whereas Bi-bearing phases are rare.
The SEM and SEM-MLA data for three samples were used to estimate the proportion of Pd and Pt hosted within PGM. For the Group 1 samples (DDH UA44 and UA80; Pd = 436–2941 ppb; Pt = 29–80 ppb), SEM data (based on visual scans for PGM) predicts that between 6.6% and 9.7% of the total bulk rock Pd is hosted in PGM (mertieite-II, isomertieite > temagamite, kotulskite, unknown Pd-As-Sb-Hg phases) and negligible Pt is hosted in PGM (no Pt-bearing PGM detected by SEM). The highest-grade sample (2941 ppb) has the lowest contribution of Pd from PGM. The SEM-MLA data for these samples yielded a lower range of contribution of PGM to the bulk rock Pd (<2%). For the Group 2 samples (DDH UA50; Pd = 404–2627 ppb; Pt = 19–187 ppb), the SEM and SEM-MLA data predict that 100% of the Pd and Pt are hosted in PGM (temagamite > mertieite-II, sperrylite, cooperite).
Mass balance estimates show that > 90% of Pt and Pd are hosted by pyrite in Group 1 and 100% as PGM in Group 2 samples.
Probabilistic grade shells were created using indicator cut-off grades of 0.02, 0.07, and 0.1 ppm Pd with estimated probabilities greater than 50%. The value of 0.02 ppm Pd was selected to represent the limits of porphyry mineralization. Grade shells below these values expand out to the limits of the spatial extents of the data set covering the entire deposit. Furthermore, the average concentration of Pd in weakly altered Nicola Group volcanic rocks found in the assay database is 0.011 ppm. Although it is possible that the samples used in calculating the average underwent some minor degree of enrichment due to the New Afton hydrothermal system, these values combined with the observation that grade shells extend out to the limits of the extent of drilling on the property make it a reasonable assumption that the grades are representative of background PGE concentrations. The upper bound on the Pd grade shell (0.1 ppm) was selected to coincide with the average grade of Pd within the estimated mineral resource at New Afton (Bergen et al., 2015). The Cu and Au grade shells were created using cut-off grades of 4600 ppm and 0.4 ppm, respectively. These are the cut-off grades used in the New Afton resource model.
Palladium grades show varying degrees of lithological control at depth, either decreasing outwards, or being slightly offset, from the monzonite intrusion, or decreasing sharply over distances less than 10 m (Figures 9A–C). The latter case is generally restricted to areas where deposit-scale structures intersect. High Cu, Au, and Ag grades typically show the same pattern within the hypogene ore zone of the deposit. High Pd grade shells are offset from the highest grades of Cu and Au, with some minor overlap, such as in areas where grades decrease sharply due to fault offsets. The highest-grade zones of Pd are directly adjacent to the main monzonite stock below the 5000 m level and surrounding smaller monzonite dykes above the 5150 m level of the deposit, forming concentric grade shells with Pd decreasing away from the intrusion (Figure 9A). Sinuous monzonite dykes in the southern portion of the 5150 m deposit level are surrounded by outward-decreasing Pd grades and locally bounded to the north on the hanging wall side of the J-fault (Figure 9A). Some higher concentrations of Pd occur farther north, on the footwall side of the J-fault, along the southern contact of a monzonite dyke. This zone is continuous with the main body of Pd mineralization in the central part of the deposit, along with two small zones of low Pd grades at the intersection of the K-fault at Footwall fault (Figure 9A). Grade shells extending eastward of the main monzonite body in the central part of the deposit at the 5150 m level are generally low and extensive, while the northern edge, hosting the most Pd mineralization, abruptly drops from 0.2 ppm to <0.02 ppm over a few meters. The J-fault, slightly further north, dips south toward the monzonite, eventually following the plunge of the intrusion at depth.
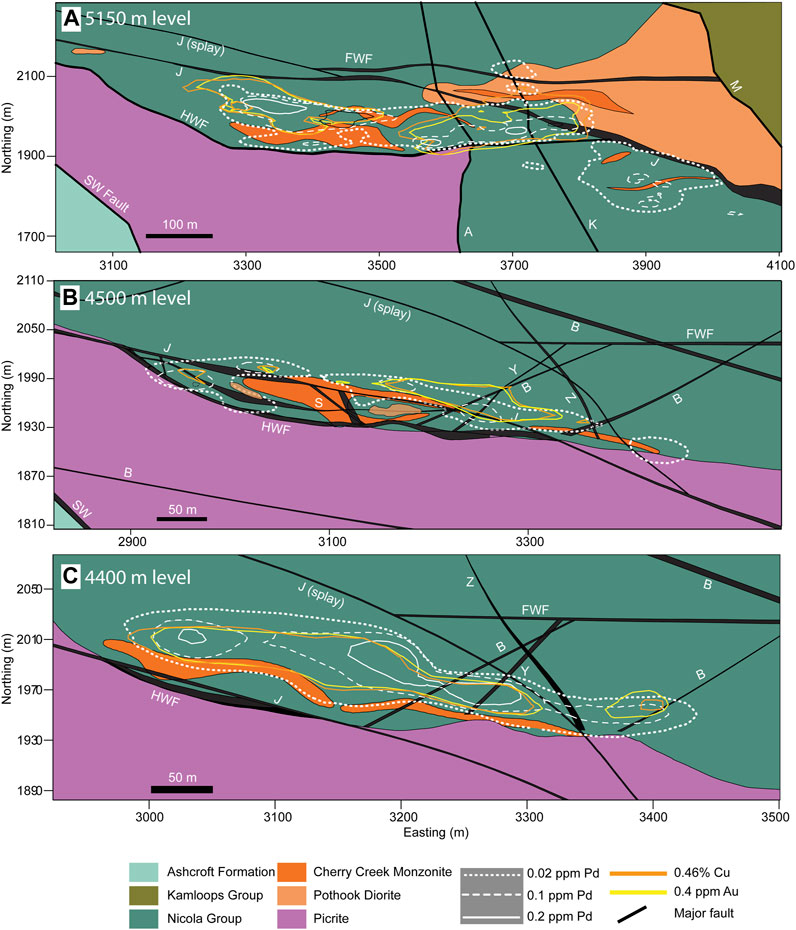
FIGURE 9. Plans of Pd grade shells at (A) 500 m, (B) 1200 m, and (C) 1300 m below the surface. Palladium grade shells are in all instances associated with the Cherry Creek monzonite intrusion but are affected in their extent largely by the surrounding deposit-scale structures. Grade shells either extend outwards without disruption or abruptly decrease over a few meters. The highest Pd grades are adjacent to the monzonite, but closely associated with similar lineation.
Lower in the deposit, Pd grades are highest close to the main monzonite porphyry body (Figure 9B). Along the western monzonite-volcanic contact, grade shells wrap around the intrusion, but the porphyry itself is unmineralized. An elongate 0.02 ppm grade shell extends along the northern margin of the intrusion, eastward and parallel to the J-fault until its termination at the intersection of the B and Z-faults (Figure 9B). Copper, Au, and Ag enrichment is absent in the western PGE mineralization but follows the eastward trending shell. Isolated porphyritic fingers of the Pothook diorite are found intermingled with the monzonite at and above the 4500 m level shown in Figure 12B. Moving a further 100 m lower, the J-fault continues dipping south and is offset from Pd mineralization (Figure 9C). Here, Pd grades follow the northern margin of the intrusion, with the highest values (>0.2 ppm) slightly offset from the monzonite. The eastern and western edges of the grade shell extend outwards towards background Pd levels. A high-grade zone is present ∼25 m away from the main intrusion, extending south towards the intrusion but sharply terminated to the north. Both Cu and Au concentrations coincide with Pd. The J-fault splay to the north dips southerly and wraps around the monzonite and joins at both ends to the main J-fault.
Utilizing the complete LA-ICPMS data set for pyrite from Boucher et al. (2023, companion paper) correlation matrix of all the analyzed elements was generated and corresponding Pearson correlation coefficients (r) were calculated for both individual pyrite crystals (extracted from laser mapping data) and deposit-scale pyrite (spot data; Supplementary Figures S4, S5). Of the precious metals (Pt, Pd, Au, Ag), Pd and Ag are the most abundant and similarly distributed with concentrations between 0.01 and 30 ppm and 0.47 and 30.5 ppm, respectively (Figure 10). Although the amounts of the two metals are similar in the whole dataset, they only weakly correlate. Silver is most strongly correlated with Au, Mn, Cu, Sb, Pb, and Bi concentrations, which are the main ore metals at New Afton. Palladium, on the other hand, is strongly correlated with Ni, Se, and Pt, lacking any statistically relevant (r > 0.5) correlation with the Ag-group of metals and metalloids. Gold in pyrite is low, less than 2 ppm. Most of the analyzed grains are also low in As, with rare weight-percent levels (up to 2.93 wt%), but in general contain relatively low As concentrations (median 58.7 ppm) that correlate with Au.
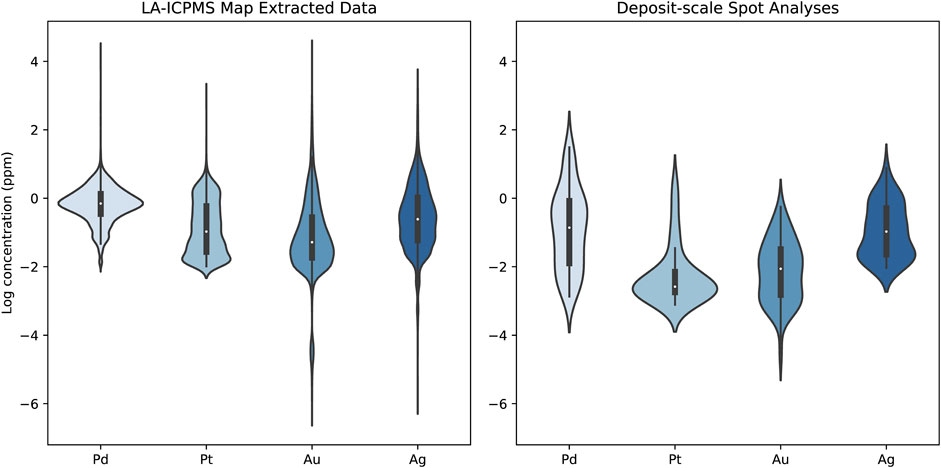
FIGURE 10. Precious metal distribution in the analyzed pyrite crystals. The data are separated by those extracted from LA-ICPMS maps on a small number of grains and individual pyrite crystals from numerous samples throughout the deposit. The violin plot shows the distribution of the data by the shape of the violin. The box plots within each violin represent the 25th to 75th percentiles as the box and 99th percentiles as the whiskers. The tails of the violins extend to the farthest outliers.
Principal component analysis of the extracted LA-ICPMS mapping data shows that the first three principal components account for 58%, 9%, and 6% of the variance in the data, respectively. The loadings of each of the elements on the first three principal components are shown in Supplementary Table S4. The loadings of PC1 versus PC2 and PC2 versus PC3 are shown in Supplementary Figure S4. The plot of PC1 versus PC2 shows that the similarly correlated element groups Ni, As, Se, and Co, and Cu, Ag, Pd, Sb, Hg, Pb, and Bi form unique clusters and combined account for 67% of the variance. Comparing PC2 and PC3 shows less obvious clusterings of elements but the correlation between Ni, As, Co, Pd, and Se, combined accounts for 15% of the variance in the data. Comparison with LA-ICPMS maps of analyzed pyrite (Boucher et al., 2023; companion paper), the two predominant elemental clusters shown by PC1 and PC2 represent broad zonation patterns in pyrite (Ni, As, Se, and Co) and secondary chalcopyrite contamination along pyrite along fracture surfaces and recrystallized PGM (Cu, Ag, Pb, Bi, Sb, Hg, and Pd). The PC2 and PC3 loadings show the correlation between Pd and pyrite zonation.
The principal component analysis of spot analyses of pyrite grains from throughout the deposit shows that 73% of the variance in the data is contained in the first two principal components, where PC1 describes 51% and PC2 describes 22%. The loadings of each of the trace elements on the first two principal components, listed in Supplementary Table S4, are plotted against one another in Supplementary Figure S5. The main ore elements (Cu, Au, Ag, and Pd) all have large loadings on PC1, which also includes the non-ore metals (Ni, Pb, and Mn) and the metalloids (As, Bi, and Sb). The strong positive loadings of Pd, Ni, and Se and the strong negative loads of Pb, Bi, Cu, Mn, Ag, Au, and Sb on PC2 show that two correlated clusters of pyrite are identified that correspond closely to the elemental clustering identified by the principal components of the data extracted from LA-ICPMS mapping within a small number of individual pyrite grains.
Both the extracted LA-ICPMS mapping data and the spot analysis data were filtered to attempt to remove the effects of contamination of the ablated volumes by fracture-controlled chalcopyrite microveinlets (Boucher et al., 2023; companion paper). Although the filtering was not exhaustive, as evident by the presence of Cu-rich elemental clusters, this statistical assessment shows that the effects of the contamination are readily isolated from the pyrite chemistry when compared with the LA-ICPMS maps of the analyzed crystals (Boucher et al., 2023; companion paper) and their presence does not alter our findings.
Combining the results of the samples collected in this study with the drill assay database provided by New Gold allows us to analyze the distribution of PGE mineralization in the New Afton deposit below the surface. Group 2 samples, with high Pd and low concentrations of Au, are almost entirely contained within the shallow levels of the deposit and are found near or within carbonate-healed faults and structures but may also occur sparsely at depth. Palladium-Au ratios, calculated using the kriged Pd and Au block models, are in relative order-of-magnitude agreement with the Pd-Au ratios of samples collected in this study. Group 1 samples are located in areas of the deposit with lower overall Pd/Au, whereas the locations of Group 2 samples broadly show high Pd/Au. Overall, although the manifestation of PGE mineralization as discrete, intergrown PGM in these samples might be favorable for beneficiation, their occurrence is sporadic and represents an insignificant fraction of the total PGE budget of the system. Samples in Group 1, where Au is equal to or greater than Pd, are dispersed throughout the entire deposit. The highest-grade samples, either measured through Pb fire assay in this study or routine fire assays during drilling, are always surrounded by lower, but significant (>0.1 ppm), Pd enrichments. Primary Cu-Au mineralization is present in all Group 1 samples and Pd occurs in ppm concentrations as a trace constituent in pyrite that was precipitated either before or during the main stage ore deposition, indicating that PGE mineralization initially occurred during the high temperature, hypogene event.
Deposit-scale elevated Pd grades (Figure 9) are located around the Cherry Creek monzonite and commonly occur associated with Cu and Au enrichment. The grade shells show that Pd may either extend outwards, with little disruption by mapped structures (Figure 9C) or sharply terminate over distances of <5 m (Figures 9A–C). It is unlikely that the processes controlling Pd deposition changed sharply within the main ore zone leading to two separate modes of Pd occurrence. Rather, the areas that show sharp discontinuities in Pd are spatially associated with pre-mineralization deposit-scale structures (J-fault, HWF, FWF). For example, in Figure 12C, in the central portion of the Pd grade shell, where grades decrease by an order of magnitude over −5 m, the traces of the J-fault splay and the Footwall Fault are located only a few meters to the north. Both faults dip to the south, toward the Pd mineralization and monzonite intrusion. Either these structures acted as barriers to early magmatic-hydrothermal fluids, thereby restricting the domain of mineralization (evident by the zones not bounded by faults, where Pd zones are broad), or post-mineralization reactivation of the faults displaced part of the enriched zone. The latter case is unlikely because of the continuity between grade shells on either side of the J-fault in the upper levels of the deposit (Figure 9A).
The monzonite, as currently mapped at depth, represents only 0.01 km3 of magma. Mass balance calculations using Pd tonnages (23–40 t) show that −1 km3 of magma is required to produce the total amount of Pd in the deposit for a magma that contains 10 ppb Pd. It is likely that the PGE-bearing fluids were brought up from depth, possibly sourced from underlying Iron Mask magmas, exploiting pre-mineralization deposit-scale structures and were limited on the southern end by the hanging wall fault and picrite. Later fluids acted to remobilize and precipitate Pd in small, high-grade pockets unrelated to primary Cu and Au mineralization (Group 2 samples).
The close association between pervasive low-grade, deposit-scale Pd concentration (Pd > 0.1 ppm) and the main Cu-Au orebodies, as shown by the grade shell and block model analysis, indicates that Pd enrichment occurred early in the magmatic-hydrothermal history at New Afton, prior to and co-precipitating with the early, high temperature Cu-Au hypogene mineralization. This is further supported by the discovery of high Pd tenors in pyrite (Hanley et al., 2021; Boucher et al., 2023; companion paper) in the presence of Cu-sulfide mineralization in Au-rich samples. Although coarse-grained PGM are found within very high PGE samples, the PGM represent only a small fraction of the entire PGE budget in most Group 1 samples. In some cases, these PGM are representative of localized redistribution and subsequent enrichment of Pd. In Group 2 samples, notably, all of the PGE are hosted within PGM but this sample type represents a negligible contribution to the overall resource-reserve at New Afton.
The evolution of the early hypogene mineralizing fluid was modelled in Geochemist’s Workbench using a modified LLNL thermodynamic database (Wolery, 1992), with results shown in Figures 11–14. To address the constraints on coprecipitation of Co and Ni with Pt and Pd in pyrite we have attempted to quantify the solubilities of endmember pyrite analogs for each of the four metals. Other stoichiometric phases of Co and Ni are also modeled to set ranges on fluid composition where those minerals would be expected to form, thus dominating the mass balance at the expense of their solid solutions in pyrite. The aqueous species, minerals, and reactions in the LLNL database were calculated in the temperature range of 250°C–600°C at a constant pressure of 100 MPa using the SUPCRT-based program DBCreate (Kong et al., 2013). Equilibrium constants for aqueous Pd(II)-chloride complexes were taken from Tagirov et al. (2013) and Pt from Tagirov et al. (2019). The data for solid Pd phases, hydroxide-, and oxide-complexes were calculated in SUPCRT92 (Johnson et al., 1992) using the slop07 database with free energy data from Sassani and Shock (1998). Data for aqueous Ni species were compiled from UV-Visible spectroscopic experiments on Ni(II)-chloride complexation (Liu et al., 2012). Copper-chloride, Co-chloride complexes, and solid Cu mineral phases were obtained from the SUPCRT database. Equilibrium constants for the solid Ni-S phases pentlandite (Ni4.5Fe4.5S8), millerite (NiS), heazelwoodite (Ni3S2), and vaesite (NiS2) and the solid Co-S phases cobaltpentlandite (Co9S8), jaipurite (CoS), and cattierite (CoS2) were taken from the thermodynamic extrapolations of Klein and Bach (2009). Some of the experimentally determined equilibrium constants used were extrapolated to higher temperatures by regression of the constants against reciprocal temperature. The modified and extrapolated equilibrium constants and reactions used in the thermodynamic modelling are listed in Table 1. Reliable experimental data on the solubility of PdS2 unfortunately do not exist (Pan and Wood, 1994), so we tentatively allow the phase PdS to represent a Pd component in pyrite.

FIGURE 11. Temperature-logfS2 diagram of (A) Ni, (B) Pd, (C) Co, (D) Pt, and (E) Cu solubility in a low-salinity vapor dominated system. Solubility contours are shown for the Cl− complexes stable at the modeled fluid conditions. Mineral abbreviations are bn—bornite, cat—cattierite, cpn—cobaltpentlandite, cpt—cooperite, cpy—chalcopyrite, cv—covellite, hem—hematite, hz—heazlewoodite, mag—magnetite, mil—millerite, pn—pentlandite, py—pyrite, vs.—vaesite. Contours for the activity of ilmenite are shown. Partial phase stability lines are shown for the soluble mineral phases. Log fO2 contours are calculated using REACTION above the pyrite-magnetite-hematite reaction line and via the reaction of pyrite and hematite below. The S gas buffer was calculated between SO2/H2S = 1 and 10 assuming a [H2S(aq)] = 0.1 (Inan and Einaudi, 2002; Einaudi et al., 2003). The approximate rock buffered conditions are shown by the arrow and are representative of an initial assemblage of pyrite-magnetite-pyrrhotite-ilmenite. The activity ratio
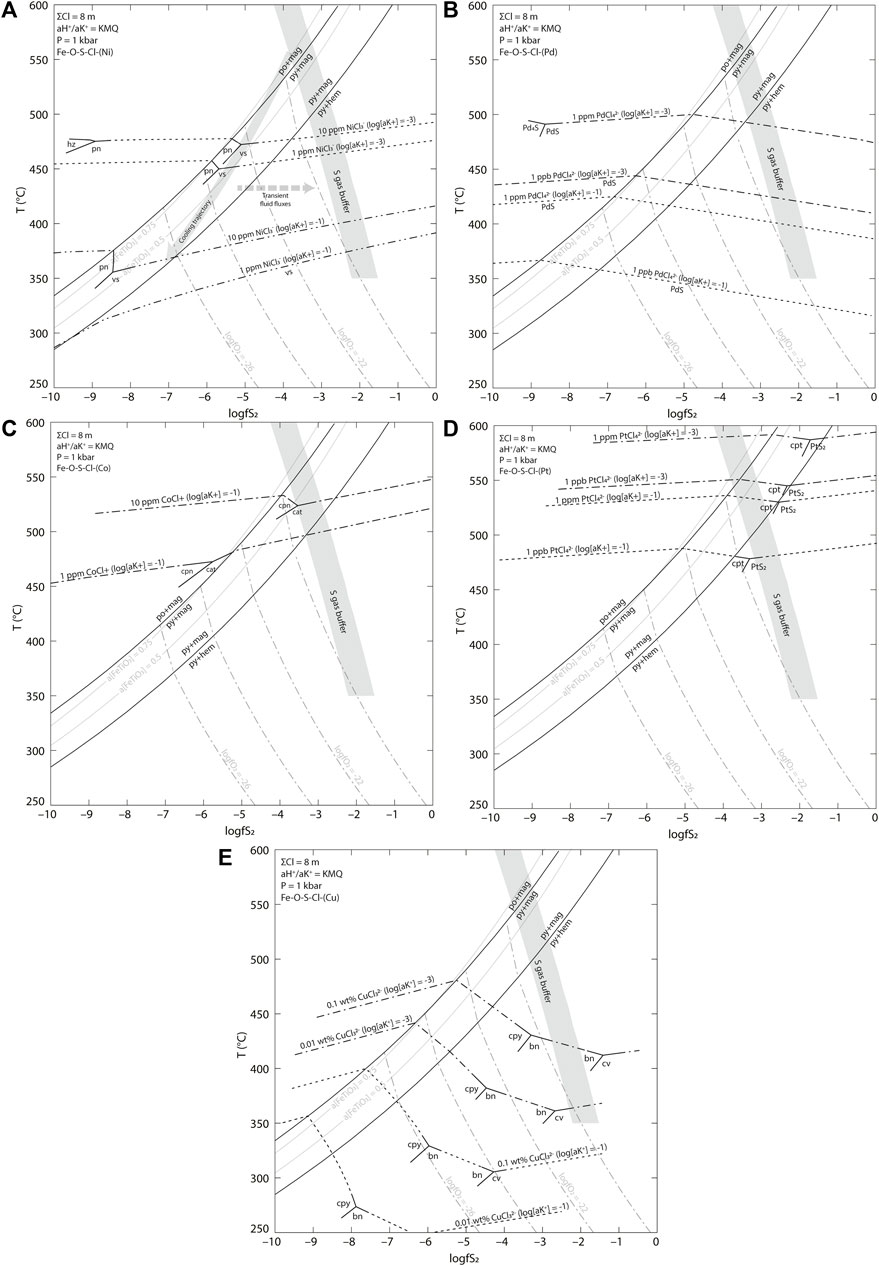
FIGURE 12. Temperature-logfS2 diagram of (A) Ni, (B) Pd, (C) Co, (D) Pt, and (E) Cu solubility in a high-salinity liquid dominated system. Solubility contours are shown for the Cl− complexes stable at the modeled fluid conditions. Mineral abbreviations are bn—bornite, cat—cattierite, cpn—cobaltpentlandite, cpt—cooperite, cpy—chalcopyrite, cv—covellite, hem—hematite, hz—heazlewoodite, mag—magnetite, mil—millerite, pn—pentlandite, py—pyrite, vs.—vaesite. The parameters used are the same as those in FIGURE with an increased Cl concentration to 8 m.
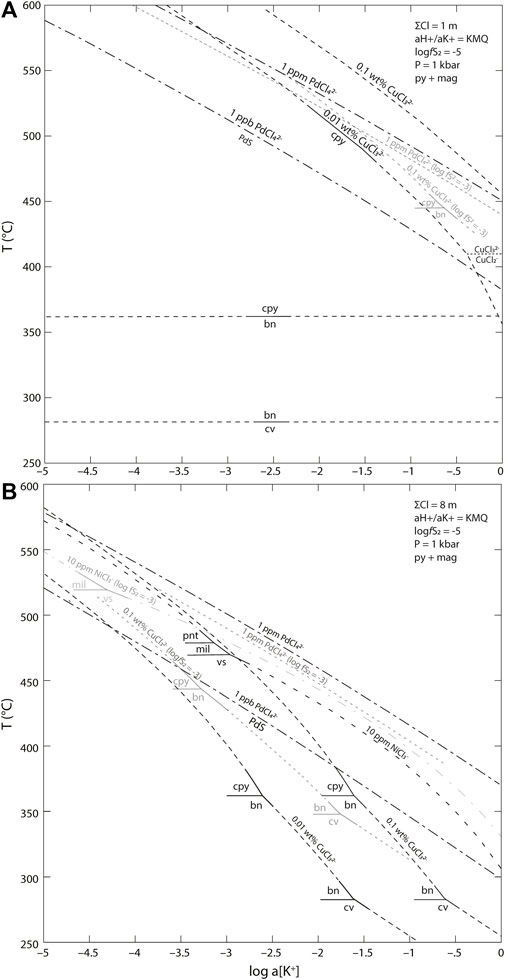
FIGURE 13. Temperature-logaK+ diagram of Pd, Cu, and Ni solubility in a (A) low-salinity vapor dominated system and (B) high-salinity liquid dominated system. Mineral abbreviations are bn—bornite, cpy—chalcopyrite, cv—covellite, mil—millerite, pnt—pentlandite, vs.—vaesite. The base diagram uses a fixed value of logfS2 = −5 in the presence of pyrite and magnetite. The activity ratio of H+/K+ is buffered by the reaction between K-feldspar, muscovite, and quartz. Contours for logfS2 = −3 are shown in grey. In a low-salinity vapor (A) Pd deposition occurs at a lower temperature than chalcopyrite except in highly sulfidizing systems. For a high-salinity liquid (B), Pd deposition occurs at a higher temperature than Cu in all except the least potassic systems.
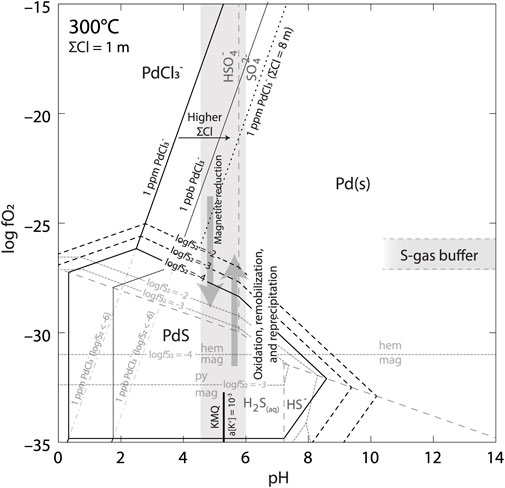
FIGURE 14. fO2 vs. pH in the system Fe-O-Cl-Pd at 300°C. Previously deposited Pd (as PdS) can be remobilized as a Cl− complex by an oxidized, S-poor fluid. Pd is completely stable over PdS at values of logfS2 < −6, or oxidized conditions (hematite stable) at higher logfS2 values. Pyrite has no stable field at values of logfS2 below approximately −3.5. Pd solubility as the PdCl3− complex increases at higher total Cl concentrations. Palladium transported in solution by the oxidized fluid will precipitate upon interaction of the fluid with a reductant, supported by the mineralogy of Group 2 samples where PGM are hosted by martite.
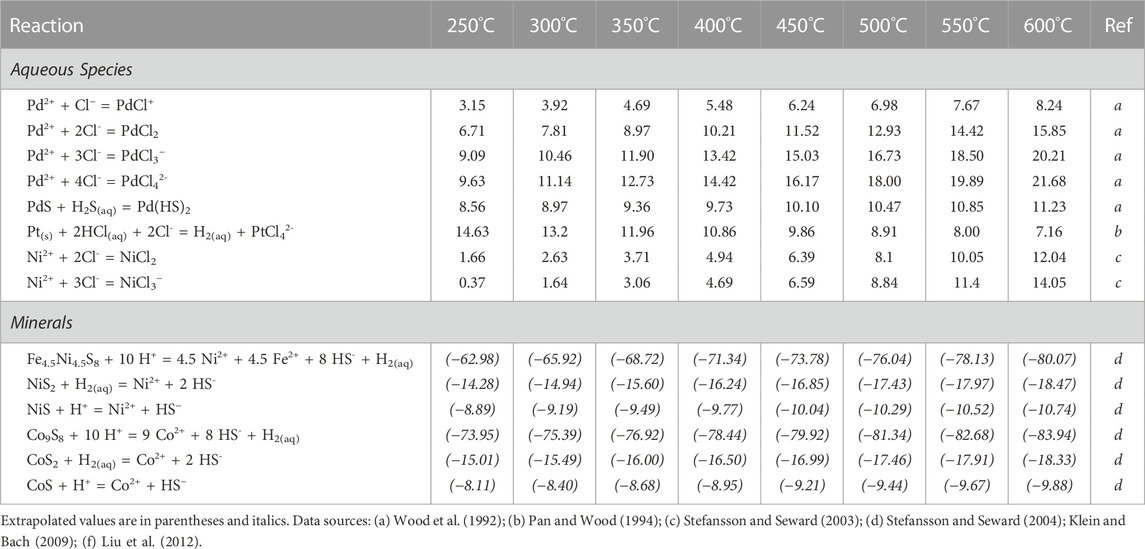
TABLE 1. Reactions and modified log K values used in thermodynamic models.
The composition, temperature, and intensive parameters of the mineralizing fluids at New Afton are unknown but can be reasonably estimated using mineralogical and textural associations and resemblances to similar modern arc systems. Our models are calculated in a system containing the minerals pyrite, pyrrhotite, magnetite, hematite, muscovite, K-feldspar, and/or quartz. Not all of these minerals are stable at equilibrium with each other at any given time but all are potential phases in the thermodynamic model. The relative acidity of the fluid is buffered by the reaction between K-feldspar, muscovite, and quartz using a value of 103.683 for the activity ratio of H+/K+ obtained with SUPCRT. We presume that the bulk K+ concentration of the fluid was set by the initial equilibrium with the magma, which in turn sets the control on pH for a fluid buffered by coexisting K-feldspar, muscovite and quartz. We therefore consider the behaviour of different systems each evolving along a path set by having begun with a different K+ concentration as shown in Figure 13. The fS2 and fO2 of the fluid are controlled by the ratio of SO2 to H2S when assuming fluid-buffered conditions; this ratio, like K+ concentration, tends to be set initially by equilibrium with the magma.
With reference to Figures 11–13 we can trace the likely evolutionary path taken by mineralization fluids from an early stage wherein intensive parameters were buffered by the original mineral assemblage in the rocks, to a later fluid-buffered stage. Early high-temperature magmatic fluids would have been oxidized and buffered by the SO2/H2S fugacity ratio which may informally be referred to as the “sulfur gas buffer” (Einaudi et al., 2003). Unreacted magmatic fluids from degassing andesitic magmas have SO2/H2S gas ratios between 1 and 10 (Burnham and Ohmoto, 1980; Einaudi et al., 2003). The two gas species at equilibrium in the presence of water vapor act to impose the fO2 via the reaction
such that
In our models, the activity ratio
(KMQ) that describes the hydrolysis of K-feldspar by a reactive fluid to form muscovite (sericite) and quartz. Potassium feldspar and muscovite are present in all Pd-mineralized Group 1 samples, which makes reaction (2) a reasonable estimation of the relative acidity of the system. The activity ratio
Magnetite apatite vein swarms resembling iron oxide apatite (IOA) mineralization, associated with the early history of the Iron Mask batholith, predate the precipitation of sulfide mineralization at New Afton. The magnetite-apatite veins have previously been proposed as having originated from an immiscible Fe-P-O melt that exsolved from the Iron Mask magmas (Cann, 1976). Their findings are supported by experimental studies showing that intermediate, oxidized, volatile-rich magmas have the capacity to exsolve a Si-poor, Fe-P-O melt (Hou et al., 2018; Mungall et al., 2018). The thermodynamic modelling presented here does not support a direct genetic link between the IOA-style veining and porphyry mineralizing fluids at the assumed sulfidation, pH, and redox conditions. The paragenesis of the IOA-style veins is considered as separate to the main hypogene porphyry mineralization and their origin remains enigmatic, warranting further study.
Unaltered volcanic rocks of the Nicola Group found in the Quesnel terrane are also known to contain the assemblage pyrite ± magnetite ± ilmenite ± pyrrhotite (Symons, 1985). Although pyrrhotite has not previously been identified at New Afton, ilmenite occurs with magnetite throughout the deposit and rutile/leucoxene were identified in our samples. The coexistence in the country rocks of ilmenite, pyrite, and magnetite therefore constrains fS2 prior to hypogene mineralization by the reaction
such that
The presence of early pyrite constrains the fS2 of the unreacted fluid to within the pyrite stable field at an fO2 controlled by the S-gas buffer. During the earliest stages of metasomatism, the titration of fluids into the country rocks would push the system to evolve along the rock-buffered path. As the fluid progressively cooled, the increasing fS2 and fO2 would destabilize the volumetrically minor pyrrhotite in the country rocks allowing the system to evolve along a new rock-buffered path defined by the equilibrium between pyrite and magnetite:
These conditions would dominate the system during the early stages of hypogene mineralization due to the abundance of magnetite from the preceding magnetite-apatite mineralization while concurrently reducing the activity of ilmenite in rhombohedral oxides. The early system, just prior to Cu-sulfide deposition, would then have had fS2 greater than that set by the coexistence of pyrrhotite and pyrite, fO2 greater than that set by the coexistence of pyrrhotite-pyrite-magnetite, and a fixed fS2/fO2 ratio defined by the pyrite-magnetite buffer reaction. This stage of cooling and fluid addition would see the formation of (Cu-Au-PGE) hypogene mineralization (Figures 11, 12). From this point on the fluid would evolve within the pyrite-magnetite stability field as it cooled, oxidizing and sulfidizing the earlier reduced mineral assemblage until the start of the reaction between pyrite, magnetite, and hematite. The fluid would continue to cool, following a compositional path along the pyrite-magnetite-hematite reaction line (Figures 11, 12). As the country rocks fully equilibrated with the fluids, their continued reaction would surpass the pyrite-magnetite-hematite reaction and the system would evolve unbuffered towards the composition dictated by the primary H2S/SO2 gas ratio (the “S-gas buffer”), assuming that the fluid is held at a constant H2S concentration. In reality, the precipitation of hypogene sulfide minerals would reduce the S content of the fluid, thereby moving the S-gas buffer to lower values of logfS2.
There is some disagreement about whether fluids that cause hypogene porphyry Cu mineralization have low or high salinity. To satisfy both camps, we have considered hypothetical mineral depositional processes using thermodynamic modelling of a system dominated by either low-salinity vapor (e.g., Williams-Jones and Heinrich, 2005) or high-salinity liquid (Audétat et al., 2008; Lerchbaumer and Audétat, 2012). The modelled fluids have ΣCl of 1 m (∼6 wt% NaCl equiv) and 8 m (∼32 wt% NaCl equiv), to represent systems dominated by either a low-salinity vapor phase or a high-salinity liquid phase, respectively. We show that the co-precipitation of Pd+Ni and Pt + Co can be explained solely through the cooling of a hydrothermal system, regardless whether the mineralizing fluids were of high or low salinity (Figures 11, 12). In both cases we have chosen parameter values that appear reasonable and instructive, without having any direct evidence from measurement of fluid compositions. The goal is to explore the controls on metal solubility and deposition and come up with general insights into the processes that may have caused metal precipitation within the observed paragenesis.
We address the solubilities of Ni and Co with respect to their stoichiometric phases millerite, pentlandite, vaesite, cobaltpentlandite, and cattierite, with the assumption that if vaesite or cattierite are predicted to be stable then the respective disulfide components will instead enter pyrite in solid solution. Since we do not have thermodynamic solution models for Co- and Ni-bearing pyrite, we can only show qualitatively that once vaesite and/or cattierite are predicted to be stable phases, we should expect to see cobaltian and nickeliferous pyrite forming in abundance. Although the estimated solubilities of Ni and Co aqueous species are therefore upper limits governed by activities of the vaesite and cattierite components below unity in pyrite, their variations with temperature can be treated with some confidence. The solubility of Pt and Pd are similarly constrained semiquantitatively by assuming that where solid PtS or PdS would be saturated phases, the PtS and PdS components will instead enter pyrite in solid solution.
We do not know the concentration of the base and precious metals in the natural fluids but we can use the temperature dependence of their solubilities to infer the conditions under which they would be expected to enter pyrite in significant amounts.
In the case of the low-salinity vapor (ΣCl = 1 m), Ni and Co are both transported as Cl− complexes at all temperatures (Figures 11A,C). The concentrations of both metals at equilibrium with their stoichiometric phases depend strongly on temperature and the
Palladium is transported predominately as PdCl42- under all conditions even in the low salinity fluid. The solubility of Pd has a strong positive dependence on both log (aK+) and temperature (Figure 11B, Figure 13). In a low K fluid (
Copper solubility is similarly dependent on both the temperature and the relative acidity (through varying buffered values of
A high-salinity liquid also would transport both Ni and Co as Cl− complexes regardless of temperature (Figures 12A,C). Fluids with higher ΣCl concentration (8 m) show greater metal solubilities, resulting in precipitation of Ni and Co phases at lower temperatures from fluids with a given metal concentration. The solubilities of both metals in the high-salinity liquid show a strong dependence on the K content of the fluid as expressed as
In high salinity fluids the solubility of Cu is greatly enhanced relative to the lower salinity example (Figure 12E). A high salinity liquid with
Previous pyrite mapping studies by Hanley et al. (2021); Boucher et al. (2023, companion paper) show that PGE mineralization at New Afton was contemporaneous with at least 2 cycles of early Co-Ni enrichment manifested in the precipitation of Co-Ni-As-Se-Pd-Pt-rich pyrite, texturally predating the main hypogene chalcopyrite mineralization. Unambiguous decoupling of Pt from Pd is observed in pyrite, with growth zones rich in Pd having low Co/Ni ratios and showing enrichment in Ni-Se-(Co-As), whereas zones rich in Pt have high Co/Ni ratios, enriched in Co but poor in Ni-Se-(As). Oscillation between Co(±Pt) and Ni-Pd enriched zones correspond to variations in the S isotope composition of the pyrite from higher values of δ34SVCDT (Co-rich; high Co/Ni) to lower values (Ni-rich; low Co/Ni), with variations of up to 4‰ in single pyrite grains and a total range in pyrite δ34SVCDT measured from −5.5‰ to +1.4‰. Boucher et al. (2023, companion paper) suggest that these variations in pyrite composition reflect episodic cooling and fluid recharge involving an orthomagmatic fluid derived from, or having interacted with, a mafic source during early hypogene ore formation.
Our PCA of data from Boucher et al. (2023, companion paper) for pyrite show that elevated Pd systematically occurs with both Ni and Se enrichment (Supplementary Figures S4, S5). The first principal component (PC1) contains significant loadings from all potentially economic metals, including Pd (Supplementary Figure S5). This suggests that this variable reflects the composition and abundance of pyrite grains that are associated with the hypogene ore zone; however, comparison with pyrite from outside the main ore zone would be required to further support this interpretation. Meanwhile, the large loading of both Pd and Ni on the second principal component show that it records a population of pyrite within the hypogene ore zone that is interpreted to have been affected by the main episode of PGE enrichment, directly related to the formation of Pd-Ni-rich pyrite.
The occurrence of Pd and Ni in pyrite at the New Afton deposit may be described with reference to the sulfidation reaction
where vaesite (NiS2) represents the Ni component in the “bravoite” solid solution (Fe,Ni,Co)S2. Reaction (5) shows that under highly sulfidizing and/or oxidized conditions pentlandite will not be stable, but Ni will instead participate in the formation of the vaesite component in pyrite. We further suggest that whereas pentlandite is known to host Pd as lattice-substitutions in Ni-Cu-PGE massive sulfide deposits (Barnes et al., 2006; Dare et al., 2010; Mansur et al., 2019), at higher fS2 Pd instead will tend to follow Ni into the vaesite component of pyrite.
The incorporation of structurally bound Pd into pyrite can be described similarly to that of pentlandite. Pentlandite has a cubic structure and the formula M9S8. It readily accommodates mixtures of Fe, Co, and Ni in both the octahedral and tetrahedral coordinated M-site and Pd and Ag into octahedral M-sites exclusively (Hall and Stewart, 1973; Burdett and Miller, 1987). Similarly, metals in the pyrite structure occur in the octahedrally coordinated M-site (MX2; X = S, Sb, Se, As, Te, Bi), while the introduction of Pd2+ into the crystal may remove the requirement for octahedral coordination around M and instead bond as the square-planar PdS2/PdSe2 pseudotetragonal structure type with S-S and Se-Se pairs (Gronvold and Rost, 1957; Brostigen and Kjekshus, 1970). It is not necessarily the case that Pd2+ must bond in pyrite as a pseudotetragonal structure, as other Pd-homeotypes of pyrite exist, notably PdSb2 and PdAs2 (Brese and von Schnering, 1994) as well as Pd-sulfarsenides, -sulfantimonides, and -sulfobismuthides (Makovicky, 2006). The effective ionic radius of the Pd2+ ion decreases from 0.86 Å in octahedral coordination to 0.64 Å in square-planar coordination, closer to the 0.61 Å and 0.69 Å effective ionic radius of the octahedrally coordinated low-spin Fe2+ ion and Ni2+ ion, respectively (Shannon, 1976). This suggests that Pd2+ may be permitted into crystallizing pyrite in a square-planar coordination with Se-Se and/or S-S, substituting for Fe2+ and Ni2+, or in octahedral coordination with any remaining covalent X-X pair. The above arguments do not preclude the possibility that Pd was incorporated as nanoparticles of PGM within pyrite, rather than as a lattice substitution (González-Jiménez and Reich, 2017; Kravtsova et al., 2020).
In hydrothermal systems, Ni transport is dominated by the chloride complexes NiCl+, NiCl2(aq), and NiCl3− at temperatures up to 700°C and its solubility is markedly lower than that of Co (Liu et al., 2012). The reaction
describes the precipitation of dissolved NiCl2 as vaesite in the presence of magnetite and pyrite. A similar reaction can be defined to describe the precipitation of the Co-component in pyrite. Its solubility is therefore controlled by decreasing temperature, increasing fS2, decreasing fO2, decreasing pH, and decreasing Cl content of the fluid under isobaric conditions. The limited solubility of Ni relative to Co in the fluid suggests it would be depleted with respect to Ni with the precipitation of the vaesite component in pyrite.
Studies on the speciation and complexation of Pd in hydrothermal fluids have shown that in the 2+ valence state, Pd is transported as a chloride complex at high temperatures (>500°C) and moderate pressures (∼200 MPa) (Tagirov et al., 2013; Sullivan, 2020). At temperatures below 300°C, the complexing behavior of Pd becomes largely dependent on the pH, fO2, and fS2 conditions of the fluid. In acidic (pH < 4) and oxidizing fluids (hematite-stable), Pd remains extremely soluble as a chloride complex, particularly PdCl42- (Mountain and Wood, 1988; Wood et al., 1992; Tagirov et al., 2013). Fluids with high fS2, slightly acidic to near-neutral pH, and relatively reduced fO2 (H2S(aq) predominant) are capable of transporting more than 1 ppm Pd as bisulfide-complexes (Pan and Wood, 1994; Barnes and Liu, 2012).
The precipitation of Pd from a hydrothermal fluid as a structural component in pyrite requires that pyrite itself is being produced during the exchange of O and S between magnetite and pyrite, a combined process that is described by the reactions
or
in the presence of magnetite and pyrite. Both reactions are temperature- and fS2-dependent, but the effects of Cl− and pH are only relevant controls on the solubility of Pd when it occurs as Cl− complexes. Analogous reactions can be written for Cl− and HS− complexes of Pt. This shows, combined with the thermodynamic modelling and pyrite geochemistry described previously, that in a cooling system, at certain fS2 conditions, dissolved Pd + Ni and Pt + Co and Ni in solution may share similar constraints on their aqueous solubility, reaching saturation and favoring their incorporation into pyrite under the same conditions. The dominant control on these reactions is temperature, leading to precipitation of Pd as PdS2 and Pt as PtS2 during cooling.
In summary, we find that over the expected range of possible orthomagmatic fluid compositions with typical fS2 and fO2 the dominant controls on metal solubility are fluid salinity,
The precipitation of PGM throughout the deposit was largely controlled by local processes during the evolution of the mineralizing fluids. This is supported by the presence of individual grains and clusters of PGM in both highly sulfidizing (Group 1) and/or highly oxidized (Group 2) environments, characterized by the prevalence of Cu sulfides or martite within the samples.
The PGE mineralogy described here is consistent with previous work in alkalic porphyry systems in the Cordillera at Mt. Polley (Pass et al., 2009; Pass, 2010), Mt. Milligan (LeFort, 2009; Warren, 2010; LeFort et al., 2011) and the deposits of the Iron Mask Batholith (Afton, Ajax, Allendale, Friday Creek, Maple Leaf; Nixon and Leflamme, 2002; Nixon, 2004; MacKenzie, 2009). The nature of the PGM in Group 1 samples is somewhate enigmatic due to their multiple mineralogical associations, variable morphologies, and association with Pd-rich pyrite, however it is noteworthy that these PGM phases account for only a small part of the total PGE metal budget. Outside of the Cordillera, PGM associated with primary sulfide mineralization and early, high temperature potassic alteration have been identified in the alkalic Cu-Au ± (Pd, Pt, Te) Skouries porphyry deposit in Greece (McFall et al., 2018), the Elastite Cu-Au porphyry deposit in Bulgaria (Tarkian et al., 2003), and the Santo Thomas II porphyry deposit in the Philippines (Tarkian and Koopmann, 1995), with the main PGE-bearing phases being Pd-Sb-Bi-Te minerals and associated Ag-Au tellurides. It is unlikely then that a separate hydrothermally-deposited Bi-Te melt phase was the host for the PGM observed at New Afton or present in the hydrothermal fluids, as has been proposed for other Pd-rich alkalic porphyry deposits (McFall et al., 2018). Most of the PGE-bearing phases identified at New Afton notably lacked Bi (two grains of Pd-Bi minerals observed) and were seldom associated with other Bi-bearing minerals. Instead, they were typically composed of some combination of metals in the system Pd-Pt-Au-Ag-Sb-As-Te-Hg. Additionally, the sulfide-associated Group 1 PGM in our samples (Figure 8) do not share the globular morphology noted by McFall et al. (2018) at the Skouries deposit and were never found to be hosted within hydrothermal quartz. Instead, the PGM were intergrown with chalcopyrite, typically in contact with Pd-rich pyrite, and forming simple to complex intergrowths with electrum and hessite.
Coexisting pairs of hessite (Ag2Te) and electrum (Au-Ag alloy) act to buffer the fTe2 in hydrothermal systems, given the reaction
where Ag is a component in the electrum solid solution (Afifi et al., 1988a). Limited and transient input of magmatic H2Te into a hydrothermal system, following the input of magmatic sulfur, may stabilize Te-bearing precious metal phases (Afifi et al., 1988b). At New Afton, there is a ubiquitous association between electrum and hessite ± PGM. In general, the electrum grains are much larger than the coexisting hessite crystals and Pd-Sb ± Hg ± Te ± As minerals along their margins (Figure 8C). Two electrum crystals analyzed by EPMA in this study, due to mistaken identification as PGM during probing, were found to contain 0.02 wt% Pd.
Platinum-group minerals associated with Group 2 samples are, like those in Group 1, predominately Pd-Sb-As ± Te ± Hg phases but differ in their mineralogical association and host phases (Figures 8E–H). They are always associated with porous magnetite that has undergone partial martitization, and apatite, Fe-carbonate alteration, and pervasive fracturing of the host rock. The PGM are found along grain boundaries of martite, within magnetite that has not yet undergone oxidation, or, in one case, as a free grain in a cataclastite. In these samples, the total absence of sulfide minerals suggests that the PGE-bearing fluid carried the PGE as Cl complexes due to the lack of reduced S in the fluid, which requires the fluids to have been quite oxidized, where hematite is stable instead of magnetite.
Early mineralizing veins at New Afton, and those sampled in this study, defined by the assemblage chalcopyrite-pyrite-magnetite, are crosscut by later chalcopyrite-pyrite-hematite (var. specularite) veins (Figure 5). In these samples of primary hypogene Cu-Au mineralization, Pd-Pt-Ni-Co-rich pyrite occurs within the earlier chalcopyrite-pyrite-magnetite assemblage. The fluid must have deposited its Pd prior to the system reaching the reaction pyrite-magnetite-hematite, while its redox and sulfidation state was still largely buffered by the host rock, perhaps due to rapid cooling as the fluid entered previously unaltered rock. Figures 11, 12 show the T-log fS2 evolution of the system prior to and during hypogene mineralization for Ni, Co, and Pd for either the low-salinity or high-salinity fluids, respectively.
In either case the country rocks were initially heated and subjected to the influx of fluids whose initial compositions were buffered by magmatic conditionsbut which subsequently underwent partial equilibration with the country rocks. Where fluid-rock ratios remained low, the early rock buffer mineral assemblage consisted of pyrite-magnetite-pyrrhotite-ilmenite-K-feldspar-muscovite-quartz. Through the subsequent addition of fluids, conditions evolved to the pyrite-magnetite-ilmenite stability field either prior to or during Co-pyrite and chalcopyrite precipitation depending on the amount of pyrrhotite initially present and the activity of ilmenite in rhombohedral oxide in the unaltered country rocks. Interaction between the fluid and country rocks caused the fluid to cool, leading to the early precipitation of Co-±Pt-pyrite (Hanley et al., 2021; Boucher et al., 2023; companion paper) followed closely by the deposition of chalcopyrite (Figure 12). Further cooling of the fluid led to the deposition of chalcopyrite and the mutual precipitation of both Ni and Pd as lattice substitutions in pyrite, while Co continued to precipitate as a component in pyrite, although becoming increasingly depleted in the fluid (e.g., Figures 11, 12). Palladium, Ni, and Co were all subsequently depleted from the fluid upon its continued cooling and prior to the system reaching the pyrite-magnetite-hematite reaction. Although Co has a higher overall solubility than Ni, the relatively early deposition of Co-pyrite compared to Ni-pyrite is interpreted to have resulted from the presence of greater initial Co concentration in the fluid. Hypogene Cu mineralization continued as the system cooled along the pyrite-magnetite-hematite reaction line (Figures 11, 12).
Whether the mineralizing fluids were low-salinity or high-salinity has no bearing on the final order of PGE mineral precipitation. Our models predict the precipitation of the minerals (in order by decreasing temperature): Co-Pt-rich pyrite followed by Ni-Pd-rich pyrite all within the pyrite-magnetite stability field (Figures 11, 12). The exact initial timing of chalcopyrite saturation depends on the chlorinity and alkalinity of the fluid (Figure 13), but in general occurs closely before or after Pd deposition. If chalcopyrite slightly precedes Pd deposition then some Pd will enter chalcopyrite, but in general the formation of PdS2 solid solution in pyrite depletes Pd so much that little remains in solution when chalcopyrite appears. The precipitation of the Pd-Pt-Ni-Co-rich pyrite is entirely described by a simple cooling model; a precious-metal bearing hydrothermal fluid equilibrating with surrounding country rocks will precipitate Pd (and Ni) solely in response to decreasing temperature. The cooling history here is presented as a simplification to outline the predominant cause of Pd-Pt-Ni-Co precipitation assuming constant equilibrium of the observed hypogene mineral assemblages. In reality, the overall fluid evolution would have occurred as a series of discrete magmatic fluid pulses causing transient disequilibrium and bringing renewed influxes of metals into the system. Visualizing this fluid history in Figures 11, 12, we might expect the fluid to cool along a path where new fluid fluxes cause the system to follow an isothermal trajectory towards the S-gas buffer at any given temperature, briefly causing localized increases in the fO2 and fS2. Cooling trajectories of this topology are shown in our data and that of Boucher et al. (2023, companion paper) by the deposit-scale irregularity in the zonation patterns of Co and Ni and PGE enrichment in pyrite and may also account for the depleted δ34S values in nickeliferous pyrite.
The precipitation temperature for each of the previously mentioned phases that we have presented here are meant to be qualitative; the actual temperatures at which the phases would begin to precipitate are dependent on several other factors, including pressure. The predominant effect of reducing the pressure used in our models is a decrease in the absolute temperature of the reactions; a reduction in pressure leaves the relative temperature differences between the modelled reactions unchanged. Perhaps the most significant influence is the activity of the PdS2 and NiS2 components in pyrite. If those components are in solid solution within pyrite and we assume ideal mixing, then the activities of the PdS2 and NiS2 components are on the order of 10−6 and 10−2, respectively. Reactions (6) and (7) show that if
The relatively sparse association of Pd-Sb-As ± Te ± Hg phases with primary Cu-Au mineralization and the much greater abundance of PGM associated with later carbonate-rich, oxidized alteration suggests that the PGM were not precipitated during the primary hypogene event, but rather at some subsequent stage of alteration accompanying the breakdown of primary metal-rich pyrite. Platinum-group minerals in Group 1 samples are found along the grain boundaries of chalcopyrite and pyrite, whereas compositionally similar PGM are also found within martite in Group 2 samples. We infer that the precipitation of PGM was caused by secondary remobilization and reprecipitation of previously deposited Pd by an oxidized, sulfur-poor fluid (Figure 14) that destroyed metastable primary hypogene pyrite-vaesite solid solutions. A hematite-stable hydrothermal fluid (with a non-zero salinity) is capable of oxidizing PdS (our proxy for the Pd-rich pyrite component) to stabilize metallic Pd (our proxy for PGM) at isothermal conditions (Figure 14). If the fluid is sufficiently oxidized or Cl-rich, in the absence of reduced sulfur species like HS−, it has the capacity to transport ∼1 ppm Pd as PdCl3− (Figure 14). Localized interaction of that fluid with magnetite would buffer it to more reduced conditions, forcing the precipitation of metallic Pd or its intermetallic analogs in other PGM in the presence of other bonding elements such as Sb, As, etc.
It is intriguing to consider the possibility that there exists a Pd-rich porphyry end member deposit type that has escaped recognition because Pd is not spatially associated with ore-grade Cu or Au mineralization. The results of the modeling performed here indicate that in all but the least potassic (
Platinum-group element mineralization at New Afton occurred during the deposition of the primary Cu-Au ore body. Whereas the PGM contribute all of the Pd and Pt in Group 2 samples, PGE tenors in the predominant Group 1 samples comprising the main ore style are not controlled by PGM. Modelling shows that the co-precipitation of Co-Pt and Ni-Pd as components in pyrite can be described entirely by the cooling of an orthomagmatic hydrothermal fluid, regardless of whether it is a low-salinity vapor or a high-salinity liquid phase. The models also explain other characteristics recognized in the pyrite, including observations of oscillatory zoning of Co-Ni-Pd (fluctuations in T, fO2, and fS2 from transient fluid fluxes), the association of higher Se in pyrite with lower Co/Ni ratios (a consequence of cooling), and more 34S-depleted pyrite compositions hosting the highest Ni-Pd contents (a consequence of oxidation of ore fluids during cooling) (Boucher et al., 2023; companion paper).
Compositionally similar PGM within separate alteration facies are suggestive that their formation is not directly linked to the deposition of Pd with the main Cu-Au ore. A model where the secondary remobilization of Pd as Cl− complexes by an oxidized fluid at a lower temperature caused local depletions and enrichments in Pd adequately describes the mineralogical occurrences of the PGM in each alteration facies. Although the PGM are intriguing, their economic viability as a source of PGE is quite low; the PGM are volumetrically insignificant compared to the main stage Pd-rich pyrite.
The porphyry mapped at New Afton formed from an influx of metals and sulfur transported by a volatile phase from an underlying, degassing magma reservoir that continuously exploited the same structures that subsequently controlled the emplacement and elongation of the dioritic and monzonitic porphyry intrusions. Although the magma emplaced at the level of the deposit was certainly enriched in precious metals, it only had the capacity to deposit one-fifth of its Pd relative to Au. Whether the PGE that are unaccounted for remained behind in the solidifying magma or were transported outside of the porphyry environment is beyond the scope of this study, but there is undoubtedly a major PGE anomaly surrounding New Afton, as documented by our estimate of the average background Pd concentration in weakly altered volcanic host rocks. Comparison with more deposit-scale studies is necessary to fully address the behaviour of PGE in Au-bearing porphyry systems. Pd mineralization in chloride-rich potassic magmatic-orthomagmatic fluid systems may occur at higher temperatures than their associated Cu deposits, leading to failure to observe them.
Why are porphyry deposits so rarely known to be rich in Pd? The fact that very few systems like New Afton are known to exist may be a direct consequence of the overall high cost of the fire assays required to detect subeconomic to economic concentrations of PGE. It is possible that the true number of known PGE-rich porphyry deposits is hidden within vast proprietary datasets of mining companies, but it is more likely the case that they remain unknown due to the lack of PGE analyses included in most general exploration assay packages, their overall high cost, and the lack of association of PGE in the most common porphyry deposit models. It is noteworthy that analysis of Cu mineral concentrates would miss the bulk of Pd in similar systems, because it is likely to be mostly hosted by pyrite that does not report to the chalcopyrite concentrate. This study combined with numerous others (e.g., Eliopoulos and Economou-Eliopoulos, 1991; Tarkian and Koopmann, 1995; Tarkian and Stribrny, 1999; Nixon and Carbno, 2001; Thompson et al., 2002; Auge et al., 2005; Economou-Eliopoulos, 2005; LeFort et al., 2011) necessitates a re-evaluation of the precious metal potential within porphyry systems. We have shown that vastly increased exploration expenses are not required for the discovery of new PGE-rich porphyry systems. Porphyry systems with strongly mafic characteristics, notably Co and Ni enrichment such as New Afton, can be readily identified with typical exploration assay packages. The measurement of Co and Ni in pyrite, at concentrations (wt%-level) relevant to PGE co-precipitation, can be completed through relatively inexpensive and routine SEM/EPMA analyses. Geological mapping and sampling of alkaline porphyry systems should target possible redox buffers that may represent pathways and sinks of hydrothermally redistributed PGE, such as the early magnetite-apatite swarms at New Afton (one surficial sample of an outcropping IOA-style vein contained 309 ppb Pd). Selective surface sampling of redox-buffering redistribution pathways would greatly reduce the total cost and number of required PGE-sensitive fire assays at an early exploration stage with the potential of readily identifying the presence of an underlying PGE-rich system.
The original contributions presented in the study are included in the article/Supplementary Material, further inquiries can be directed to the corresponding author. Additional data utilized in this study are from the companion paper Boucher et al. (2023).
SR and BB performed fieldwork and interpretation, sample collection, and analytical work. SR performed statistical analysis of the data and all of the thermodynamic modelling. JM and JH conceived the project idea, secured funding, contributed interpretations, and assisted in the preparation of the manuscript. All authors contributed to the article and approved the submitted version.
The research was supported by funding from NSERC Discovery Grants to JH (RGPIN-2012-341762) and JM (RGPIN-2018-05327), and an NSERC Engage Grant (EGP-536604-18) to JM.
We thank Devin Wade and the exploration team at New Afton for their support during a field visit as well as many enlightening discussions. We also acknowledge New Gold Inc. for their support and allowing us access to drill core, databases, and geological models. Thank you to James Brenan for his countless, fruitful discussions and guidance with the LA-ICPMS at Dalhousie University. Thank you to two reviewers and the editor for their constructive comments that greatly increased the clarity of this manuscript.
The authors declare that the research was conducted in the absence of any commercial or financial relationships that could be construed as a potential conflict of interest.
All claims expressed in this article are solely those of the authors and do not necessarily represent those of their affiliated organizations, or those of the publisher, the editors and the reviewers. Any product that may be evaluated in this article, or claim that may be made by its manufacturer, is not guaranteed or endorsed by the publisher.
The Supplementary Material for this article can be found online at: https://www.frontiersin.org/articles/10.3389/feart.2023.819109/full#supplementary-material
Afifi, A. M., Kelly, W. C., and Essene, E. J. (1988b). Phase relations among tellurides, sulfides, and oxides: Ⅱ. Applications to telluride-bearing ore deposits. Econ. Geol. 83, 395–404. doi:10.2113/gsecongeo.83.2.395
Afifi, A. M., Kelly, W. C., and Essene, E. J. (1988a). Phase relations among tellurides, sulfides, and oxides: Ⅰ. Thermochemical data and calculated equilibria. Econ. Geol. 83, 377–394. doi:10.2113/gsecongeo.83.2.377
Audétat, A., Pettke, T., Heinrich, C. A., and Bodnar, R. J. (2008). Special Paper: the composition of magmatic-hydrothermal fluids in barren and mineralized intrusions. Econ. Geol. 103, 877–908. doi:10.2113/gsecongeo.103.5.877
Auge, T., Petrunov, R., and Bailly, L. (2005). ON THE ORIGIN OF THE PGE MINERALIZATION IN THE ELATSITE PORPHYRY Cu Au DEPOSIT, BULGARIA: comparison with the baula nuasahi complex, India, and other alkaline pge-rich porphyries. Can. Mineral. 43, 1355–1372. doi:10.2113/gscanmin.43.4.1355
Barnes, S-J., Cox, R. A., and Zientek, M. L. (2006). Platinum-group element, gold, silver, and base metal distribution in compositionally zoned sulfide droplets from the medvezky Creek mine, noril’sk, Russia. Contrib. Mineral. Petrol. 152, 187–200. doi:10.1007/s00410-006-0100-9
Barnes, S. J., and Liu, W. (2012). Pt and Pd mobility in hydrothermal fluids: evidence from komatiites and from thermodynamic modelling. Ore Geol. Rev. 44, 49–58. doi:10.1016/j.oregeorev.2011.08.004
Barnes, S. J., Mungall, J. E., and Maier, W. D. (2015). Platinum-group elements in mantle melts and mantle samples. Lithos 232, 395–417. doi:10.1016/j.lithos.2015.07.007
Bergen, R. D., Krutzelmann, H., and Rennie, D. W. (2015). Technical report on the new Afton mine. British Columbia, Canada, 256. NI 43-101 Report.
Boucher, B. M., Robb, S. J., Hanley, J. J., Kerr, M. J., and Mungall, J. E. (2023). Platinum-group elements (PGE) in the New Afton alkalic Cu-Au porphyry deposit, Canadian Cordillera, I: relationships between PGE, accessory metals and sulfur isotopes in pyrite. Front. Earth Sci. 11, 819129. doi:10.3389/feart.2023.819129
Brese, N. E., and von Schnering, H. G. (1994). Bonding trends in pyrites and a reinvestigation of the structures of PdAs2, PdSb2, PtSb2, and PtBi2. Z. Anorg. Allg. Chem. 620, 393–404. doi:10.1002/zaac.19946200302
Brostigen, G., Kjekshus, A., Wikander, G., Karrer, P., and Shimizu, A. (1970). On the relationships between the structure types pyrite, marcasite, and arsenopyrite. Acta Chem. Scand. 24, 2983–2992. doi:10.3891/acta.chem.scand.24-2983
Burdett, J. K., and Miller, G. J. (1987). Polyhedral clusters in solids: the electronic structure of pentlandite. J. Amer. Chem. Soc. 109, 4081–4091. doi:10.1021/ja00247a039
Burnham, C. W., and Ohmoto, H. (1980). Late-stage processes of felsic magmatism. Min. Geol. Spec. Issue 8, 1–11.
Cann, R. M. (1976). “Geochemistry of magnetite and the Genesis of magnetite-apatite lodes in the Iron Mask batholith,” in British Columbia (Vancouver, British Columbia: M.Sc. thesis, University of British Columbia).
Chilès, J-P., and Delfiner, P. (2012). Geostatistics: modeling spatial uncertainty. New Jersey: Wiley, 731.
Dare, S. A. S., Barnes, S. J., and Prichard, H. M. (2010). The distribution of platinum-group elements (PGE) and other chalcophile elements among sulfides from the Creighton Ni–Cu–PGE sulfide deposit, Sudbury, Canada, and the origin of palladium in pentlandite. Min. Dep. 45, 765–793. doi:10.1007/s00126-010-0295-6
Economou-Eliopoulos, M. (2005). “Platinum-group element potential of porphyry deposits,” in Exploration for platinum-group element deposits. Editors E. James,, and N. P. Mungall (Québec: Mineralogical Association of Canada), 203–235.
Einaudi, M. T., Hedenquist, J. W., and Inan, E. E. (2003). Sulfidation state of fluids in active and extinct hydrothermal systems: transitions from porphyry to epithermal environments. Soc. Econ. Geol. Spec. Pub. 10.
Eliopoulos, D. G., and Economou-Eliopoulos, M. (1991). Platinum-group element and gold contents in the Skouries porphyry copper deposit, chalkidiki peninsula, northern Greece. Econ. Geol. 86, 740–749. doi:10.2113/gsecongeo.86.4.740
Garagan, M. (2014). Textural and spatial relationship between platinum-group elements and alteration assemblages in the Afton porphyry system, Kamloops, British Columbia. B.Sc. Thesis. Halifax, Nova Scotia: Saint Mary's University.
Ghiorso, M. S., and Evans, B. W. (2008). Thermodynamics of rhombohedral oxide solid solutions and a revision of the Fe-Ti two-oxide geothermometer and oxygen-barometer. Amer J. Sci. 308, 957–1039. doi:10.2475/09.2008.01
Giggenbach, W. F. (2003). SEG Distinguished Lecture: magma degassing and mineral deposition in hydrothermal systems along convergent plate boundaries. Soc. Econ. Geol. Spec. Pub. 10, 1–18.
González-Jiménez, J. M., and Reich, M. (2017). An overview of the platinum-group element nanoparticles in mantle-hosted chromite deposits. Ore Geol. Rev. 81, 1236–1248. doi:10.1016/j.oregeorev.2016.06.022
Gronvold, F., and Rost, E. (1957). The crystal structure of PdSe2 and PdS2. Acta Cryst. 10, 329–331. doi:10.1107/s0365110x57000948
Hall, S. R., and Stewart, J. M. (1973). The crystal structure of argentian pentlandite (Fe,Ni)8AgS8, compared with the refined structure of pentlandite (Fe,Ni)9S8. Can. Mineral. 12, 169–177.
Hanley, J. J., Kerr, M., LeFort, D., Warren, M., MacKenzie, M., and Sedge, C. (2021). “Enrichment of platinum-group elements (PGE) in alkalic porphyry Cu-Au deposits in the Canadian Cordillera: new insights from mineralogical and fluid inclusion studies,” in Porphyry deposits of the northwestern Cordillera of north America: a 25-year update. Canadian institution of mining, metallurgy and petroleum. Editors L. Sharman, J. Lang, and J. Chapman, 57, 88–109.
Hanley, J. J. (2005). “The aqueous geochemistry of the platinum-group elements (PGE) in surficial, low-T hydrothermal and high-T magmatic-hydrothermal environments,” in Exploration for platinum-group element deposits. Editor E. N. p. JamesMungall (Mineralogical Association of Canada), 35–56.
Hou, T., Charlier, B., Holtz, F., Veksler, I., Zhang, Z., Thomas, R., et al. (2018). Immiscible hydrous Fe-Ca-P melt and the origin of iron oxide-apatite ore deposits. Nat. Comm. 9, 1415. doi:10.1038/s41467-018-03761-4
Johnson, J. W., Oelkers, E. H., and Helgeson, H. C. (1992). SUPCRT92: a software package for calculating the standard molal thermodynamic properties of minerals, gases, aqueous species, and reactions from 1 to 5000 bar and 0 to 1000 °C. Comp. Geosci. 18, 899–947. doi:10.1016/0098-3004(92)90029-q
Keith, M., Smith, D. J., Jenkin, G. R. T., Holwell, D. A., and Dye, M. D. (2018). A review of Te and Se systematics in hydrothermal pyrite from precious metal deposits: insights into ore-forming processes. Ore Geol. Rev. 96, 269–282. doi:10.1016/j.oregeorev.2017.07.023
Klein, F., and Bach, W. (2009). Fe-Ni-Co-O-S phase relations in peridotite-seawater interactions. Jour. Petrol. 50, 37–59. doi:10.1093/petrology/egn071
Kong, X-Z., Tutolo, B. M., and Saar, M. O. (2013). DBCreate: a SUPCRT92-based program for producing EQ3/6, toughreact, and gwb thermodynamic databases at user-defined T and P. Comp. Geosci. 51, 415–417. doi:10.1016/j.cageo.2012.08.004
Kravtsova, R. G., Tauson, V. L., Makshakov, A. S., Bryansky, N. V., and Smagunov, N. V. (2020). Platinum-group elements in arsenopyrites and pyrites of the Natalkinskoe gold deposit (Northeastern Russia). Minerals 10, 318–354. doi:10.3390/min10040318
Lang, J. R., Lueck, B., Mortensen, J. K., Russell, J. K., Stanley, C. R., and Thompson, J. F. H. (1995). Triassic-Jurassic silica-undersaturated and silica-saturated alkalic intrusions in the Cordillera of British Columbia: implications for arc magmatism. Geology 23, 451–454. doi:10.1130/0091-7613(1995)023<0451:tjsuas>2.3.co;2
Lecuyer, N. L., Rennie, D. W., Krutzelmann, H., and Vasquez, L. (2020). Technical report on the new Afton mine. British Columbia, 271. Canada, NI 43-101 Report.
LeFort, D. (2009). Evidence for low-to intermediate-sulfidation epithermal-style processes associated with an alkalic porphyry Cu-Au system at the Mt. Milligan Cu-Au deposit, Quesnel terrane, British Columbia. Halifax, NS: Saint Mary’s University. Canada (Unpublished Bachelor’s thesis).
LeFort, D., Hanley, J. J., and Guillong, M. (2011). Subepithermal Au-Pd mineralization associated with an alkalic porphyry Cu-Au deposit, mount milligan, Quesnel terrane, British Columbia, Canada. Econ. Geol. 106, 781–808. doi:10.2113/econgeo.106.5.781
Lerchbaumer, L., and Audétat, A. (2012). High Cu concentration in vapor-type fluid inclusions: an artifact? Geochim. Cosmochim. Acta 88, 255–274. doi:10.1016/j.gca.2012.04.033
Lipske, J., Libera, M. D., Petersen, M., and Wade, D. (2018). Geology and mineralization of the New Afton porphyry Cu-Au deposit. New Afton Site Tour Presentation.
Lipske, J., and Wade, D., (2014). Geological model of the new Afton copper and gold deposit, British Columbia. new Gold internal report, 53.
Liu, W., Migdisov, A., and Williams-Jones, A. (2012). The stability of aqueous nickel(II) chloride complexes in hydrothermal solutions: results of UV-Visible spectroscopic experiments. Geochim. Cosmochim. Acta 94, 276–290. doi:10.1016/j.gca.2012.04.055
Logan, J. M., and Mihalynuk, M. G., (2005). Porphyry Cu-Au deposits of the iron Mask batholith, southeastern British Columbia. B. C. Geol. Surv. Geol. Fieldwork 2005, 271–290.
MacDonald, G. A., and Katsura, I. (1964). Chemical composition of Hawaiian lavas. J. Petrology 5, 82–133. doi:10.1093/petrology/5.1.82
MacKenzie, M. K. (2009). Mineralogy of the platinum-group elements (PGE) in the Afton Cu-Au-Pd porphyry deposit, iron Mask batholith, Kamloops, British Columbia. Halifax, NS: Saint Mary’s University. (Unpublished Bachelor’s thesis).
Makovicky, E. (2006). “Crystal structures of sulfides and other chalcogenides,” in Rev. Mineral. Geochem 61. Editor David J. Vaughan (Min. Soc. Am.), 7–125.
Mansur, E. T., Barnes, S-J., Duran, C. J., and Sluzhenikin, S. F. (2019). Distribution of chalcophile and platinum-group elements among pyrrhotite, pentlandite, chalcopyrite and cubanite from the noril’sk-talnakh ores: implications for the formation of platinum-group minerals. Min. Dep. 55, 1215–1232. doi:10.1007/s00126-019-00926-z
McDonough, W. F., and Sun, S. (1995). The composition of the Earth. Chem. Geol. 120, 223–253. doi:10.1016/0009-2541(94)00140-4
McFall, K. A., Naden, J., Roberts, S., Baker, T., Spratt, J., and McDonald, I. (2018). Platinum-group minerals in the Skouries Cu-Au (Pd, Pt, Te) porphyry deposit. Ore Geol. Rev. 99, 344–364. doi:10.1016/j.oregeorev.2018.06.014
Monger, J. W. H., and McMillan, W. J. (1989). Geology, ashcroft. British Columbia: Geological Survey of Canada. Map 42-1981 Sheet 1.
Mortensen, J. K., Ghosh, D. K., and Ferri, F. (1995). U-Pb geochronology of intrusive rocks associated with copper-gold porphyry deposits in the Canadian Cordillera. Can. Inst. Min. Metall. Petrol Spec. Vol. 46, 42–158.
Mountain, B. W., and Wood, S. A. (1988). Chemical controls on the solubility, transport, and deposition of platinum and palladium in hydrothermal solutions - a thermodynamic approach. Econ. Geol. 83, 492–510. doi:10.2113/gsecongeo.83.3.492
Mungall, J. E., Brenan, J. M., Godel, B., Barnes, S. J., and Gaillard, F. (2015). Transport of metals and Sulphur in magmas by flotation of sulphide melt on vapour bubbles. Nat. Geosci. 8, 216–219. doi:10.1038/ngeo2373
Mungall, J. E., Hanley, J. J., Arndt, N. T., and Debecdelievre, A. (2006). Evidence from meimechites and other low-degree mantle melts for redox controls on mantle-crust fractionation of platinum-group elements. Proc. Nat. Acad. Sci. 103, 12695–12700. doi:10.1073/pnas.0600878103
Mungall, J. E., Long, K., Brenan, J. M., and Naslund, H. R. (2018). Immiscible shoshonitic and Fe-P-oxide melts preserved in unconsolidated tephra at El Laco volcano, Chile. Geology 46, 255–258. doi:10.1130/G39707.1
Mungall, J. E., (2002). Roasting the mantle: slab melting and the Genesis of major Au and Au-rich Cu deposits. Geology 30, 915–918. doi:10.1130/0091-7613(2002)030<0915:RTMSMA>2.0.CO;2
Nixon, G. T., and Carbno, B., (2001). Whiterocks mountain alkaline complex, south-central British Columbia: geology and Platinum-group-element mineralization. B. C. Geol. Surv. Geol. Fieldwork 2000, 191–222.
Nixon, G. T., and Laflamme, J. H. G. (2002). Cu-PGE mineralization in alkaline plutonic complexes (British Columbia Geological Survey Geofile 2002-02). Victoria, BC: British Columbia Ministry of Energy, Mines and Petroleum Resources.
Nixon, G. T. (2004). Platinum group elements in the Afton Cu-Au porphyry deposit, southern British Columbia. Victoria, BC: British Columbia Ministry of Energy, Mines and Petroleum Resources. Geological Fieldwork 2003, British Columbia Geological Survey Paper 2004-01, 263–289.
Nixon, G. T., (2003). Platinum-group elements in the Afton Cu-Au porphyry deposit, southern British Columbia. B. C. Geol. Surv. Geol. Fieldwork 2002, 263–290.
Pan, P., and Wood, S. A. (1994). Solubility of Pt and Pd sulfides and Au metal in aqueous bisulfide solutions: Ⅱ. Results at 200° to 350°C and saturated vapor pressure. Min. Dep. 29, 373–390. doi:10.1007/bf01886955
Pass, H. E. (2010). Breccia-hosted chemical and mineralogical zonation patterns of the northeast zone, Mt. Polley Cu-Ag-Au alkalic porphyry deposit, British Columbia, Canada (PhD thesis). Hobart, Australia: University of Tasmania.
Pass, H. E., Danyushevsky, L., Gilbert, S., Cooke, D. R., and Williams, P. J. (2009). “LA-ICP-MS analyses of PGE in pyrite and Cu-sulfides from Mt Polley alkali porphyry Cu-Au deposit, Canada,” in Smart Science for Exploration and Mining: Proc. 10th Bien SGA Meeting, Townsville, Australia, 17th-20th August 2009, 738–740.
Preece, S. J., McGimsey, R. G., Westgate, J. A., Pearce, N. J. G., Hart, W. K., and Perkins, W. T. (2014). Chemical complexity and source of the White River Ash, Alaska and Yukon. Geosphere 10, 1020–1042. doi:10.1130/GES00953.1
Richards, J. P. (2011). Magmatic to hydrothermal metal fluxes in convergent and collided margins. Ore Geol. Rev. 40, 1–26. doi:10.1016/j.oregeorev.2011.05.006
Sassani, D. C., and Shock, E. L. (1998). Solubility and transport of platinum-group elements in supercritical fluids: summary and estimates of thermodynamic properties for ruthenium, rhodium, palladium, and platinum solids, aqueous ions, and complexes to 1000°C and 5 kbar. Geochim. Cosmochim. Acta 62, 2643–2671. doi:10.1016/s0016-7037(98)00049-0
Saunders, J. E., Pearson, N. J., O’Reilly, S. Y., and Griffin, W. L. (2018). Gold in the mantle: a global assessment of abundance and redistribution processes. Lithos 322, 376–391. doi:10.1016/j.lithos.2018.10.022
Shannon, R. D. (1976). Revised effective ionic radii and systematic studies of interatomic distances in halides and chalcogenides. Acta Cryst. A32, 751–767. doi:10.1107/s0567739476001551
Snyder, L. D., and Russell, J. K., (1993). Field constraints on diverse igneous processes in the Iron Mask batholith. B. C. geo. Surv. Geol. Fieldwork 1992, 281–286.
Stanley, C. R., Lang, J. R., and Snyder, L. D., (1994). Geology and mineralization in the northern part of the iron Mask batholith, Kamloops, British Columbia. B. C. geo. Surv. Geol. Fieldwork 1993, 269–274.
Stefansson, A., and Seward, T. M., (2003). Stability of chloridogold(I) complexes in aqueous solutions from 300 to 600°C and from 500 to 1800 bar. Geochim. Cosmochim. Acta 67 (23), 4559–4576. doi:10.1016/S0016-7037(03)00391-0
Stefansson, A., and Seward, T. M., (2004). Gold(I) complexing in aqueous sulphidesolutions to 500°C at 500 bar. Geochim. Cosmochim. Acta 68 (20), 4121–4143. doi:10.1016/j.gca.2004.04.006
Sullivan, N. A. (2020). Mobilization of Platinum, Palladium and Gold by magmatic brines: an experimental study. Toronto, Ontario: Ph.D. thesis, University of Toronto.
Sullivan, N. A., Zajacz, Z., and Brenan, J. M. (2018). The solubility of Pd and Au in hydrous intermediate silicate melts: the effect of oxygen fugacity and the addition of Cl and S. Geochim. Cosmochim. Acta 231, 15–29. doi:10.1016/j.gca.2018.03.019
Symons, D. T. A. (1985). Paleomagnetism of the triassic Nicola volcanics and geotectonics of the quesnellia subterrane of terrane I, British Columbia. Jour. Geodyn. 2, 229–244. doi:10.1016/0264-3707(85)90012-2
Tagirov, B. R., Baranova, N. N., Zotov, A. V., Akinfiev, N. N., Polotnyanko, N. A., Shikina, N. D., et al. (2013). The speciation and transport of palladium in hydrothermal fluids: experimental modeling and thermodynamic constraints. Geochim. Cosmochim. Acta 117, 348–373. doi:10.1016/j.gca.2013.03.047
Tagirov, B. R., Filimonova, O. N., Trigub, A. L., Akinfiev, N. N., Nickolsky, M. S., Kvashnina, K. O., et al. (2019). Platinum transport in chloride-bearing fluids and melts: insights from in situ X-ray absorption spectroscopy and thermodynamic modeling. Geochim. Cosmochim. Acta 254, 86–101. doi:10.1016/j.gca.2019.03.023
Tarkian, M., Hunken, U., Tokmakchieva, M., and Bogdanov, K. (2003). Precious-metal distribution and fluid-inclusion petrography of the Elatsite porphyry copper deposit, Bulgaria. Min. Dep. 38, 261–281. doi:10.1007/s00126-002-0336-x
Tarkian, M., and Koopmann, G. (1995). Platinum-group minerals in the Santo tomas II (philex) porphyry copper-gold deposit, luzon island, Philippines. Min. Dep. 30. doi:10.1007/bf00208875
Tarkian, M., and Stribrny, B. (1999). Platingruppen-elemente in porphyrischen kupfer Lagersttten: Eine berblicksstudie. Min. Petrol. 65, 161–183. doi:10.1007/bf01161959
Thompson, J. F. H., Lang, J. R., and Stanley, C. R. (2002). “Platinum group elements in alkaline porphyry deposits, British Columbia,” in Exploration and mining in British Columbia – 2001 (Victoria, BC: BC Min. Energy and Mines), 57–64.
Warren, M. R. (2010). The origin and distribution of platinum-group metals in the Mt. Milligan alkalic Cu-Au porphyry deposit, B.C., Canada. Halifax, NS: Saint Mary's University. (Unpublished Bachelor’s thesis).
Williams-Jones, A. E., and Heinrich, C. A. (2005). 100th anniversary special paper: vapor transport of metals and the formation of magmatic-hydrothermal ore deposits. Econ. Geol. 100, 1287–1312. doi:10.2113/gsecongeo.100.7.1287
Wolery, T. J. (1992). EQ3NR, A computer program for geochemical aqueous speciation-solubility calculations: theoretical manual, user's guide, and related documentation (version 7). Lawrence Livermore National Laboratory, 262.
Keywords: porphyry, hydrothermal, modeling, platinum-group elements (PGE), platinum-group minerals (PGM), New Afton
Citation: Robb SJ, Boucher BM, Mungall JE and Hanley JJ (2023) Platinum-group elements (PGE) in the New Afton alkalic Cu-Au porphyry deposit, Canadian Cordillera, II: PGE distribution and models for the hydrothermal coprecipitation of Co-Ni-Pd-Pt in pyrite. Front. Earth Sci. 11:819109. doi: 10.3389/feart.2023.819109
Received: 20 November 2021; Accepted: 27 June 2023;
Published: 29 August 2023.
Edited by:
Zoltan Zajacz, University of Geneva, SwitzerlandReviewed by:
John Mavrogenes, Australian National University, AustraliaCopyright © 2023 Robb, Boucher, Mungall and Hanley. This is an open-access article distributed under the terms of the Creative Commons Attribution License (CC BY). The use, distribution or reproduction in other forums is permitted, provided the original author(s) and the copyright owner(s) are credited and that the original publication in this journal is cited, in accordance with accepted academic practice. No use, distribution or reproduction is permitted which does not comply with these terms.
*Correspondence: Jacob J. Hanley, amFjb2IuaGFubGV5QHNtdS5jYQ==
Disclaimer: All claims expressed in this article are solely those of the authors and do not necessarily represent those of their affiliated organizations, or those of the publisher, the editors and the reviewers. Any product that may be evaluated in this article or claim that may be made by its manufacturer is not guaranteed or endorsed by the publisher.
Research integrity at Frontiers
Learn more about the work of our research integrity team to safeguard the quality of each article we publish.