 Sifeng Zhang1
 Zhicheng Ren
94% of researchers rate our articles as excellent or good
Learn more about the work of our research integrity team to safeguard the quality of each article we publish.
Find out more
ORIGINAL RESEARCH article
Front. Earth Sci. , 11 January 2024
Sec. Geohazards and Georisks
Volume 11 - 2023 | https://doi.org/10.3389/feart.2023.1349933
This article is part of the Research Topic Evolution Mechanism and Control Method of Engineering Disasters Under Complex Environment View all 30 articles
In recent years, super-long and super-large diameter pipe piles have been gradually applied to the foundation in the Yellow River flood area. However, its bearing mechanism is not clear, especially the unclear bearing characteristics of the pile under the eccentric state, which limits its application and development. In this regard, this paper uses the method of combining field test and numerical simulation to analyze the bearing characteristics of super-long and super-large diameter pipe piles under different pile lengths, different pile diameters, different diameter-thickness ratios, and different offsets. Combined with the specific deviation form of the pipe pile, the calculation formula of the vertical ultimate bearing capacity of the super-long and super-long diameter pipe pile in the Yellow River flooding area under the influence of the construction effect is modified. The results show that when the length of the pipe pile changes, the vertical bearing capacity changes the most, and the vertical ultimate bearing capacity of the pipe pile increases linearly with the increase of the length of the pipe pile. When the wall thickness of the pipe pile increases, the vertical bearing capacity increases approximately linearly, but the reduction of the pile displacement decreases exponentially. The greater the deflection of the pipe pile, the smaller the vertical ultimate bearing capacity. When the deflection of the pipe pile is greater than 0.35°, the vertical ultimate bearing capacity decreases rapidly with the increase of the deflection. On the basis of the traditional formula, considering the deviation form of the pipe pile, the reduction coefficient of the bearing capacity correction formula of the super-long and super-large diameter pipe pile is proposed, and the correction formula is compared with the field example. It is proved that the formula can accurately calculate the bearing capacity of the super-long and super-large diameter pipe pile. The research results of this paper are of great significance to the application and promotion of super-long and super-large diameter pipe piles in the Yellow River flood area and the evaluation of vertical ultimate bearing capacity. At the same time, the research results of this paper can also provide a reference for the study of bearing characteristics of super-long and super-large diameter pipe piles in other foundations.
Prestressed high strength concrete pipe pile (PHC) has the advantages of good performance, low price and convenient construction. It is widely used in wharf engineering (Coyle and Reese, 1966; Burland and Burland, 1973; Fleming, 1992). The bearing characteristics of pipe piles are an important part of pipe pile construction. Understanding the bearing characteristics of pipe piles is of great significance for engineering design, foundation improvement, structural design and construction control, which can ensure the safety, reliability and long-term stability of the project.
In theoretical analysis, Chin et al. (1990) combined the boundary element method with the elastic theory, and divided the foundation into upper and lower layers, and analyzed the bearing capacity of pile groups with high caps. Poulos and Davis (1974) used the Mindlin solution to analyze the three-dimensional stress at any point of the soil around the pile. At the same time, the soil around the pile is divided into small segments, and its distribution under pile side resistance and pile tip resistance is analyzed, which provides a theoretical basis for the layered summation method. Liu (2008) proposed a pile-sinking positive force prediction formula based on the side resistance degradation effect by using the h/D effect and the double-bridge static cone penetration data.M.H (El Naggar and Wei, 2000; Liu et al., 2010) have shown that the radial heterogeneity of the soil around the pile not only affects the bearing characteristics of the pile, but also has a significant effect on its dynamic characteristics (Tian et al., 2015; Li et al., 2017). In numerical simulation, Kee et al. (2006) used FLAC2D software to analyze the influence of pile-soil contact surface roughness on bearing capacity. Jae et al. (2012) analyzed the influence of different pile end contact surfaces on the bearing capacity of pile foundation by finite element method. Guo et al. (2004) predicted the eccentric bearing capacity of single PHC pipe pile by using successive linear probability method and residual error correction, and simulated it with finite element method. Matos et al. (2018) studied the cumulative settlement law of model pipe piles with different intervals under cyclic loading in sand, and proposed a method to calibrate the accuracy of finite element numerical simulation of model pipe piles. Lehane and Gavin (2001) found that there is no obvious difference between the load-settlement curves of the pile end of the closed pile and the open pile wall through the static pressure steel pipe pile load test in sand. Bekki et al. (2013) studied the change of ultimate bearing capacity of pile foundation model in sand under long-term cyclic loading, and found that the ultimate bearing capacity of pile foundation will increase first and then decrease under cyclic loading. Wang et al. (2019) studied the variation law of pile sinking resistance, pile axial force and unit side friction resistance of pile body in the process of static pressure sinking through FBG sensing technology. In the field test, Sivaraman and Muthukkumaran (2022) showed that the static load test of pile foundation on site showed that the use of fill for surcharge preloading could promote the consolidation of foundation soil and improve the shear strength. The depth could reach 5 m, and the bearing capacity of pile was significantly improved. The field test of pile foundation is also used to study the bearing capacity of a series of new pile foundations, such as large diameter belled concrete pile (Gao et al., 2019), cement stabilized gravel pile (Gao et al., 2022) and geothermal energy (Jiang et al., 2023). Hong and Chen (1985) carried out pile sinking test in composite foundation. The research shows that the exertion of pile side friction is not only affected by soil properties, but also related to pile diameter. Zhang et al. (2010) put forward the concept of side resistance degradation coefficient and time effect coefficient through two aspects of pile sinking process and time effect of bearing capacity. Randolph et al. (1991) studied and obtained the force balance equation of soil plug. Zang et al. (2009) carried out the timeliness test of pile foundation bearing capacity, and found that the increase of shear strength of pile side clay will significantly increase the bearing capacity of friction pile, and the ultimate bearing capacity is hyperbolic with time. Previous studies have summarized the influence of different lengths, different wall thicknesses and other factors on the bearing characteristics of pipe piles, and the formula for calculating the bearing capacity of pipe piles has been continuously improved. However, the research on the bearing characteristics of pipe piles in the Yellow River flood area with extremely complex engineering geology is extremely scarce. In the calculation of the bearing capacity of pipe piles, the influence of eccentricity on the bearing capacity of pipe piles is not considered. In the past research, the length of the pile is shorter. Compared with the short pile, the side resistance of the long pile plays a major role, while the end resistance of the short pile plays an important role in the whole bearing capacity. The length of the long pile is large, and the pile can also bear part of the load. The stiffness and strength of the pile also play a certain role in the load transfer.
In recent years, due to the continuous rise of large-scale projects, the demand for the diameter and length of pipe piles required in foundation reinforcement treatment has increased. Super-large diameter (pile diameter ≥800 mm) and super-long pipe piles have gradually been promoted. At present, there is no specific definition of super-long pile in the code and the engineering community. It is generally classified according to the length-diameter ratio or length of the pile. Sang and Tan (2014), Miao et al. (2018) and others think that PHC pipe piles with a length of more than 50 m are super-long piles. The super-long PHC pipe piles studied by Pan (2006) and Jiang (2012) are longer than 60 m and the length-diameter ratio is greater than 60. The super-long PHC pipe piles studied by Cai et al. (2006) are less than 50 m and the length-diameter ratio is greater than 40. This paper considers that the super-long PHC pipe pile is the pile length L is less than 50 m but the length-diameter ratio L/d is greater than or equal to 40. The Yellow River flood area is a swamp area formed after the diversion of the Yellow River. The soil is mainly composed of Quaternary new alluvial silt. It has the characteristics of poor adhesion between particles, high compressibility, low strength and poor particle gradation (Jin et al., 2020). Its engineering properties are poor. For the Yellow River flood area with complex engineering geology, it is not possible to accurately calculate and analyze the bearing capacity of the pile foundation in the later construction stage. The research on its bearing characteristics needs to be improved. In this paper, the influence of different factors on the bearing characteristics of super-long and super-large diameter pipe piles in the Yellow River flood area is studied by means of numerical simulation and field test. According to the offset form of pipe piles, the reduction coefficient of bearing capacity of pipe piles is proposed, and the traditional formula is modified.
Jigao Expressway is connected to the east section of the second ring line of Jinan Ring Expressway under construction in the south, and to the Gaoqing to Guangrao section of Changshen Expressway under construction in the north. The total length of the road section is 94.340 km, and the design speed is 120 km/h. The starting and ending pile numbers of the fourth contract section of Jigao Expressway Road and Bridge Project are: K53 + 074 ∼ K80 + 290, with a total length of 27.216 km. The test engineering pile is located in the K63 + 037 channel bridge of Haojia Village, Gaoqing County, Zibo City, the fourth section of Jigao Expressway.
The Φ800 mm PHC pipe pile is used in the field test, the pile length is 43.0 m, and the pile end is located in the fine sand layer. The ground elevation of the site is about 15.5 m. The foundation soil is divided into 8 layers from top to bottom. The composition and characteristics are shown in Table 1. Different types of soil have different mechanical properties. The cohesion and internal friction angle of soil determine the shear resistance of soil, which affects the lateral resistance of pipe pile, and then affects the bearing capacity of pipe pile. The foundation soil parameters include soil type, strength parameters, soil layer distribution and thickness, which have an important influence on the bearing characteristics of pipe piles. In the design and analysis of pipe piles, it is necessary to accurately evaluate and reasonably consider the parameters of foundation soil to ensure the safety and reliability of pipe piles.
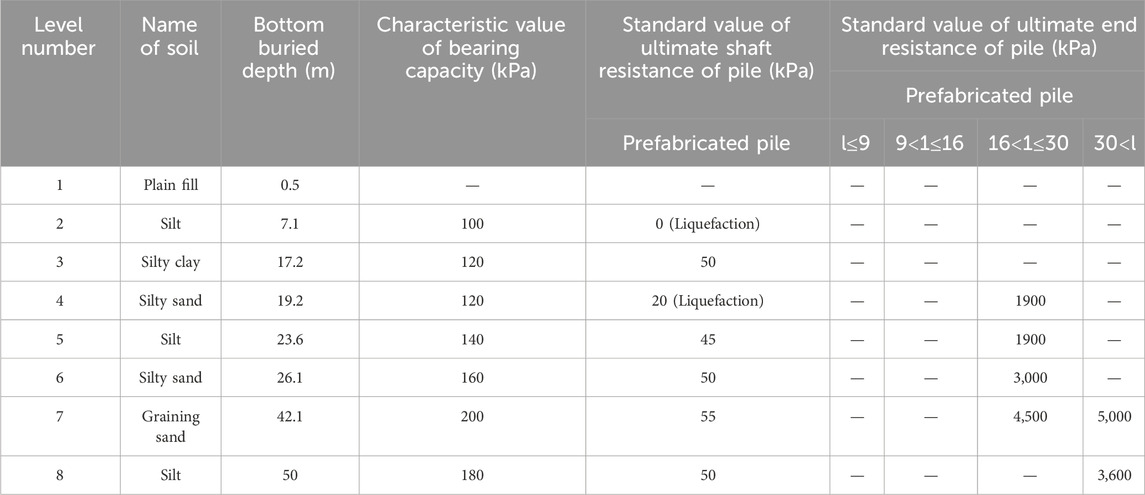
TABLE 1. Engineering geological parameters of foundation soil.
In Table 1: Characteristic value of bearing capacity refers to the pressure value corresponding to the deformation specified in the linear deformation section of the foundation soil pressure deformation curve determined by the load test, and its maximum value is the proportional limit value. Standard value of ultimate shaft resistance of pile refers to the rock and soil resistance on the side surface of the pile when the ultimate load is applied to the pile top. Standard value of ultimate end resistance of pile refers to the rock and soil resistance at the end of the pile corresponding to the ultimate load of the pile top. Standard value of ultimate shaft resistance of pile and standard value of ultimate end resistance of pile are determined by the static load test by embedding the axial force test element of the pile body.
The main equipment of the test is as follows: Reaction device: Using bagged sand and concrete, the concrete specification is 1 m × 1 m × 0.8 m, the specific gravity is 2.4t/m3, and the specification of each bag of sand is 120 kg; three jacks with the specification of QF320; several displacement/pressure sensors; 3 oil pumps; one static load tester, model JSM-JC5 (G). The slow sustained load method was used in the test. The test site is shown in Figure 1.
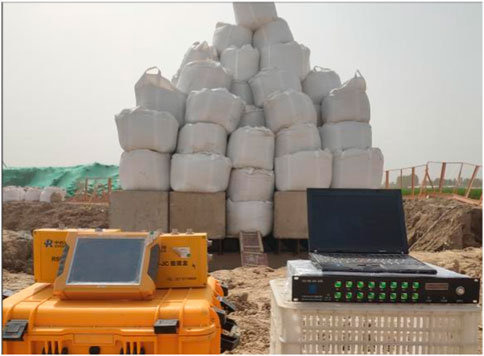
FIGURE 1. Static load test site.
The static load test should be carried out 14 days after the construction of the test pile. The vertical compressive static load test of single pile of large diameter pipe pile is carried out by slow maintenance load method. The load of each stage is 810 kN. The initial loading value is 2 times of the loading value of each stage, that is, 1,620 kN. After that, the loading value of each stage is 810 kN, until the pile foundation reaches the limit state, and then the load is unloaded step by step.
The ultimate bearing capacity is determined according to the following principles: Steep drop type Q-S curve(Q stands for load, s stands for settlement), take the load value at the inflection point. According to the characteristics of the settlement time, the front load value of the tail of the S-lgt curve is obviously bent downward. The settlement caused by the applied load is more than 5 times of the settlement caused by the previous load, and the load value of the previous section is taken. The load value corresponding to the displacement S = 40 mm is taken from the gentle Q-S curve. For piles with a diameter of more than 800 mm, the load value corresponding to S = 0.05 times the pile diameter is taken.
After the loading is completed, the unloading should be graded, and 2 times of the value of each stage of loading should be taken as the first-level unloading amount. The rebound displacement of pile top should be monitored when each load is unloaded. After unloading each load, the rebound amount of the pile top is recorded. The monitoring, recording methods and standards are consistent with the monitoring when the load is applied and the settlement value of the pile top is recorded. Until the rebound value is stable, the first-stage load is unloaded in the same way. After the unloading is completed, the monitoring should be continued, and 4 times should be observed within 2 h.
The Q-S curve of the static load test pile is shown in Figure 2. From the Q-S curve, it can be seen that the rebound amount of the pile top is 16.79 mm when the unloading is completed and stable after loading to the maximum load; the maximum test load Q and the corresponding pile top displacement S are 8,910 kN and 52.25 mm, respectively. The vertical ultimate bearing capacity of single pile Q and its corresponding pile top displacement S are 8,100 kN and 33.78 mm, respectively. The ultimate bearing capacity of the test pile is 8,100 kN measured by the static load test, and the characteristic value of the design bearing capacity is 3,500 kN. At the same time, the Q ∼ S curve of the pile decreases obviously at 9,000 kN, indicating that the pile reaches the ultimate bearing capacity and has been damaged. It shows that the bearing capacity meets the requirements of the site.
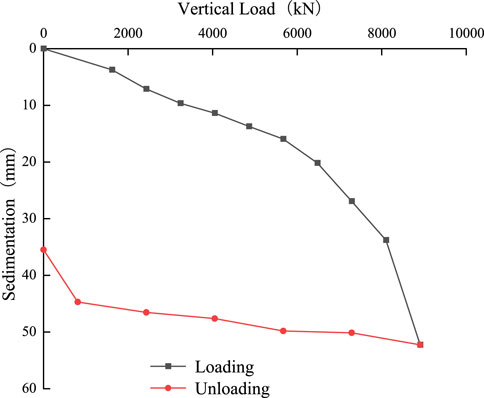
FIGURE 2. Q-S curve of test pile.
Soil is a kind of loose medium, which is different from other materials. Under the continuous action of dynamic load, the connection force between soil particles will become smaller and smaller. Therefore, under the continuous dynamic load, the site soil will not only undergo elastic deformation but also produce great plastic deformation, so the inelastic characteristics of the soil should be fully considered. The commonly used elastic-plastic models of soil are Mohr-coulomb, Drucker-Prager, MCC, etc. Mohr-Coulomb can well simulate the mechanical parameters of soil under cyclic loading, which is widely used in the simulation of geotechnical materials. The Mohr-Coulomb constitutive model has exTaking the Mohr–Coulomb as the failure criterion, this model can consider both shear hardening and compression hardening, and can accurately reflect the nonlinear mechanical characteristics during soil loading and unloadingcellent analysis reliability in a certain range of lateral stress (Han et al., 2023). In addition, the Mohr-Coulomb constitutive model has excellent analysis reliability in a certain range of lateral stress. In addition, the model parameters are less and easy to obtain. Therefore, Mohr-Coulomb is used to simulate the mechanical parameters of soil in this paper.
Firstly, the soil mesh is established by layered grouping, and different groups are named, and the initial density of the soil is given. Then, the contact surface between pile and soil is established and given different parameters, and then the pile element is established. Next, different types of mechanical parameters are assigned to each soil layer and pile unit, including bulk modulus, shear modulus, cohesion, internal friction angle and structural density. Then, the pile is moved into the soil layer, and the boundary conditions are imposed on the soil around the pile. Finally, the system balances the model under the condition of self-weight stress, and applies vertical load in stages for calculation. The program uses the fast Lagrangian method in mathematics. Based on the explicit difference, the step-size solution of all the motion equations and constitutive equations of the model is obtained. The constitutive equation is derived from the fundamental stress-strain definition and Hooke’s law. The motion balance equation directly applies the Cauchy motion equation, which is derived from Newton’s law of motion.
A half-mode model is established in modeling, and the calculation model, in addition to the pipe pile, takes into account the influence of pipe pile construction on the soil around the pile, and also expands the model boundary of the soil to more than ten times of the pile diameter to ensure the accuracy of the simulation calculation.
According to the relevant engineering experience, the influence range of the soil around the pile after the construction and construction of the pipe pile is about 10 times the diameter of the pile, and the boundary is more than 10 times the diameter of the pile when the model is established. The test model is 60 m long, 30 m wide and 60 m high. According to the deformation characteristics caused by the pipe pile, the grid of the soil around the pile is densely arranged. The grid far away from the pile can be sparsely arranged, which can reduce the amount of calculation and improve the accuracy of the data. Because FLAC3D can not realize the process of completely penetrating the pipe pile from the outside of the soil into the soil, the pipe pile is first penetrated into the soil through the built-in command, the fixed boundary conditions are used to constrain the normal direction of the model around and at the bottom, but the vertical load is not applied at the top of the pile, and the self-weight balance is carried out before the start of the bearing capacity characteristic test. The three-digit diagram of the model is shown in Figure 3.
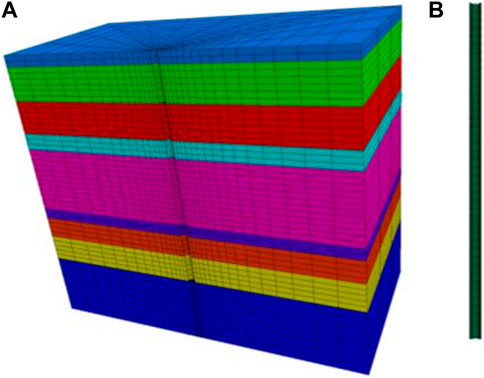
FIGURE 3. Model diagram. (A) Pipe pile. (B) Soil mass.
To determine the frictional force of pipe strings, the contact characteristics between the pipe string and the surrounding medium and the mechanical law need to be understood (Li et al., 2023). The parameters of different soil layers are obtained from the geotechnical report of the construction site, as shown in Table 1 below. When establishing the contact surface, the “move-and-move” method is used to establish the contact surface between the pile and the soil. The soil depth corresponds to the depth of the contact surface, the interaction between pile and soil is realized by setting the contact surface between pile and soil and setting the parameters of the contact surface. The contact surface in FLAC3D adopts the non-thickness contact surface element, and the contact surface constitutive model adopts the Coulomb shear model. The contact surface parameters are shown in Table 2 and Table 3 below.
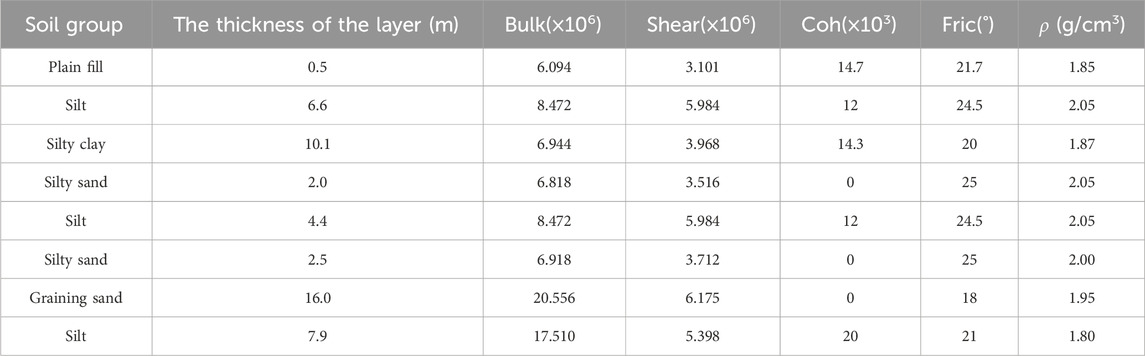
TABLE 2. Soil parameter table.

TABLE 3. Contact surface parameter table.
In the civil engineering simulation test, the original stress is also an important factor to control the calculation results, so it is necessary to consider the influence of the self-weight stress of the model on the stress and strain. In this experiment, there is no obstacle around the construction, so it is necessary to consider the influence of the initial stress of the model on the calculation results, and adopt the Mohr-Coulomb yield criterion. The stress cloud diagram of the established model after balance under self-weight balance is shown in the Figure 4.
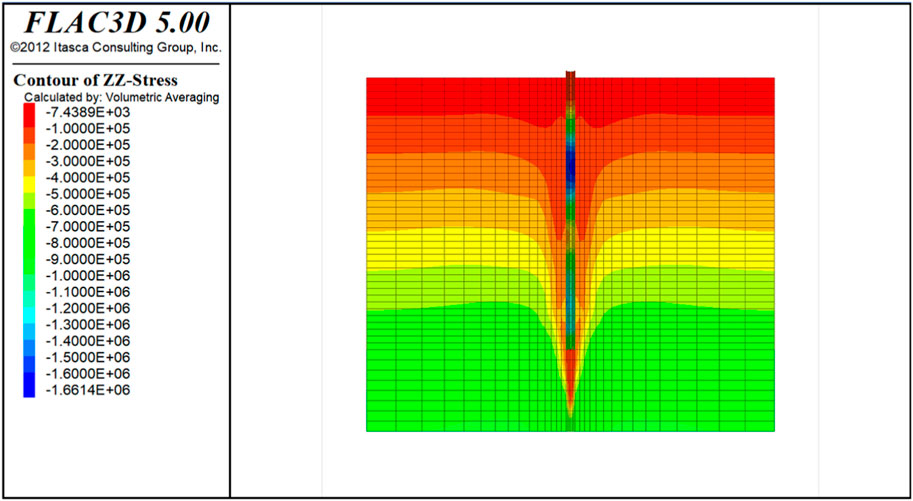
FIGURE 4. The stress cloud diagram of the established model after balance under self-weight balance.
The model is generated by flac3d built-in grids cshell and radcylinder. The grid is a reflective grid. The closer the grid is to the pipe pile, the denser the grid is. The number of grids in the model is 10,404 and the number of nodes is 12,619.
In order to verify the correctness of the numerical model, after the model is established, the pile body and the pile side soil are filled on the basis of the semi-model test, and the vertical load is applied to record the displacement of the pile top under each load. Finally, the Q-S curve is obtained to verify the accuracy of the test. The default convergence of Flac3D is that the unbalanced force rate reaches the-5th power of 10 (1e-5), and the unbalanced force rate of each step reaches the-5th power of 10, so the model is convergent. The model is established and the results after the self-weight stress balance are shown in Figure 5.
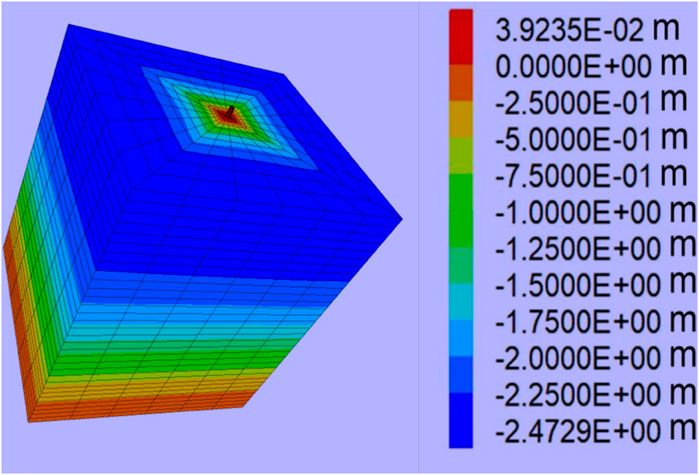
FIGURE 5. The Z-direction displacement cloud diagram of the model after self-weight balance.
When the model is balanced under self-weight stress, the vertical load is applied to the top of the model pile, and the displacement of the pile top node under each load is recorded. Finally, the Q-S curve of the pipe pile is made by using the load and displacement.
The Q-S curve of the model test is obtained by the vertical displacement of the pipe pile measured when the vertical load is applied to the pile top. The vertical bearing Q-S curve of the pipe pile obtained by numerical simulation and field measurement is shown in Figure 6.
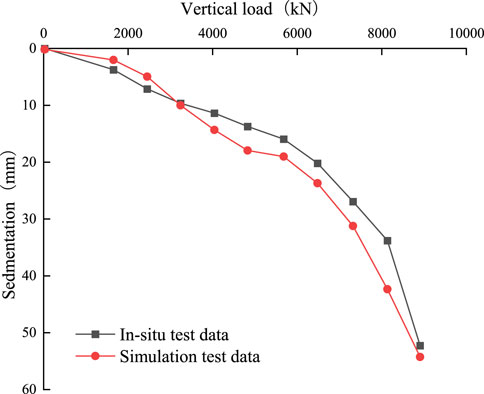
FIGURE 6. Q-S curve of pipe pile foundation measured by field and simulation.
From Figure 6, it can be found that by establishing a numerical calculation model for the bearing capacity of pipe pile foundation, the measured vertical cumulative settlement deformation of pipe pile under the same vertical load is close to the actual measured cumulative settlement of pipe pile, which verifies the accuracy of the calculation results of this numerical model. Therefore, the numerical model can be used to study the vertical bearing capacity of pipe pile.
In this section, the vertical bearing characteristics of pipe piles under different pile lengths, pile diameters and diameter-thickness ratios are studied through the calculation model of pipe pile bearing capacity. After the completion of the model, the vertical load is applied to the pile top along the Z direction, and the Z-direction displacement of the pile top under the vertical load is monitored and recorded, so as to obtain the corresponding vertical displacement of the pile top under different vertical loads. Finally, the Q-S curve of the pipe pile is drawn. The length, diameter and diameter-thickness ratio of the pile are set as shown in Table 4.
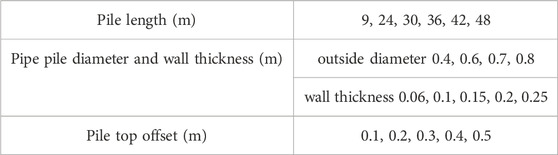
TABLE 4. Pile length, pile diameter and diameter-thickness ratio.
In this section, the vertical bearing capacity calculation model of single pipe pile is established, and the height of soil around the pile, pipe pile and layered soil in the simulation is modified to study the change of bearing characteristics of pipe pile under different pile lengths.
In the model test, the length of the model pile is set to 9 m, 24 m, 30 m, 36 m, 42 m, 48 m, the outer diameter of the pipe pile is 0.8 m, and the wall thickness is 0.06 m. Since the model is a half-mode model, the vertical load applied to the pile top is half of the full-mode model.
PHC prestressed concrete pipe piles are divided into friction piles and end-bearing piles. The friction piles mainly rely on the pile side resistance to improve the bearing performance of the bridge pile foundation, and the pile end resistance only plays a secondary role in the bearing performance. For pipe piles with different pile lengths, the limit value of pile side friction resistance will also be different. The development of pile side resistance and pile end resistance of pipe piles under three different conditions of pile length of 36m, 42m and 48 m is shown in Figure 7 and Figure 8.
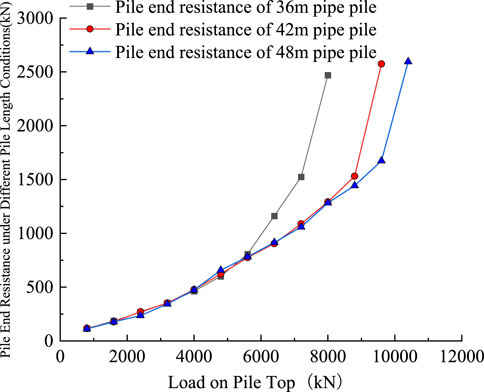
FIGURE 7. End resistance of pipe piles with different pile lengths.
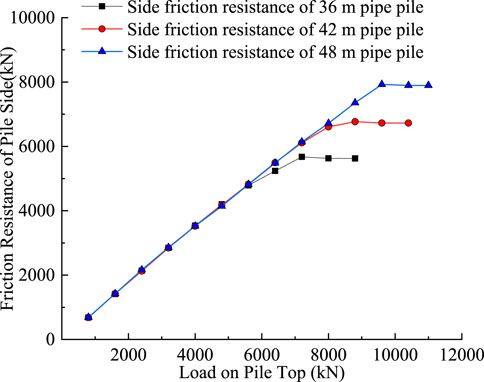
FIGURE 8. Pile side friction resistance of pipe piles with different pile lengths.
It can be seen from Figure 7 that the pile tip resistance of pipe piles with different pile lengths gradually increases with the increase of vertical load applied on the pile top, and the pile tip resistance increases slowly under the action of small vertical loads in the first few stages. When the vertical load on the pile top is large, the pile tip resistance increases faster. Comparing the changes of pile tip resistance under different pile lengths, it can be found that the pile length has little effect on the pile tip resistance, and regardless of the pile length, the ultimate resistance of the pile tip is close to each other.
It can be seen from Figure 8 that the pile side resistance of the pipe pile increases linearly with the increase of the pile top load. When the pile side resistance of the pipe pile reaches the maximum value that it can bear, the pile side resistance will be slightly reduced by continuing to apply the vertical load. When the pile top load continues to increase, the pile side resistance tends to be stable.
The vertical bearing capacity of pipe pile is closely related to the pile length. In order to study the influence of pile length on the bearing capacity of pipe pile, six kinds of pipe pile characteristics research models with pile length of 9 m, 24 m, 30 m, 36 m, 42 m and 48 m are established. The vertical load is applied to the top of the pile, and the bearing capacity displacement curve of the pipe pile under different pile length conditions is obtained. Figure 9 and Figure 10 are the bearing capacity displacement (Q-S) curves of pipe piles under different pile lengths.
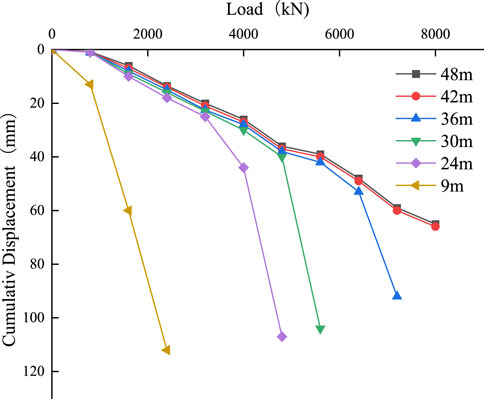
FIGURE 9. Load-displacement curves of pipe piles with different pile lengths.
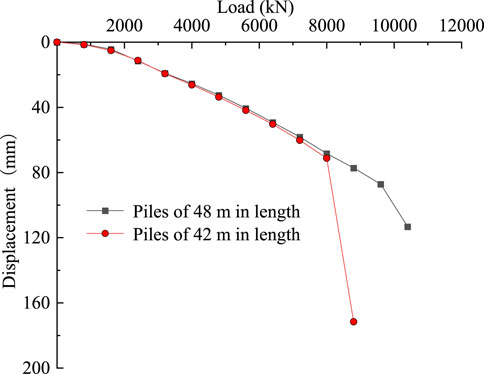
FIGURE 10. Load-displacement curves of 42m and 48 long pipe piles.
From Figure 9 and Figure 10, it can be found that the bearing capacity of the pipe pile is positively correlated with the pile length. The 9 m long pipe pile produces large displacement deformation under the action of small vertical load, and its bearing capacity is weaker than that of the long pipe pile. When the vertical load on the pile top is small, the vertical displacement of the remaining pipe piles increases linearly with the increase of the load on the pile top. Continue to increase the load to reach the vertical ultimate bearing capacity of the 24 m long pipe pile. At this time, the pipe pile has a large vertical displacement, which indicates that the bearing capacity of the pipe pile reaches the limit value at this time. The restraint effect of the pile side friction on the pipe pile is weakened, and the pipe pile will penetrate the soil to cause its instability. The increase of pile length is mainly due to the increase of lateral resistance of pipe pile. At this time, the vertical ultimate bearing capacity of pipe pile is improved.
The ultimate bearing capacity of pipe pile under different pile length conditions is listed separately, and the variation diagram of ultimate bearing capacity of pipe pile under different pile length conditions is obtained, as shown in Figure 11. From the diagram, it can be found that the vertical ultimate bearing capacity of the pipe pile increases linearly with the increase of the length of the pipe pile. When the pile length of the pipe pile increases from 9 m to 48 m, the vertical ultimate bearing capacity of the pipe pile increases from 1,600 kN to about 9,600 kN. It can be seen that the pile length has a strong positive effect on the vertical bearing capacity of the pipe pile.
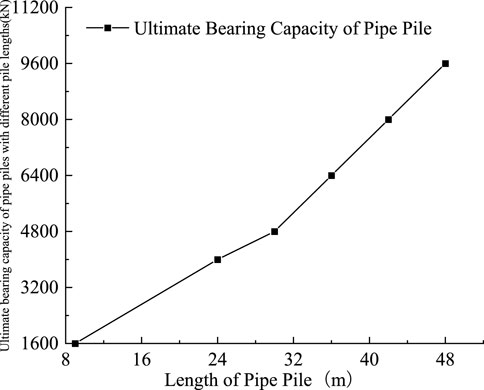
FIGURE 11. Ultimate bearing capacity of pipe piles with different pile lengths.
In this section, the outer diameter of the model pile is set to 0.6 m, 0.7∼m, 0.8 m, and the length of the pipe pile is 48 m. The vertical load is applied to the pile top, and the gradient of each load is 800 kN. At the same time, the displacement of the pile top node, the pile end resistance and the pile side friction resistance are recorded when the vertical load is applied.
From Figure 12 and Figure 13, it can be found that the larger the diameter of the pipe pile is, the greater the bearing capacity of the pipe pile end is, and the more obvious the resistance of the pipe pile end is when it plays a bearing role. In the early stage of grading load loading, the growth rate of side resistance of pipe piles with different diameters is close to the same, and it shows a linear growth trend with the increase of pile top load. In the subsequent loading process, the displacement curve of the pipe pile with a diameter of 0.6 m has an inflection point when the pile top load is 8,000 kN. At this time, the pile top load exceeds the maximum value of the pile side resistance and the pile tip resistance, and the pipe pile produces a large displacement. Compared with the pipe pile with a diameter of 0.6 m, the pipe piles with a diameter of 0.7 m and 0.8 m have inflection points of the displacement curve at 8,800 kN and 9,600 kN, respectively. At this time, the lateral resistance no longer increases linearly with the increase of the pile top load, but decreases slightly and finally tends to be stable.
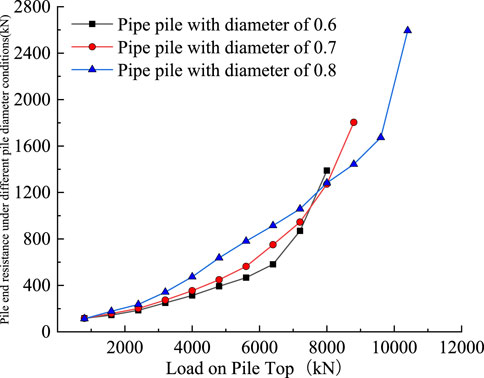
FIGURE 12. Pile end resistance of pipe piles with different pile diameters.
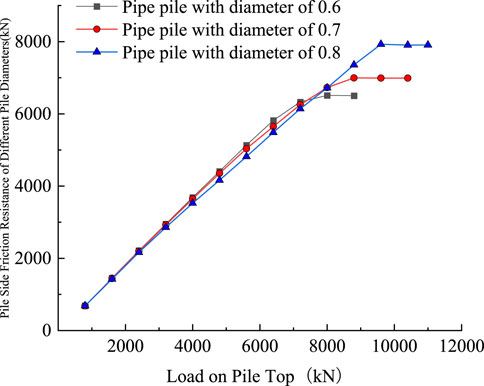
FIGURE 13. Pile side friction resistance of pipe piles with different pile diameters.
It can be found that the lateral resistance and the end resistance of the pipe pile are different in the stage of the bearing capacity of the pipe pile. The lateral resistance of the pipe pile mainly plays a role when the pipe pile does not produce a large displacement. At this time, the vertical displacement of the pipe pile is small, and the end bearing force plays a limited role. As the load on the top of the pile continues to increase, the pile end resistance gradually plays a bearing role together with the pile side resistance. In addition, the larger the diameter of the pipe pile, the larger the cross-sectional area of the pile side, the larger the contact area between the pipe pile and the soil around the pile, and the side resistance of the pipe pile will also increase.
The diameter of the pile is different, and its bearing characteristics under load are also different. The main difference is that the pile diameter is different, and the area of the contact surface between the pile side and the soil is different.
It can be seen from Figure 14 that the ultimate bearing capacity of the pipe pile will be improved when the diameter of the pipe pile increases. When the wall thickness of the pipe pile is constant and only the diameter of the pipe pile is increased, the slope of the load displacement curve of the pipe pile gradually becomes gentle with the increase of the pile diameter, which indicates that the larger the pile diameter, the smaller the vertical displacement of the pipe pile under the same vertical load.
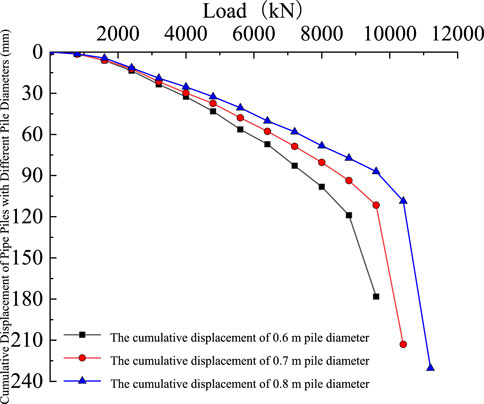
FIGURE 14. Q-S curve of pipe pile under different outer diameter conditions.
As shown in Figure 15, by comparing the variation curves of the ultimate bearing capacity of the pipe pile under different pile diameters, it can be found that when the diameter of the pipe pile increases from 0.6 m to 0.7 m, its bearing capacity increases by 800 kN. When the pile diameter increases from 0.7 m to 0.8 m, its ultimate bearing capacity also increases by 800 kN. Comparing the change curve of bearing capacity when the pile length increases, it can be found that increasing the diameter of the pipe pile has a positive and almost linear effect on the ultimate bearing capacity of the pipe pile.
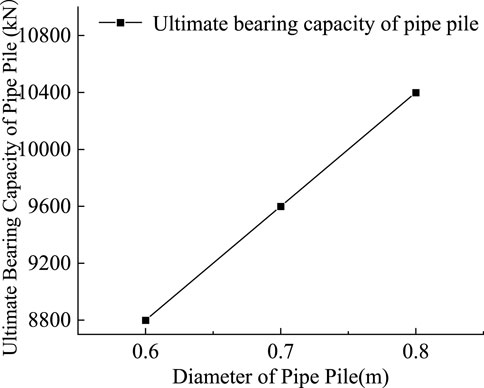
FIGURE 15. Ultimate bearing capacity of pipe pile under different outer diameter conditions.
In order to study the development law of pile end bearing capacity under different diameter-thickness ratio conditions, two kinds of pipe pile models with different pile wall thickness of 0.7 m and 0.8 m outer diameter were established in this simulation, and the development and evolution law of pile end bearing capacity was studied. The variation of the bearing capacity of the pile end under different diameter-thickness ratios is shown in Figure 16 and Figure 17.
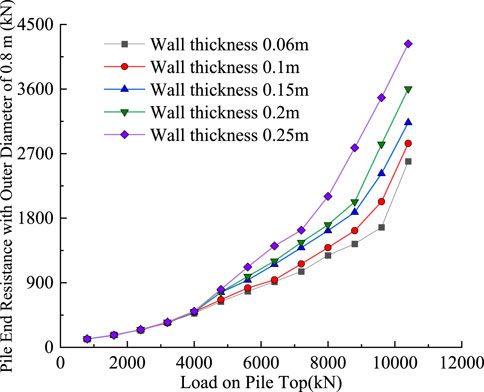
FIGURE 16. Curves of different bearing capacity of wall thickness with outer diameter of 0.7 m

FIGURE 17. Curves of different bearing capacity of wall thickness with outer diameter of 0.8 m
From the curve of bearing capacity change, it can be seen that in the early stage of load action, the pile end resistance increases gradually with the increase of pile top load, and the growth rate of pile end resistance is small. With the gradual increase of load, the tip resistance of pipe pile shows a quadratic curve growth trend. Comparing the bearing capacity curve of pipe pile end, it can be found that the sudden increase of pipe pile end resistance is related to the limit value of pile side resistance. At this time, the vertical load of pile top exceeds the limit value of pile side resistance, and the pipe pile produces large vertical deformation. In addition, compared with the same outer diameter, the pile end resistance curve of the pipe pile can be found when the pile wall thickness is different. The larger the wall thickness of the pipe pile, the greater the ultimate pile end resistance (end bearing force) that the pipe pile bottom can withstand.
When the vertical load is applied to the top of the pipe pile, the pipe pile body will also produce certain deformation, and the deformation of the pipe pile body is mainly related to the thickness of the pile wall and the material of the pile body.
It can be found from Figure 18 that the vertical displacement of the pile body is different under the same load when the wall thickness of the pipe pile is different. The thicker the pile wall is, the smaller the displacement deformation of the pile body under the load of the pile top is. The thinner the pile wall, the greater the displacement deformation of the pile under the load of the pile top. From the development of pile displacement under different wall thickness conditions, with the increase of pile wall thickness, the reduction of pile displacement decreases exponentially.
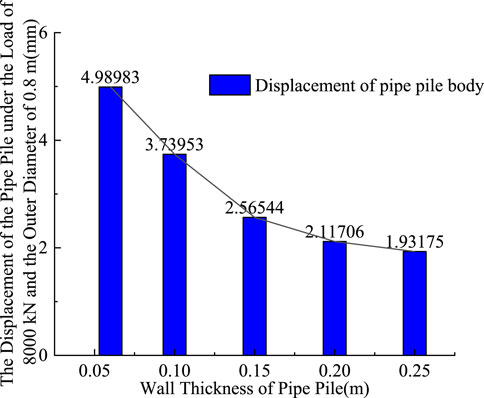
FIGURE 18. Vertical displacement of pipe pile under different wall thickness conditions.
In this model test, the outer diameter of the model pile is 0.8 m, and the length of the pipe pile is 48 m. Under the condition that the diameter and length of the pipe pile do not change, the position of the pipe pile is changed, so that the bottom of the pipe pile is not moved, and the top of the pile is deflected to the side of the soil to study the bearing capacity of the pile foundation under different offset conditions. In the test, the deflection of the pipe pile is set to 0 m, 0.1 m, 0.3 m and 0.5 m respectively. The vertical load is applied to the pile top step by step, and the gradient of each load is 800 kN. At the same time, the displacement of the pile top node is recorded when the vertical load is applied. Finally, the vertical load-vertical displacement (Q-S) curve is output through the recorded node displacement, as shown in the following Figure 19.
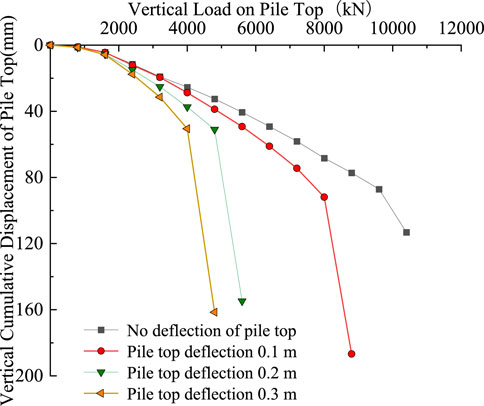
FIGURE 19. The bearing capacity-displacement curve of pipe pile under different deflections.
Figure 19 is the bearing capacity-displacement curve of pipe pile under different deflection states. From the diagram, it can be found that when the pipe pile is deflected, its bearing capacity will also change greatly. The greater the deflection of the pile top, the smaller the ultimate bearing capacity of the pipe pile. When the pipe pile is vertical, its vertical ultimate bearing capacity is about 9,600 kN. When the deflection of the pile top reaches 0.5 m, the vertical ultimate bearing capacity of the pipe pile is only 4,000 kN.
Comparing the changes of the vertical ultimate bearing capacity of the pipe pile under different deflection states, as shown in Figure 20, it can be found that when the deflection of the pipe pile top is 0.1 m, 0.3 m, and 0.5 m, the ultimate bearing capacity is reduced by 1,600 kN, 3,200 kN, and 800 kN, respectively. This indicates that when the deflection state of the pipe pile gradually increases, the ultimate bearing capacity of the pipe pile shows a decreasing trend, that is, when the top of the pipe pile is just deflected, its ultimate bearing capacity is greatly reduced. When the deflection of the pile top exceeds 0.3 m, the trend of decreasing the ultimate bearing capacity is gradually weakened.
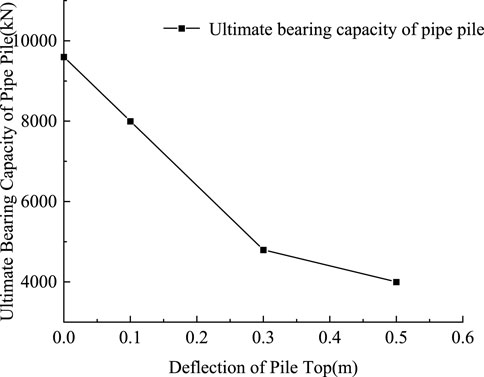
FIGURE 20. Curves of ultimate bearing capacity of pipe piles with different deflections.
By comparing the bearing capacity curves of pipe piles under different deflection states, it can be found that the ultimate bearing capacity of pipe piles decreases rapidly when the pipe piles are just deflected. When the deflection is less than 0.3 m, the vertical ultimate bearing capacity decreases by 1,600 kN for every 0.1 m deflection of the pile top. When the deflection reaches 0.3 m, the decreasing trend of the vertical ultimate bearing capacity of the pipe pile is gradually weakened by increasing the deflection of the pile top. When the deflection of the pile top increases from 0.3 m to 0.5 m, the ultimate bearing capacity is only reduced by 800 kN.
In order to study the decreasing trend of vertical bearing characteristics of pipe pile when the deflection of pipe pile is 0.3 m, the deflection angle of pipe pile top is refined to determine the threshold value of horizontal deformation of pile. The horizontal deformation of the pile top is reduced from 0.1 m to 0.05 m. The vertical bearing capacity of the pipe pile is analyzed when the horizontal displacement of the pile top is 0.05 m, 0.1 m, 0.15 m and 0.2 m. The bearing capacity-displacement curve of the pipe pile is shown in Figure 21.
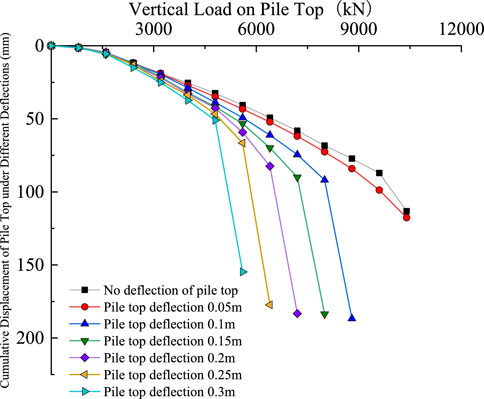
FIGURE 21. Load-displacement curves of pipe piles under different deflections.
From Figure 21, it can be found that the change trend of each displacement curve under different deflection of pipe pile top is basically the same. When the deflection of the pile top is 0.05 m, the vertical ultimate bearing capacity of the pipe pile is close to the bearing capacity of the pipe pile without deflection, but the cumulative displacement of the pipe pile increases. When the deflection of the pile top increases from 0.05 m to 0.1 m, the ultimate bearing capacity decreases from 9,600 kN to 8,000 kN. After that, for every 0.05 m deflection of the pile top, the vertical ultimate bearing capacity of the pipe pile is reduced by 800 kN. It is found from Figure 22 that the vertical bearing capacity of the pipe pile decreases the most when the deflection increases from 0.05 m to 0.1 m. When the deflection of the pipe pile is greater than 0.05 m, the vertical ultimate bearing capacity decreases rapidly with the increase of the deflection. Therefore, under the test conditions simulated in this test, if the horizontal deflection of the pipe pile top exceeds 0.05 m, the vertical ultimate bearing capacity of the pipe pile is lower than the expected value.
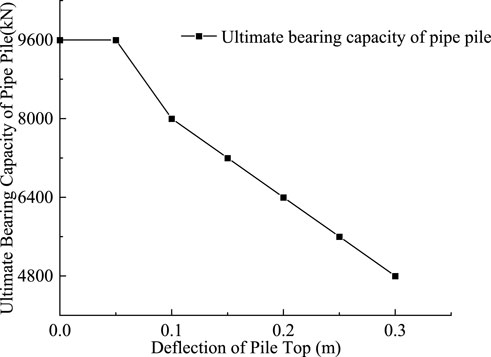
FIGURE 22. The change of ultimate bearing capacity of pipe pile under different deflection.
Through the change of the bearing capacity of the pipe pile under the above different influences, combined with the existing formula of the bearing capacity of the pipe pile, it is found that the existing formula of the bearing capacity of the pipe pile does not take into account the factors of the offset of the pipe pile. The calculation formula of the vertical ultimate bearing capacity of the pipe pile under the influence of the deflection factor is modified.
According to JGJ94-2008 “Technical Code for Building Pile Foundations”, the existing calculation of the ultimate bearing capacity of prestressed concrete pipe piles includes two parts: pile side resistance and pile end resistance. The pile end resistance is also divided into the end resistance of the open part and the end resistance of the pipe wall. Therefore, the existing formula for calculating the vertical ultimate bearing capacity of pipe piles is:
In addition, combined with the existing ' Technical Code for Building Pile Foundations ', a modified formula for calculating the vertical bearing capacity of pipe piles is established under the premise of considering the side friction resistance of the inner wall, which is:
Here,
The Table 5 is the design parameters of pile foundation in each soil layer obtained after the completion of site exploration.
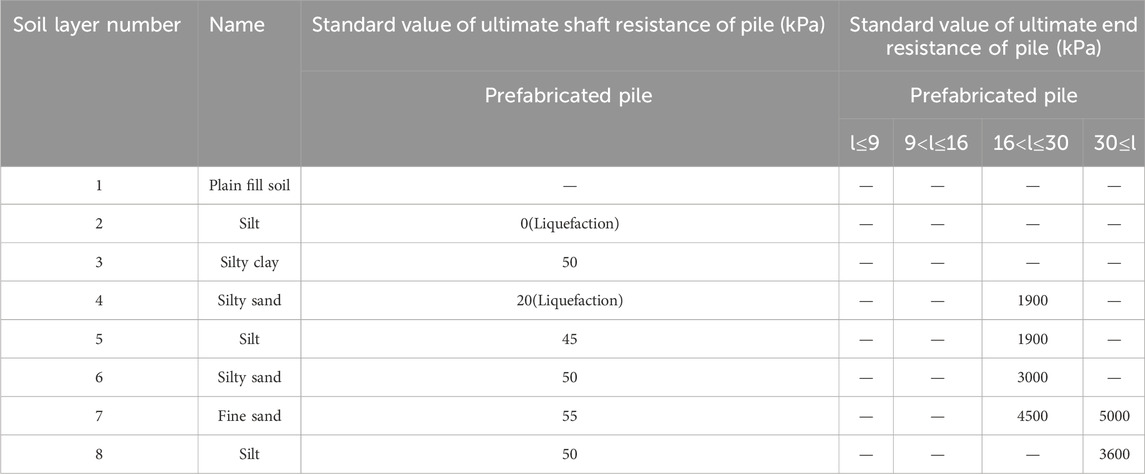
TABLE 5. Design parameters of pile foundation in each soil layer in site survey depth.
According to the above table and formula 1, the standard value of ultimate end bearing capacity
Comparing the standard value of vertical ultimate bearing capacity of single pile calculated by Formula 1 with that obtained by field test, it can be found that the calculated standard value of vertical ultimate bearing capacity of pipe pile is 24.09% (8800 kN) lower than the measured value, and 46.54% lower than the simulated standard value of vertical ultimate bearing capacity of pipe pile. The vertical ultimate bearing capacity of single pile calculated by formula 2 is 18.57% lower than the measured value, and 25.36% lower than the simulated vertical ultimate bearing capacity of pipe pile.
It can be seen that the vertical ultimate bearing capacity of the pipe pile calculated according to the above formula is less than the measured and simulated values, but the calculation results of formula 2 are closer to the measured and simulated values, which is considering the influence of the soil plug effect of the pipe pile on the side resistance and the pile end resistance.
From the simulation results, it can be found that the side friction resistance and pile end resistance of the pipe pile will be affected by the shape of the pipe pile. In the construction of group piles and multiple pipe piles, the vertical state of the pipe pile in the soil will be affected by the post-penetration pile. Displacement or deflection will lead to changes in the vertical ultimate bearing capacity of the pipe pile.
The calculation formula of the bearing capacity of the open-end pipe pile foundation in the JGJ94-2008 “Technical Code for Building Pile Foundations” is the empirical formula for the calculation of the bearing capacity of the pipe pile. The vertical ultimate bearing capacity of the pipe pile calculated by this formula is obviously smaller than the measured value. This is because the standard value of the ultimate resistance of the pipe pile side is mostly selected according to the experience in the value range. In order to accurately calculate the standard value of the vertical ultimate bearing capacity of the pipe pile, the in situ test method can directly determine the side resistance and end resistance of the pile. In-situ test methods include static cone penetration test (CPT), standard penetration test (SPT) and pressuremeter test (PMT). Through these in situ test methods, the standard values of pile side and pile end resistance in different depths of soil can be accurately obtained. In addition, the standard value of pile side and pile end resistance can be calculated by static calculation method. The standard values of pile side and pile end resistance of silty soil, silty clay and silty fine sand in the Yellow River flood area can be calculated by the β method in the static calculation method. The expression is:
For normally consolidated clayey soil,
In Formula 3:
In Formula 4:
Formula 2 is the revised calculation formula of vertical bearing capacity of pipe pile. In Formula 2, four parts of pile side resistance, soil plug resistance in pile and pile end resistance are considered. In the calculation of soil plug resistance in pile, a certain reduction is carried out. Through reduction, the calculation results obtained accurately reflect the influence of soil plug in pile on bearing capacity. However, there is still a certain gap between the calculated vertical ultimate bearing capacity of pipe piles and the measured value due to the lack of full consideration of soil squeezing effect, soil layer difference, soil plugging depth and blocking effect. The influence of the soil plug in the pipe pile on the pile side resistance is added in Formula 2. After the construction of the longer pipe pile is completed, the soil plug formed at the pile end opening also has a certain influence on the pile end resistance.
Considering the blocking effect of the soil plug at the end of the pipe pile, another additional resistance will be formed at the end of the pipe pile after its formation. In order to calculate this resistance, it is necessary to assume that the static lateral pressure coefficient inside and outside the end of the pipe pile is similar to the gravity of the soil layer. At the same time, according to the calculation formula of the ultimate end resistance of the pile proposed by Vesic (1975) based on the theory of circular cavity expansion, the expression is:
In Formula 5:
Here:
In Formula 6:
Considering the blocking effect of the soil plug at the end of the pipe pile, it is assumed that the lateral pressure coefficient of the static inside and outside of the pipe pile end is similar to the gravity of the soil layer, so there is:
In Formula 7:
Through Eq. 7, the enhancement effect of the soil plug blocking effect on the bearing capacity of the pile end can be calculated. Therefore, the end resistance effect coefficient
In Formula 8:
Among them,
Formula 8 can accurately calculate the vertical bearing capacity of vertical pipe piles. In order to obtain the modified formula for calculating the bearing capacity of super-long and super-large diameter pipe piles in the Yellow River flood area, the formula for calculating the bearing capacity after deflection is modified based on the numerical simulation results. After the pipe pile is offset, its vertical bearing capacity decreases rapidly with the increase of offset. Combined with the numerical simulation results, there are:
In Formula 9:
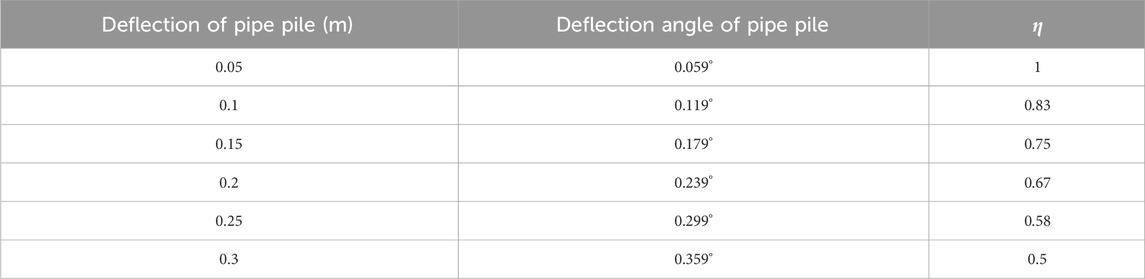
TABLE 6. The value of reduction coefficient of pipe pile bearing capacity calculation.
According to the value of the reduction factor in the above table, combined with the formula 9, the calculation method of the vertical ultimate bearing capacity of the super-large and super-long diameter displacement pile in the Yellow River flood area is obtained. The formula can be used to calculate the bearing characteristics of the super-large and super-long diameter pipe pile in the Yellow River flood area under the influence of the construction effect. The value of the reduction factor can be determined by comprehensive analysis according to the method described in this paper. In addition, the modified formula is only applicable to the calculation of the vertical ultimate bearing capacity of super-large and super-long diameter pipe piles under similar geological conditions. According to the value of the reduction factor in the above table, combined with the formula 9, the calculation method of the vertical ultimate bearing capacity of the super-large and super-long diameter displacement pile in the Yellow River flood area is obtained. The formula can be used to calculate the bearing characteristics of the super-large and super-long diameter pipe pile in the Yellow River flood area under the influence of the construction effect. The value of the reduction factor can be determined by comprehensive analysis according to the method described in this paper. In addition, the modified formula is only applicable to the calculation of the vertical ultimate bearing capacity of super-large and super-long diameter pipe piles under similar geological conditions. According to the modified formula for calculating the bearing capacity of the deflection pipe pile at the top of the pile, combined with the deviation value of the pile top, the vertical ultimate bearing capacity of the pipe pile under the deviation value can be quickly calculated, which can provide reference for engineering construction and design personnel. By accurately estimating the bearing capacity of pipe piles, over-design or insufficient design, insufficient bearing capacity or excessive loading can be avoided, thereby improving the economy and sustainability of the project. It helps to optimize design, improve resource efficiency, reduce environmental impacts, and ensure the safety and longevity of structures to achieve integrated sustainable development goals.
A residential building uses PHC pipe piles to reinforce the foundation. The physical and mechanical parameters of the soil obtained from the geological survey are shown in the following Table 7 (Zhou et al., 2007). The diameter of the pipe pile is 60 cm, the length of the pipe pile is 50 m, and the vertical ultimate bearing capacity of the pipe pile is 3,550 kN. Under the action of the squeezing effect of the adjacent pipe pile construction, the deflection of the pipe pile top is caused, and the deflection amount is 16 cm and 32 cm respectively. After the accident, the bearing capacity of the deflected pipe pile is tested. The ultimate bearing capacity of the pipe pile with displacement of 16 cm and 32 cm is 2,335 kN and 1,760 kN respectively. The bearing capacity of the PHC pipe pile of the project is calculated by using the method in this paper. The ultimate bearing capacity of the pipe pile with deflection of 16 cm and 32 cm is 2,605 kN and 1,718 kN respectively. The error between the calculation results and the test results is between 2.38% and 11.56%, The comparison results are shown in Figure 23, and it is within the allowable range of engineering error. It shows that the calculation method is in good agreement with the field test results, which proves the accuracy of the correction formula.
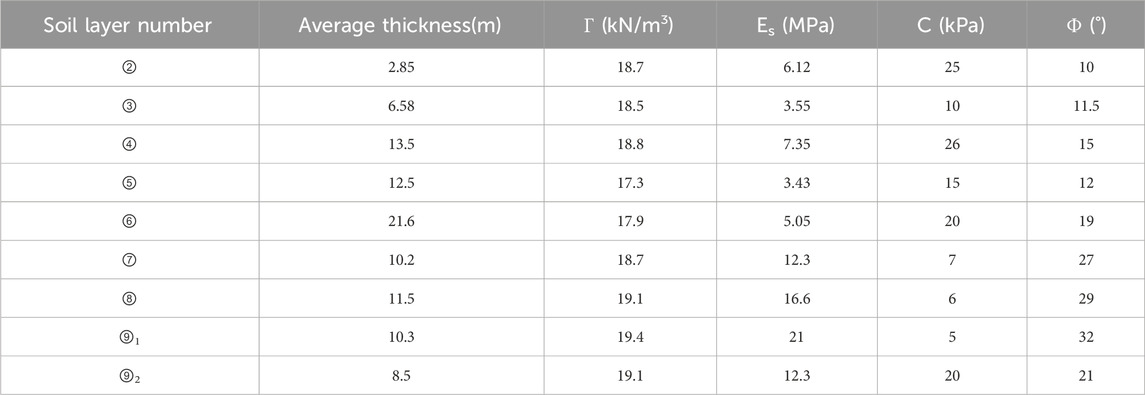
TABLE 7. Physical mechanical parameters of soil.
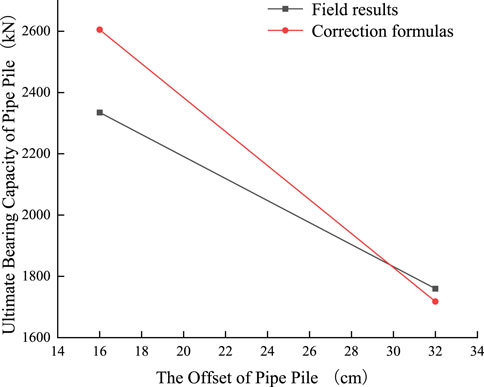
FIGURE 23. The comparison between the field results and the modified formula results.
The anothere project is located in the suburbs of Jiaxing City, Zhejiang Province, the total land area of the project is 40,251 m2, the total construction area is about 94,385.5 m, the above-ground construction area is about 80,008.4 m2, and the underground construction area is 14,377.1 m2. The importance level of the project is grade two, the complexity level of the site is grade two, and the complexity level of the foundation is grade two. The project site belongs to the Yangtze River Delta marsh plain exploration depth of the Yangtze River Delta, which is composed of 9 engineering geological layers. The main physical and mechanical parameters of each soil layer are shown in the Table 8.
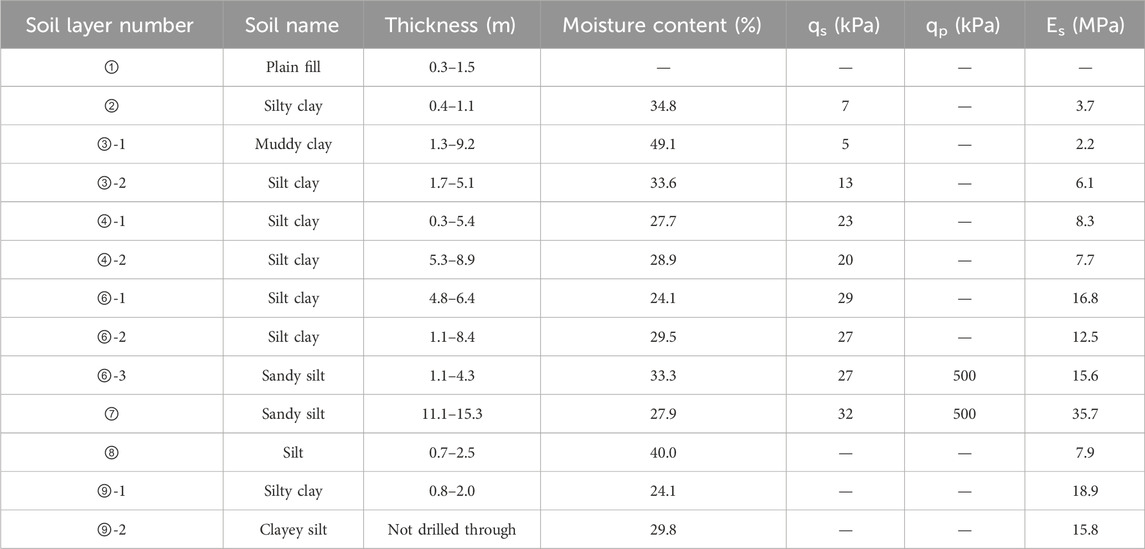
TABLE 8. The main physical and mechanical parameters.
The high-rise residential building (No. 1-9) of this project is a shear wall structure. The design adopts pile-raft foundation, the raft thickness is 700 mm, and the foundation beam adopts the dark beam under the wall. The pile type is PHC-A500 (100) −27a, the relative elevation of the pile top is-3.650 m, the pile end enters the seventh layer of sandy silt layer, the concrete strength of the pile body is C80, and the total number of piles is 81.
After the construction of the engineering pile is completed, the foundation pit excavation of the “No.5 high-rise residential building” is first carried out. During the excavation process, 58 PHC pipe piles were found to be deviated, accounting for about 71.7% of the total number of piles, and each pile was deviated to the west. In order to detect the vertical compressive bearing capacity of the deviated pile, the designers put forward the requirement to carry out the high strain dynamic test of the pile foundation for the two most representative deviated piles. The test results are as follows: The vertical compressive ultimate bearing capacity of pile No. 58 (offset 300 mm) is 1765 kN, which is equivalent to 61.3% of that without offset. The vertical compressive ultimate bearing capacity of pile No. 74 (offset 250 mm) is 1,811 kN, which is equivalent to 62.9% of that without offset. This is no more than 11.3% different from the reduction factor proposed above, within the allowable error range. The comparison results are shown in Figure 24.
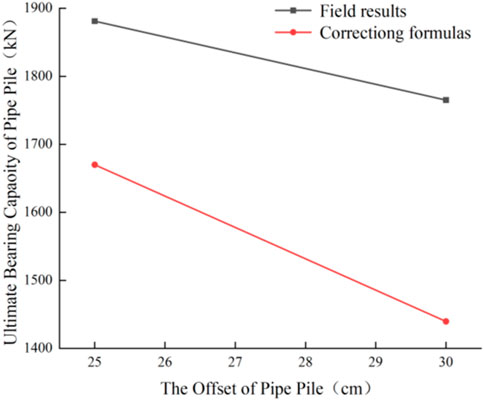
FIGURE 24. The comparison between the field results and the modified formula results.
(1) In this paper, the vertical bearing capacity of pipe pile under different attribute conditions is studied by numerical simulation and theoretical derivation. The research shows that when the length of pipe pile changes, the vertical bearing capacity changes the most, and the vertical ultimate bearing capacity of pipe pile increases with the length of pipe pile. The growth trend is approximately linear; When the wall thickness of the pipe pile increases, the vertical bearing capacity increases positively and linearly, and the reduction of the displacement of the pile body decreases exponentially.
(2) The bearing capacity of the pile is mainly affected by the pile side resistance and the pile end resistance. When the pile top load is small, the pile side resistance plays a major bearing role. When the pile top load is large, the pile side resistance and the pile end resistance work together to exert the bearing capacity. After the pile side resistance reaches its limit value, the pile top load will continue to increase, and the pile side resistance will be slightly reduced. The limit value of the pile side resistance is related to the outer diameter of the pipe pile.
(3) The vertical bearing capacity of super-long and super-large diameter pipe pile will change when it is affected by the deflection deformation caused by the pile sinking. By studying the changes of the vertical bearing capacity of the pipe pile under different deflection states, it can be found that the larger the deflection angle of the pipe pile, the smaller the vertical ultimate bearing capacity. When the deviation angle of the pipe pile exceeds 0.35°, the vertical ultimate bearing capacity of the pipe pile is only 50% of the vertical pipe pile.
(4) According to the research results, the calculation formula of the vertical ultimate bearing capacity of the pipe pile in the “Technical Code for Building Pile Foundations” is derived and modified. The modified formula proposes a reduction factor for the calculation formula of the vertical ultimate bearing capacity of the super-large and super-long diameter pipe pile after deflection. The modified formula can accurately calculate the vertical ultimate bearing capacity of the offset pipe pile. Finally, the error between the calculation example and the field test results is within the allowable range of engineering error, which shows that the calculation method is in good agreement with the field test results, and proves the accuracy of the correction formula.
The original contributions presented in the study are included in the article/supplementary material, further inquiries can be directed to the corresponding authors.
SZ: Conceptualization, Methodology, Project administration, Writing–review and editing. ZR: Conceptualization, Methodology, Writing–review and editing. YZ: Conceptualization, Methodology, Writing–review and editing. WF: Conceptualization, Methodology, Writing–original draft. CL: Conceptualization, Methodology, Project administration, Writing–review and editing. CLu: Conceptualization, Methodology, Writing–original draft. YW: Formal Analysis, Writing–review and editing.
The author(s) declare financial support was received for the research, authorship, and/or publication of this article. This research was funded by the Natural Science Foundation of Shandong Province of China (ZR2022QE082), and Shandong Provincial Transportation Science and Technology Plan (2021B89). The sponsorship and interest are gratefully acknowledged.
We deeply appreciate the warm and efficient work of the editors and reviewers.
Authors YZ, WF, and CLu were employed by Shandong Luqiao Group Co., Ltd.
The remaining authors declare that the research was conducted in the absence of any commercial or financial relationships that could be construed as a potential conflict of interest.
All claims expressed in this article are solely those of the authors and do not necessarily represent those of their affiliated organizations, or those of the publisher, the editors and the reviewers. Any product that may be evaluated in this article, or claim that may be made by its manufacturer, is not guaranteed or endorsed by the publisher.
Bekki, H., Canou, J., Tali, B., Dupla, J. C., and Bouafia, A. (2013). Evolution of local friction along a model pile shaft in a calibration chamber for a large number of loading cycles. Comptes Rendus Mec. 341, 499–507. doi:10.1016/j.crme.2012.11.012
Burland, J. B., and Burland, J. B. (1973). Shaft friction of piles in clay - a simple fundamental approach. Ground Eng. 6 (3), 30–42.
Cai, J., Zhou, W. Q., Lin, Y. X., and Huang, L. Q. (2006). Experimental study on axial force behavior of super-long prestressed high-strength concrete pipe in deep soft soil. China Civ. Eng. J. 10, 102–106. doi:10.1016/S1872-1508(06)60035-1
Chin, J. T. C. Y. K. P., Chow, Y., and Poulos, H. (1990). Numerical analysis of axially loaded vertical piles and pile groups. Comput. Geotechnics 9, 273–290. doi:10.1016/0266-352x(90)90042-t
Coyle, H. M., and Reese, L. C. (1966). Load transfer for axiallyloaded piles in clay. ASCE Soil Mech. Found. Div. J. 92 (2), 1–26. doi:10.1061/jsfeaq.0000850
El Naggar, M. H., and Wei, J. Q. (2000). Uplift behaviour of tapered piles established from model tests. Can. Geotechnical J. 37 (1), 56–74. doi:10.1139/t99-090
Fleming, W. G. K. (1992). A new method for signle pile settlement prediction and analysis. Geotechnique 42, 411–425. doi:10.1680/geot.1992.42.3.411
Gao, F., Cheng, X. S., Chen, X. J., and Lv, Q. (2022). Bearing capacity characteristics of compacted cement StabilizedGravel pile composite foundation. Int. J. Pavement Res. Technol. 2022. doi:10.1007/s42947-022-00226-2
Gao, G. Y., Gao, M., Chen, Q. S., and Yang, J. (2019). Field load testing study of vertical bearing behavior of a large DiameterBelled cast-in-place pile. KSCE J. Civ. Eng. 23, 2009–2016. doi:10.1007/s12205-019-2065-z
Guo, H. L., He, W., Hu, Y. B., and Wang, Y. H. (2004). Predication of vertical ultimate bearing capacity of PHC piles. Eng. Mech. 12, 78–83.
Han, J. Y., Wang, J., Jia, D. F., Yan, F. S., Zhao, Y., Bai, X. Y., et al. (2023). Construction technologies and mechanical effects of the pipe-jacking crossing anchor-cable group in soft stratum. Front. Earth Sci. 10, 1019801. doi:10.3389/feart.2022.1019801
Hong, Y. K., and Chen, Q. H. (1985). Load transfer performance of bored pile. Chin. J. geotechnical Eng. 5, 22–35.
Jae, H. C., Jeongsoo, K., Harald, K., McVay, M. C., and Lai, P. (2012). A numerical and experimental study of bearing stiffness of drilled shafts socketed in heterogeneous rock. Comput. Struct. 90-91 (Jan), 145–152. doi:10.1016/j.compstruc.2011.09.004
Jiang, G., Shao, D., Zong, C. F., Chen, G., Huang, J., Lin, C., et al. (2023). Thermo-mechanical behavior of long-bored energy pile: a full-scale field investigation. KSCE J. Civ. Eng. 27, 145–155. doi:10.1007/s12205-022-0588-1
Jiang, Z. C. (2012). Experimental study on vertical bearing characteristics of super-long prestressed high-strength concrete pipe pile in soft clay. Rock Soil Mech. 33, 2639–2644.
Jin, Q., Zheng, Y. J., Cui, X. Z., Cui, S. Q., Qi, H., Zhang, X. N., et al. (2020). Evaluation of dynamic characteristics of silt in Yellow river flood fieldafter freeze-thaw cycles. J. Central South Univ. 27, 2113–2122. doi:10.1007/s11771-020-4434-7
Kee, K., Jayantha, K., and Asadul, H. (2006). Numerical modelling of the side resistance development of piles in mudstone with direct use of sidewall roughness. Int. J. Rock Mech. Min. Sci. 43, 987–995. doi:10.1016/j.ijrmms.2006.01.002
Lehane, B. M., and Gavin, K. G. (2001). Base resistance of jacked pipe piles in sand. J. Geotechnical Geoenvironmental Eng. 127, 473–480. doi:10.1061/(ASCE)1090-0241(2001)127:6(473)
Li, T. L., Zhao, W., Liu, R., Han, J. Y., Jia, P. J., and Cheng, C. (2023). Visualized direct shear test of the interface between gravelly sand and concrete pipe. Can. Geotechnical J. doi:10.1139/cgj-2022-0007
Li, Z. Y., Wang, K. H., and Wu, W. B. (2017). Vertical dynamic impedance oflarge-diameter pile considering its transverse inertia effect and constructiondisturbance effect. Mar. Georesources Geotechnol. 35, 256–265. doi:10.1080/1064119X.2016.1149259
Liu, F. T., Zhao, C. F., and Wu, J. (2010). Experimentalresearch on bearing behavior and size effect of large diameter boredcast-in-situ piles Changzhou area. Chin. J. RockMechanics Eng. 29, 858–864.
Liu, J. W. (2008). Study on installationand bearing capacity character of jacked pile. Qingdao: Qingdao Technological University.
Liu, Z. R., and Du, L. H. (2012). Ultimate bearing capacity analysis of prestressed concrete open pipe piles. Concrete 02, 120–123. doi:10.3969/j.issn.1002-3550.2012.03.037
Matos, R., Pinto, P., Rebelo, C., Veljkovic, M., and Simões da Silva, L. (2018). Axial monotonic andcyclic testing of micropiles in loose sand. Geotechnical Test. J. 41, 526–542. doi:10.1520/GTJ20160284
Miao, C. J., Shi, B., and Zheng, X. (2018). BOFDA internal force test of offshore super-long PHC pipe. J. Nanjing Univ. 54, 1057–1063. doi:10.13232/j.cnki.jnju.2018.06.001
Pan, Z. H. (2006). The application of super-long PHC pipe pile in high-precision engineering static pressure method construction. Build. Oper. 09, 674–675. doi:10.3969/j.issn.1004-1001.2006.09.006
Poulos, H., and Davis, E. (1974). Elastic solutions for soil and rock mechanics. Int. J. Rock Mech. Min. Sciences&Geomechanics Abstr. 11, 311–411.
Randolph, M. F., Leong, E. C., and Houlsby, G. T. (1991). One-dimensional analysis of soil plugs in pipe piles. Geotechnique 41, 587–598. doi:10.1680/geot.1991.41.4.587
Sang, D. F., and Tan, D. Y. (2014). Numerical simulation study on vertical bearing characteristics of large diameter PHC pile. Mar. Traffic Eng. 01, 168–172. doi:10.3969/j.issn.1002-4972.2014.01.031
Sivaraman, S., and Muthukkumaran, K. (2022). Consolidation effect on pile capacity assessment based on instrumented field pile load test. Arabian J. Sci. Eng. 47, 4913–4927. doi:10.1007/s13369-021-06305-z
Tian, X. J., Hu, W. T., and Gong, X. N. (2015). Longitudinal dynamic response ofpile foun dation in anonuniform initial strain field. KSCE J. Civ. Eng. 19, 1656–1666. doi:10.1007/s12205-014-0049-6
Wang, Y. H., Zhang, M. Y., and Bai, X. Y. (2019). Study of penetrationcharacteristics and influence factor of jacked pile based on fiber bragg grating sensing technology. Rock Soil Mech. 40, 4801–4812.
Zang, M. Y., Liu, J. W., and Yu, X. X. (2009). Field test study of time effect on ultimate bearing capacity of jacked pipe pile in soft clay. Rock Soil Mech. 30, 3005–3008. doi:10.3969/j.issn.1000-7598.2009.10.020
Zhang, Z. M., Liu, J. W., and Yu, F. (2010). Relationship between terminativejacking force and ultimate bearing capacity of jacked pipe piles. Chin. J. Geotechnical Eng. 32, 1207–1213.
Keywords: super-long and super-large diameter pipe piles, Yellow River flood area, numerical simulation, offset, bearing capacity correction formula
Citation: Zhang S, Ren Z, Zhang Y, Fan W, Li C, Liu C and Wang Y (2024) Study on bearing characteristics of super-long and super-large diameter pipe piles in silt foundation of alluvial plain of Yellow River. Front. Earth Sci. 11:1349933. doi: 10.3389/feart.2023.1349933
Received: 05 December 2023; Accepted: 27 December 2023;
Published: 11 January 2024.
Edited by:
Pengjiao Jia, Soochow University, ChinaReviewed by:
Wei Duan, Southeast University, ChinaCopyright © 2024 Zhang, Ren, Zhang, Fan, Li, Liu and Wang. This is an open-access article distributed under the terms of the Creative Commons Attribution License (CC BY). The use, distribution or reproduction in other forums is permitted, provided the original author(s) and the copyright owner(s) are credited and that the original publication in this journal is cited, in accordance with accepted academic practice. No use, distribution or reproduction is permitted which does not comply with these terms.
*Correspondence: Zhicheng Ren, MjAyMTE1NTEyMEBzdHUuc2RqenUuZWR1LmNu; Chao Li, bGljaGFvMjFAc2RqenUuZWR1LmNu
Disclaimer: All claims expressed in this article are solely those of the authors and do not necessarily represent those of their affiliated organizations, or those of the publisher, the editors and the reviewers. Any product that may be evaluated in this article or claim that may be made by its manufacturer is not guaranteed or endorsed by the publisher.
Research integrity at Frontiers
Learn more about the work of our research integrity team to safeguard the quality of each article we publish.