 Liling Zhou1,2
 Xiaoyi Zhang
 Haijun Bao
- 1Zhejiang Institute of Geosciences, Hangzhou, China
- 2Observation and Research Station of Zhejiang Coastal City Geological Safety, Ministry of Natural Resources, Hangzhou, China
- 3School of Spatial Planning and Design, Hangzhou City University, Hangzhou, China
Introduction: In cities, the intensity of integrated development, both above and below ground, has been continuously increasing. Unfortunately, associated events such as surface cracking and ground collapse are common, and research into the susceptibility of urban ground collapse (UGC) has consequently, also been increasing.
Methods: In this study, we calculated the spatial probability distribution of historical UGC events in Hangzhou, China as a case study. To avoid the influence of the subjectivity of expert opinions on the evaluation results, and to distinguish it from the first version of the UGC sensitivity map in 2021, collinearity and correlation analyses based on geo-detector were conducted, and the 11 most representative factors from 22 candidates were identified. Then, a GIS-based susceptibility assessment system was established and applied to eastern Hangzhou, China.
Results: The assessment results were divided into three grades. High-susceptibility areas accounted for 6.08% of the total area and were mainly distributed in the central area on both sides of the Qiantang River. Medium-susceptibility areas accounted for 23.92% of the total area and showed an expanding trend around the central area. Low-susceptibility areas accounted for 12.42% of the total area and were mainly distributed within the bedrock mountainous areas on the west side.
Discussion: The assessment model take more urban construction activies into consideration, which can fits better with the trigger factors of UGC itself, and has good applicability for other cities in Zhejiang Province to assess the susceptibility of UGC events.
1 Introduction
Urban ground collapse (UGC) (Wang and Xu, 2022; Zhang X. et al., 2023) refers to ground instability or subsidence triggered by the void formation or looseness of geological bodies below urban ground, and this can be caused by natural or human activities. In literature, sinkhole is also used to indicate a UGC event that occurs in a range of adverse geological conditions (Waltham, 2008; Tufano et al., 2022). However, recently UGC events tend to be caused by urban construction and human activities (Pellicani et al., 2017; Zhang X. et al., 2023), leading to secondary damages such as the tilting of buildings, road collapses, and destruction of pipelines, which can have serious consequences on a city’s economic development and urban construction (Zhou et al., 2022; Zhang C. et al., 2023; Liu et al., 2023). With the growing need for land, the utilization of urban underground areas holds substantial economic potential (Zerhouny et al., 2018; Lu et al., 2021). Conversely, the quantity of UGC events exhibits a pattern of continuous expansion in parallel with urbanization (He et al., 2022; Tan et al., 2022). Therefore, the growing conflict between the advancement of underground spaces and urban safety emphasizes the urgent requirement for the government to establish a more sophisticated control strategy, which necessitates conducting a comprehensive susceptibility assessment beforehand (Gutiérrez et al., 2014; Xie et al., 2021; Zhou and Zhai, 2023).
Assessments for ground collapse can be categorized into susceptibility, hazard and comprehensive risk mapping. Susceptibility assessment focuses on determining the likelihood or probability of a specific area or system. In the context of UGC, susceptibility assessment would involve identifying and mapping the geological, hydrological, geotechnical factors and human activities that contribute to the likelihood of ground collapse in a given area (Galve et al., 2009; Ciotoli et al., 2012; Subedi et al., 2019; Kim et al., 2020; Orhan et al., 2020). Hazard assessment involves evaluating the spatial probability, as well as the temporal and magnitude characteristics of potential collapse events within the urban environment. Vulnerability assessment refers to the evaluation of the potential impact on city when exposed to a hazard. In the context of UGC, vulnerability assessment would involve assessing the potential consequences and impacts of a ground collapse event on human lives, infrastructure, and the environment (Guarino et al., 2018; Bianchini et al., 2022). Risk assessment encompasses a broader analysis that integrates information from hazard assessment, vulnerability assessment, and exposure assessment to provide a comprehensive understanding of the overall risk associated with UGC (Buttrick and Van Schalkwyk, 1998; Mostafiz et al., 2021).
GIS analysis have led to a revolution in hazard and damage mitigation studies due to their efficiency in spatial data management and manipulation (Lathrop and Bognar, 1998; Lee et al., 2004; Orhan et al., 2020). Various GIS-based methods that have been used in other geological disaster such as landslide (Feizizadeh and Blaschke, 2011; Michael and Samanta, 2016; Roccati et al., 2021; Merchán et al., 2023), floods (Lyu et al., 2018; Xiong et al., 2019; Lyu et al., 2020; Sarkar et al., 2022), earthquake (Liu et al., 2012; Heron et al., 2014; Giovinazzi et al., 2021), etc., can also be used in susceptibility and vulnerability mapping can be adopted to develop sinkhole susceptibility and hazard models. Quantitative modeling approaches combining GIS analysis to UGC susceptibility mapping include deterministic, nearest neighbor or density distribution, and probabilistic methods (Galve et al., 2009; Ciotoli et al., 2012; Ozdemir, 2016; Pellicani et al., 2017; Yu et al., 2023). Geo-dectector, as one of the representative spatial analysis methods, is also brought in to identify indicators that have an impact on UGC events (Wang et al., 2019; Ding et al., 2021) and to calculate the weight of each indicator in the susceptibility score, showing its potential to the application of accuracy improvement of geo-hazards susceptibility models (Hu et al., 2022; Wang et al., 2022; Zhang X. et al., 2023).
There are three studies carried out on geo-hazard assessment of UGC of Hangzhou City (Xu et al., 2011; Xu et al., 2012; Xu et al., 2018). XU Kai (Xu et al., 2011; Xu et al., 2012) established a geo-environmental suitability evaluation model that is comprised of nine factors, including geomorphic type, slope, site soil type, stratum steadiness, Holocene saturated soft soil depth, groundwater abundance, groundwater salinization, geologic hazard type, and geologic hazard degree. UGC, categorized into surface collapse, was regarded as one of the four geological disasters and not dived deep. XU Ye-Shuang (Xu et al., 2018) explored more on the potential geohazards in the urban area of Hangzhou, and concluded that karst strata, soft clay, confined aquifers, and shallow gas are main geological features related to the safety of underground construction.
In the perspective of an estimation of UGC susceptibility, this paper presents a preliminary susceptibility assessment for the city of Hangzhou. Starting from the conclusion by Zhang (Zhang X. et al., 2023), the influence of socio-economic factors in the occurrence of UGC events is greater, up to 22 factors are brought in to build a general assessment model for Zhejiang province. The paper contributes the UGC susceptibility models in two points: First, we propose an applicable susceptibility assessment system. Base on the collinearity between different factors, an 11-out-of-22 representative and easy-to-obtain factors are screened out, which is more conducive to the promotion of evaluation models. Secondly, factors are comprehensively screened from the perspectives of geological background and ground disturbance, especially human construction activities, so that the evaluation results are more accurate and can better reflect the actual situation.
2 Materials and methods
2.1 Study area
Hangzhou is in the lower reaches of the Qiantang River and the southwestern section of the Hangjiahu Plain in China, and its terrain and landforms are both complex. Since the Quaternary period, the paleoclimate in this area has undergone drastic changes. Neotectonics have also led to a wide variety of sedimentary types and significant changes in thickness during the Quaternary period, and the sediments have experienced multiple accumulation and erosion alternations. The soil is mainly composed of sandy silt and is rich in groundwater. The terrain is characterized by vertical alternations of hard and soft soil layers, multi-layer combinations, and significant thickness variations. Furthermore, due to the diversion of the ancient Tiao and Qiantang Rivers, the urban plain contains multiple ancient river channels. The material is relatively fine and has a low bearing capacity, making it prone to subsidence and collapse.
The study area is located at 119°34′45″–120°42′50″ east longitude and 29°44′47″–30° 33′54″ north latitude and locates in the eastern part of Hangzhou (Figure 1). This area includes the central urban area and the vast majority of urban construction land, including ten districts, which are Shangcheng, Gongshu, Xihu, Binjiang, Linping, Qiantang, Xiaoshan, Yuhang, Fuyang, and Linan. The study area has a concentrated population distribution and intensive urban construction activities.
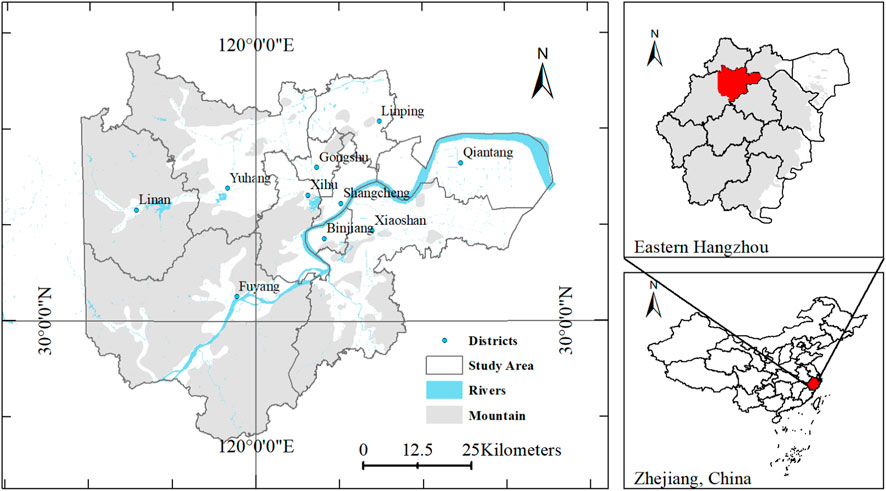
FIGURE 1. Map of the city of Eastern Hangzhou, China.
2.2 Data sources and pre-processing
A historical UGC event database sourced from the Geological Environment Institute of Zhejiang Institute of Geosciences was used in this study; it included the location, time, and scale of 13 events that occurred from April 2016 to May 2021. Case studies showed that the majority of these UGC events is a fuction of suffosion, the leakage of silty sand soil caused water and soil erosion, leading the ground collapse (Zhang X. et al., 2023). The main data source of evaluation indicators are the geological hazard assessment atlas based on the 2019 urban geological survey. Statistical information from relevant government departments are also used.
The evaluation factors were selected considering the following two aspects: 1) geological background factors that can reflect the adverse geological conditions, such as urban hydrogeological conditions and groundwater; and 2) social and economic factors related to urban population, economy, and construction developments that may be affected by the susceptibility of UGC. Ultimately, 22 evaluation indicators were selected, which were as follows: distance from hidden rivers and creeks (C1), thickness of the saturated silt layer (C2), thickness of the top fill layer (C3), groundwater type (C4), cumulative subsidence from 2017 to 2020 (C5), distribution of the first soft soil layer (C6), distribution of the second soft soil layer (C7), distribution of the third soft soil layer (C8), distribution of the limestone (C9), distribution of the shallow gas (C10), burial depth of the saturated silt (sand) roof (C11), burial depth of the underground confined water level (C12), shallow groundwater level variations (C13), density of major linear projects (C14), population density (C15), gross domestic product (GDP) per unit area (C16), proportion of construction land (C17), investment in disaster prevention and reduction (C18), density of underground pipelines (C19), density of water supply pipelines (C20), density of drainage pipelines (C21), and density of major linear projects under construction (C22).
The evaluation indicators were divided into grade, classification, and numerical factors based on the properties of their values. Grade factors were determined by grading the numerical variables, and there was a specific order between the different grades, which could not be disrupted. However, different classification factor categories did not have sequential attributes. Common classification factors included binary and multi-classifications. The evaluation factors that were used in this study, including their values and the criteria by which they were considered, are summarized in Table 1.
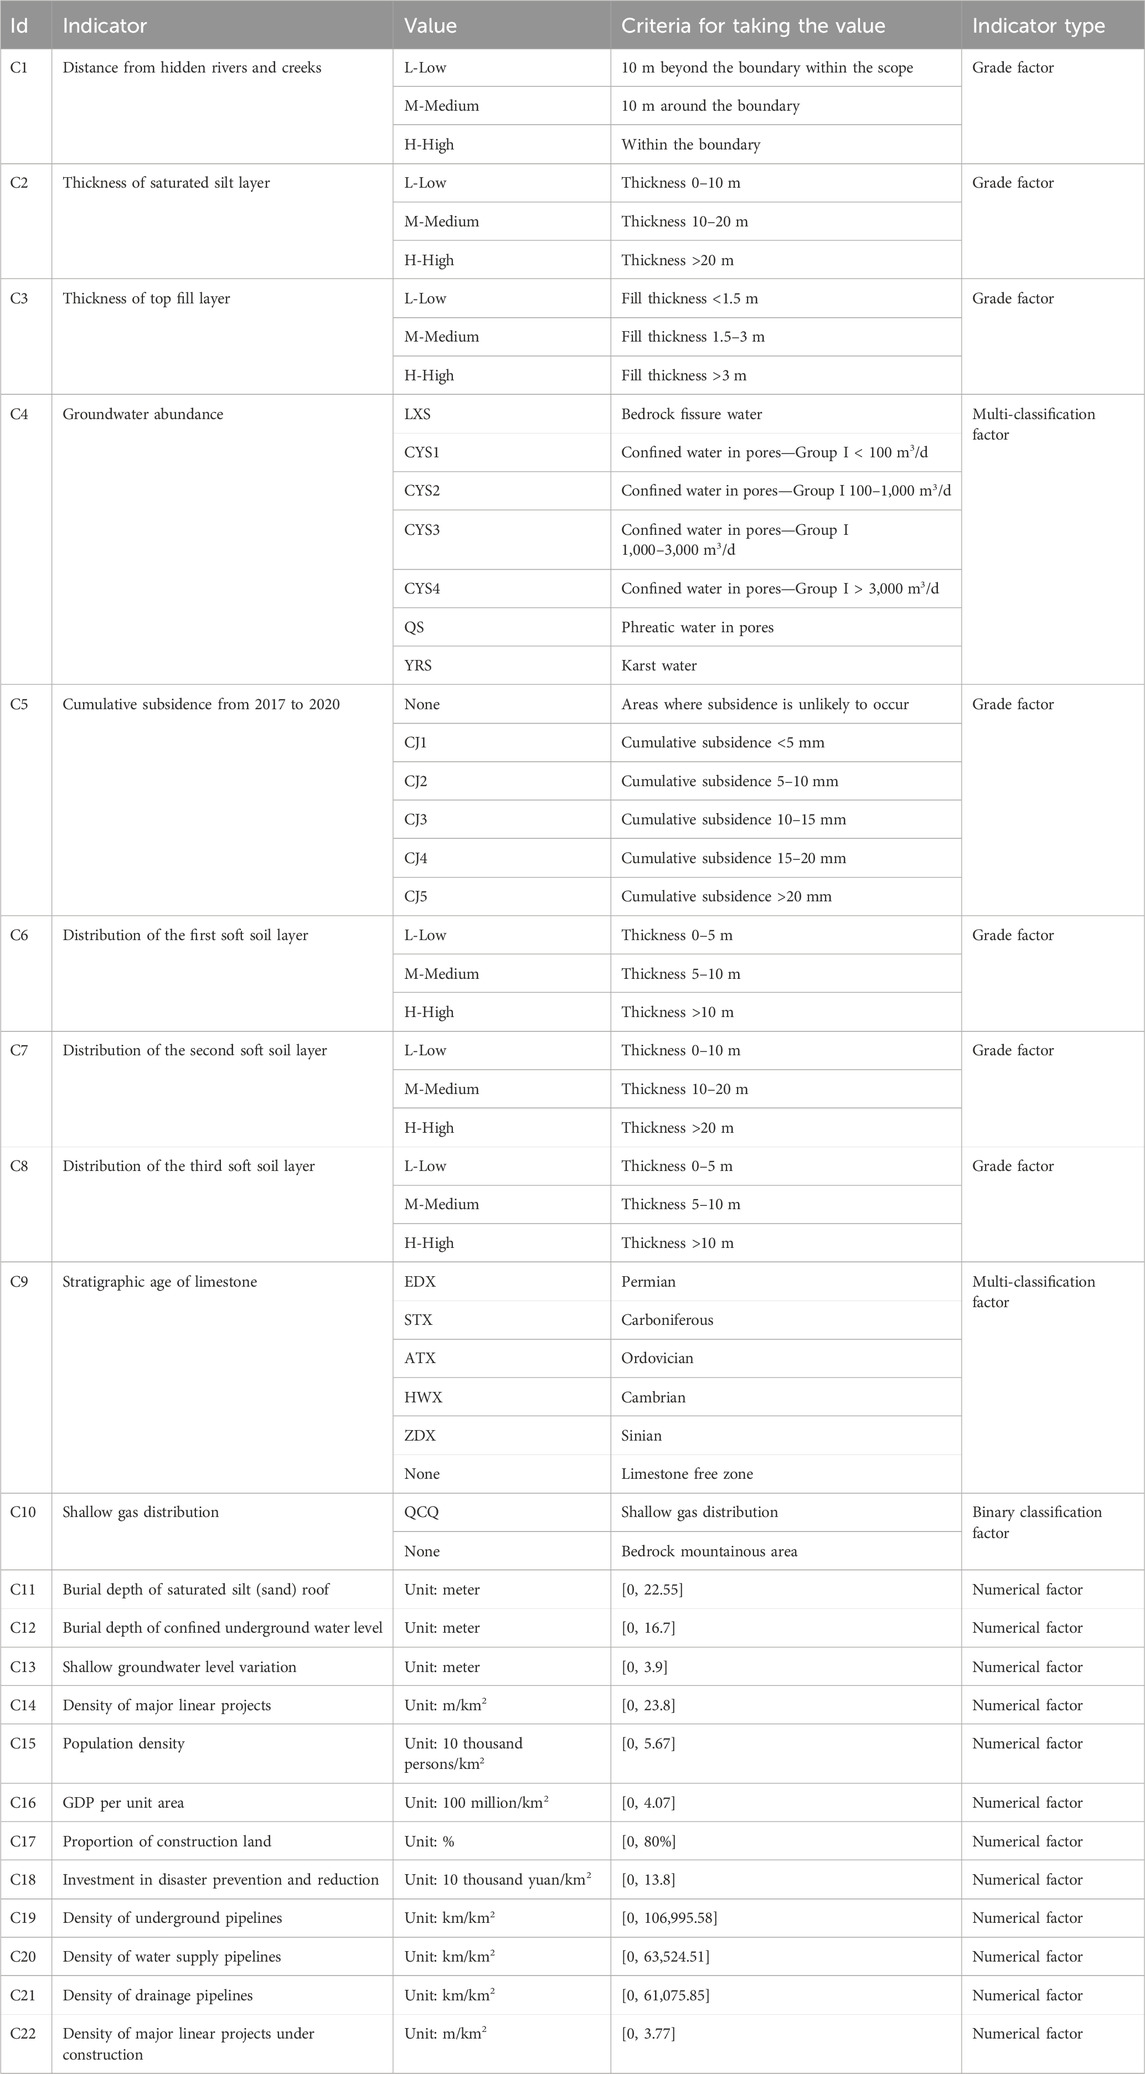
TABLE 1. Evaluation indicators of the UGC susceptibility assessment.
After preprocessing and superimposing the data in the Geological Safety Risk Evaluation Atlas, values were obtained for each factor, as shown in Figure 2.
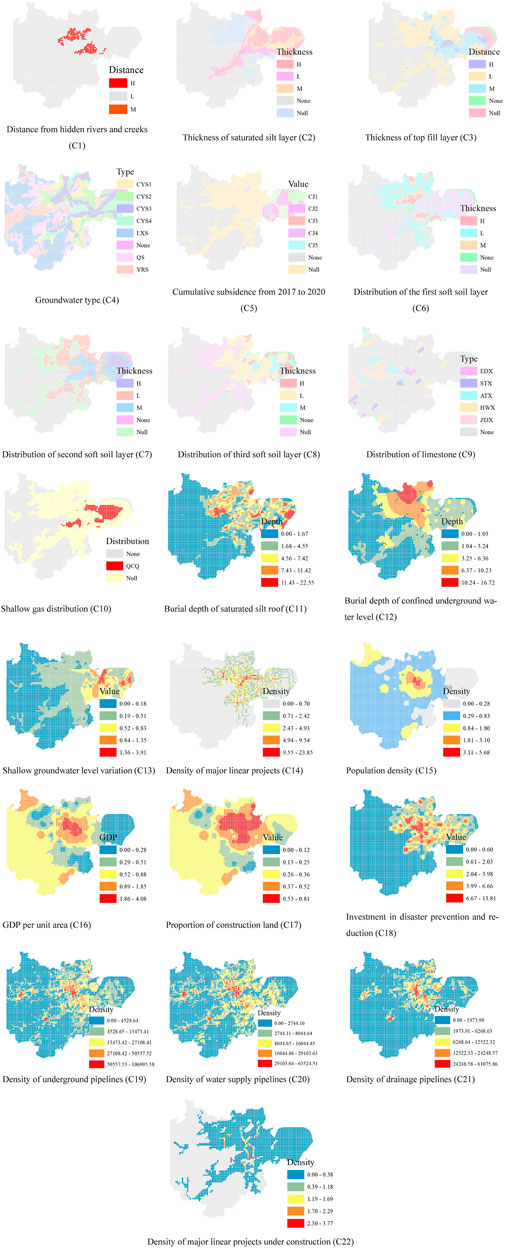
FIGURE 2. Spatial distributions of the indicator values.
2.3 Construction of the evaluation model
2.3.1 Kernel density estimation
Kernel density analysis was used to calculate spatial distribution probabilities, with each point representing a UGC event (Galve et al., 2009). The weight of each element was determined using the diameter of the UGC range in the UGC event. The kernel density estimation method is a widely used non-parametric test method in geospatial analysis, that can accurately identify the spatial distribution characteristics of point or line elements. The basic calculation is as Eq. 1:
Where,
2.3.2 Evaluation factor diagnostics
2.3.2.1 Factor collinearity analysis
Generally, the correlation analysis between continuous variables can be carried out using the Pearson correlation coefficient. When r = 0, it indicates that there is no linear relationship between the two variables X and Y (note that it does not mean that X and Y are necessarily independent of each other, and there may be other relationships such as non-linearity); but when 0 < r < 1, it indicates that there is a positive correlation between the two variables and when −1 < r < 0, it indicates a negative correlation.
However, the candidate factors in this study also included sequential grade and multi-classification variables in addition to the continuous variables. Sequential grade variables are obtained by transforming continuous variables, and there is an implicit order between the grades. For example, the three grades of distance from the dark rivers and creeks (C1) correspond to “Grade I—within the boundary,” “Grade II—10 m around the boundary,” and “Grade III—10 m beyond the boundary within the scope.” In contrast, there is no implicit order for multi-classification variables, and there is no way to conduct comparisons between the different classifications. For example, the stratigraphic age of limestone (C9) includes Permian, Carboniferous, Ordovician, Cambrian, Sinian, and limestone-free zones.
For sequential grade variables, the Spearman correlation coefficient can be used to test for the existence of monotonic correlations between variables, thus eliminating redundant evaluation factors. The correlation coefficient calculation equation is as Eq. 2:
The correlation coefficient (ρ) calculated using this equation has a value range of [−1,1]. When a variable decreases monotonically with another,
2.3.2.2 Factor detection based on geo-detectors
The geo-detectors used in this study had four main components, as follows: 1) A risk detector that compares the mean value of risk event attributes (dependent variables) between different sub-areas, and the more significant the difference in mean, the greater the risk for the sub-area; 2) An impact factor detector that compares the cumulative variance of each sub-area with that of the entire study area, and the smaller the ratio, the greater the impact of the factor on the risk event; 3) An ecological detector to calculate the cumulative variance of different sub-areas for different factors that compares the effects of different factors on the spatial distribution of event
The indicators data layer will be used to form a susceptibility score assessment after the correlation analysis. Regarding to the vitality to improving the acurrarcy of UGC susceptibility mapping, indicators with significant statistical results of risk detector and greater influence of impact factor detector will be selected as assessement indicators and jointly used to calculate the final score. In our study, we assume that the greater the impact of indicator on the spatial probability of UGC events, the more similar their spatial distribution between the kernal density map of UGC and the indicator values in Figure 2 will be. Q-value of the results of impact factor is used to measure the spatial distribution similarity.
3 Results and analysis
3.1 Urban ground collapse evaluation system
3.1.1 Distribution of historical urban ground collapse events
The probability density for historical UGC events was calculated using search radius values of 3 and 5 km, and 100 m as the calculation unit (Figure 3). The comparisons showed that the probability density distribution map with a search radius of 5 km could provide a better synthesis of the spatiotemporal relationship of historical time for likelihood classification, and it was thus linked to the kilometer grid for the evaluation area to enable value assignment. These values were then used as the dependent variables when screening evaluation factors.
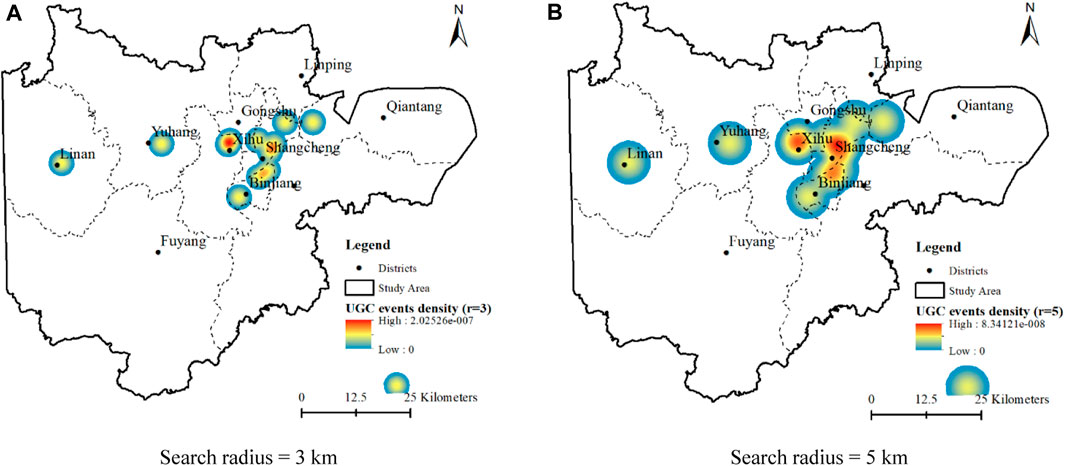
FIGURE 3. Probability density distribution for historical UGC events. (A) Search radius = 3 km. (B) Search radius = 5 km.
3.1.2 Factor collinearity analysis
The GIS analysis is applied to the grid units of Eastern Hangzhou, which has a spatial scale of 1 km × 1 km. There are 5,982 grids in total, 3,444 of which are bedrock mountainous area and are not participated in analysis.
The Pearson correlation coefficient (r) was calculated for the numerical factors, and the results obtained are shown in Table 2. The calculated correlation coefficients included a pair of highly correlated factors among the 12 numerical factors in the collinearity analysis, namely the density of underground pipelines (C19) and the density of water supply pipelines (C20). There were two pairs of strongly correlated factors, namely the density of underground pipelines (C19) and the density of drainage pipelines (C21) as well as the population density (C15) and the proportion of construction land (C17).
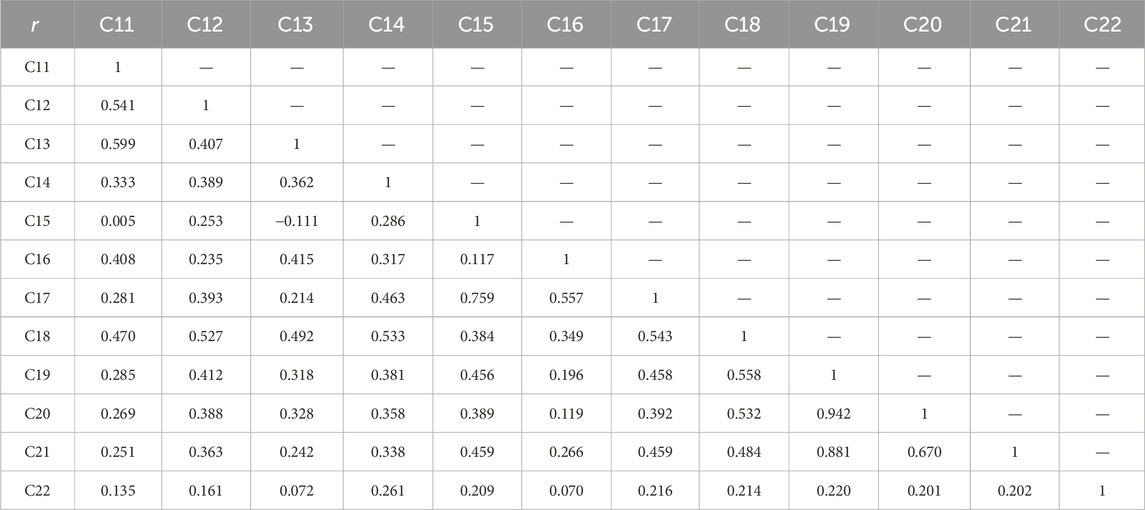
TABLE 2. Results of the correlation analysis between continuous variables.
Similarly, the Spearman correlation coefficient (
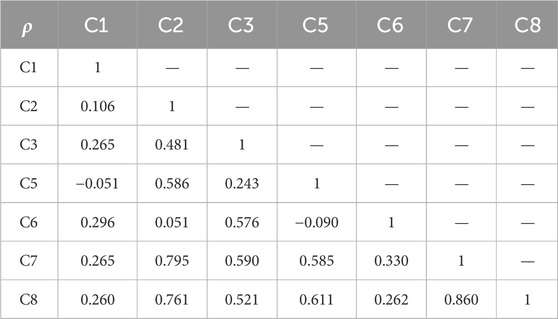
TABLE 3. Results of the correlation analysis between level variables.
During susceptibility evaluations for UGC, it is necessary to eliminate the factors with a high degree of collinearity, to ensure that the evaluation value is not biased due to the superposition of factors. First, the screening method used should try to retain factors with strong data availability, to facilitate the promotion of the evaluation system. Second, factors with high levels of overlapping collinearity should be selected to ensure that the number of evaluation factors has a higher level of representativeness. In this study, six pairs of strongly or highly correlated factor pairs were obtained. There was a strong correlation among the density of the underground pipelines (C19), the density of the water supply pipelines (C20) and the density of drainage pipelines (C19). Therefore, it can be considered to directly use C19 instead of the other two factors to participate in the construction of the evaluation system. Similarly, the thickness of the saturated silt layer had a strong correlation with the distribution of the second and third soft soil layers and was considered to directly replace C7 and C8 with C2. In addition, the construction land factor was also highly correlated with GDP per unit area (C16) and disaster prevention and reduction investment (C18). Therefore, it was also recommended to use C17 instead of C15, C16, and C18 in the evaluation model.
In summary, from the perspectives of representativeness and redundancy, 15 evaluation indicators were selected for the next steps in risk-detector testing, including the distance from hidden rivers and creeks (C1), thickness of the saturated silt layer (C2), thickness of the top fill layer (C3), groundwater type (C4), cumulative settlement from 2017 to 2020 (C5), distribution of the first soft soil layer (C6), distribution of the limestone (C9), distribution of the shallow gas (C10), burial depth of the saturated silt (sand) roof (C11), burial depth of the underground confined water level (C12), underground shallow water level variations (C13), density of major linear projects (C14), proportions of the construction land (C17), density of underground pipelines (C19), and density of linear projects under construction (C22).
3.1.3 Risk factor detection
Geo-detector was deployed to detect 5,982 grid points within the research area. The factors retained after collinearity analysis were taken as independent variables, and the probability densities of the historical UGC events were used as dependent variables. The impact factor detector was used to calculate the individual evaluation indicators. The results from the impact factor detector calculations are shown in Table 4.
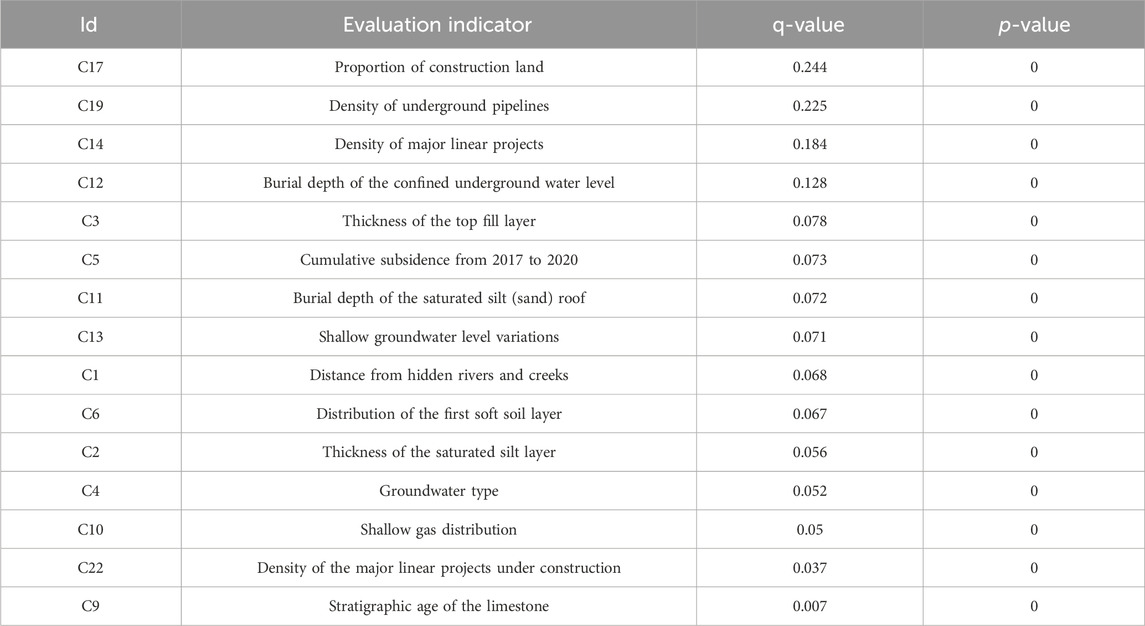
TABLE 4. Impact factor detection results for the evaluation indicator pool (high to low).
The p-values for all factors were less than 0.001. This indicates that the detection results have statistical significance for the current set of indicators. In terms of explanatory power score (q-value), the highest four scores were for the proportion of construction land (C17), which is 0.244, the density of underground pipelines (C19), which is 0.225, the density of major linear projects (C14), which is 0.184, and the buried depth of underground confined water level (C12), which is 0.128. While the lowest four scores were for the distribution of limestone (C9), which is 0.007, the density of major linear projects under construction (C22), which is 0.037, the distribution of shallow gas (C10), which is 0.050, and the groundwater abundance (C4), which is 0.052. These results indicated that there was a close relationship between urban construction activities (including construction land, underground pipelines, and major linear projects), burial depth of the underground confined water, and UGC event. It also coincides with the facts that increased rates of suffosion are largely caused by increased drainage input or by a decline of the water table (Waltham, 2008). However, the types of limestone, the distribution of shallow gas, the groundwater type, as well as the density of major linear projects under construction, had a relatively small impact on the susceptibility of UGC.
Based on the above conclusions and by excluding four indicators with lower explanatory power, 11 factors with higher q-values were selected to construct a UGC susceptibility evaluation indicator system (Table 5).
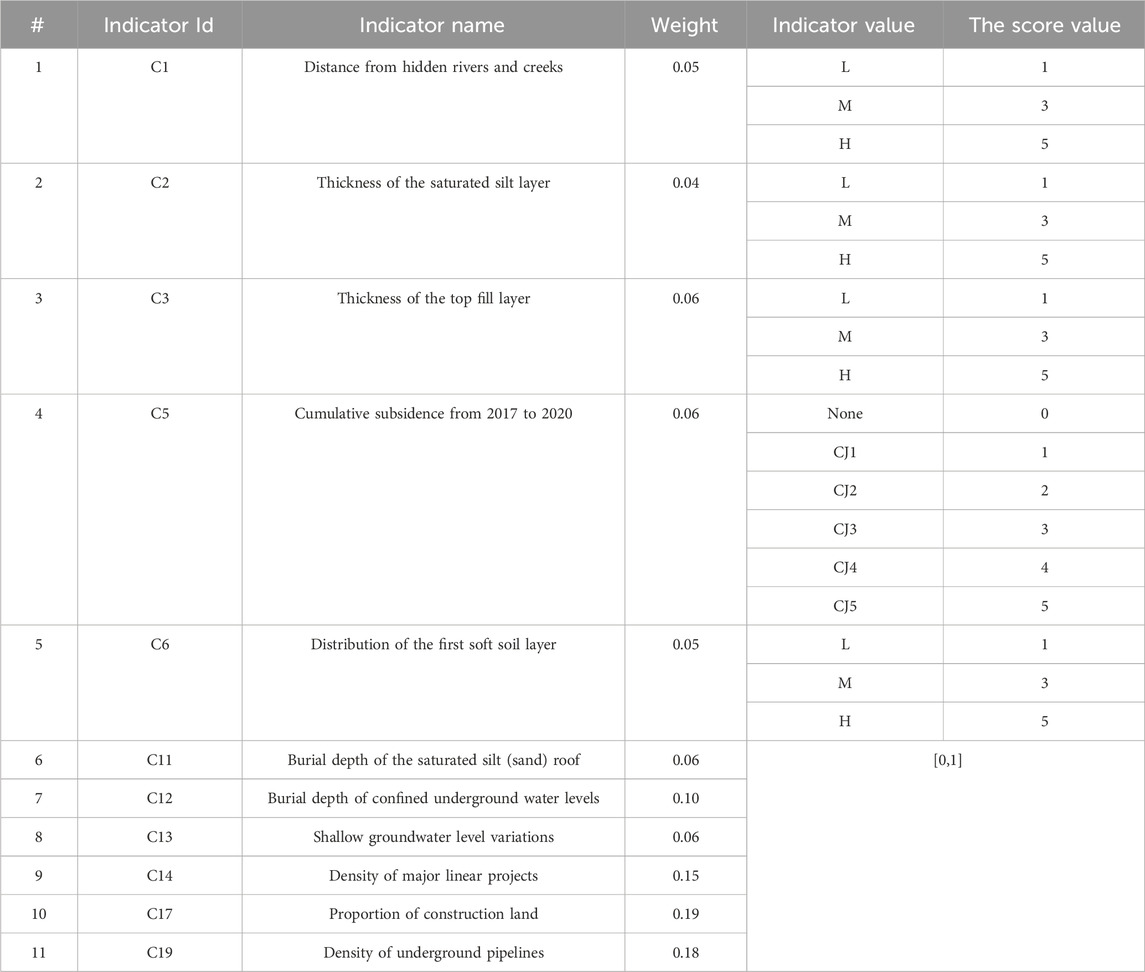
TABLE 5. UGC susceptibility evaluation indicator system.
When grading the indicators of sequential factors, they were divided into three grades, and the scores were taken as 1, 3, and 5 respectively; if divided into five grades, the scores were 1, 2, 3, 4, and 5 respectively. During the specific evaluation calculation, each indicator adopted the value after the min-max normalization to [0,1]. The score with q-value standardization was used as the evaluation weight. Eventually, the score values were weighted and summed.
3.2 Results of model evaluation
According to the indicator weights and corresponding values in the UGC susceptibility evaluation indicator system (Table 5), the weighted sum of the indicators in the study area was calculated using a grid as a unit to obtain susceptibility evaluations. A thematic map of the susceptibility score was produced using the natural breaks method to categorize the score into three grades (Figure 4). The number and proportion of grids in the probability density susceptibility evaluation results were based on high-, medium- and low-susceptibility, and bedrock mountainous areas (Table 6).
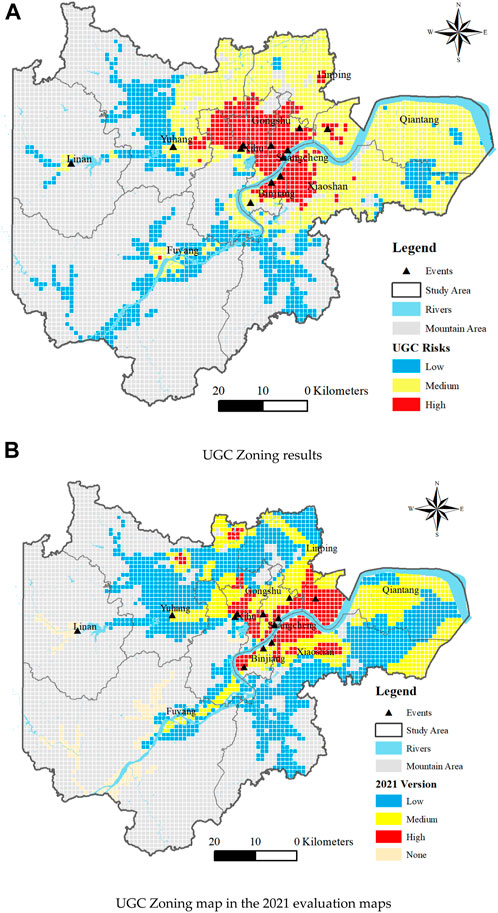
FIGURE 4. Susceptibility mapping results. (A) UGC Zoning results. (B) UGC Zoning map in the 2021 evaluation maps.
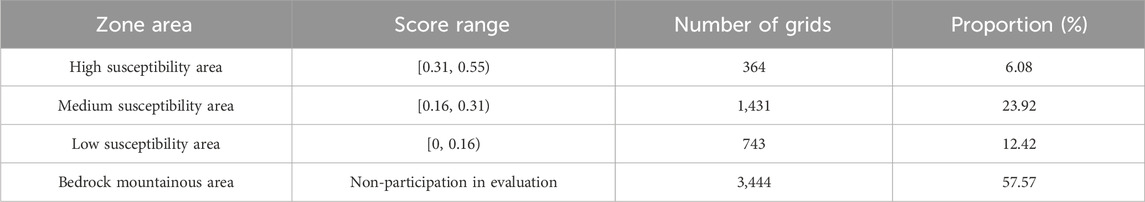
TABLE 6. Susceptibility zoning of UGC events.
3.2.1 Single center clustering characteristics of the distribution
The proportion of high-susceptibility areas was the lowest (6.08% of the research area), and these areas were distributed on both sides of the Qiantang River in the east and in the Dajiangdong area, while a small number were distributed on the north side. The proportion of medium-susceptibility areas was the highest (23.92% of the study area), and these areas were found to be expanding outwards around the downtown area. Finally, the proportion of low-susceptibility areas was low (12.42% of the study area), and these areas were mainly located between the medium-susceptibility areas and the bedrock mountainous areas, and extended along the water system around the periphery of the medium-susceptibility areas. A small number of low-susceptibility areas were found to be distributed inside the medium-susceptibility area on the east side. The susceptibility-free areas were mainly located in the bedrock mountainous areas on the west side.
These results indicated that the distribution of the UGC susceptibility exhibited a single center clustering feature, with the susceptibility level decreasing from the city center outwards. High-susceptibility areas were mainly concentrated in the city center, medium-susceptibility areas in the eastern periphery of the city, and low-susceptibility areas in the western and southern areas dominated by bedrock mountainous areas.
3.2.2 Large variations in the UGC susceptibility between different administrative districts
The susceptibility map showed huge differences in the distribution patterns of the susceptibility areas between different administrative districts. Gongshu District, Binjiang District, most of Shangcheng District, as well as the northern part of Xihu District and the western part of Xiaoshan District were high-susceptibility areas. Most historical UGC events were also concentrated within these five areas. Linping District, Qiantang District, and most of the eastern part of Yuhang District were medium-susceptibility areas, with only a small number of high-susceptibility areas. Fuyang District and Lin’an District, as well as the western part of Yuhang District and the southern part of Xiaoshan District, were predominantly low-susceptibility areas, except for the bedrock mountainous areas. The large differences in the distribution patterns of the UGC susceptibility between different administrative districts is mainly related to their geographical distribution. Administrative districts in the city center are mainly covered by high-susceptibility areas. In the Yuhang and Xiaoshan Districts with high-, medium-, and low-susceptibility areas at the same time, the high-susceptibility areas are also mainly distributed in the areas close to the city center. The administrative districts on the east side are mainly covered by medium-susceptibility areas, while the administrative areas on the west and south sides mainly have low-susceptibility areas.
The high-susceptibility areas for UGC in the eastern part of Hangzhou accounted for the smallest proportion of the total area (6.08%) and were mainly distributed in the central area of the city on both sides of the Qiantang River. The proportion of medium susceptibility areas was not significantly different from that of the low-susceptibility areas, both of which were approximately 20%. These areas showed an expanding trend outwards around the central area of the city. The model exhibits good rationality and applicability and can provide reference for other cities in Zhejiang Province to help evaluate UGC susceptibility.
4 Discussion
4.1 Comparison with the 2021 evaluation results
The susceptibility evaluation results from this study (Figure 4A) and the 2021 version (Figure 4B) were generally similar. The susceptibility areas in both studies were mainly concentrated on the east side, and the high-susceptibility areas were concentrated on the two sides of the Qiantang River and the Dajiangdong area. The distribution of the low-susceptibility areas on the west side and the north side was also similar between the studies. The difference between this study and the 2021 version is that the susceptibility evaluation results from this study, the proportion of medium- and high-susceptibility areas, were found to be relatively high, while in the 2021 study the proportion of low-susceptibility areas was relatively high. Some high-susceptibility areas in the city center were evaluated as medium-susceptibility areas in the 2021 study, while certain medium-susceptibility areas on the east side were evaluated as low-susceptibility areas in the 2021 study. Notably, although the susceptibility levels of Yuhang District and Xihu District in the 2021 study were relatively low, UGC events have still occurred, especially in the northern plain area of Xihu District, where there have been two UGC events caused by subway construction. The comparisons show that the evaluation results of this study are more objective and reasonable than the 2021 study, and the constructed model has reference value.
4.2 Applicability issues when promoting evaluation indicators
Among the numerical factors in this study, the proportion of construction land (C17) was highly correlated with population density (C15), GDP per unit area (C16), and investment in disaster prevention and reduction (C18). This means that when it is difficult to obtain factors such as population distribution and investment in disaster prevention and reduction, the proportion of construction land (C17) can to some extent represent the other three factors. For the grade factors, the thickness of the saturated silt layer (C2) was highly correlated with the distributions of the second and third soft soil layers ((C7 and C8, respectively). Similarly, when data are limited, the thickness of the saturated silt layer (C2) can be prioritized to ensure that the factors in the evaluation process have better representation.
5 Conclusion
The environmental and geological conditions of the study area, when combined with the historical UGC event inventory, were used to establish a susceptibility evaluation system for UGC using 11 evaluation indicators. The susceptibility for the study area was divided into three grades. The results showed that the UGC events in the study area in recent years had occurred in the high- and medium-susceptibility areas. The evaluation results were relatively objective and reasonable, consistent with historical events.
In the study area, the proportion of medium- and high-susceptibility areas was moderate (accounting for 30% of the study area); however, these areas were relatively concentrated in their spatial distributions. In other words, they were distributed on both sides of the Qiantang River in the east and in the Dajiangdong area. Thus, this information should be carefully considered and taken into account during urban construction.
For high-susceptibility areas, it is recommended to regularly monitor the surface and use tools such as the geological radar to monitor the development of underground soil caves. Timely intervention measures should also be taken to reduce the damage from UGC on the lives, properties, and safety of urban residents.
The geological patterns and triggering dynamic factors of the cities in Zhejiang Province were the same as those in this study area. The evaluation system established in this study should be applicable to other cities in the province with frequent construction activities and historical UGC events, such as Shaoxing and Jiaxing. The only modifications required are appropriate adjustments for the weights of the different factors and assignment intervals according to the different regional geological conditions and the main controlling factors of UGC. This study should thus be of widespread interest and stimulate related studies to further develop the method.
Data availability statement
The original contributions presented in the study are included in the article/Supplementary material, further inquiries can be directed to the corresponding author.
Author contributions
LZ: Conceptualization, Data curation, Writing–original draft, Writing–review and editing. XZ: Methodology, Writing–original draft. HS: Validation, Writing–review and editing. DZ: Resources, Supervision, Writing–review and editing. HB: Funding acquisition, Project administration, Supervision, Writing–review and editing.
Funding
The author(s) declare financial support was received for the research, authorship, and/or publication of this article. This work was supported by the National Natural Science Foundation of China (No. 42271267) and the Key Research Center of Philosophy and Social Sciences of Zhejiang Province (No. 20JDZD022), Department of Natural Resources of Zhejiang Province under Grant (No. 2022-65), the Basic Geological Special Foundation of Zhejiang Province (No. 2022007) and Scientific Research Foundation of Zhejiang University City College (No. X-202208).
Conflict of interest
The authors declare that the research was conducted in the absence of any commercial or financial relationships that could be construed as a potential conflict of interest.
Publisher’s note
All claims expressed in this article are solely those of the authors and do not necessarily represent those of their affiliated organizations, or those of the publisher, the editors and the reviewers. Any product that may be evaluated in this article, or claim that may be made by its manufacturer, is not guaranteed or endorsed by the publisher.
References
Bianchini, S., Confuorto, P., Intrieri, E., Sbarra, P., Di Martire, D., Calcaterra, D., et al. (2022). Machine learning for sinkhole risk mapping in guidonia-bagni di tivoli plain (rome), Italy. Geocarto Int. 37, 16687–16715. doi:10.1080/10106049.2022.2113455
Buttrick, D., and Van Schalkwyk, A. (1998). Hazard and risk assessment for sinkhole formation on dolomite land in South Africa. Environ. Geol. 36, 170–178. doi:10.1007/s002540050333
Ciotoli, G., Nisio, S., Finoia, M. G., and Corazza, A. (2012). Susceptibility maps of collapse sinkholes in urban areas by using geospatial analysis. Inf. Syst. 2, 480–481.
Ding, Q., Shao, Z., Huang, X., Altan, O., Zhuang, Q., and Hu, B. (2021). Monitoring, analyzing and predicting urban surface subsidence: a case study of wuhan city, China. Int. J. Appl. earth observation geoinformation 102, 102422. doi:10.1016/j.jag.2021.102422
Feizizadeh, B., and Blaschke, T. (2011). Landslide risk assessment based on GIS multi-criteria evaluation: a case study in bostan-abad county, Iran. J. earth Sci. Eng. 1, 66–77.
Galve, J. P., Gutiérrez, F., Remondo, J., Bonachea, J., Lucha, P., and Cendrero, A. (2009). Evaluating and comparing methods of sinkhole susceptibility mapping in the ebro valley evaporite karst (NE Spain). Geomorphology 111, 160–172. doi:10.1016/j.geomorph.2009.04.017
Giovinazzi, S., Marchili, C., Di Pietro, A., Giordano, L., Costanzo, A., La Porta, L., et al. (2021). Assessing earthquake impacts and monitoring resilience of historic areas: methods for GIS tools. ISPRS Int. J. Geo-Information 10, 461. doi:10.3390/ijgi10070461
Guarino, P. M., Santo, A., Forte, G., De Falco, M., and Niceforo, D. M. A. (2018). Analysis of a database for anthropogenic sinkhole triggering and zonation in the Naples hinterland (southern Italy). Nat. Hazards 91, 173–192. doi:10.1007/s11069-017-3054-5
Gutiérrez, F., Parise, M., De Waele, J., and Jourde, H. (2014). A review on natural and human-induced geohazards and impacts in karst. Earth-Science Rev. 138, 61–88. doi:10.1016/j.earscirev.2014.08.002
He, Q., Tan, F., Peng, Z., Tao, L., Jiao, Y., Liu, S., et al. (2022). Genesis analysis of ground collapse in wuhan based on 3D geological model. Front. Earth Sci. 10, 934452. doi:10.3389/feart.2022.934452
Heron, D., Lukovic, B., Massey, C., Ries, W., and McSaveney, M. (2014). GIS modelling in support of earthquake-induced rockfall and cliff collapse risk assessment in the port hills, christchurch. J. Spatial Sci. 59, 313–332. doi:10.1080/14498596.2014.913509
Hu, J., Motagh, M., Guo, J., Haghighi, M. H., Li, T., Qin, F., et al. (2022). Inferring subsidence characteristics in wuhan (China) through multitemporal InSAR and hydrogeological analysis. Eng. Geol. 297, 106530. doi:10.1016/j.enggeo.2022.106530
Kim, Y. J., Nam, B. H., Shamet, R., Soliman, M., and Youn, H. (2020). Development of sinkhole susceptibility map of east central Florida. Nat. Hazards Rev. 21, 402. doi:10.1061/(ASCE)NH.1527-6996.0000404
Lathrop, R. G., and Bognar, J. A. (1998). Applying GIS and landscape ecological principles to evaluate land conservation alternatives. Landsc. Urban Plan. 41, 27–41. doi:10.1016/S0169-2046(98)00047-4
Lee, S., Ryu, J.-H., Won, J.-S., and Park, H.-J. (2004). Determination and application of the weights for landslide susceptibility mapping using an artificial neural network. Eng. Geol. 71, 289–302. doi:10.1016/S0013-7952(03)00142-X
Liu, J. G., Mason, P. J., Yu, E., Wu, M.-C., Tang, C., Huang, R., et al. (2012). GIS modelling of earthquake damage zones using satellite remote sensing and DEM data. Geomorphology 139–140, 518–535. doi:10.1016/j.geomorph.2011.12.002
Liu, R., Sun, H., Qin, J., and Zheng, Z. (2023). A multi-geophysical approach to assess potential sinkholes in an urban area. Eng. Geol. 318, 107100. doi:10.1016/j.enggeo.2023.107100
Lu, W., Wu, Y., Choguill, C. L., Lai, S.-K., and Luo, (2021). Underground Hangzhou: the challenge of safety vs. commerciality in a major Chinese city. Cities 119, 103414. doi:10.1016/j.cities.2021.103414
Lyu, H.-M., Shen, S.-L., Zhou, A., and Yang, J. (2020). Risk assessment of mega-city infrastructures related to land subsidence using improved trapezoidal FAHP. Sci. Total Environ. 717, 135310. doi:10.1016/j.scitotenv.2019.135310
Lyu, H.-M., Sun, W.-J., Shen, S.-L., and Arulrajah, A. (2018). Flood risk assessment in metro systems of mega-cities using a GIS-based modeling approach. Sci. Total Environ. 626, 1012–1025. doi:10.1016/j.scitotenv.2018.01.138
Merchán, L., Martínez-Graña, A., Nieto, C. E., Criado, M., and Cabero, T. (2023). Characterisation of the susceptibility to slope movements in the arribes del duero natural park (Spain). Land 12, 1513. doi:10.3390/land12081513
Michael, E. A., and Samanta, S. (2016). Landslide vulnerability mapping (LVM) using weighted linear combination (WLC) model through remote sensing and GIS techniques. Model. Earth Syst. Environ. 2, 88–15. doi:10.1007/s40808-016-0141-7
Mostafiz, R. B., Friedland, C. J., Rohli, R. V., and Bushra, N. (2021). Property Risk Assessment of Sinkhole Hazard in Louisiana, U.S.A. Front. Environ. Sci. 9, 780870. doi:10.3389/fenvs.2021.780870
Orhan, O., Yakar, M., and Ekercin, S. (2020). An Application on Sinkhole Susceptibility Mapping by Integrating Remote Sensing and Geographic Information Systems. Arabian J. Geosciences 13, 886–917. doi:10.1007/s12517-020-05841-6
Ozdemir, A. (2016). Sinkhole Susceptibility Mapping Using Logistic Regression in Karapınar (Konya, Turkey). Bull. Eng. Geol. Environ. 75, 681–707. doi:10.1007/s10064-015-0778-x
Pellicani, R., Spilotro, G., and Gutiérrez, F. (2017). Susceptibility Mapping of Instability Related to Shallow Mining Cavities in a Built-up Environment. Eng. Geol. 217, 81–88. doi:10.1016/j.enggeo.2016.12.011
Roccati, A., Paliaga, G., Luino, F., Faccini, F., and Turconi, L. (2021). GIS-Based Landslide Susceptibility Mapping for Land Use Planning and Risk Assessment. Land 10, 162. doi:10.3390/land10020162
Sarkar, D., Saha, S., and Mondal, P. (2022). GIS-Based Frequency Ratio and Shannon’s Entropy Techniques for Flood Vulnerability Assessment in Patna District, Central Bihar, India. Int. J. Environ. Sci. Technol. 19, 8911–8932. doi:10.1007/s13762-021-03627-1
Subedi, P., Subedi, K., Thapa, B., and Subedi, P. (2019). Sinkhole Susceptibility Mapping in Marion County, Florida: Evaluation and Comparison between Analytical Hierarchy Process and Logistic Regression Based Approaches. Sci. Rep. 9, 7140. doi:10.1038/s41598-019-43705-6
Tan, F., Tan, W., Yan, F., Qi, X., Li, Q., and Hong, Z. (2022). Model Test Analysis of Subsurface Cavity and Ground Collapse Due to Broken Pipe Leakage. Appl. Sci. 12, 13017. doi:10.3390/app122413017
Tufano, R., Guerriero, L., Annibali Corona, M., Bausilio, G., Di Martire, D., Nisio, S., et al. (2022). Anthropogenic Sinkholes of the City of Naples, Italy: An Update. Nat. Hazards 112, 2577–2608. doi:10.1007/s11069-022-05279-x
Waltham, T. (2008). Sinkhole Hazard Case Histories in Karst Terrains. Q. J. Eng. Geol. Hydrogeology 41, 291–300. doi:10.1144/1470-9236/07-211
Wang, G., Hao, J., Wen, H., and Cao, C. (2022). A Random Forest Model of Karst Ground Collapse Susceptibility Based on Factor and Parameter Coupling Optimization. Geocarto Int. 37, 15548–15567. doi:10.1080/10106049.2022.2102216
Wang, H., Gao, J., and Hou, W. (2019). Quantitative Attribution Analysis of Soil Erosion in Different Geomorphological Types in Karst Areas: Based on the Geodetector Method. J. Geogr. Sci. 29, 271–286. doi:10.1007/s11442-019-1596-z
Wang, X.-W., and Xu, Y.-S. (2022). Investigation on the Phenomena and Influence Factors of Urban Ground Collapse in China. Nat. Hazards 113, 1–33. doi:10.1007/s11069-022-05304-z
Xie, H., Zhang, Y., Chen, Y., Peng, Q., Liao, Z., and Zhu, J. (2021). A Case Study of Development and Utilization of Urban Underground Space in Shenzhen and the Guangdong-Hong Kong-Macao Greater Bay Area. Tunn. Undergr. Space Technol. 107, 103651. doi:10.1016/j.tust.2020.103651
Xiong, J., Li, J., Cheng, W., Wang, N., and Guo, L. (2019). A GIS-Based Support Vector Machine Model for Flash Flood Vulnerability Assessment and Mapping in China. ISPRS Int. J. Geo-Information 8, 297. doi:10.3390/ijgi8070297
Xu, K., Kong, C., Li, J., and Zhang, L. (2012). GEO-Environmental Suitability Evaluation of Land for Urban Construction Based on A Back-Propagation Neural Network and GIS: A Case Study of Hangzhou. Phys. Geogr. 33, 457–472. doi:10.2747/0272-3646.33.5.457
Xu, K., Kong, C., Li, J., Zhang, L., and Wu, C. (2011). Suitability Evaluation of Urban Construction Land Based on Geo-Environmental Factors of Hangzhou, China. Comput. Geosciences 37, 992–1002. doi:10.1016/j.cageo.2011.03.006
Xu, Y.-S., Shen, J. S., Zhou, A.-N., and Arulrajah, A. (2018). Geological and Hydrogeological Environment with Geohazards during Underground Construction in Hangzhou: A Review. Arab. J. Geosci. 11, 544. doi:10.1007/s12517-018-3894-7
Yu, P., Dong, J., Hao, H., Xie, Y., Zhang, H., Wang, J., et al. (2023). Risk Assessment and Prevention Planning for Collapse Geological Hazards Considering Extreme Rainfall—A Case Study of Laoshan District in Eastern China. Land 12, 1558. doi:10.3390/land12081558
Zerhouny, M., Fadil, A., and Hakdaoui, M. (2018). Underground Space Utilization in the Urban Land-Use Planning of Casablanca (Morocco). Land 7, 143. doi:10.3390/land7040143
Zhang, C., Kwon, S., Oh, J., and Park, K. (2023b). An integrated ahp-promethee ii ranking method to evaluate the resilience of sewer networks considering urban flood and ground collapse risks. Water Sci. Technol. 87, 1438–1453. doi:10.2166/wst.2023.067
Zhang, X., Ruan, Y., Xuan, W., Bao, H., and Du, Z. (2023a). Risk Assessment and Spatial Regulation on Urban Ground Collapse Based on Geo-Detector: A Case Study of Hangzhou Urban Area. Nat. Hazards 118, 525–543. doi:10.1007/s11069-023-06016-8
Zhou, H., Liu, C., Wang, G., Kang, K., and Liu, Y. (2022). Study on Drilling Ground Collapse Induced by Groundwater Flow and Prevention Based on a Coupled CFD-DEM Method. KSCE J. Civ. Eng. 26, 2112–2125. doi:10.1007/s12205-022-1061-x
Keywords: spatial probability, susceptibility mapping, sinkhole, road collapse, geological risks, geo-detector
Citation: Zhou L, Zhang X, Shen H, Zhang D and Bao H (2024) GIS analysis of urban ground collapse susceptibility: a case study of eastern Hangzhou, China. Front. Earth Sci. 11:1338877. doi: 10.3389/feart.2023.1338877
Received: 15 November 2023; Accepted: 29 December 2023;
Published: 10 January 2024.
Edited by:
Chong Xu, Ministry of Emergency Management, ChinaReviewed by:
Sk Ajim Ali, Aligarh Muslim University, IndiaGiovanni Forte, University of Naples Federico II, Italy
Qiang Liu, Southwest Jiaotong University, China
Copyright © 2024 Zhou, Zhang, Shen, Zhang and Bao. This is an open-access article distributed under the terms of the Creative Commons Attribution License (CC BY). The use, distribution or reproduction in other forums is permitted, provided the original author(s) and the copyright owner(s) are credited and that the original publication in this journal is cited, in accordance with accepted academic practice. No use, distribution or reproduction is permitted which does not comply with these terms.
*Correspondence: Haijun Bao, YmFvaGFpanVuQGh6Y3UuZWR1LmNu