 Peili Su
 Shu Yang
- College of Architecture and Civil Engineering, Xi’an University of Science and Technology, Xi’an, China
After the water inrush accident in coal mine tunnels, early-stage pouring of aggregate forms a high-resistance, low-permeability aggregate stacking, transforming the pipeline flow into percolation. In the later stage, grouting is carried out into the interior of the aggregate stacking, effectively accumulating and solidifying the cement slurry. Among these, whether the slurry can migrate over long distances and fill the voids inside the aggregate stacking is the critical determinant of the success or failure of sealing. To quantitatively analyze the migration distance of slurry inside the aggregate stacking after grouting, a single-hole grouting test platform was established, and an orthogonal experiment was designed with grouting pressure, water cement ratio, and aggregate stacking porosity as influencing factors. Based on 25 sets of experimental measurements, four neural network prediction models suitable for studying the slurry migration distance within the aggregate stacking were constructed separately as back propagation neural network (BPNN), genetic algorithm (GA) combined BPNN, particle swarm optimization (PSO) combined BPNN, and GA-PSO combined BPNN. Evaluation criteria such as Mean Absolute Error (MAE), Mean Absolute Percentage Error (MAPE), Mean Square Error (MSE), Root Mean Square Error (RMSE), and the coefficient of determination (R2) were used for comparative analysis of the calculation errors and prediction accuracy of each model. From the perspective of neural network prediction results, the weight value of each influencing factor was analyzed, and the ranking was as follows: grouting pressure > aggregate particle size > water cement ratio, with grouting pressure being the primary controlling factor. The study demonstrates that the GA-PSO-BP model exhibits the best prediction performance, with an average relative error of only 1.59% and an R² of 0.998. This neural network model overcomes issues such as slow learning and getting stuck in tricky spots in BP neural networks. The prediction model shows high accuracy and stability, enabling more effective and accurate prediction of slurry migration distances, making it worthy of dissemination and application. This study can improve safety measures by reducing waste, expediting disaster management efforts, and minimizing environmental hazards associated with mining incidents.
1 Introduction
After the water inrush accident occurs in the coal mine, the first step is to pour aggregates to form a sufficiently long and high aggregate stacking to intercept and slow down the flow. Subsequently, cement slurry is grouting into the interior of the aggregate stacking to reinforce it, ultimately achieving complete sealing, which is currently one of the most effective measures in water hazard control (Mou et al., 2020). If the migration distance of the grouting slurry is too short and cannot completely cover the entire aggregate stacking, most of the internal voids of the aggregate stacking will still be occupied by water, which could result in the reinforced area of the aggregate stacking being too small, which could lead to dam failure after being impacted by water flow. If the migration distance of the slurry is too long, it will result in significant resource wastage.
The migration distance of cement slurry is influenced by factors such as the rheological properties of the slurry, gelation time, grouting pressure, and geometric characteristics of the receiving body (Zhu J. Q. et al., 2023). In cases where the particle size of the aggregate particles is uniform, theoretical formulas can be used for calculation. However, in practice, due to the involvement of numerous influencing factors, there can be significant deviations between the theoretically calculated migration distance and actual values. Therefore, initial single-hole grouting experiments are conducted to determine the migration distance. Once the migration distance is determined, the spacing between holes can be established. When determining hole spacing, it is necessary to consider both maximizing the effectiveness of each grouting hole to minimize project costs and ensuring that the holes are interconnected for uniform slurry distribution. Therefore, the accurate prediction of the migration distance of cement slurry within the aggregate stacking is of paramount importance for underground water hazard control efforts. Previously, the migration distance of the slurry was predicted by proposing hypotheses, establishing simplified models, and deriving theoretical formulas, achieving some success in this area. However, this approach still has significant limitations. For example, when multiple influencing factors are involved, theoretical models might not capture all variations and interactions between factors, leading to deviations between predicted results and actual situations.
In recent years, data-driven methods (such as regression analysis and neural networks) have been applied by many scholars in predictive research related to grouting volume and slurry diffusion. However, this method is still in its infancy when it comes to studying the migration distance of slurry within aggregate stacking. Based on the model test results, a BP neural network prediction model for the anti-seepage reinforcement effect of permeable polymer grouting in the loose area of drainage pipelines was constructed. This model was then applied to verify the research results in the treatment project of the loose area of drainage pipelines (Du et al., 2023). Advantage was taken of the close relationship between the characteristic parameters and the grouting saturation to establish a BP neural network regression model. Moreover, the network parameters were adjusted to make the model prediction effect the best. After adjusting the network parameters, the network performance was significantly changed and improved (Liu et al., 2022). Ma et al. (2022) utilized a dataset obtained from numerical simulation experiments for machine learning algorithm training. Three machine learning algorithms widely used in geotechnical engineering, namely, Backpropagation Artificial Neural Network (BP-ANN), Random Forest (RF), and Support Vector Regression (SVR), were selected. Based on error evaluation criteria, the prediction accuracy of different algorithms for existing numerical simulation results was compared.
This study is based on the measured data obtained from indoor single-hole grouting tests. It introduces a hybrid optimization algorithm for predicting the migration distance of slurry within aggregate stacking, which combines Genetic Algorithm (GA) and Particle Swarm Optimization (PSO) to optimize a Backpropagation Neural Network (BP) model (GA-PSO-BP neural network prediction model). Comparative analysis with a standalone BP neural network, GA-BP neural network, and PSO-BP neural network validate the superiority of the model and the accuracy of its predictions.
2 Neural network prediction model
2.1 Back propagation neural network
The BPNN (Back Propagation Neural Network) is a type of multi-layer feedforward network trained using the error backpropagation algorithm (Yu et al., 2017). In addition to input and output nodes, the network includes one or more hidden layers with nodes that are not interconnected within the same layer. The learning process of the network comprises two main phases: forward propagation and backward error propagation (Hinton et al., 2006).
During the forward propagation phase, input information passes through weighted processing from the input layer, traversing the hidden layers before reaching the output layer. After undergoing activation function operations, the resulting output values are compared to the desired values. In the presence of errors, the errors are propagated backward through the existing connection pathways, which entails systematically adjusting the weighted coefficients of neurons at each layer, layer by layer, until the output closely approximates the expected output. This iterative process continues until the output approaches the desired output.
In a 3-layer BP neural network with an input layer containing O nodes, a hidden layer containing P nodes, and an output layer containing Q nodes, where xm represents the input to the mth node in the input layer, the weight from the mth node in the input layer to the nth node in the hidden layer is denoted as wmn. The weight from the nth node in the hidden layer to the kth node in the output layer is denoted as wk. The thresholds for the hidden layer and the output layer are represented as θn and γk, respectively. The activation functions for the hidden layer and the output layer are φ and ψ, respectively. During the forward propagation process of data, the output y of the kth node in the output layer can be calculated as follows:
The process of backpropagation of error involves computing the output errors for each neuron layer, starting from the output layer and then iteratively calculating the error gradients. These gradients are used, based on the gradient descent method, to adjust the weights and thresholds of the hidden and output layers. This adjustment is aimed at making the network’s final output as closely aligned as possible with the desired output (Liang et al., 2020; Zhang et al., 2022a).
2.2 GA-BP neural network model
The Genetic Algorithm (GA) is a heuristic stochastic search algorithm that draws inspiration from the biological evolutionary process, simulating the natural mechanisms of inheritance (Wang et al., 2016). It possesses strong adaptability, inherent parallelism, and excellent global search capabilities (Zhu L.et al., 2023). Genetic algorithms map the search space into a genetic space, utilizing a fitness function as the evaluation criteria. Through genetic operators borrowed from the field of natural genetics, such as crossover and mutation, the algorithm performs the selection and inheritance of individuals in the encoded population, establishing an iterative process to generate a new set of solutions. Individual members of the population continually evolve during the iterations, gradually approaching the optimal solution.
Utilizing the global search capabilities and extensive adaptability of genetic algorithms, they demonstrate robust learning capabilities and can overcome the limitations present in the training process of BP neural networks (Wang and Bi, 2020; Guo et al., 2023). They can perform global optimization searches without relying on gradient information, optimizing the initial weights and thresholds of BP neural networks and also addressing the issue of local optima.
The specific GA-BP process (Figure 1) is as follows:
(1) Initialize the population. Encode the connection weights and thresholds of all nodes in the neural network using either real-valued or binary encoding, determining the chromosome length. The number of chromosomes in the population is referred to as the population size, and it is determined by setting the initial population size and generating the initial population randomly.
(2) Define the fitness function. Individual fitness values serve as the basis for population-level operations and are fundamental in guiding individual operations. Higher individual fitness values indicate greater adaptability to the environment and a stronger problem-solving ability in the solution vector space corresponding to the strings. The design of the fitness function, to a certain extent, influences the evolutionary direction and characteristics of the biological population.
(3) Selection operator. The selection operation can simulate the natural selection phenomenon in the biological world. By applying a fitness-proportionate selection operator, high-fitness individuals are chosen for the next iteration. The probability of selecting the ith individual in the population, with fitness fi, is calculated as pi=fi/Σfi (Tan et al., 2019).
(4) Crossover operator. The crossover operation simulates the reproductive process in biological evolution and is a primary process in genetic algorithms for generating new, improved individuals. The single-point crossover operator is used to create new individuals.
(5) Mutation operator. The mutation operation can simulate gene mutations that occur under various chance conditions in biology. To maintain individual diversity and ensure the effectiveness of the genetic algorithm, a non-uniform mutation operator is applied to generate new individuals.
(6) One generation in the GA means a process of completing the selection, crossover and mutation and circularly iterating the optimal initial weight value and the threshold value. After several generations, stop the computation until the computation error reaches the allowable error.
(7) Replace the initial weights and thresholds of the BP neural network with the optimized weights and thresholds computed by the GA.
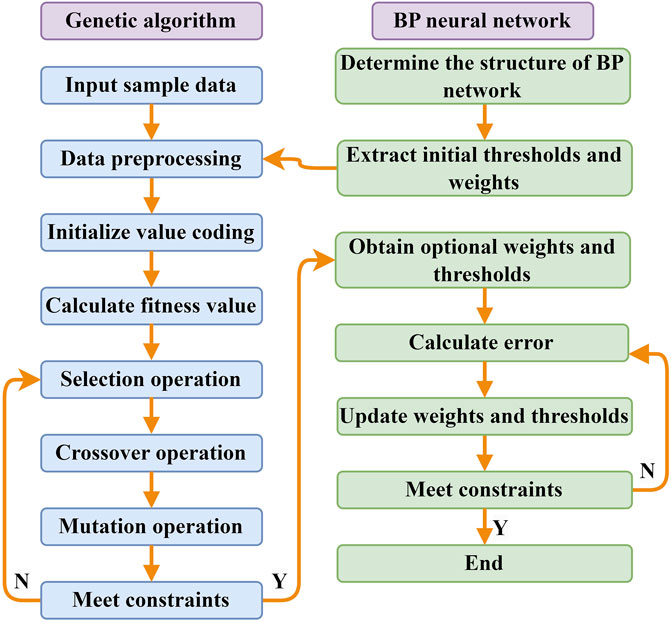
FIGURE 1. GA-BP neural network optimization flow chart.
2.3 PSO-BP neural network model
The Particle Swarm Optimization (PSO) is a swarm intelligence algorithm built upon the imitation of the foraging behavior of birds. PSO initially initializes a population of particles in the feasible solution space, each with its position and velocity (Moazen et al., 2023; Song et al., 2023; Yin et al., 2023). Each particle represents a potential optimal solution to the problem at hand and has its fitness determined by a fitness function. As the particles iterate through the solution space, they track two extremes: one is the best solution found itself, referred to as the personal best, and the other is the best solution found by the entire swarm of particles, known as the global best. Subsequently, particles have their velocities and positions updated until the global optimal solution is found or the maximum iteration limit is reached, thereby concluding the algorithm (Ma et al., 2017).
Assuming a solution space of dimension D, a randomly initialized population of N particles, where particle i’s position is denoted as Xi=(xi1, xi2, … , xiD) and particle i’s velocity is characterized as Vi=(vi1, vi2, … , viD), and each particle i has found its individual best solution represented as pi=(pi1, pi2, … , piD), and the global best solution found by the particle swarm is defined as pg=(pg1, pg2, … , pgD). After particles have found their individual and global best solutions, their velocities and locations are updated according to the following formulas (Yan et al., 2021; Qiao et al., 2023):
where i=1, 2, … , N, j=1, 2, … , D, is the dimension of particles; t is population evolution times; c1, c2 is learning rate; r1, r2 is a random number from 0 to 1; w is inertia weight and represents the non-negative parameter and is used to adjust the search range of the solution space.
The essence of PSO-BP neural networks is to map the weights and thresholds of a BP neural network into PSO particles, which is done by iteratively optimizing the weights and thresholds through updates to particle velocities and positions (Zhang et al., 2022b; Gao et al., 2023). The goal is to enhance the BP neural network’s convergence speed and prediction accuracy. The steps of the PSO-BP neural network are as follows:
(1) Initialize the parameters of the BP neural network and PSO algorithm. These include the activation function, training function, learning rate (lr), goal error (goal), and maximum iterations (epochs), which are determined based on the training sample data. Define the number of nodes in the neural network’s input, hidden, and output layers as O, P, and Q, respectively.
(2) Set the parameters for the particle swarm optimization (PSO) algorithm, including the population size N, acceleration constants c1 and c2, initial weights w1, final weights w2, and population dimension D.
(3) Calculate the fitness value according to the objective function of the optimization problem.
(4) Compare the fitness value of the particle’s current location with its historical best location (pbest) and its global best location (gbest). If the fitness value of the current location is better than the former, the historical location is replaced.
(5) Update the velocity and location of each particle according to Eq. 2–Eq. 3.
(6) The global optimum is output if the stopping criteria are achieved, Otherwise, the algorithm goes back to step (3).
(7) Replace initial weights and thresholds in the BP neural network with the optimized weights and thresholds computed by the PSO.
The algorithm flowchart of the PSO-BP model is shown in Figure 2.
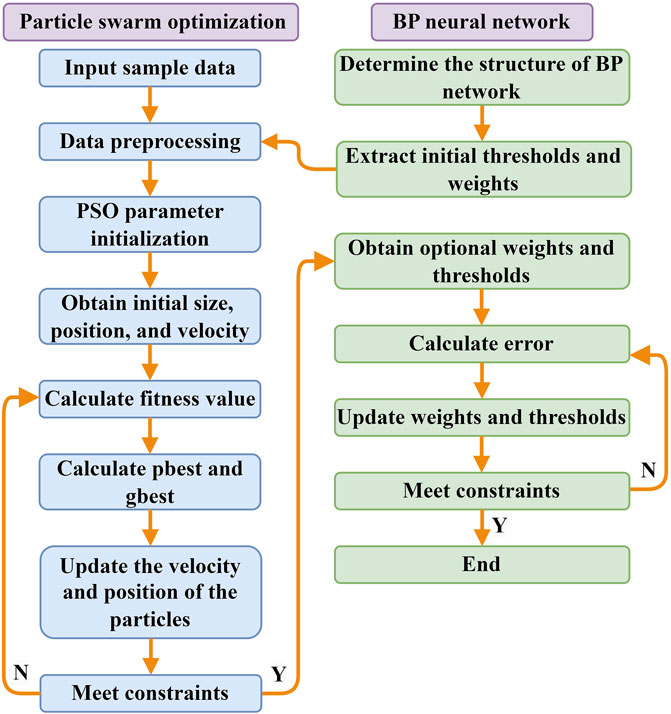
FIGURE 2. PSO-BP neural network optimization flow chart.
2.4 Combined model of PSO, GA, and BPNN
Genetic operations from genetic algorithms are incorporated into particle swarm optimization (PSO), forming a combined GA-PSO algorithm for preprocessing the weights and thresholds of a BP neural network, optimizing the BP neural network model. The GA-PSO merged optimization BP neural network model is established. Particle swarm optimization (PSO) is an optimization algorithm that simulates the natural phenomena of biological population clusters. Genetic algorithms (GA) and particle swarm optimization (PSO) algorithms share similarities, based on the concepts of populations and fitness. Particle swarm optimization exhibits fast convergence in the early stages of evolution, but in the later stages, convergence speed decreases, and convergence accuracy fluctuates, making it susceptible to falling into local minima. Genetic algorithms possess excellent parallel computing capabilities and strong global search abilities.
Thus, the combination of these two algorithms is emphasized, with particle swarm optimization as the primary approach and genetic algorithms as a supplementary method. While particle swarm optimization iteratively optimizes the solution space of the problem being addressed, the individual particles within the particle swarm are transformed into chromosomes for genetic algorithm operations (Lv et al., 2020). The iterative genetic operations of genetic algorithms, including crossover and mutation, are introduced into the optimization process of all chromosomes in the population. The resulting GA-PSO-BP model simultaneously possesses the global convergence of genetic algorithms and the fast convergence of particle swarm optimization, taking advantage of both.
The steps of the PSO-GA-BP are as follows.
(1) BP neural network initialization. Determine the network structure and basic parameters of the BP neural network.
(2) Particle swarm initialization Based on the network structure, determine the population size, dimensions, particle velocities, and positions. Use the error function F of the BP neural network as the fitness function to evaluate the quality of each particle.
(3) Particle swarm iteration. Calculate the update of particle velocities and positions and the fitness of particles to obtain a new population.
(4) Particle swarm optimization added genetic operations. Within the new population, particles are subjected to crossover with individual best particles and global best particles. Additionally, particles with significant differences in fitness values undergo mutation operations with random initialization.
(5) Calculate the fitness values of the new particles. Compare, record, and update the best positions of different individuals and the best position of the population. Replace the best particles from the previous generation of genetic optimization. If it is not met, jump to step (3) and continue completing the iteration.
(6) Decode and assign values to train the network. The improved GA-PSO algorithm’s optimal individual is decoded and assigned to the BP neural network. Utilize training data to train the network and continuously update the network’s weight matrices until the training is complete or meets the accuracy requirements, establishing a well-trained neural network model.
The flowchart of PSO-GA-BP neural network prediction model is shown in Figure 3 as follows:
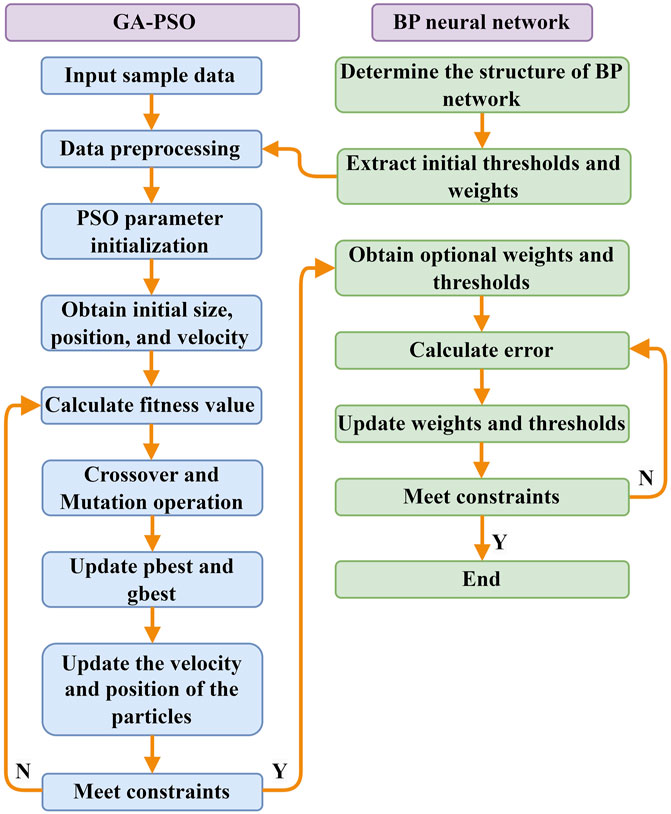
FIGURE 3. Flow chart of GA-PSO-BP neural network prediction model.
3 Experiment part
3.1 Factors affecting slurry migration distance
The migration distance of the slurry is influenced by factors such as the rheological properties of the slurry, the injection pressure, and the physical characteristics of the injected medium. Many factors need to be considered. Therefore, the selection of appropriate levels for experimental factors is particularly crucial. Based on the analysis of data from previous coal mine water inrush channel grouting control projects, three critical experimental factors were determined: water cement ratio, aggregate particle size, and injection pressure.
3.1.1 Aggregate particle size
The particle size of aggregates serves as a critical metric for assessing the suitability of slurry types and injectability, particularly when considering parameters such as particle distribution, porosity, and permeability, which are pivotal in determining injectability and calculating the required injection volume. The particle size of aggregates directly governs the porosity of the aggregate assembly, as well as the permeability, subsequently exerting an influence on the seepage of the slurry within the assembly. With an increase in porosity, the particle content per unit area decreases, pore channel width expands, and the contact surface between the slurry and particles diminishes, resulting in a comparatively lower flow resistance during the migration process of the slurry.
3.1.2 Water cement ratio
The rheological properties of slurry are closely associated with the water cement ratio (W/C). The transition from a Newtonian fluid to a Bingham fluid in cement slurry occurs at a critical water cement ratio near 1. When the water cement ratio is greater than 1, the slurry exhibits Newtonian behavior, while when the water cement ratio is less than 1, it behaves as a Bingham fluid. During the grouting process, the water cement ratio is one of the factors that influence the migration efficiency of the slurry. The water cement ratio directly determines the initial viscosity of the slurry, which in turn affects its injectability. As the water cement ratio in cement slurry increases, there is a significant decrease in viscosity, density, sedimentation rate, and compressive strength of the slurry, as well as an increase in initial and final setting times. On the other hand, a lower water cement ratio implies more incredible grouting difficulty, requiring higher injection pressures and faster pressure decay within the fissures.
3.1.3 Injection pressure
The injection pressure is employed to overcome the resistance encountered by the slurry during its penetration or displacement within the sandy soil layers, and the effectiveness of pressure control is pivotal to the success or failure of grouting. Without considering boundary conditions, elevating the injection pressure enables the slurry to evacuate all voids, including air and water, within the aggregate particle interstices, resulting in denser and more consolidated particles. However, when the pressure exceeds the permissible range dictated by boundary conditions, it can lead to deformations and damage to the foundation and structures. The injection pressure serves as the driving force for the slurry to overcome resistance and displace groundwater during the grouting process. To achieve optimal slurry migration, it is imperative to select and appropriately apply the injection pressure judiciously.
3.2 Experimental setup
The experiment utilizes a self-built visual simulation test system for grouting and water blocking in a water inrush channel. This system comprises five main components: the water inrush channel simulation system, grouting control system, water supply system, data acquisition system, and material recovery system. The conceptual diagram of the model is depicted as shown in Figure 4 while the physical representation is illustrated in Figure 5.
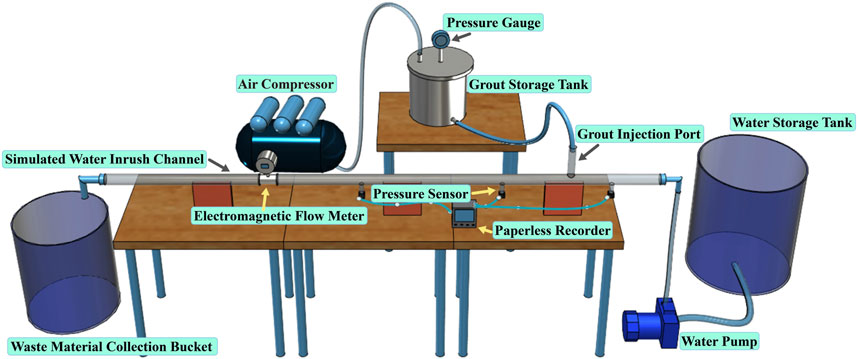
FIGURE 4. Conceptual model of the water inrush channel grouting and water blocking test platform.
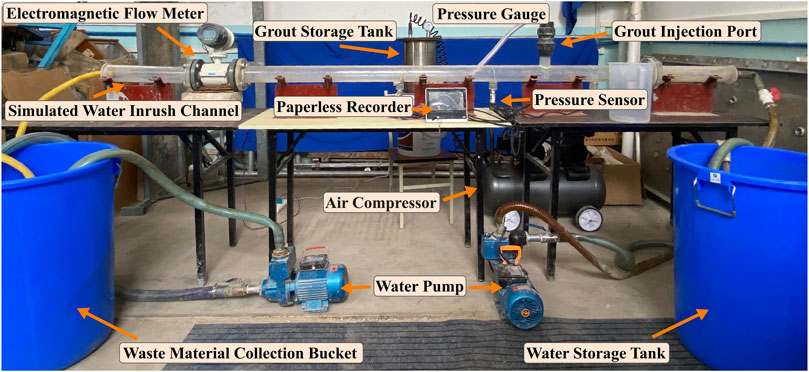
FIGURE 5. The water inrush channel grouting and water blocking test platform.
The design of the test platform aims to simulate real-life conditions closely. It is primarily used to study the interaction processes between cement slurry and aggregate stacking, focusing on technical issues related to grouting pressure, water cement ratio, and aggregate particle size.
3.2.1 Water supply system
The water supply system comprises a water supply tank, a pump, and an inlet pipeline. A 2.0ZDK-20 constant pressure water pump is selected for the water supply pump. A ball valve is installed at the inlet, and after pressurization by the pump, water flows through the water supply pipeline into the water inrush channel, simulating the flow within the channel. Dynamic water flow control is achieved by adjusting the pump pressure and the ball valve.
3.2.2 Water inrush channel simulation system
The water inrush channel simulation system consists of two main components: transparent cylindrical pipes and pipe supports. The transparent pipes are made of acrylic material. The total length of the acrylic pipe is 3.0 m, with an inner diameter of 70.0 mm. To meet the pressure requirements, the pipe wall thickness is designed to be 10.0 mm. A grouting port is located 1.0 m from the inlet for pressure testing. Additionally, there are three pressure-measuring holes with a diameter of 6.0 mm at the pipe’s lower part to measure the pipe’s internal pressure. At both ends of the pipe, flange plates are connected to the inlet and outlet pipes and equipped with control devices. When two flange plates are bolted, they create a joint where a gasket or sealing material can be placed, which helps prevent leaks from the joint.
3.2.3 Grouting control system
The grouting control system consists of a slurry preparation tank, a slurry storage tank, a grouting pipeline, and an air compressor. The prepared slurry is poured into the slurry storage tank, and the slurry is pressurized and conveyed to the aggregate assembly using the pressure generated by the air compressor, thereby achieving the grouting and sealing objectives. The upper part of the slurry storage tank is equipped with a pressure gauge, and the lower part has a ball valve for regulating the slurry discharge. The air compressor is equipped with a pressure-regulating valve, allowing for a stable pressure output of 0–0.8 MPa. The storage tank and air compressor are connected via the delivery pipe, and the physical representation of the slurry storage tank and air compressor is depicted in Figure 6.
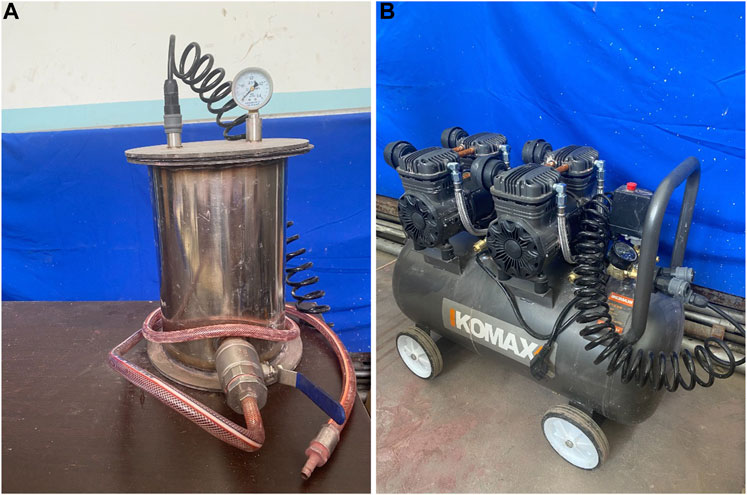
FIGURE 6. Grouting system equipment. (A) Grout storage tank. (B) Air compressor.
3.2.4 Data acquisition system
As shown in Figure 7, the data acquisition system comprises image capture equipment and data acquisition devices. The data acquisition device includes an electromagnetic flowmeter, a pressure sensor, and a paperless recorder. An electromagnetic flowmeter is positioned at a distance of 2.5 m to monitor real-time changes in water flow velocity. Pressure sensors are arranged at distances of 0.75, 1.25, and 1.75 m from the inlet, respectively, and the pressure variations within the channel during the grouting process are exported via the paperless recorder. Specific equipment parameters are detailed in Table 1.
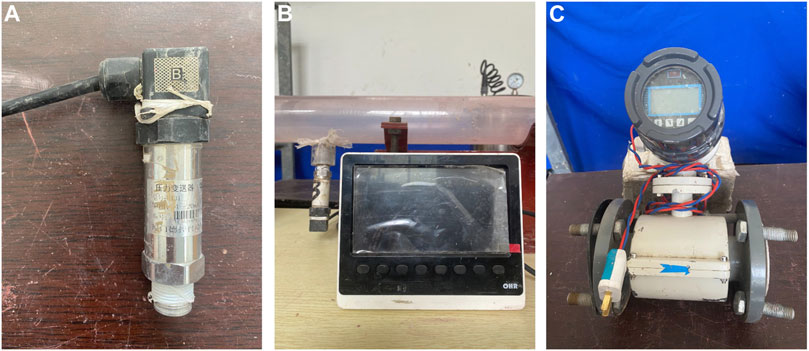
FIGURE 7. Data acquisition system equipment. (A) Pressure sensor. (B) Paperless recorder. (C) Electromagnetic flowmeter.
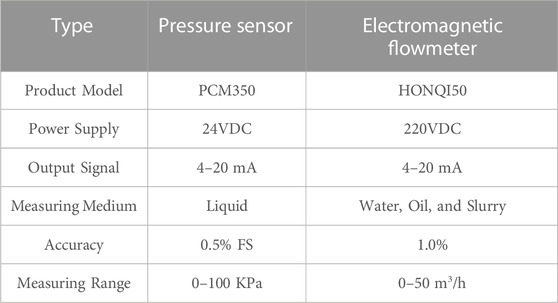
TABLE 1. Parameters of pressure sensor and electromagnetic flow meter.
3.2.5 Material recovery system
The material recycling system includes a drainage pump, a drainage pipeline, and a recovery bucket. The tested aggregates, mixed with cement slurry, flow into the recovery bucket through the water outlet. The aggregates are separated, cleaned, dried, and then screened for reusability. Any other wastewater is discharged through the drainage pump.
3.3 Experimental result
The main parameters involved in the indoor testing include aggregate particle size, water cement ratio, and initial grouting pressure. Among these, aggregate particle size is categorized into four levels: 0–2, 2–5, 5–8, and 8–10 mm. The water cement ratio has five levels: 0.5, 0.8, 1.0, 1.5, and 2.0. The grouting pressure ranges from 0.1 to 0.5 MPa, with intervals of 0.1 MPa as individual levels. This experimental design follows a mixed-level orthogonal design denoted as L25 (41 × 52). The total volume of slurry is kept constant at 2.0 kg, and the entire test duration is 5 min.
Based on the above analysis, slurry migration experiments were conducted, and data for slurry migration distance were obtained. It is evident that the migration distance of slurry within aggregate stacking increases with a higher water cement ratio, larger aggregate particle size, and increased grouting pressure, aligning with actual scenarios. Across various factors and levels, the range of migration distance varies approximately between 30 and 150 cm, as shown in Table 2 below.
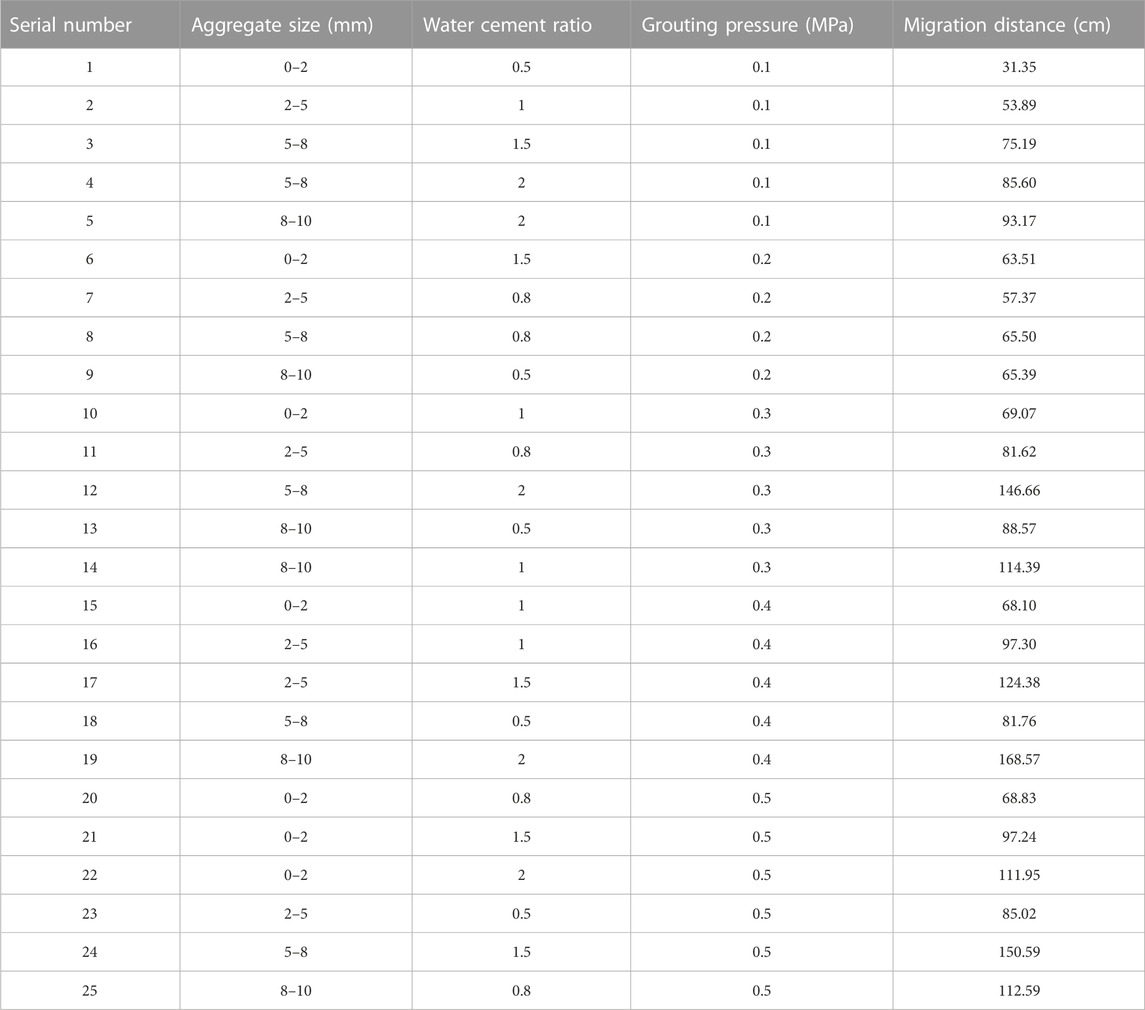
TABLE 2. Data for slurry migration distance.
4 Establishment of slurry migration distance prediction model
4.1 Neural network model parameters
Slurry injection pressure, water cement ratio, and aggregate stacking porosity are selected from the table as input influencing factors for the neural network, with the lateral migration distance of the slurry as the target output data. The data must be normalized to avoid prediction errors in the neural network due to significant differences in the magnitudes of input and output data (Feng et al., 2022; Shan et al., 2022). The data set is normalized to the range [0, 1] using the mapminmax function provided by Matlab.
The normalization formula is as follows:
where Xn represents the normalized sample data; xn represents the actual measured data; xmin and xmax represent the minimum and maximum values of each actual measured data.
Based on slurry migration distance data and prediction requirements, the number of nodes O in the input layer is determined to be 3, and the number of nodes Q in the output layer is 1. The approximate range for the optimal number of nodes P in the hidden layer of the neural network can be determined by Eq. 5 (Satti et al., 2021).
In the formula, O, Q, and P are the input layer nodes, output layer nodes, and hidden layer nodes, respectively, and the value of b is typically between 0 and 10.
Considering the BP neural network’s convergence and generalization capabilities, a trial-and-error approach was utilized to optimize the number of hidden layer nodes. In this study, the hidden layer was configured within the interval [3, 12], and the optimal number of hidden layer nodes was sought within this range. Figure 8 illustrates the training accuracy values of the conventional BP neural network for various numbers of hidden layer nodes. It can be observed from the graph that when 5 hidden layer nodes were selected, the network achieved the highest training accuracy. So, It was determined that when there were 5 nodes in the hidden layer, the best convergence was acquired by the BP neural network.
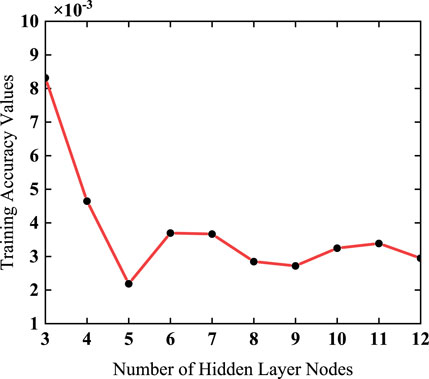
FIGURE 8. Training accuracy with different hidden layer nodes.
Consequently, a topology structure of 3×5×1 was selected for the BP neural network. A single hidden layer was employed in constructing the neural network, with the tansig function being utilized as the activation function for the hidden layer and the purelin function as the activation function for the output layer. The training algorithm was applied, employing the Levenberg-Marquardt gradient descent algorithm via the trainlm function to adjust the weights and thresholds of the BP neural network. The tansig function is defined as shown in Eq. 6. The training process encompassed 10,000 iterations, the learning rate is 0.1, and the target error is 1×10⁻⁶.
The tansig function formula is shown below (Zhang et al., 2022b):
where e is the base of the natural log function.
The optimization of the BP neural network using a genetic algorithm is based on real number encoding, with the Sheffield Genetic Algorithm Toolbox employed for the genetic algorithm. The selection method utilized the roulette wheel selection, the crossover method involved two-point crossover, and the mutation method used Gaussian mutation. Specific parameter settings included a population size N of 30, a genetic generation T of 100, a crossover rate Pc of 0.8, and a mutation rate Pm of 0.2. The GA-BP neural network model was established according to the algorithmic flow of GA optimization for BP neural networks.
Based on the topology structure of the BP neural network, the dimensionality D in PSO is calculated as D= 3×5+5×1+5+1=15+5+6=26. When the population size N is smaller, the algorithm converges quickly, and when it is larger, the algorithm exhibits better optimization capability but slower convergence. Typically, values between 10 and 50 are chosen for the population size; in this case, N is set to 30. The initial weight, w1 and the final weight, w2, are set to 0.9 and 0.4, respectively. The learning factors c1 and c2 are both assigned values of 1.49, and the maximum number of iterations T is set to 100.
4.2 Construction of fitness function
The fitness value is one of the indicators for assessing whether the predictions meet the expected accuracy. The mean square error calculation formula of the BP neural network output is used as the fitness function of PSO and GA algorithm, as shown in Eq. 7 (Deng et al., 2018):
where F represents the fitness value; n represents the number of training samples; yi is the ith actual output value of the network; yi* is the expectation value of the ith.
4.3 Evaluation of performance
To evaluate the performance of the prediction models, four performance metrics were employed, namely, Mean Absolute Error (MAE), Mean Absolute Percentage Error (MAPE), Mean Square Error (MSE), Root Mean Square Error (RMSE), and Coefficient of Determination (R2), were selected to evaluate the prediction accuracy (Zheng et al., 2023). The formula for performance metrics is as follows (Deng et al., 2022; Zhang et al., 2022; Wang et al., 2023):
where n is the total number of data points; i is an integer value ranging from 1 to n; y denotes the experimental value;
5 Results and analysis
5.1 Training process and results
Twenty-five sets of slurry migration distance test data collected in Table 2 were employed as the training and prediction sample set for the neural network model. Due to the extensive computational demands associated with the establishment of a neural network prediction model, Matlab 2020b was utilized, with the Neural Network Toolbox being invoked. Prediction models for slurry migration distance were constructed based on BP, GA-BP, PSO-BP, and GA-PSO-BP neural networks according to predetermined parameters. In order to ensure the prediction capability of the neural network prediction models, the sample data in Table 1 was classified into two categories, one serving as the training sample and the other as the testing sample. There is no fixed number of training and testing samples; generally, the greater the number of training samples, the enhanced the training capability of the network, and correspondingly improved the network’s prediction ability. The number of testing samples should be at least 2 (Han et al., 2013). Thus, the randperm function in Matlab was employed to randomly select 20 sets of samples from the 25 sets of sample data in the table for use as the neural network training set, with the remaining 5 sets of samples being utilized for neural network prediction in order to assess accuracy.
The fitness value change curves for prediction models based on various neural networks are displayed in Figure 9. The GA-PSO-BP model, optimized through the hybrid algorithm, exhibited superior convergence speed and optimal individual fitness values compared to the PSO-BP and GA-BP models. As the number of iterations increased, the fitness value of GA-PSO-BP rapidly decreased from 0.3632 to 0.0561, signifying rapid convergence. The fitness function value obtained by GA-BP was 0.0875, whereas that of PSO-BP was 0.1062. The results of the GA-PSO-BP neural network prediction model closely approximated the expected values, thereby indicating a substantial optimization effect and affirming the effectiveness and feasibility of the neural network prediction model based on the GA-PSO-BP algorithm.
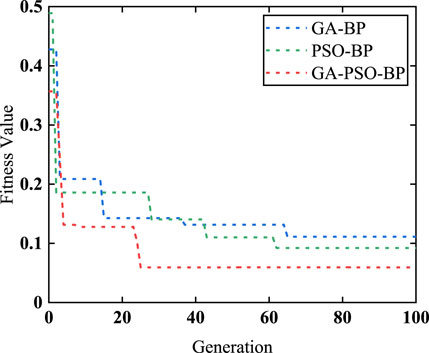
FIGURE 9. Variation curve of the fitness value.
5.2 Performance analysis of prediction results of different algorithms
As can be observed from Figure 10, the slurry migration distance prediction model constructed based on the GA-PSO-BP neural network exhibits superior prediction performance compared to the other three neural network prediction models. Its accuracy is higher, errors are smaller, and predicted values are closer to the measured values.
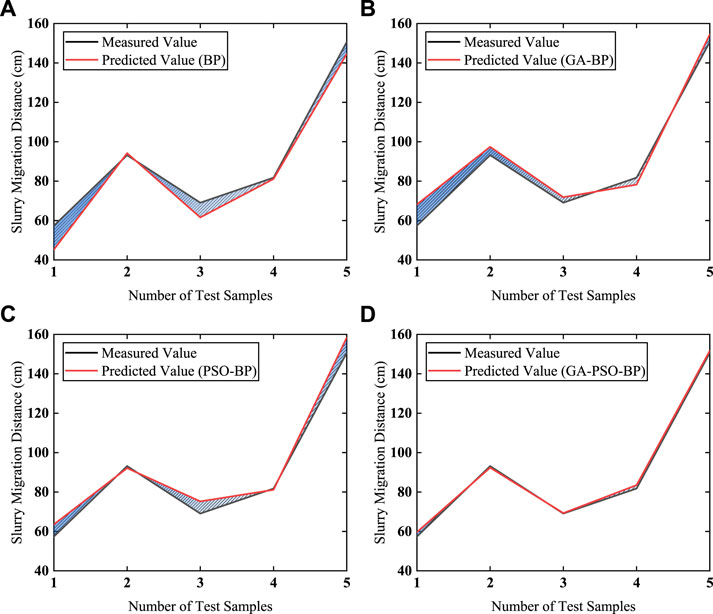
FIGURE 10. Comparison of Different Prediction Models Results Error. (A) BP prediction model. (B) GA-BP prediction model. (C) PSO-BP prediction model. (D) GA-PSO-BP prediction model.
To quantitatively assess the reliability of prediction models based on various neural network algorithms and to validate the accuracy and superiority of the trained GA-PSO-BP prediction model in predicting slurry migration distances, the trained models were used to predict 5 test samples. Subsequently, the predicted results were compared with the measured values. The comparison of prediction results and errors for each model is shown in Table 3. For the four models in our testing, the results of MAE, MAPE, MSE, RMSE, and R2 have been respectively shown in Table 4.
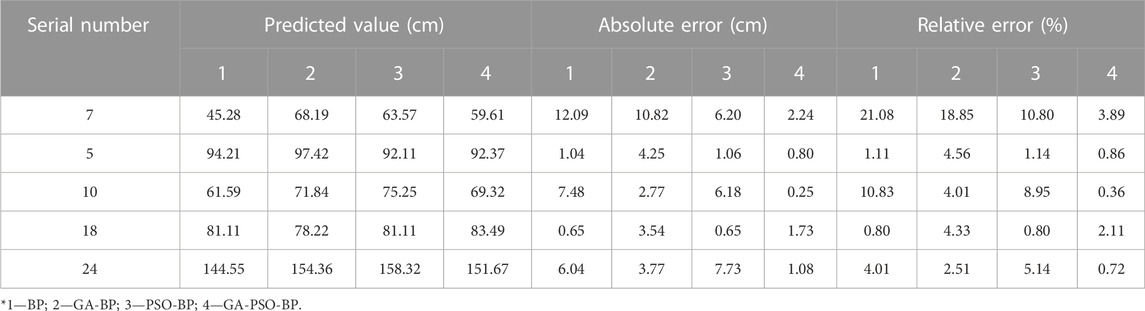
TABLE 3. Comparison of different neural network prediction model calculation results.
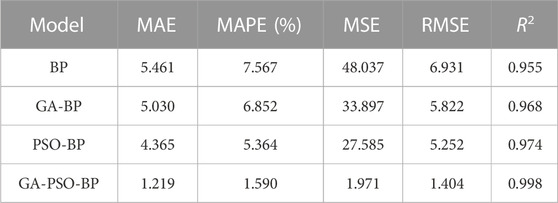
TABLE 4. The performance of the four models.
Based on the comparison of prediction results in Table 3, it can be observed that the maximum absolute error for the BP neural network prediction model is 12.09 cm, and the maximum relative error is 21.08%. For the GA-BP neural network prediction model, the maximum absolute error is 10.82 cm, and the maximum relative error is 18.85%. The PSO-BP model has a maximum absolute error of 6.20 cm, with the maximum relative error reaching 10.80%. In contrast, the GA-PSO-BP model exhibits a maximum absolute error of only 2.24 cm and a maximum relative error of only 3.89%, significantly lower than the other three neural network prediction models, which indicates that the GA-PSO-BP neural network prediction results are closer to the actual measurements compared to the predictions made by the other models. When predicting the migration distance of slurry within aggregate stacking, it is essential to consider its primary influencing factors comprehensively.
It can be concluded from Table 4 that the errors in various performance indicators of the GA-PSO-BP model’s predictions are smaller than those of the other three models. In comparison, both the PSO-BP model and the GA-BP model also exhibit smaller errors compared to the single BP neural network model, which indicates that the GA-PSO-BP model has incorporated the advantages of both the GA and PSO algorithms, optimizing the weights and thresholds of the BP neural network, thereby enhancing its prediction accuracy and reducing prediction errors compared to the other three models.
5.3 Weight analysis for influencing factors
The migration distance of slurry within aggregate stacking is influenced by various factors such as grouting pressure, aggregate porosity, water cement ratio, among others. The weight values can be calculated through the GA-PSO-BP neural network to determine the primary influencing factors. The GA-PSO-BP neural network adjusts the connection weights and thresholds between the input layer and the hidden layer, as well as between the hidden layer and the output layer, to achieve the specified error and end the training. After training, the weight values for the influencing factors on the migration distance of slurry are determined by computing the connection weights. Different weight values reflect the contributions of each factor to the degree of impact. The calculation results of the weight values for various influencing factors on the migration distance of slurry are shown in Table 5. The formula for calculating the weight values of various influencing factors is provided as follows:
where Wi represents the weight of the ith influencing factor, where i ranges from 1 to 3; m denotes the number of influencing factors, with m equal to 3; q represents the number of hidden layer nodes, with q equal to 5 (the optimal number of hidden layer nodes); vj signifies the connection weight between the jth node in the hidden layer and the output layer node; wij is the connection weight between the ith node in the network’s input layer and the jth node in the hidden layer, where j ranges from 1 to 5.

TABLE 5. Weight of factors affecting slurry migration distance.
Table 5 shows that the ranking of weight values for factors affecting slurry migration distance is as follows: grouting pressure > aggregate particle size > water cement ratio. The weight analysis results indicate that grouting pressure and aggregate porosity are the primary controlling factors affecting slurry migration distance, while the water-cement ratio is a secondary factor, which aligns with conventional wisdom and theoretical analysis. The weight value for grouting pressure is the highest, signifying that grouting pressure is the fundamental factor influencing slurry migration distance. Additionally, the weight values reveal that aggregate stacking porosity contributes significantly to slurry migration distance, second only to grouting pressure. Therefore, by appropriately controlling grouting pressure and aggregate stacking porosity, slurry migration distance can be managed effectively, fulfilling the internal voids of the aggregate stacking with slurry.
6 Conclusion and prospect
Three essential parameters influencing the migration distance of slurry in aggregate deposits were identified. Simulated experiments regarding the post-disaster remediation process after water inrush incidents were conducted using a self-designed single-hole grouting test platform. The experimental results were used as a neural network predictive model dataset to forecast the slurry migration distance. Additionally, an investigation into the predictive performance of various models was carried out.
Genetic algorithms possess strong global search capability, while particle swarm optimization algorithms can accelerate the convergence speed of networks. In this study, a combination of genetic algorithms and particle swarm optimization algorithms is employed, with particle swarm optimization algorithms as the primary method, supplemented by embedded genetic algorithms, forming the GA-PSO algorithm. The weight and threshold values obtained through iterative optimization by the GA-PSO algorithm are assigned to the BP neural network. Based on the selected influencing factors of slurry migration distance and sample data, BP neural network models, GA-BP neural network models, PSO-BP neural network models, and GA-PSO-BP neural network models are constructed. Simulated pretests are conducted on 25 sets of experimental data to compare the training error performance and prediction accuracy of the four models, as well as the optimal individual fitness of the four optimized models.
The trained PSO-BP neural network prediction model is used to predict test samples, resulting in an average relative error of only 1.59% compared to actual values. The average relative error for the GA-BP neural network prediction model is 6.85%, for the PSO-BP neural network prediction model is 5.36%, and for the BP neural network prediction model is 7.57%. More accurate prediction results can aid in the precise determination of drilling locations, guiding actual engineering construction, which will be conducive to reducing the wastage of cement slurry, accelerating the progress of water disaster remediation, and mitigating environmental pollution.
While the method proposed in this study achieved favorable prediction results in experiments, the determination of fundamental parameters, such as the fitness function selection in particle swarm optimization, particle swarm size, and acceleration factors, significantly influences the prediction performance of the GA-PSO algorithm optimized BP neural network. Currently, there is no definitive basis for determining these control parameters, and the next step will focus on researching methods for setting parameters to leverage the capabilities of intelligent optimization algorithms fully.
Otherwise, future research will continuously gather and compile datasets from various sources and field studies, encompassing diverse geological settings, multiple types of slurries, diverse application methods, and environmental conditions. A broader and more varied dataset will facilitate the establishment of a more comprehensive model. Additionally, advanced machine learning and statistical techniques capable of handling complex interactions and nonlinear relationships within the data will be explored. Techniques such as ensemble methods, neural networks, and deep learning architectures may be employed to enhance predictive accuracy.
Data availability statement
The original contributions presented in the study are included in the article/Supplementary Material, further inquiries can be directed to the corresponding author.
Author contributions
SY: Conceptualization, Data curation, Formal Analysis, Investigation, Methodology, Software. CL: Writing–original draft. PS: Writing–review and editing, Funding acquisition, Resources. All the authors approved thefinal version of the manuscript.
Funding
The authors declare financial support was received for the research, authorship, and/or publication of this article. This work was supported by the National Natural Science Foundation of China (#51508462), Partial support comes from the National Science Foundation of Shaanxi Province, China (#2018JM5126).
Conflict of interest
The authors declare that the research was conducted in the absence of any commercial or financial relationships that could be construed as a potential conflict of interest.
Publisher’s note
All claims expressed in this article are solely those of the authors and do not necessarily represent those of their affiliated organizations, or those of the publisher, the editors and the reviewers. Any product that may be evaluated in this article, or claim that may be made by its manufacturer, is not guaranteed or endorsed by the publisher.
References
Deng, B., Liu, P., Chin, R. J., Pavitra, K., Jiang, C. B., Xiang, Y. F., et al. (2022). Hybrid metaheuristic machine learning approach for water level prediction: a case study in Dongting Lake. Front. Earth Sci. 10, 928052. doi:10.3389/feart.2022.928052
Deng, L., Feng, B., and Zhang, Y. (2018). An optimization method for multi-objective and multi-factor designing of aceramic slurry: combining orthogonal experimental design with artificial neural networks. Ceram. Int. 44 (13), 15918–15923. doi:10.1016/j.ceramint.2018.06.010
Du, X. M., Fang, H. Y., Liu, K., Li, B., Wang, N. N., Zhang, C., et al. (2023). Experimental and practical investigation of reinforcement mechanism on permeable polymer in loose area of drainage pipeline. Tunn. Undergr. Sp. Tech. 140, 105250. doi:10.1016/j.tust.2023.105250
Feng, G., Zeng, H. H., Xu, X. R., Tang, G. Y., and Wang, Y. X. (2022). Shear wave velocity prediction based on deep neural network and theoretical rock physics modeling. Front. Earth Sci. 10, 1025635. doi:10.3389/feart.2022.1025635
Gao, G. Z., Omid, H., Shadfar, D., Somayeh, T., Meysam, R., Hamzeh, G., et al. (2023). Prediction of fracture density in agas reservoir using robust computational approaches. Front. Earth Sci. 10, 1023578. doi:10.3389/feart.2022.1023578
Guo, H. L., Dai, W. H., Zhang, R. R., Zhang, D. J., Qiao, B. J., Zhang, G. B., et al. (2023). Mineral content estimation for salt lakes on the Tibetan plateau based on the genetic algorithm-based feature selection method using Sentinel-2 imagery: a case study of the Bieruoze Co and Guopu Co lakes. Front. Earth Sci. 11, 1118118. doi:10.3389/feart.2023.1118118
Han, L., Liu, D. S., Li, H. J., and Wang, Y. T. (2013). BP neural network forecast of blasting muck pile form of high bench cast blasting based on Weibull model. J. China Coal Soc. 38 (11), 1947–1952. doi:10.13225/j.cnki.jccs.2013.11.008
Hinton, G. E., Osindero, S., and Teh, Y. W. (2006). A fast learning algorithm for deep belief nets. Neural comput. 18 (7), 1527–1554. doi:10.1162/neco.2006.18.7.1527
Liang, W. H., Wang, G. W., Ning, X. J., Zhang, J. L., Li, Y. J., Jiang, C. H., et al. (2020). Application of BP neural network to the prediction of coal ash melting characteristic temperature. Fuel 260 (11), 116324. doi:10.1016/j.fuel.2019.116324
Liu, K. (2022). Study of diffusion mechanism of permeable polymer in watery sandy stratum. Zhengzhou, China: Zhengzhou University. doi:10.27466/d.cnki.gzzdu.2022.002242
Lv, Y. Y., Liu, W. J., Wang, Z., and Zhang, Z. H. (2020). WSN localization technology based on hybrid GA-PSO-BP algorithm for indoor three-dimensional space. Wirel. Pers. Commun. 114, 167–184. doi:10.1007/s11277-020-07357-4
Ma, C., Zhao, L., Mei, X. S., Shi, H., and Yang, J. (2017). Thermal error compensation of high-speed spindle system based on a modified BP neural network. Int. J. Adv. Manuf. Technol. 89, 3071–3085. doi:10.1007/s00170-016-9254-4
Ma, L. X. (2022). Research on synchronous grouting parameter inversion and surface settlement prediction method for shield construction based on machine learning. Guangzhou, China: Guangzhou University. doi:10.27040/d.cnki.ggzdu.2022.000149
Moazen, H., Molaei, S., Farzinvash, L., and Sabaei, M. (2023). PSO-ELPM: PSO with elite learning, enhanced parameter updating, and exponential mutation operator. Inf. Sci. 628, 70–91. doi:10.1016/j.ins.2023.01.103
Mou, L., Dong, S. N., Zhou, W. F., Wang, W., Li, A., and Shi, Z. Y. (2020). Data analysis and key parameters of typical water hazard control engineering in coal mines of China. Mine Water Environ. 39, 331–344. doi:10.1007/s10230-020-00684-9
Qiao, J. W., Wang, C. J., Su, G., Liang, X. Y., Dong, S. P., Jiang, Y., et al. (2023). Application research on the prediction of tar yield of deep coal seam mining areas based on PSO-BPNN machine learning algorithm. Front. Earth Sci. 11, 1227154. doi:10.3389/feart.2023.1227154
Satti, M. A., Gholam, H. R., Robert, H., and Ehsan, N. (2021). Applicability of time-domain feature extraction methods and artificial intelligence in two-phase flow meters based on gamma-ray absorption technique. Measurement 168, 108474. doi:10.1016/j.measurement.2020.108474
Shan, P. F., Sun, H. G., Lai, X. P., Dai, J. J., Gao, J. M., Yang, P., et al. (2022). Numerical method for predicting and evaluating the stability of section coal pillars in underground longwall mining. Front. Earth Sci. 10, 894118. doi:10.3389/feart.2022.894118
Song, Q. S., Yu, L. Y., Li, S. B., Hanajima, N., Zhang, X. X., and Pu, R. Q. (2023). Energy dispatching based on an improved pso-aco algorithm. Int. J. Intell. Syst. 2023, 1–17. doi:10.1155/2023/3160184
Tan, T. J., Yang, Z., Chang, F., and Zhao, K. (2019). Prediction of the first weighting from the working face roof in a coal mine based on a GA-BP neural network. Appl. Sci. 9 (19), 4159. doi:10.3390/app9194159
Wang, F., Tian, G., Wang, X. F., Liu, Y., Deng, S., Wang, H. M., et al. (2016). Application of genetic algorithm-back propagation for prediction of mercury speciation in combustion flue gas. Clean. Techn Environ. Policy 18, 1211–1218. doi:10.1007/s10098-016-1095-1
Wang, H., Xu, Y. G., Tang, S. H., Wu, L., Cao, W. P., and Huang, X. R. (2023). Well log prediction while drilling using seismic impedance with an improved LSTM artificial neural networks. Front. Earth Sci. 11, 1153619. doi:10.3389/feart.2023.1153619
Wang, L., and Bi, X. H. (2020). Risk assessment of knowledge fusion in an innovation ecosystem based on a GA-BP neural network. Cogn. Syst. Res. 66 (3), 201–210. doi:10.1016/j.cogsys.2020.12.006
Yan, P. C., Shang, S. H., Zhang, C. Y., Yin, N. N., Zhang, X. F., Yang, G. K., et al. (2021). Research on the processing of coal mine water source data by optimizing BP neural network algorithm with sparrow search algorithm. IEEE Access 9, 108718–108730. doi:10.1109/ACCESS.2021.3102020
Yin, S. Y., Jin, M., Lu, H. X., Gong, G. L., Mao, W. Y., Chen, G., et al. (2023). Reinforcement-learning-based parameter adaptation method for particle swarm optimization. Complex Intelligent Syst 9, 5585–5609. doi:10.1007/s40747-023-01012-8
Yu, X. G., Han, J., Shi, L. Q., Wang, Y., and Zhao, Y. P. (2017). Application of a BP neural network in predicting destroyed floor depth caused by underground pressure. Environ. Earth Sci. 76, 535. doi:10.1007/s12665-017-6878-0
Zhang, J. J., Liu, Z. F., Zhang, G. Z., Yan, B., Ni, X. B., and Xie, T. (2022). Simultaneous prediction of multiple physical parameters using gated recurrent neural network: porosity, water saturation, shale content. Front. Earth Sci. 10, 984589. doi:10.3389/feart.2022.984589
Zhang, K. X., Zhu, J. A., He, M. C., Jiang, Y. D., Zhu, C., Li, D., et al. (2022). Research on intelligent comprehensive evaluation of coal seam impact risk based on BP neural network model. Energies 15 (9), 3292. doi:10.3390/en15093292
Zhang, M. C. (2022). Prediction of rock burst hazard based on particle swarm algorithm and neural network. Neural Comput. Applic 34, 2649–2659. doi:10.1007/s00521-021-06057-9
Zheng, H. T., Shi, S. L., Jiang, B. Y., Zheng, Y. N., Li, S. S., and Wang, H. Y. (2023). Research on coal dust wettability identification based on GA-BP model. Int. J. Environ. Res. Public Health. 20 (1), 624. doi:10.3390/ijerph20010624
Zhu, J. Q., Zheng, H. T., Yang, L., Li, S. S., Sun, L. Y., and Geng, J. C. (2023). Evaluation of deep coal and gas outburst based on RS-GA-BP. Nat. Hazards 115, 2531–2551. doi:10.1007/s11069-022-05652-w
Keywords: coal mine safety, water inrush from coal mine, water inrush prevention, slurry diffusion, neural network, prediction model
Citation: Su P, Yang S and Li C (2023) Research on prediction of slurry migration distance in aggregate stacking based on GA-PSO-BPNN algorithm. Front. Earth Sci. 11:1308175. doi: 10.3389/feart.2023.1308175
Received: 06 October 2023; Accepted: 30 November 2023;
Published: 29 December 2023.
Edited by:
Tianshou Ma, Southwest Petroleum University, ChinaReviewed by:
Abdelhamid Ouladmansour, University of Ouargla, AlgeriaXiang He, Anhui University of Science and Technology, China
Copyright © 2023 Su, Yang and Li. This is an open-access article distributed under the terms of the Creative Commons Attribution License (CC BY). The use, distribution or reproduction in other forums is permitted, provided the original author(s) and the copyright owner(s) are credited and that the original publication in this journal is cited, in accordance with accepted academic practice. No use, distribution or reproduction is permitted which does not comply with these terms.
*Correspondence: Shu Yang, MjEyMDQwNTMwMDJAc3R1Lnh1c3QuZWR1LmNu