 J. Alejandro Martinez
 Paola A. Arias
 Francina Dominguez
 Andreas Prein
95% of researchers rate our articles as excellent or good
Learn more about the work of our research integrity team to safeguard the quality of each article we publish.
Find out more
ORIGINAL RESEARCH article
Front. Earth Sci. , 04 January 2024
Sec. Atmospheric Science
Volume 11 - 2023 | https://doi.org/10.3389/feart.2023.1307549
During the night of March 31st, 2017, a severe precipitation event affected the city of Mocoa, in the tropical Andes. Total 24-h accumulated precipitation during that day was the fourth largest on record. Satellite data shows that the event was associated with a Mesoscale Convective System (MCS) that formed over the Amazon and moved westward, reaching the tropical Andes. Reanalysis data suggests that a rapid intensification of the Orinoco Low-Level Jet (OLLJ) traveling southwestward parallel to the Andes was a precursor that favored the zones of convergence for MCS formation. Upstream intensification of the OLLJ was evident 8 h prior to the Mocoa precipitation event. Given the lack of a dense network of observations in this understudied region, we use the Weather Research and Forecasting model (WRF) to explore the plausible mesoscale structures in the OLLJ region associated with the initiation and development of the MCS. We study an ensemble of simulations with different grid spacings (12, 4 and 1.3 km) and Planetary Boundary Layer (PBL) schemes (YSU, MYNN and QNSE). The more realistic MCSs were obtained with the QNSE and YSU schemes, given that the corresponding simulations included a density current in the lowest levels moving parallel to the Andes, with a sharp line of convergence and large vertical velocities over the leading edge of the mesoscale disturbance. In contrast, the MYNN scheme produced a weaker OLLJ and no density current. It is suggested that the stronger vertical mixing in the MYNN scheme was associated with the vertical dilution of the OLLJ, and with a much weaker low-level traveling perturbation via the upward radiation of energy by gravity waves. Our results help to better understand flood-producing extreme events over the poorly studied Andes-Amazon region and provide the groundwork for improved predictability of such storms.
Populations in the tropical Andes suffer the consequences of severe precipitation fueled by the abundance of tropical moisture. The complex terrain can induce the formation or enhancement of precipitating systems, making these regions vulnerable to landslides, flashfloods and debris floods, among other hazards (e.g., Castellanos et al., 2022). Despite their societal impact, the understanding and prediction of atmospheric systems leading to heavy precipitation in the Andes is still a grand challenge (Poveda et al., 2020). On the one hand, there is a lack of a sufficiently dense network of long-term and consistent surface observations over the region (Condom et al., 2020), not to mention the remarkable scarcity of vertical soundings of atmospheric conditions over and upstream of the Andes (Poveda et al., 2020). In addition, numerical modeling of atmospheric systems leading to convection and heavy precipitation over the complex terrain of the Andes requires higher spatial resolution (i.e., smaller grid spacing). Models using parameterized convection and grid spacing of 10s of kilometers typically exhibit large positive biases over the peaks of the (model resolved) cordillera (see e.g., Martinez et al., 2019; Posada-Marin et al., 2019; Arias et al., 2020). Thus, a more comprehensive identification and characterization of the atmospheric systems (e.g., mesoscale and mountain circulations) affecting the tropical Andes, and in particular those associated with severe weather and hydrometeorological extremes, is still needed (Poveda et al., 2020; Arias et al., 2021).
Mesoscale Convective Systems (MCSs) can affect regions in the vicinity of the Andes, with a frequency that depends on the region (e.g., latitude) and season (e.g., Velasco and Fritsch, 1987; Zipser et al., 2006; Romatschke and Houze, 2010; Houze et al., 2015). The largest and most intense MCSs associated with effects of the Andes take place over Argentina (Zipser et al., 2006; Salio et al., 2007). However, MCSs can also develop in lowlands near the tropical Andes, affecting foothill regions (see e.g., Zuluaga and Houze, 2015; Jaramillo et al., 2017; Hernandez-Deckers, 2022). Important mechanisms that support the development of MCSs are low-level jets (LLJs), that facilitate the transport of atmospheric moisture and provide a mechanism for low-level horizontal convergence, favoring the occurrence of precipitation in regions downwind (Stensrud, 1996; Vernekar et al., 2003; Gimeno et al., 2016). In the case of tropical South America, nocturnal LLJs (NLLJs) over the Amazon can favor the formation of MCSs (e.g., Anselmo et al., 2020). NLLJs can take place over parts of the central Amazon during both the dry and wet season, with a nocturnal maximum that can be 7 m s−1 stronger than daytime conditions between 300 and 1,000 m, and remain strong several hours after sunrise (Greco et al., 1992). Intense LLJs over the northeast of the Amazon are associated with squall lines propagating over the northeastern and central Amazon, with up to 87% of these convective systems linked to LLJs (Alcântara et al., 2011).
The Orinoco basin in northern South America also exhibits a LLJ (hereafter OLLJ), which is mostly a nocturnal low-level jet (Torrealba and Amador, 2010; Jiménez-Sánchez et al., 2019). NLLJs over the Orinoco basin can contribute to precipitation downwind over parts of the Andes-Amazon transition region (Braz et al., 2021). Variations (from diurnal to inter-annual) in the OLLJ have been linked to periods of enhanced precipitation over the eastern flank of the northern Andes (Jones, 2019; Builes-Jaramilo et al., 2022a; Builes-Jaramilo et al., 2022b). In general, the cross-equatorial moisture transport associated with the flow in the OLLJ region (approximately between 11°N and 3°S over the Orinoco basin, east of the Andes) has been linked to precipitation hotspots over parts of the eastern flanks of the tropical Andes (Espinoza et al., 2015; Chavez and Takahashi, 2017). Despite its importance, the role of OLLJ in the formation and characteristics of convective systems has been less studied than the role of Amazonian LLJs. However, the OLLJ takes place over a region with important differences with respect to the Amazon, including large gradients in land cover and surface fluxes between the north and south of the basin, and the effects of the Andes to the west (Martinez et al., 2022; Correa et al., 2024).
A proper characterization of heavy precipitation events over parts of the tropical Andes requires in situ sub-daily observations, which are very scarce (Condom et al., 2020). In fact, the sixth assessment report of the Intergovernmental Panel on Climate Change could not assess whether the frequency and intensity of heavy precipitation events have been increasing during the past decades over northwestern and northern South America due to limited evidence, strongly linked to the scarce observational network and scientific research in these regions (see Figure SPM.3b in IPCC, 2021; Seneviratne et al., 2021). Observations of the vertical structure and variations of the OLLJ upstream of the Andes are even more scarce, being mostly restricted to short time-windows associated with intensive observation periods (e.g., Torrealba and Amador, 2010).
In this context, atmospheric modeling is currently the best option for exploring mesoscale structures like the OLLJ (e.g., Jiménez-Sánchez et al., 2020), and the potential interactions leading to precipitation in the vicinity of the tropical Andes. In general, convection-permitting (CP) simulations (i.e., with kilometer-scale grid spacing) are needed to resolve the major convective elements that lead to precipitation, avoiding some of the problems associated with parameterized convection, like biases in the phase of the diurnal cycle and a lack of the convective organization that characterizes major precipitating systems (see e.g., Prein et al., 2015; Lucas-Picher et al., 2021; Prein et al., 2021). The presence of complex terrain is another motivation for CP simulations (e.g., Pal et al., 2019; Risanto et al., 2019). Because of the intricate distribution of hills, mountains and valleys in the tropical Andes, with sizes from a few 100’s of meters up to several kilometers, kilometer-scale atmospheric modeling is needed to resolve both the major convective elements and important mesoscale structures associated with mountain circulations (see e.g., Lopez and Howell, 1967; Mapes et al., 2003; Trachte et al., 2010; Trachte and Bendix, 2012; Junquas et al., 2018; Hoyos et al., 2019; Henao et al., 2020; Yepes et al., 2020; Junquas et al., 2022; Gomez-Rios et al., 2023). In particular, convective systems can form on the parts of the tropical Andean foothills favored by the interaction of katabatic flows from the Andes and easterly flow of moist air masses from the Amazon (Bendix et al., 2009).
Several processes still have to be parameterized in kilometer-scale simulations, including the sub-grid tendencies of momentum, energy, mass and other scalars associated with turbulent processes in the Planetary Boundary Layer (PBL). Different classes of PBL schemes exist, including local (of various orders) and non-local closures, schemes with eddy-diffusivity and/or mass-flux components, etc. This variety of schemes is related to the uncertainty in modeling turbulent processes in the PBL, and may result in substantially different realizations of wind, temperature and humidity distribution in the boundary layer (e.g., Stull, 1988; Wyngaard, 2010), along with impacts on the simulation of convection and precipitating systems (Moya-Alvarez et al., 2020; Prein et al., 2022). For example, Prein et al. (2022) found that the Mellor-Yamada-Nino-Nakahashi (MYNN) PBL scheme generally produces less organized convective systems in the Amazon. Also, the vertical structure of LLJs can be sensitive to the PBL scheme (e.g., Santos and Nascimento, 2016; Smith et al., 2018; Rivera et al., 2022). In the case of the Andes-Amazon transition region, Martinez et al. (2022) found that, compared to the Yonsei University (YSU) scheme, MYNN produces a less pronounced OLLJ, a weaker transport of moisture on the flanks of the tropical Andes, and a stronger transport over the Amazon. In contrast, these authors found that the Quasi-Normal Scale-Elimination (QNSE) scheme produces a stronger OLLJ and an overall larger cross-equatorial transport of moisture, compared to YSU.
The Andes-Amazon region is home to several cities, towns and other settlements, which oftentimes are exposed to the severe weather of the region. One of such cities in the tropical Andes is Mocoa, located over southwestern Colombia. In the night of March 31st of 2017 a severe event of debris flow caused the death of nearly 330 people, and injuries to more than 400 people (see e.g., Poveda et al. 2020). The debris flow was associated with large accumulated precipitation from previous days, and the occurrence of a Mesoscale Convective System (MCS) on the night of March 31st. Unfortunately, the city of Mocoa, as many in the region, has been built and expanded without a structured urbanization plan. Different studies from local researchers and environmental agencies already warned about the hazards (like high flooding) to which the different settlements and neighborhoods in the city were exposed. In addition, by the time of the March 31st event, Mocoa did not have an Early Warning System (EWS). In recent years the government of Colombia has taken some steps towards reducing the vulnerability of the city of Mocoa (which now has an EWS), but critical issues remain, like the lack of more infrastructure and a more thorough characterization of the hydrometeorological hazards affecting the region.
We present a case study of an MCS reaching the tropical Andes of Colombia, which affected the city of Mocoa during the night of March 31st, 2017 (hereafter the Mocoa event) This MCS formed over the Amazon, downstream of the OLLJ, before moving towards the Andes. First, we present a description of the Mocoa event according to the available in situ records of precipitation, in addition to precipitation estimates from satellite and wind fields from reanalysis data. Since there is no in situ information about surface winds or the structure of the OLLJ (e.g., no radiosonde data was available), we then study the mesoscale structures in the vicinity of the OLLJ and the Andes associated with the Mocoa event, using kilometer-scale CP simulations. The plausibility of the identified flow structures is assessed according to the simulated cloud and precipitation patterns, which in turn can be readily compared with satellite information. We present a detailed analysis of the results derived from an ensemble of simulations with different spatial resolutions and PBL schemes. We describe mesoscale structures identified in fields of low-level winds, virtual potential temperature, water vapor content and static stability. This detailed account aims at providing a process-based analysis of the kind of precursor mesoscale structures associated with heavy precipitation over the Andes-Amazon transition region. The study of individual events provides a clearer picture of the flow structures of interest, including the strong gradients inherent to their dynamics, which can be lost when averaging/compositing many cases (see e.g., Smith et al., 1986). The combination of remote sensing observations and CP modeling is an important alternative in regions of scarce observations where the effects of extreme events associated with mesoscale processes can impact vulnerable populations.
In the first part of this study, we present diagnostics of the precipitation, winds and atmospheric moisture conditions of the Mocoa event. We focus on the OLLJ and the transport of moisture prior and during the time of maximum precipitation over a region around the city of Mocoa (including time series of point observations and spatial averages over a region of 2° × 2°). We utilize data from different sources, including weather stations, satellite estimates and reanalysis. We then employ model simulations to examine the transport of moisture associated with the OLLJ, and to describe the potential mesoscale structures associated with the formation of the simulated MCS.
We utilize in situ records of precipitation from the national meteorological and hydrological service of Colombia, IDEAM. Hourly data was available from six nearby weather stations for dates in and around the Mocoa event (see Figure 1D for location of sites). In addition, 63 nearby stations (Figure 2A) had records of 24-h accumulated precipitation, representing the time window from 7 am LT to 7 am LT of the following day. Satellite estimates of precipitation were obtained from the IMERG product (V06) from the Global Precipitation Measurement Mission (GPM) database (Huffman et al., 2019). To obtain daily accumulations, the half-hourly (at 0.1° spatial resolution) estimates were aggregated between 12:00 and 12:00 UTC of the following day, corresponding to the same time window for the daily precipitation estimates from IDEAM. Brightness Temperature (BT) estimates were obtained from the NOAA/NCEP MERGIR, which provides fields with a time frequency of 30 min on a 4 km × 4 km grid between 60°S and 60°N (Janowiak et al., 2017).
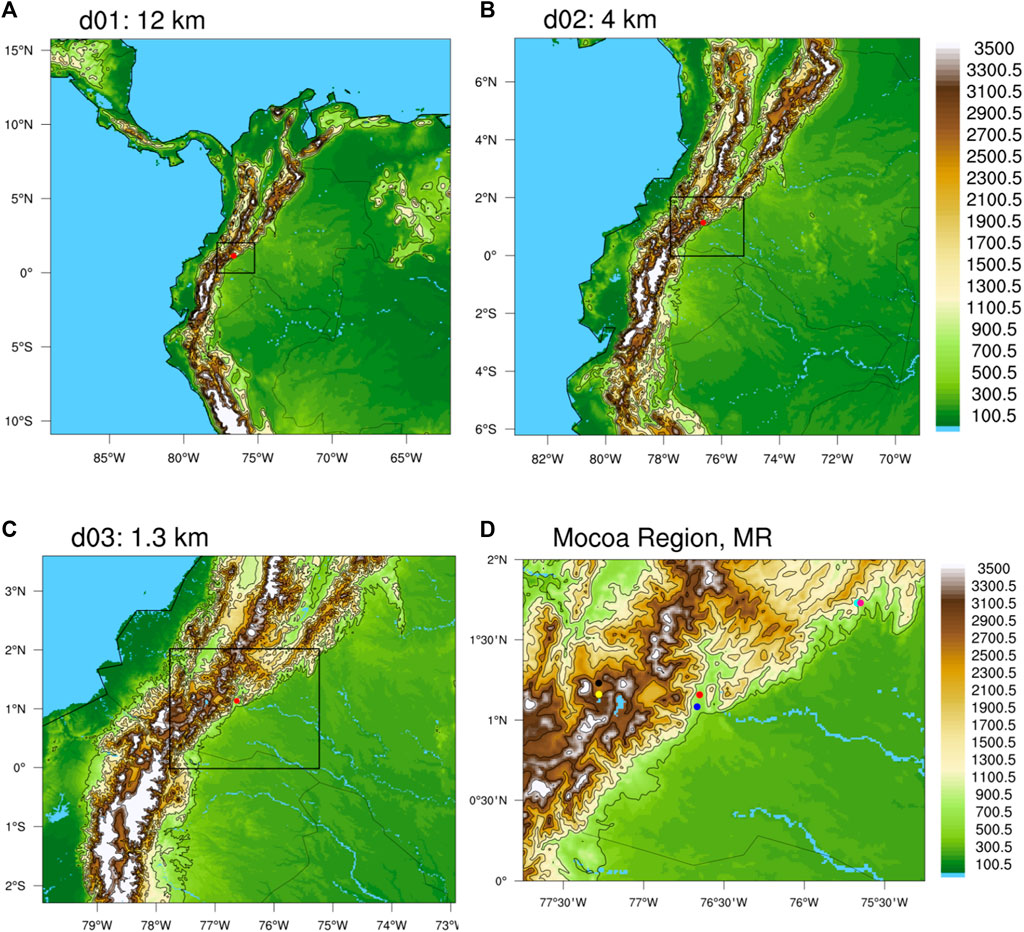
FIGURE 1. Region of study and domains for WRF simulations. Panel “(D)” shows the “Mocoa Region” [represented by the black rectangle in panels (A–C)], and the locations of weather stations with hourly data during the event (Acueducto Mocoa: red; El Pepino: blue; El Rosario: cyan; Florencia: pink; U.Nariño: black; Botana: yellow).
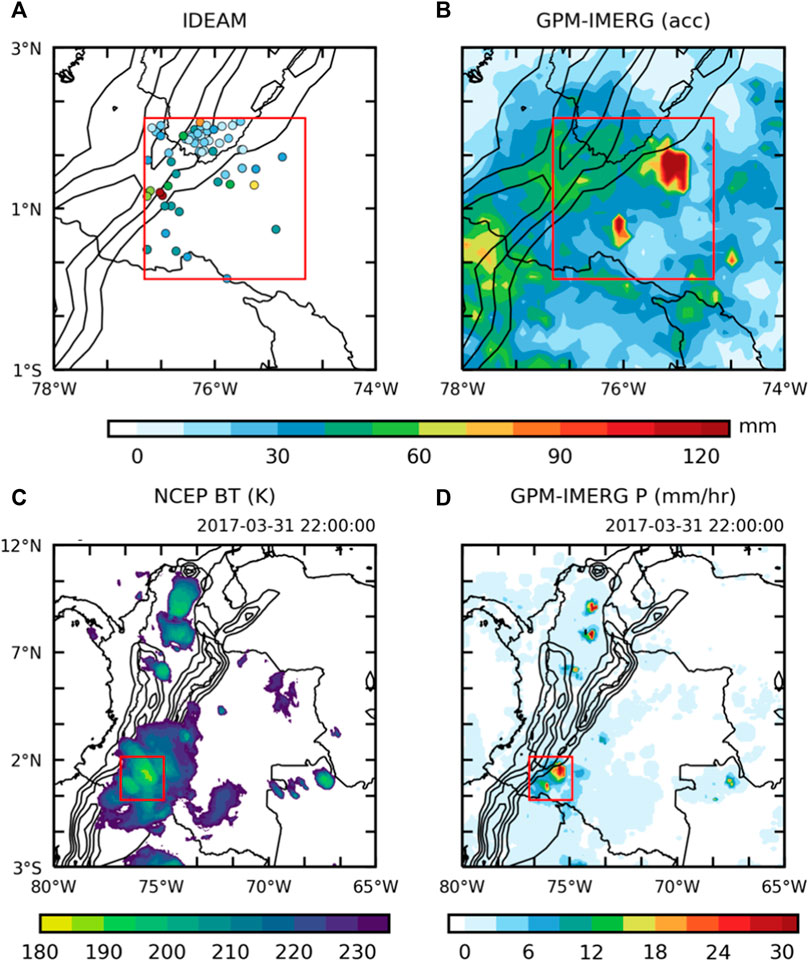
FIGURE 2. 24-h accumulated precipitation according to (A) weather stations, and (B) GPM-IMERG. Instantaneous brightness temperature (C) and 30-min accumulated precipitation at 22:00 LT (D).
Finally, wind and moisture fields from the 5th generation atmospheric reanalysis from the European Center for Medium Range Forecasts, ERA5 (Hersbach et al., 2020) were employed for characterizing several instantaneous and anomalous fields, including Total Column Water Vapour (TCWV, also called precipitable water (PW) in this text), low-level horizontal winds between 950 and 825 hPa (available every 25 hPa), and specific humidity at 850, 700 and 500 hPa. Despite the availability of a continuous record of atmospheric variables from reanalyses, these datasets exhibit some limitations, including biases and a relatively coarse resolution. For example, ERA-Interim has biases in near surface and PBL variables over parts of tropical South America (e.g., Betts et al., 2009; Itterly et al., 2018). ERA5 represents an improvement over ERA-Interim (e.g., Hersbach et al., 2020), but it still has biases in its representation of some structures and features of the lower atmosphere, e.g., the magnitude and diurnal cycle of PBL height (Dias-Júnior et al., 2022). Therefore, our analysis of ERA5 fields is focused on spatial structures and temporal changes in the synoptic and sub-synoptic scales, and mostly above the atmospheric boundary layer.
We utilize version 4.1.5 of the Weather Research and Forecasting model (Skamarock and Klemp, 2008; Skamarock et al., 2019; WRF, 2023) as our tool to explore two modeling aspects that could affect the simulation of the OLLJ, the associated transport/convergence of moisture, and the ensuing MCS under the atmospheric conditions of the Mocoa event. We focus on the PBL scheme and the grid size. The design of our simulations is similar to the one of the “weather-like” experiments of the Flagship Pilot Studies (FPS) from CORDEX (see e.g., Coppola et al., 2020; Bettolli et al., 2021). Each simulation is initialized 24 h prior to the peak of the real event, and runs for 48 h. Data from the ERA5 reanalysis is employed for the initial and boundary conditions (once per hour). In this study, we do not perform any type of data assimilation (DA) to improve the initial condition of our simulations, since our focus is more on the qualitative properties of the structures and mechanisms associated with the role of the OLLJ, topography, resolution and the parameterization of PBL processes on the formation and evolution of the MCSs of interest.
The PBL scheme affects the simulation of systems and structures in the lower atmosphere, like low-level jets (Smith et al., 2018), and convective modes (Prein et al., 2022). Following Martinez et al. (2022), we test three PBL schemes: YSU, MYNN and QNSE. The YSU is a non-local PBL scheme (Hong et al., 2006), where fluxes associated with non-local gradients are represented by counter-gradient terms. The MYNN is a Turbulence-Kinetic-Energy (TKE) based scheme. Here, we utilize the 2.5-level scheme, which includes TKE as a prognostic variable that can be advected. The QNSE PBL scheme was originally developed for stably stratified boundary layers (Sukoriansky et al., 2006) but within WRF, it includes an eddy-diffusivity/mass-flux scheme for non-local thermals in the unstable boundary layer (Pergaud et al., 2009). For each scheme, we utilize the same configurations as in Martinez et al., (2022).
In addition, we perform simulations with different horizontal grid sizes: 12, 4 and 4/3 km (hereafter, 1.3 km). The 4 and 1.3 km experiments are convection-permitting (CP) simulations, and no cumulus (deep or shallow) parameterization was activated. For the 12 km simulations, we employ the “New Tiedtke” cumulus convection parameterization available in WRF, which is part of the “tropical suite” suggested in the user’s guide, and has been used successfully in tropical settings (e.g., Zhang and Wang, 2017), including tropical South America (e.g., Urrego-Ortiz et al., 2019; Martinez et al., 2022; Ruiz et al., 2022). Two-way nesting was utilized for the domains shown in Figure 1. With this configuration, the solution from the finer inner-domain grid is allowed to feed back into the outer domain and its coarser grid, and the scaled version of the fields of the finer grid (e.g., d02) replace the solution of the coarser grid (e.g., d01) in the common area between grids (Skamarock et al., 2019). Therefore, separate simulations were performed for each domain of interest, and the results of the innermost domain were employed for analysis. For example, when interested in the 4 km grid, the simulations included both domains, d01 and d02, but only results from d02 were studied.
All simulations employed 50 vertical levels, with a top at 20 hPa, the Morrison two-moment microphysics scheme (Morrison et al., 2008), the Noah land surface model (Chen and Dudhia, 2001) and the Rapid Radiative Transfer Model for General circulation models (RRTMG) scheme (Iacono et al., 2008). In general, these modeling options have shown good performance in previous studies over tropical South America (e.g., Oglesby et al., 2016; Junquas et al., 2018; Moya-Alvarez et al., 2018; Jimenez-Sanchez et al., 2019; Martinez et al., 2019; Posada-Marin et al., 2019; Urrego-Ortiz et al., 2019; Jimenez-Sanchez et al., 2020; Moya-Alvarez et al., 2020; Junquas et al., 2022; Martinez et al., 2022; Ruiz et al., 2022). The combination of the selected grid sizes and PBL schemes leads to 9 simulations, which are summarized in Table 1.
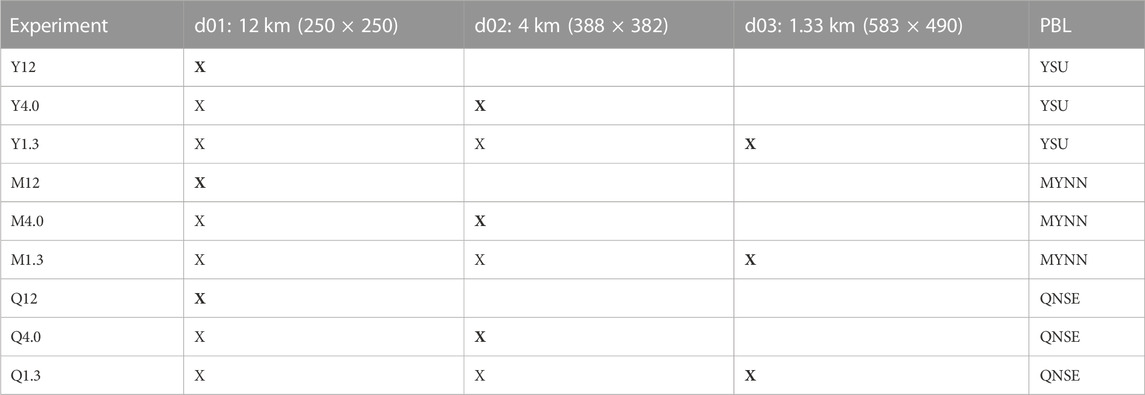
TABLE 1. Configuration of the 9 simulations performed. Only the innermost domain was used for analysis (X). Values in parenthesis are the number of grid cells for each domain in each horizontal direction.
During the night of March 31st and early morning of April 1st of 2017, an MCS formed over the Colombian Amazon, and moved west towards the Andes (Figure 2). The network of weather stations recording daily accumulations of precipitation (from 7 a.m. LT on March 31st to 7 a.m. LT on April 1st) in the vicinity of the affected region is shown in Figure 2A. Most of the stations are located in the mountain regions, where most of the people live. The red dots in Figure 2A show the accumulated precipitation in the vicinity of Mocoa, namely, the “Acueducto-Mocoa” and “Campucana” stations, which recorded 129.3 and 140.3 mm, respectively; these records are the fourth largest daily accumulations for both stations during the period 1984–2022 (see Supplementary Figure S1). Other weather stations recorded accumulations between 50 and 90 mm, including one in the lowlands, while a significant fraction of the stations reported more than 30 mm. Satellite estimates from the GPM IMERG product exhibit values of up to 40–70 mm over the mountains, with maximum values of 80 mm over the Ecuadorian Andes (Figure 2B). However, the largest values according to IMERG were recorded over the Amazonian lowlands to the east, with some estimates well above 120 mm. The MCS was well organized by the time it reached the Andes, around 22:00 LT, as shown by the BT from the NCEP MERGIR product (Figure 2C). During the event, strong mid-tropospheric easterlies steered the storm towards the mountains (as suggested by 500 hPa winds from ERA5, not shown). Once in the vicinity of the Andes, the MCS intensified, as suggested by the sequence of images of BT and by the half-hourly estimates of precipitation from GPM-IMERG (Figure 2D).
In addition to the limitation of station network density over the lowlands, as suggested by Figure 2, there is also a lack of weather stations recording sub-daily in situ information. This is illustrated in Figure 1D, which shows that only six weather stations recorded hourly precipitation during the dates of the event. For most locations, rain rates from observations (IDEAM) were larger than GPM estimates, with peak values between 22:00 and 00:00 LT (Supplementary Figure S2). Considering the non-zero values of precipitation records from the available weather stations, hereafter we define the interval between 19:00 LT of March 31st to 03:00 of April 1st as the time window of the precipitation event (vertical red lines in Figure 3; Supplementary Figures S2, S3). In general, the severe precipitation event can be identified in the GPM data, although accumulated precipitation is overestimated compared to several of the available stations. This overestimation comes mostly from longer intervals of precipitation in the GPM records, compared with the in situ measurements. Note that GPM estimates (e.g., the IMERG product) have well-known deficiencies in estimating heavy precipitation (often smearing out the peak over larger regions), particularly over mountain regions. This kind of problem has been recognized for the Colombian Andes in the data from the Tropical Rainfall Measuring Mission (e.g., Vallejo-Bernal et al., 2021).
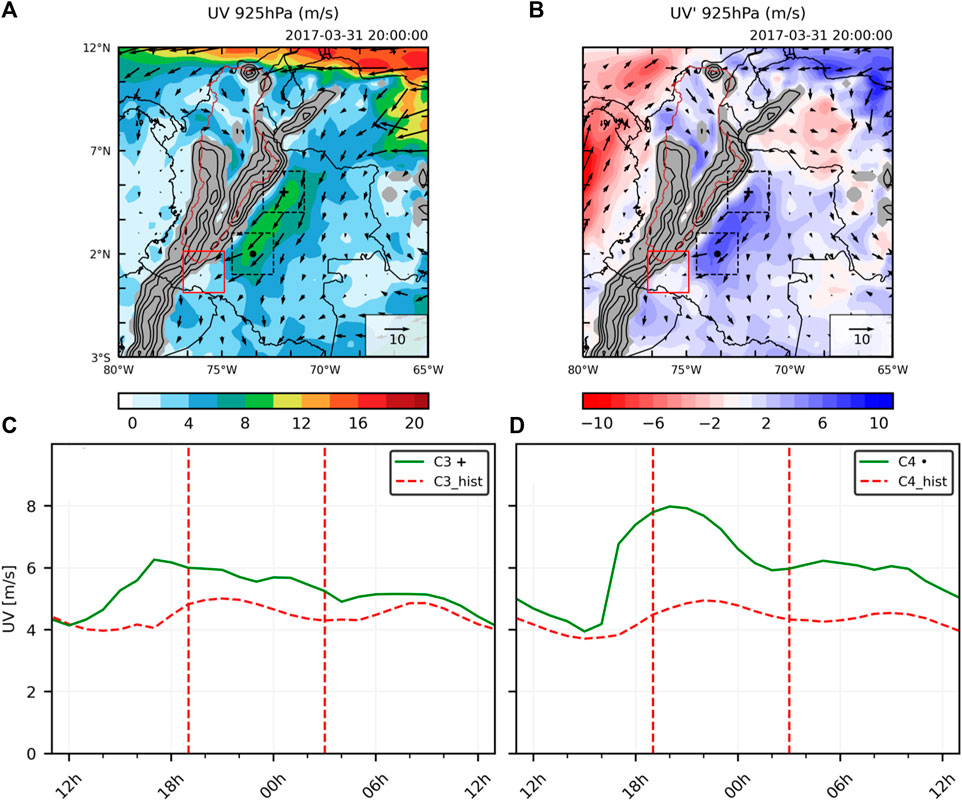
FIGURE 3. Wind field at 925 hPa and its magnitude (A) and their corresponding anomalies (B) at 22:00 LT. Time series of the C3 and C4 OLLJ indices (C) and (D), respectively); the green lines represent the values during the event and the red curves represent their climatological mean (base period 1979–2019). The C3 and C4 indices are computed as spatial averages of low-level winds in the box with the cross and the dot in Figure 3A, respectively.
According to ERA5, large values of precipitable water (PW) were present over the Andes-Amazon transition region, where the MCS formed (Supplementary Figures S3A, B). The time series of the spatial average of PW over the Mocoa Event Region (MER; red box in Supplementary Figures S3A, B) shows a peak between 23:00 LT and 00:00 LT (Supplementary Figure S3C), 1 hour before the peak precipitation in the Mocoa station (Supplementary Figure S2A). Interestingly, the PW exhibited a sharp increase starting around 17:00 LT, i.e., approximately 5 h prior to the onset of precipitation (at around 22:00 LT) in most of the weather stations in the region (Supplementary Figure S2). Moisture anomalies in the mid and lower troposphere were positive prior and during the event, as suggested by the spatial average (over MER) of specific humidity at 850, 700 and 500 hPa (Supplementary Figure S3D). Thus, low-level moisture and winds were associated with an increase in the convergence of moisture and precipitable water over the area of interest, with a time scale of up to 5 h between the onset of positive anomalies in moisture and the occurrence of the precipitation maxima.
Of particular interest is the behavior of the OLLJ, upstream from the MER and from the area where the MCS formed. Strong northeasterly winds at 925 hPa were present over the Colombian Orinoco and northern Amazon, east of the Andes, several hours prior to the onset of precipitation over the MER, as illustrated in Figure 3A for conditions at 20:00 LT. These northeasterly winds over the eastern flank of the Andes were anomalously strong (Figure 3B), and contributed to areas of convergence in the Andes-Amazon region over southern Colombia, including the MER. The time evolution of the low-level winds in the region can be better shown with the C3 and C4 indices, which are computed from spatial averages of the horizontal winds at pressure levels between 950 and 825 hPa over the regions C3 (73°W-71°W, 4°N-6°N) and C4 (74.5°W-72.5°W, 1°N-3°N) (see Jiménez-Sánchez et al., 2019). The time series of the C3 and C4 indices show that the winds associated with the OLLJ were stronger than average during and around the times of the precipitation event (Figures 3C, D). Upstream conditions in C3 exhibited a peak around 17:00 LT (∼5 h prior to the onset of precipitation in MER), with values larger than average by 14:00 LT, i.e., up to 8 h before the occurrence of precipitation in Mocoa. Closer to the MER, conditions in C4 show an even more pronounced increase between 16:00 and 17:00 LT, reaching a maximum at around 20:00 LT (see also Figures 3A, B). The differences in the timing of the peaks, with C3 exhibiting a maximum before C4, are associated with a disturbance in the low-level wind fields, traveling southwestward parallel to the Andes. These characteristics suggest a strong OLLJ and an associated propagating disturbance as part of the antecedent conditions that served as precursors to the formation of the MCS, with time scales between 8 and 5 h in the upstream anomalies prior to the precipitation event over Mocoa.
To better understand the relationship between the OLLJ and precipitation in the Mocoa event, we look at daily data of precipitation from two weather stations and two indices of the OLLJ for a time window around the date of the event (Figure 4). In this case, we compute spatial averages of horizontal winds upstream of Mocoa over a wider region, compared to C3, encompassing the Orinoco basin (Figure 3). To this end, we utilize the magnitude of the vector obtained by averaging the daily mean of the horizontal wind over the region (3°N-5°N, 73°W-67°W), and over the vertical levels between 950 and 825 hPa; we refer to the result as the C3.4 index (Figure 4C). In addition, we look at the day-to-day changes in the C3.4 index by computing the difference in C3.4 between consecutive days; we refer to this difference as ΔC3.4 (Figure 4D). Daily data of accumulated precipitation from stations “Acueducto-Mocoa” and “Campucana” (both in the vicinity of Mocoa, Figure 1D) are available for a period between 1984 and 2022 (Figures 4A, B). The C3.4 and ΔC3.4 indices were computed for the period 1979–2019. Over the two weather stations precipitation during the event was above 120 mm, in both cases far exceeding the 99th percentile, and actually corresponding to the fourth-largest values on these records (Supplementary Figure S1). On the other hand, during the day of the event, the C3.4 index was above its 63th percentile (Figure 4C) while the ΔC3.4 index was above its 93th percentile (Figure 4D). Thus, while the OLLJ was above average conditions during the day of the event, a major increase in its strength was experienced during that day; both conditions were associated with favorable conditions for the formation of areas of strong low-level convergence. Interestingly, note that before and after the day of the event, either C3.4 or ΔC3.4 had relatively large values, but not at the same time, and not very strong precipitation was recorded in the vicinity of Mocoa.
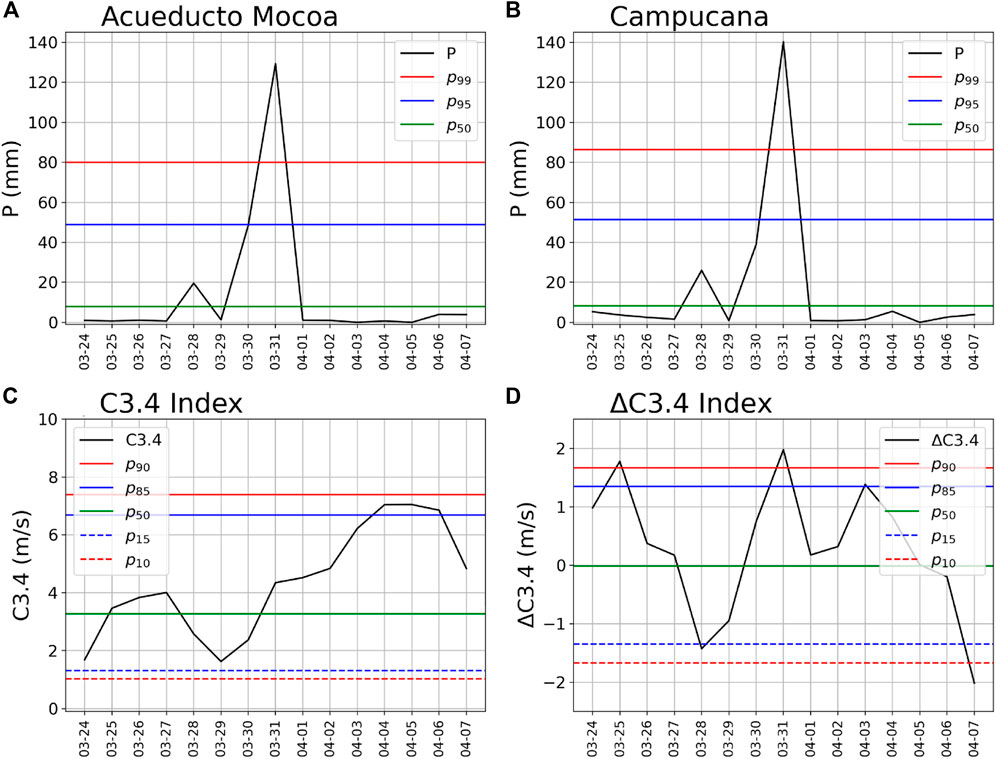
FIGURE 4. Time series of daily values of accumulated precipitation over the (A) “Acueducto-Mocoa” and (B) “Campucana” weather stations in the vicinity of Mocoa; and daily values of the (C) C3.4 and (D) ΔC3.4 indices (see text for definitions). The legends show the percentiles for precipitation (C3.4 and ΔC3.4) with respect to the base period 1984–2022 (1979–2019).
In summary, the combination of in situ observations, satellite estimates and reanalysis data shows that the precipitation event over Mocoa was associated with an MCS that formed over the Amazon, preceded by a strengthening of the OLLJ with a traveling disturbance, which provided favorable conditions for the convergence of mass and moisture over the Andes-Amazon transition region in Colombia. Over each weather station, the duration of the event was on the order of 4 h, with the MCS having a longer time span while it traveled from the Amazon toward and over the Andes. While moisture anomalies in the MER started showing signs of increase nearly 5 h prior to the maximum precipitation, OLLJ conditions upstream exhibited a clear strengthening up to 8 h prior to the onset of heavy precipitation.
Given that our simulations did not employ any type of data assimilation, and that they are initialized with ERA5 fields for March 31st at 00:00 LT (i.e., almost 24 h prior to the peak precipitation in Mocoa), the simulated precipitation events did not occur at the exact same hour and place as in the observations. While the time window of the real event in the MER was between 19:00 and 03:00 LT (Supplementary Figure S2), the time window of the events simulated in the ensemble of simulations was approximately between 00:00 and 07:00 LT (see below). Despite the difference in the time of occurrence, our simulations were able to produce organized mesoscale structures with heavy precipitation affecting an area similar to the MER (see below). As mentioned earlier, our objective is to focus on the structures and mechanisms represented by the ensemble of simulations, including the time scales of the OLLJ, the organization of the simulated MCSs, and the differences in precipitation between simulations with various PBL schemes and grid sizes. Therefore, we use slightly different times and regions in the following analysis of our WRF simulations. We focus on a time window centered around 00:00–06:00 LT, and on a region centered around the city of Mocoa (hereafter Mocoa Region, MR), defined between the longitudes (77.75°W, 75.25°W), and latitudes (0.0°N, 2.0°N).
We first study the characteristics associated with the simulated OLLJ. In particular, we focus on the transport of moisture as represented by the horizontal moisture flux (qV) in the lower-levels. Figure 5 shows the horizontal moisture flux at 850 hPa averaged over a 4-h period between 20:00 and 00:00 LT, i.e., prior to the time window of the simulated event. All simulations show strong transport of moisture on the eastern flank of the Andes, with the largest values between 1° and 3°N, to the east and upstream of the region of Mocoa. All simulations with dx = 12 km (Figures 5A, D, G) exhibit a weaker transport compared to those with grid spacings of 4 and 1.3 km, while fluxes are similar between the latter. In addition, moisture transport is weaker with the MYNN (Figures 5E, F) than with the other two PBL schemes in the CP simulations (i.e., with dx = 4 and 1.3 km). A stronger flow is also associated with stronger gradients, since the Andes provide a blocking mechanism in all simulations, and stronger gradients favor the formation of areas of convergence. Therefore, simulations with higher resolution (e.g., 4 or 1.3 km) and/or with the QNSE PBL scheme seem to provide more favorable low-level convergence conditions for the genesis of an MCS.
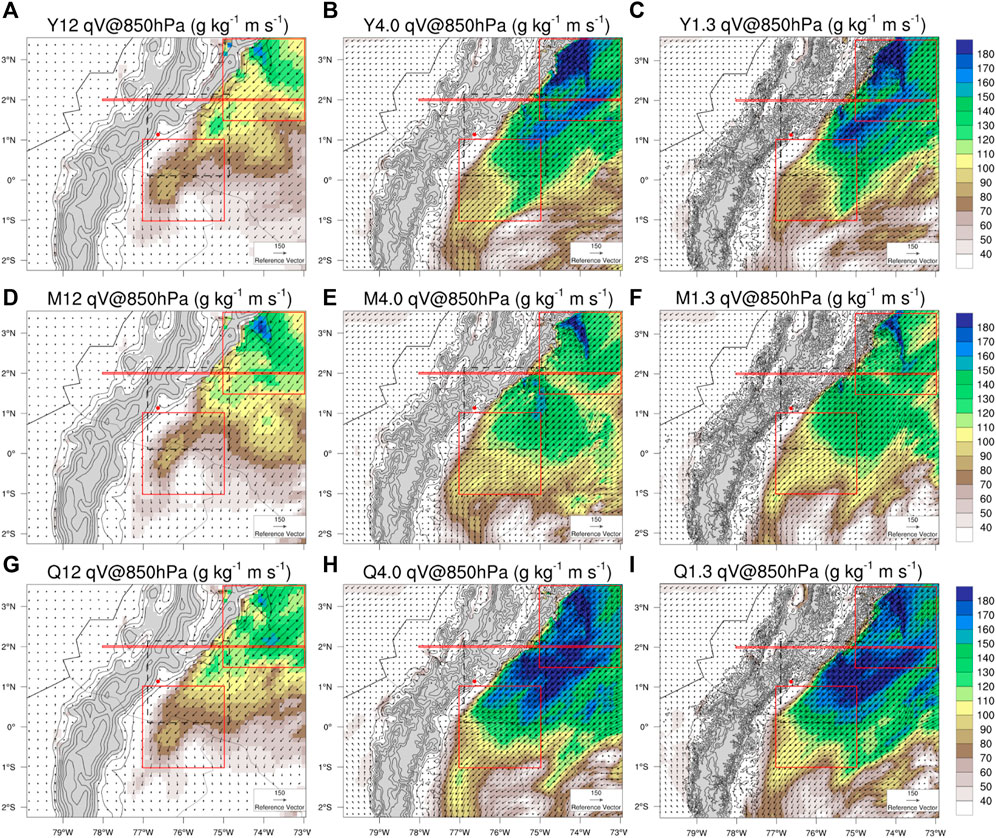
FIGURE 5. Horizontal moisture flux at 850 hPa (qV) averaged over a 4-h time window (20:00–00:00 LT) prior to the peak of the simulated event (starting around 00:00 LT). The northern (southern) red square represents region R1 (R2) used for analysis below (Figure 6). The horizontal segment at 2°N shows the position of the vertical cross section in Figure 7. The dashed black square represents the MER, as a reference (red square in Figure 3). See Table 1 for naming conventions for each resolution and PBL scheme. Results for the YSU (A–C), MYNN (D–F) and QNSE (G–I) schemes.
Similar to the reanalysis data (Figures 5C, D), the simulations showed a perturbation traveling southward in the lower levels of the atmosphere prior to the precipitation event. This is illustrated in Figure 6, which shows the time series of the spatial averages of the magnitude of the meridional moisture flux (qv) at 850 hPa over regions R1 (75°W-73°W, 1.5°N-3.5°N) and R2 (77°W-75°W, 1.0°S-1.0°N), upstream and downstream from Mocoa, respectively, (see Figure 5). Note that results for R1 from the 1.3 km simulations could have a large influence from their parent domain (d02), given the proximity of this region to the boundaries of the innermost domain (d03). However, all simulations show similar characteristics in their time series for R1 (Figure 6A): a maximum value is reached between 20:00 and 22:00 LT, i.e., between 2 and 4 h prior to the onset of the precipitation event (around 00:00 LT, see below). The 12 km simulations show the smaller fluxes prior to the event (except with the QNSE scheme), and the peak is observed later. The CP simulations with the MYNN scheme show smaller fluxes prior to the event, with very similar values and timing between the 4.0 and 1.3 km simulations. The largest peaks in moisture flux are found with the YSU and QNSE schemes in CP simulations, with the YSU scheme producing a peak approximately 1 h after QNSE, and nearly 3 h before the onset of the largest precipitation. In all simulations the moisture transport at 850 hPa over R1 decreases during the time window of the event, while it increases downstream, e.g., in R2, except in the CP simulations with the MYNN scheme (Figure 6B). Except for the MYNN scheme, simulations at 4.0 km produce slightly stronger transport than those at 1.3 km, with the QNSE scheme producing the strongest transport.
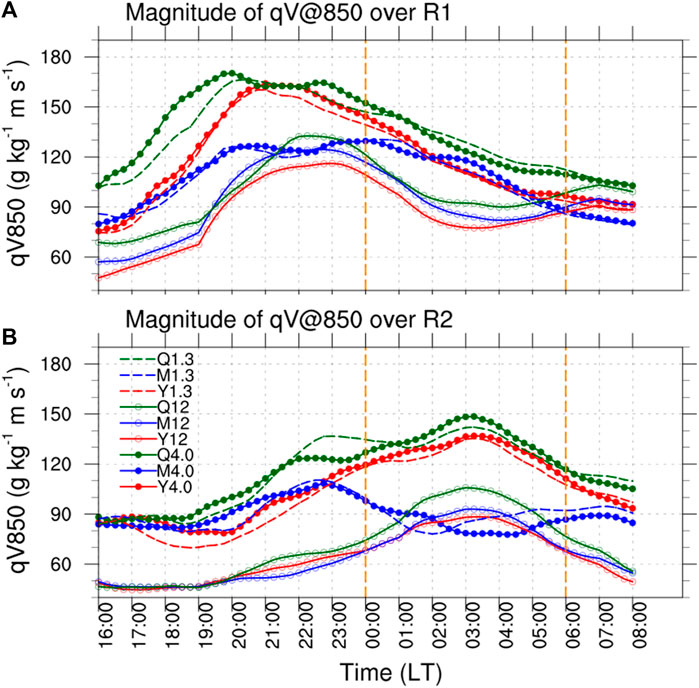
FIGURE 6. Time series of the magnitude of the horizontal moisture flux (qV) at 850 hPa, spatially averaged over regions (A) R1 (75°W–73°W, 1.5°N–3.5°N) and (B) R2 (77°W–75°W, 1.0°S–1.0°N) (see Figure 5). The vertical lines show the time period with the largest precipitation rates in the simulations (see below). See Table 1 for naming conventions for each resolution and PBL scheme.
Figure 7 shows the average meridional moisture flux upstream of the Mocoa region during the 4-h period (20:00–00:00 LT) prior to the precipitation event. The vertical distribution of the meridional moisture flux shows a core related to the OLLJ in the lower levels, east of the eastern flank of the Andes, with the largest southward fluxes (up to 125 g kg-1 m s-1) below 2000 m.a.s.l. The cross-sections in Figure 7 show the same kind of behavior as described before (i.e., Figure 5): with the coarsest grid (12 km), having less intense southward transport of moisture (Figures 7A, D, G), while for a given PBL scheme the flux between both CP simulations is similar in structure and magnitude; in addition, the CP simulations with the MYNN scheme produce the weakest transport, especially near the mountains (Figures 7E, F).
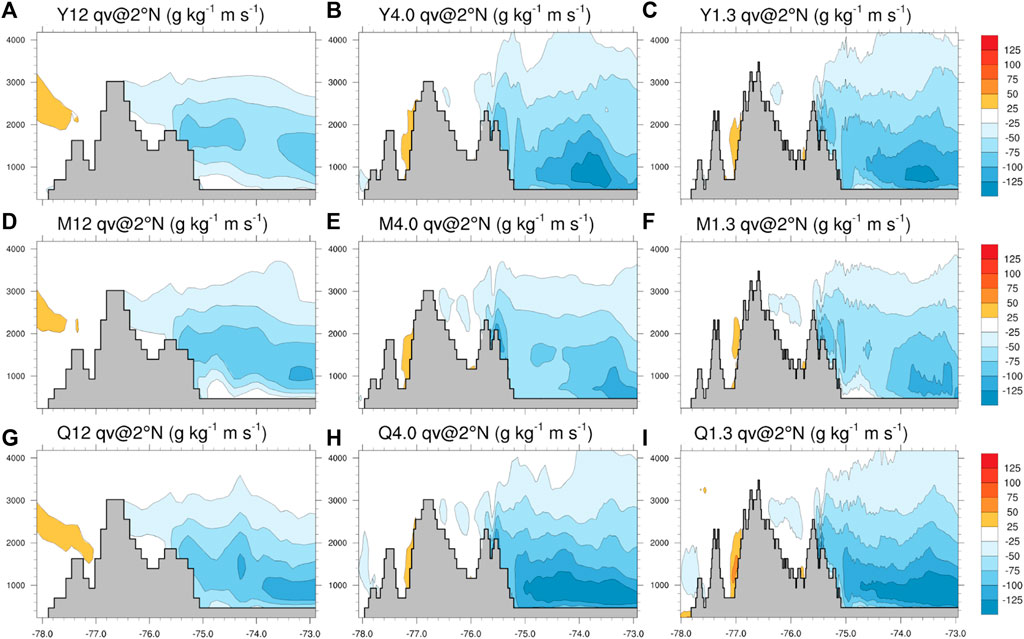
FIGURE 7. Vertical cross sections of the meridional moisture flux (qv) at 2°N (upstream of the Mocoa region, see Figure 5), averaged over a 4-h time window (20:00 to 00:00 LT) prior to the peak of the simulated event. The gray contour represents topography at the resolution of each simulation. See Table 1 for naming conventions for each resolution and PBL scheme. Results for the YSU (A–C), MYNN (D–F) and QNSE (G–I) schemes.
The CP simulations were able to produce an organized precipitation system with characteristics of an MCS (Figure 8). With the YSU and QNSE schemes each simulation had an organized system moving from the Amazon towards the Mocoa Region (see also Supplementary Figure S4). These systems passed over the city of Mocoa at around 02:00 LT, i.e., between 2 and 4 h after the peak in moisture transport upstream in region R1 (see Figure 6). The same kind of organization is not as evident with the MYNN scheme, since the corresponding OLR fields exhibit much smaller and shallower structures reaching the MR. These less organized systems did not go as far into the Andes as those simulated with the YSU and, especially, the QNSE PBL schemes; the trajectory and size of the latter better resembled the real system (compare Figures 8A–F to Figure 8G).
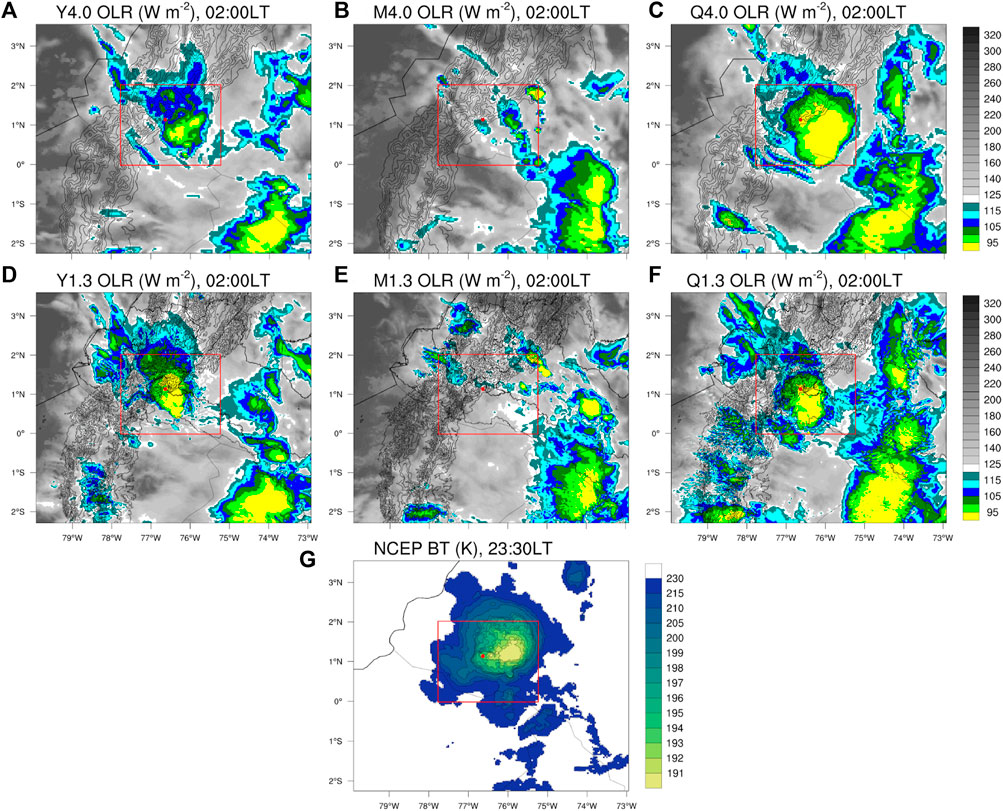
FIGURE 8. (A–F) Outgoing Longwave Radiation (OLR) at 02:00 LT from the CP simulations. The rectangle marks the “Mocoa Region” (MR) and the red dot the location of Mocoa. See Table 1 for naming conventions for each resolution and PBL scheme. (G) Brightness temperature from the NCEP MERGIR product, as observed at 23:30LT during the Mocoa event.
Simulated precipitation associated with the organized convective system was substantial over the Andes-Amazon region, as illustrated with the 6-h accumulated precipitation in the time window 00:00–06:00 LT (Figure 9). Precipitation over the mountains and the foothills was much lower in the 12-km simulations (Figures 9A, D, G), while the CP simulations produced larger amounts over the entire MR. In general, the CP simulations produced most of the precipitation over the lowlands, in qualitative agreement with the satellite estimates from GPM-IMERG (Figures 2B, D), with local maxima over the mountains, in qualitative agreement with in situ measurements (Figure 2A). In addition, the CP simulations with the MYNN scheme (Figures 9E, F) produced more precipitation over the lowlands with maxima farther from the mountains, compared to YSU and QNSE (Figures 9B, C, H, I). In contrast, the more organized systems simulated with the QNSE scheme (Figures 8C, F) produced more precipitation over the mountains to the southwest of the MR (Figures 9H, I). Note that simulations with dx = 4.0 km seem to produce more precipitation than those with dx =1.3 km, which could be related to decreased entrainment at larger grid spacings, which in turn leads to substantial overestimations of convective draft widths (Lebo and Morrison, 2015; Wang et al., 2020; Prein et al. 2021; see also Supplementary Figure S5).
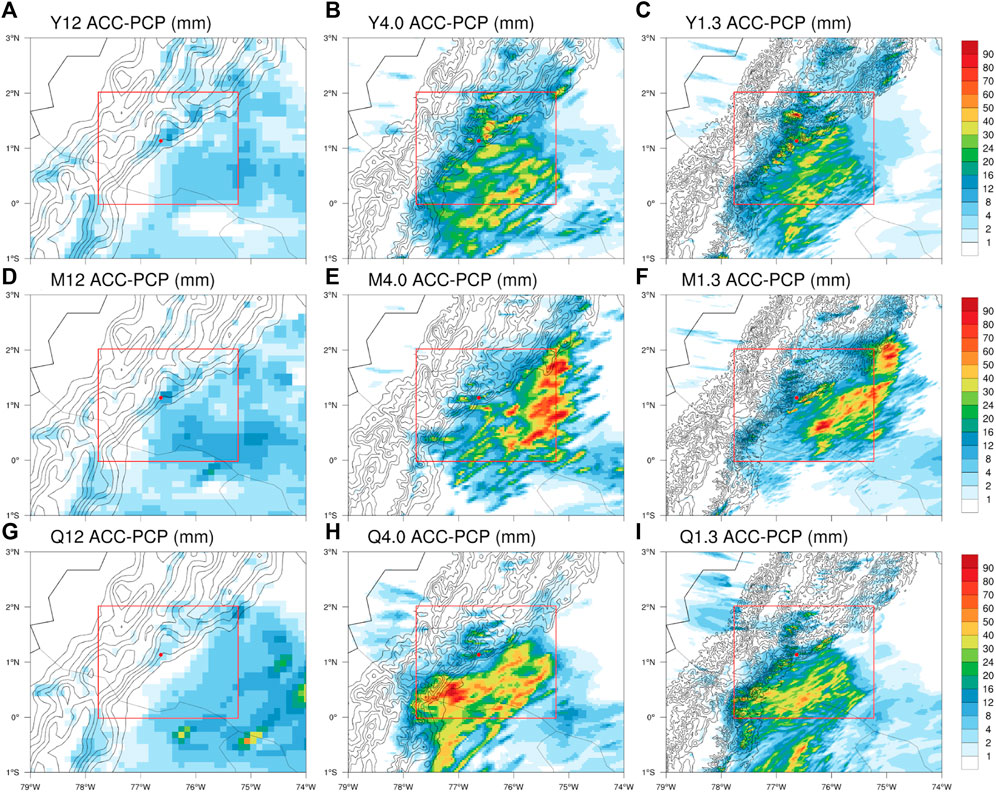
FIGURE 9. Simulated precipitation (mm) accumulated between 00:00 and 06:00 LT. See Table 1 for naming conventions for each resolution and PBL scheme. Results for the YSU (A–C), MYNN (D–F) and QNSE (G–I) schemes.
To quantify some of the characteristics described above, Figure 10 shows the time series of accumulated precipitation spatially averaged over the MR (Figure 10A), and above 500 m.a.s.l., representing the mountain regions (MNT) within the MR (Figure 10B). These time series show how the 12-km simulations failed to simulate a severe precipitation event over the MR. On the other hand, accumulated precipitation increases much faster with the YSU and QNSE schemes at the beginning of the time window of the precipitation event, compared with MYNN, especially over the mountainous areas (Figure 10B). In general, larger accumulations within the MR are obtained with the QNSE scheme. Finally, note that, for a given PBL scheme, simulations with dx = 4.0 km tend to produce larger accumulations than those with 1.3 km, with the largest (smallest) differences for the QNSE (YSU) scheme.
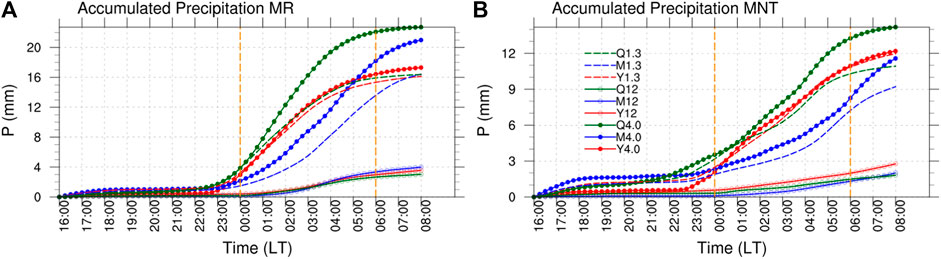
FIGURE 10. Time series of accumulated precipitation over the Mocoa region (A) and over altitudes above 500 m.a.s.l within the same Mocoa region (B). See Table 1 for naming conventions for each resolution and PBL scheme.
One lingering question arises from the comparison of PBL schemes: why does the MYNN scheme produce a weaker low-level flow over parts of the Orinoco region? One possible explanation might be related to the MYNN scheme simulating larger vertical mixing over parts of the Orinoco, thus leading to a more vertically diluted OLLJ and a weaker vertical stability in the low- and mid-levels. To illustrate this hypothesis, we consider the vertical distribution of the virtual potential temperature, winds and the Brunt-Väisälä frequency, as an indicator of stability (Ko and Chun, 2022). Figures 11, 12 show results from the YSU and MYNN schemes only, but results with the QNSE scheme are similar to those with YSU. All three schemes are compared in Figure 13.
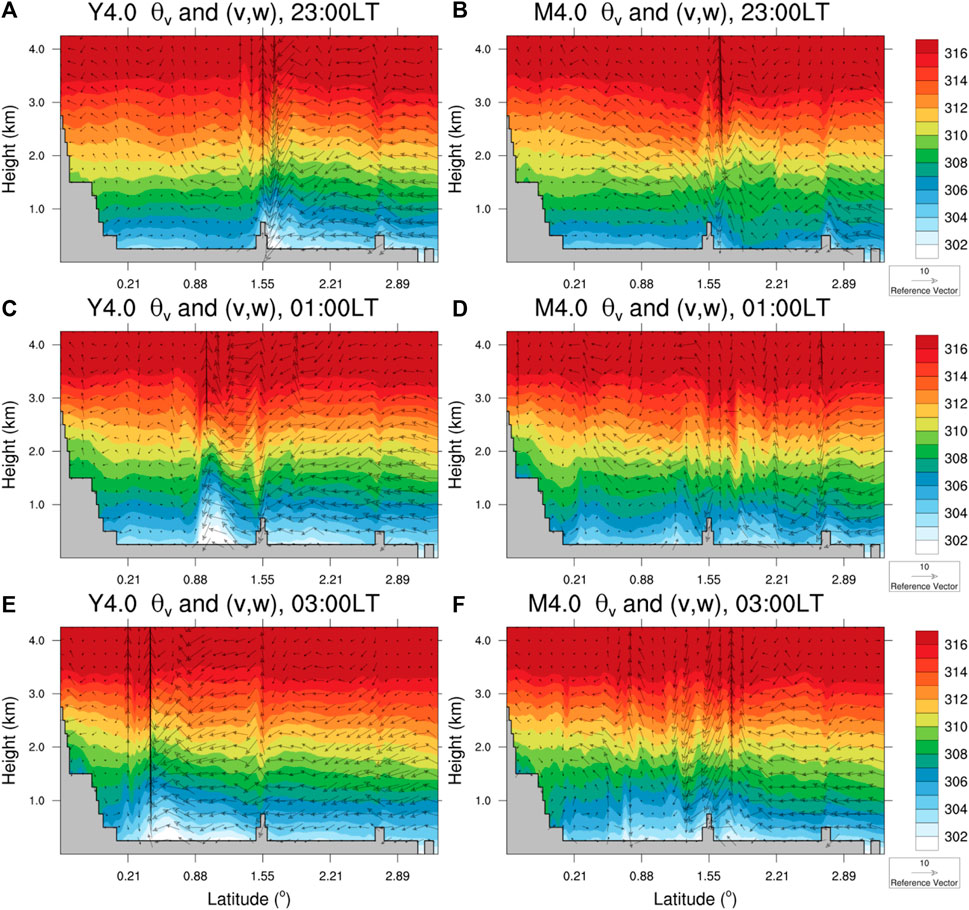
FIGURE 11. Vertical cross-sections (between 77.99°W and 0.43°S and 73.11°W-3.33°N) of virtual potential temperature (K) and the meridional v (m s−1) and vertical w (10x m s−1) wind components. Top, middle and bottom rows show the instantaneous state at 23:00, 01:00 and 03:00 LT, respectively. (A, C) and (B, D–F) show results from the simulation with the YSU (MYNN) scheme, with a grid spacing of 4 km.
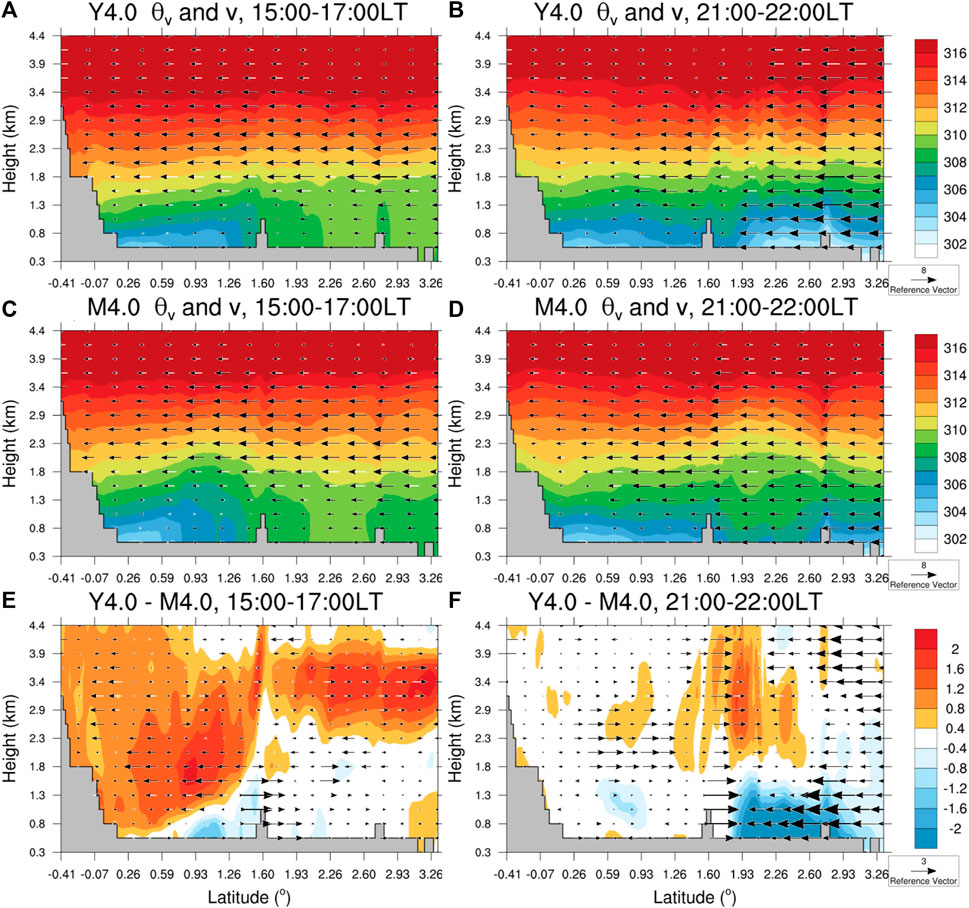
FIGURE 12. Vertical cross-sections (between 77.99°W and 0.43°S and 73.11°W-3.33°N) of virtual potential temperature and meridional wind. The left column (A, C, E) shows afternoon conditions, with averages between 15:00 and 17:00 LT. The right column (B, D, F) shows average conditions in the time window 21:00–22: 00 LT, when the traveling disturbance in the OLLJ was simulated. (E, F) show the differences YSU–MYNN.
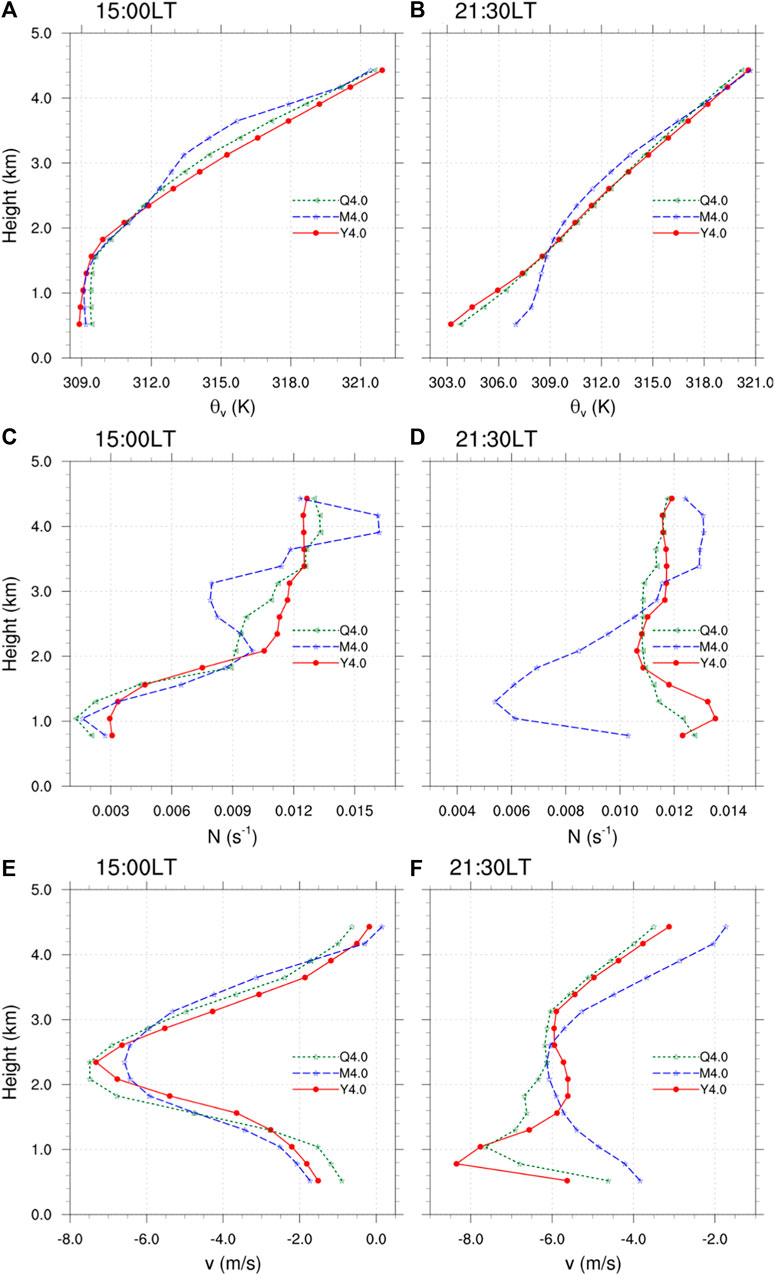
FIGURE 13. Vertical profiles of virtual potential temperature (A, B), Brunt-Väisälä frequency (C, D) and meridional momentum (E, F). Spatial averages are computed between latitudes 2.0°N and 2.46°N, along the vertical cross-sections shown in Figure 11.
During the night-time, the YSU simulation produced a mesoscale structure, moving southward and with a sharp leading edge below about 1.5 km a.s.l (Figures 11A, C, E). This structure was characterized by lower values of virtual potential temperature moving southward over the Orinoco basin, with large vertical velocities extending from the head of the structure (see white and light blue colors, and wind vectors around 1–1.5 km a.s.l in Figure 11) towards higher altitudes. These characteristics correspond with those of mesoscale density currents (see e.g., Liu and Moncrieff, 2000). In our simulations, the large vertical velocities over the head of the density current were associated with areas of low-level convergence and rising motion that favored the formation of the MCS. In this sense, a potential precursor for the MCS that affected Mocoa was not just the overall strong flow in the OLLJ, but the formation and movement of a density current in the region of the OLLJ. On the other hand, the MYNN simulation did not exhibit a density current, although the undulations on the momentum and virtual potential temperature fields suggest the formation and propagation of gravity waves (Figures 11B, D, F). Note that the regions with upward motion are not as strong in the MYNN simulation as those over the head of the density current in the YSU simulation.
During the afternoon, both the YSU and MYNN schemes produced strong southward winds above the PBL (e.g., between 1.8 km and 3.4 km a.s.l; Figures 12A, C), but YSU had larger virtual potential temperatures aloft (Figure 12E). This suggests that the MYNN scheme had a less stable environment since the afternoon hours, prior to the formation of the simulated MCS. A comparison of the vertical profiles of virtual potential temperature during the afternoon hours (Figure 13A) shows that the MYNN scheme exhibits smaller values, especially between 3 km and 4 km, suggesting an enhanced upward mixing compared to the other schemes. A similar conjecture can be derived from the water vapor mixing ratio (Supplementary Figure S6C). The resulting profile of virtual potential temperature yields smaller values of the Brunt-Väisälä frequency (N), between ∼ 2.4 km and 3.7 km (Figure 13C), which suggests the existence of a less-stable layer over the PBL in the MYNN simulation. In addition, compared to the other two PBL schemes, MYNN produces stronger southward flow between 3 km and 4 km (Figure 13E), with smaller values at the nose of the vertical profile, while both QNSE and YSU have a sharper nose with larger momentum (faster low- and mid-level southward winds above the PBL). These differences in the vertical profiles above the PBL suggest an enhanced vertical mixing with the MYNN scheme since the afternoon hours, along with a more vertically diluted OLLJ.
During the night-time, when the density current was already present in the YSU simulation (Figures 12B, D), virtual potential temperatures were still larger aloft, compared to the MYNN scheme (Figure 12F). Figures 13B, D, and f show vertical profiles when the density current is already present in the bottom layer (below 1.3 km) of the YSU and QNSE simulations. At this time, the MYNN scheme produces values of N noticeably smaller over the bottom layer (e.g., between 1.3 km and 2.0 km). This kind of less-stable layer in the MYNN simulation (which results from enhanced vertical mixing) would be favorable for a greater radiation of energy upwards via gravity waves, thus leading to a weakening of low-level disturbances (Crook 1988; Liu and Moncrieff, 2000). The same reasoning about the more-stable layers aloft in the YSU and QNSE simulations might explain why the low-level disturbance keeps its form and strength, producing density currents with these two PBL schemes.
In summary, our results suggest that the MYNN PBL scheme has stronger vertical mixing, compared to the YSU and QNSE schemes. Thus, structures like the OLLJ could be deeper in the vertical, with weaker winds at the nose of the jet when the vertical mixing is larger. In addition, this difference might produce less-stable layers above the PBL in the MYNN simulation, producing weaker low-level structures because of the loss of energy via gravity waves. As a result, the MYNN PBL scheme produces weaker low-level flow (Figures 5, 7) and weaker (or absent) mesoscale structures like density currents (Figures 6, 11–13), compared to the YSU and QNSE PBL schemes. Therefore, a low-level perturbation in the OLLJ region could travel longer distances without losing too much of its structure when the static stability is larger over the PBL, which, in this case, happens when comparing the MYNN with results from the YSU and QNSE PBL schemes.
A severe precipitation event affected the city of Mocoa in the tropical Andes, with more than 100 mm of accumulated precipitation within 3 h, and a total 24-h accumulation of more than 129 mm. This event triggered a flash flood that caused more than 300 casualties. Satellite data (including BT from NCEP-MERGIR and precipitation estimates from GPM-IMERG) shows that the event was associated with an MCS, which formed over the lowlands in the Amazon and moved west towards the Andes. Reanalysis data from ERA5 suggests that the event was associated with a strong OLLJ, and a perturbation traveling southwestward in the lower levels, producing zones of convergence over the Andes-Amazon transition region and contributing to the formation of the MCS. Average precipitable water around Mocoa showed a rapid increase ∼ 5 h prior to the precipitation event, and the vertically integrated moisture convergence showed a signal even 1 hour earlier (i.e., ∼ 6 h before the precipitation maximum in Mocoa). Furthermore, upstream conditions associated with the OLLJ (e.g., the C3 index) showed a stronger-than-normal OLLJ and also a rapid intensification approximately 8 h before the peak precipitation in Mocoa. These time scales could be of interest for the study of other similar events, and for early warnings. Figure 14 shows a general scheme of the main aspects associated with this particular MCS event.
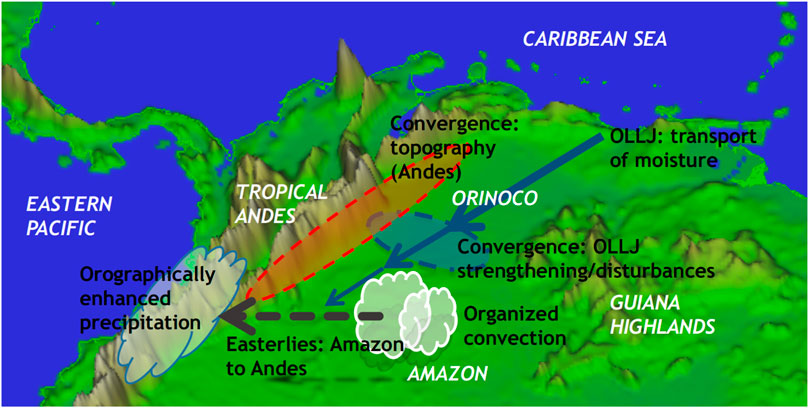
FIGURE 14. Summary scheme with the main ingredients associated with the Mocoa MCS event. The OLLJ provides a mechanism for the transport of moisture, mass and momentum. Mesoscale structures/perturbations in the OLLJ, like the rapid strengthening and southwestward traveling disturbance during the Mocoa event, allows the formation of areas of low-level convergence. In addition, the tropical Andes provide blocking and favor convergence and orographic enhancement of precipitation. Convective systems (including MCSs) can form over the plains in the Amazon/Orinoco, and travel west towards the Andes, helped by the Easterly winds in mid-levels.
Interestingly, Adams et al. (2013) found similar time scales for the increase in PW (4–8 h in their case) associated with well-defined deep convective events over a region in the lowlands of the Amazon. In addition, several studies have shown the importance of the OLLJ for precipitation in the Andes-Amazon region (e.g., Braz et al., 2021; Builes-Jaramillo et al., 2022a; Builes-Jaramillo et al., 2022b). For the Mocoa event, we found that a strong OLLJ is important, and a rapid intensification of this jet and/or the formation of a traveling perturbation in the jet contributes to the formation of zones of convergence over the region. In this sense, variations in the OLLJ region can be important for the occurrence of precipitation downstream in the vicinity of and over the tropical Andes. In such cases, monitoring of conditions upstream in the OLLJ, e.g., in the C3 region, could help with indications several hours prior to precipitation events, which, in this case, was nearly 8 h.
The ensemble of WRF simulations also exhibited a strong OLLJ, with a perturbation traveling south-westward over the eastern flank of the Andes, moving from the northern regions of Venezuela to southern Colombia and northern Ecuador in approximately 12 h. Interestingly, larger and more organized MCSs were present in simulations that produced a stronger OLLJ, and in which the perturbation traveling parallel to the Andes corresponded to a density current. This was the case with the YSU and QNSE PBL schemes. In contrast, simulations with the MYNN scheme exhibited an enhanced vertical mixing, resulting in a weaker nose in the afternoon OLLJ, and the absence of a density current prior to the formation of the MCS, probably because of the resulting less-stable layer above the PBL and the associated loss of energy via gravity waves (Crook, 1988; Liu and Moncrieff, 2000; Seigel and van den Heever, 2012).
Mesoscale structures like gravity waves and density currents that are relevant for weather systems might have scales of a few kilometers (see e.g., Crook, 1988; Liu and Moncrieff, 2000; Mapes et al., 2003; Nappo, 2013; Soler et al., 2014). Given that the effective resolution of an atmospheric model is on the order of ten times its grid spacing, kilometer-scale simulations can simulate important structures that are not represented in current reanalysis like ERA5 (grid spacing ∼ 30 km). Our simulations with grid spacings of 4.0 and 1.3 km produced structures with characteristics of density currents, which were associated with the properties (initiation, size and organization) of the simulated MCS under the atmospheric conditions of the Mocoa event. In addition, our simulations also exhibited structures like gravity waves emanating from convective systems in the Amazon and propagating above the PBL, from the Amazon towards the Andes, apparently helping with precipitation near the mountains (not shown). This kind of density currents and gravity waves are not easily identified (or even represented) in the ERA5 fields, likely because of the coarser resolution of the atmospheric model employed for this reanalysis.
The validation of the simulated gravity waves and density currents would require a dense network of observations, and the availability of observed vertical profiles of atmospheric variables (e.g., Soler et al., 2014). Unfortunately, in tropical South America, these kinds of observations were not available during the Mocoa event. However, the numerical simulations with WRF provide a physically sound and plausible picture of the mesoscale structures that might have favored the formation and development of the observed MCS. In addition, our results provide an example of the mesoscale structures produced in CP simulations that can contribute to the resulting patterns and variability of precipitating systems in the vicinity of the Orinoco and the tropical Andes.
The differences between PBL schemes found in our simulations are consistent with previous studies. For example, based on a comprehensive database of observations, Smith et al. (2018) found that the QNSE scheme provides a more realistic depiction of the Great Plains Low-Level Jet. In our case, there is no analogous database of observations, but the resulting more realistic size and trajectory of the simulated MCS suggests that the QNSE scheme provides advantages over YSU and MYNN in our region of interest. On the other hand, similar to our results, Prein et al. (2022) obtained less organized and less realistic MCSs using the MYNN scheme. They also found that this PBL scheme produces more vertical mixing than others. In addition to these characteristics, we find that the MYNN produces a less-stable vertical profile unfavorable for a strong OLLJ and for the formation and/or propagation of low-level mesoscale structures like density currents. This hypothesis suggests an interesting avenue for future investigation of the properties and sensitivity of simulated mesoscale structures (e.g., gravity waves, density currents) associated with the OLLJ and precipitation over the Andes-Amazon transition region.
This case study suggests conclusions in two directions. From the point of view of the observed event, it is interesting to highlight the time scales associated with atmospheric conditions before the major precipitation event, which in terms of atmospheric moisture in the area of interest is about 5 h, and for the OLLJ upstream can be 8 h. Thus, sub-daily (at least hourly) observations of PW in regions surrounding populated areas in the Andes, and sub-hourly wind profiles in upstream regions associated with the OLLJ, may improve nowcasting and early warnings of severe weather events in parts of the Andes-Amazon transition region. From a modeling perspective, this case study is a particular example of the need of high resolution in order to simulate the mesoscale structures associated with severe weather. Around the Andes and the OLLJ region, these structures include localized cores, sharp gradients, zones of convergence, low- and mid-level gravity waves, density currents, etc. This is particularly needed in regions with vulnerable populations in areas of complex topography such as the Andes-Amazon transition region (Castellanos et al., 2022).
Kilometer-scale modeling still requires more research, for example, about the usage of full or scale-ware deep convection parameterizations (Freitas et al., 2020; Junquas et al., 2022) or PBL schemes (e.g., Prein et al., 2022). However, our detailed description of the Mocoa event highlights atmospheric structures which can be further explored in decadal-scale CP climate simulations over South America (e.g., Dominguez et al., 2023; Halliday et al., 2023), in an effort to better understand the spatio-temporal variability of precipitation over the tropical Andes. This region lacks sufficiently dense and long observational networks, however, it is home to millions of people that are vulnerable to mountain hazards triggered by heavy precipitation events (Adler et al., 2022; Castellanos et al., 2022). As such, alternative methods to provide information to at-risk communities is critically needed.
IDEAM data used in this study was available from https://dhime.ideam.gov.co. GPM IMERG V06 and NOAA/NCEP MERGIR data were obtained from the Goddard Earth Sciences Data and Information Services Center (GES-DISC) website (https://disc.gsfc.nasa.gov/). ERA5 data was obtained from the Copernicus Climate Data Store at https://cds.climate.copernicus.eu.
JM: Conceptualization, Investigation, Writing–original draft. PA: Project administration, Writing–review and editing. FD: Writing–review and editing. AP: Writing–review and editing.
The author(s) declare financial support was received for the research, authorship, and/or publication of this article. JA and PA are supported by MINCIENCIAS through program No. 80740-490-2020 and by ClimatAmSud through MINCIENCIAS grant 80740-238-2021. FD is supported by National Science Foundation (NSF) AGS 1852709. NCAR is sponsored by the National Science Foundation under Cooperative Agreement 1852977.
We want to thank Daniel F. Vásquez for helping with Figures 2, 3; Supplementary Figures S2, S3. This work is developed within the Andex Hydroclimate Program (https://www.gewex.org/project/andex/).
The authors declare that the research was conducted in the absence of any commercial or financial relationships that could be construed as a potential conflict of interest.
The author(s) declared that they were an editorial board member of Frontiers, at the time of submission. This had no impact on the peer review process and the final decision.
All claims expressed in this article are solely those of the authors and do not necessarily represent those of their affiliated organizations, or those of the publisher, the editors and the reviewers. Any product that may be evaluated in this article, or claim that may be made by its manufacturer, is not guaranteed or endorsed by the publisher.
The Supplementary Material for this article can be found online at: https://www.frontiersin.org/articles/10.3389/feart.2023.1307549/full#supplementary-material
Adams, D. K., Gutman, S. I., Holub, K. L., and Pereira, D. S. (2013). GNSS observations of deep convective time scales in the Amazon. Geophys. Res. Lett. 40 (11), 2818–2823. doi:10.1002/grl.50573
Adler, C., Wester, P., Bhatt, I., Huggel, C., Insarov, G. E., Morecroft, M. D., et al. (2022). “Cross-chapter paper 5: mountains,” in Climate change 2022: impacts, adaptation and vulnerability. Contribution of working group II to the sixth assessment report of the intergovernmental panel on climate change. Editors H. O. Pörtner, D. C. Roberts, M. Tignor, E. S. Poloczanska, K. Mintenbeck, A. Alegríaet al. (Cambridge, UK and New York, NY, USA: Cambridge University Press), 2273–2318. doi:10.1017/9781009325844.022
Alcântara, C. R., Dias, M. A. S., Souza, E. P., and Cohen, J. C. (2011). Verification of the role of the low level jets in Amazon squall lines. Atmos. Res. 100 (1), 36–44. doi:10.1016/j.atmosres.2010.12.023
Anselmo, E. M., Schumacher, C., and Machado, L. A. T. (2020). The amazonian low-level jet and its connection to convective cloud propagation and evolution. Mon. Weather Rev. 148 (10), 4083–4099. doi:10.1175/mwr-d-19-0414.1
Arias, P. A., Garreaud, R., Poveda, G., Espinoza, J. C., Molina-Carpio, J., Masiokas, M., et al. (2021). Hydroclimate of the andes part II: hydroclimate variability and sub-continental patterns. Front. Earth Sci. 8, 666. doi:10.3389/feart.2020.505467
Arias, P. A., Ortega, G., Villegas, L. D., and Martínez, J. A. (2020). Colombian climatology in CMIP5/CMIP6 models: persistent biases and improvements. Revista Facultad de Ingeniería Universidad de Antioquia. Available at: https://revistas.udea.edu.co/index.php/ingenieria/article/view/344493.
Bendix, J., Trachte, K., Cermak, J., Rollenbeck, R., and Nauß, T. (2009). Formation of convective clouds at the foothills of the tropical eastern Andes (South Ecuador). J. Appl. Meteorology Climatol. 48 (8), 1682–1695. doi:10.1175/2009jamc2078.1
Bettolli, M. L., Solman, S. A., Da Rocha, R. P., Llopart, M., Gutierrez, J. M., Fernández, J., et al. (2021). The CORDEX Flagship Pilot Study in southeastern South America: a comparative study of statistical and dynamical downscaling models in simulating daily extreme precipitation events. Clim. Dyn. 56 (5), 1589–1608. doi:10.1007/s00382-020-05549-z
Betts, A. K., Köhler, M., and Zhang, Y. (2009). Comparison of river basin hydrometeorology in ERA-Interim and ERA-40 reanalyses with observations. J. Geophys. Res. Atmos. 114 (D2), 10761. doi:10.1029/2008jd010761
Braz, D. F., Ambrizzi, T., Da Rocha, R. P., Algarra, I., Nieto, R., and Gimeno, L. (2021). Assessing the moisture transports associated with nocturnal low-level jets in continental south America. Front. Environ. Sci. 9, 657764. doi:10.3389/fenvs.2021.657764
Builes-Jaramillo, A., Yepes, J., and Salas, H. D. (2022a). The Orinoco low-level jet and its association with the hydroclimatology of northern South America. J. Hydrometeorol. 23 (2), 209–223. doi:10.1175/jhm-d-21-0073.1
Builes-Jaramillo, A., Yepes, J., and Salas, H. D. (2022b). The Orinoco low-level jet during El niño–southern oscillation. Int. J. Climatol. 42 (15), 7863–7877. doi:10.1002/joc.7681
Castellanos, E., Lemos, M. F., Astigarraga, L., Chacón, N., Cuvi, N., Huggel, C., et al. (2022). “Central and south America,” in Climate change 2022: impacts, adaptation and vulnerability. Contribution of working group II to the sixth assessment report of the intergovernmental panel on climate change. Editors H.-O. Pörtner, D. C. Roberts, M. Tignor, E. S. Poloczanska, K. Mintenbeck, A. Alegríaet al. (Cambridge, UK and New York, NY, USA: Cambridge University Press), 1689–1816. doi:10.1017/9781009325844.014
Chavez, S. P., and Takahashi, K. (2017). Orographic rainfall hotspots in the Andes-Amazon transition according to the TRMM precipitation radar and in situ data. J. Geophys. Res. 122, 5870–5882. doi:10.1002/2016JD026282
Chen, F., and Dudhia, J. (2001). Coupling an advanced land surface–hydrology model with the penn state–NCAR MM5 modeling system. Part I: model implementation and sensitivity. Mon. Wea. Rev. 129, 569–585. doi:10.1175/1520-0493(2001)129<0569:caalsh>2.0.co;2
Condom, T., Martínez, R., Pabón, J. D., Costa, F., Pineda, L., Nieto, J. J., et al. (2020). Climatological and hydrological observations for the South American Andes: in situ stations, satellite, and reanalysis data sets. Front. Earth Sci. 8, 92. doi:10.3389/feart.2020.00092
Coppola, E., Sobolowski, S., Pichelli, E., Raffaele, F., Ahrens, B., Anders, I., et al. (2020). A first-of-its-kind multi-model convection permitting ensemble for investigating convective phenomena over Europe and the Mediterranean. Clim. Dyn. 55, 3–34. doi:10.1007/s00382-018-4521-8
Correa, I. C., Arias, P. A., Vieira, S. C., and Martínez, J. A. (2024). A drier Orinoco basin during the 21st century: the role of the Orinoco low-level jet. Clim. Dyn. In press. doi:10.1007/s00382-023-07028-7
Crook, N. A. (1988). Trapping of low-level internal gravity waves. J. Atmos. Sci. 45 (10), 1533–1541. doi:10.1175/1520-0469(1988)045<1533:tollig>2.0.co;2
Dias-Júnior, C. Q., Carneiro, R. G., Fisch, G., D’Oliveira, F. A. F., Sörgel, M., Botía, S., et al. (2022). Intercomparison of planetary boundary layer heights using remote sensing retrievals and ERA5 reanalysis over Central Amazonia. Remote Sens. 14 (18), 4561. doi:10.3390/rs14184561
Dominguez, F., Rasmussen, R., Liu, C., Ikeda, K., Prein, A., Varble, A., et al. (2023). Advancing South American water and climate science through multi-decadal convection-permitting modeling. Bulletin of the American Meteorological Society.
Espinoza, J. C., Chavez, S., Ronchail, J., Junquas, C., Takahashi, K., and Lavado, W. (2015). Rainfall hotspots over the southern tropical Andes: spatial distribution, rainfall intensity, and relations with large-scale atmospheric circulation. Water Resour. Res. 51, 3459–3475. doi:10.1002/2014WR016273
Freitas, S. R., Putman, W. M., Arnold, N. P., Adams, D. K., and Grell, G. A. (2020). Cascading toward a kilometer-scale GCM: impacts of a scale-aware convection parameterization in the Goddard Earth Observing System GCM. Geophys. Res. Lett. 47 (17), e2020GL087682. doi:10.1029/2020gl087682
Gimeno, L., Dominguez, F., Nieto, R., Trigo, R., Drumond, A., Reason, C., et al. (2016). Major mechanisms of atmospheric moisture transport and their role in extreme precipitation events. Annu. Rev. Environ. Resour. 41, 117–141. doi:10.1146/annurev-environ-110615-085558
Gomez-Rios, S., Zuluaga, M. D., and Hoyos, C. D. (2023). Orographic controls over convection in an inter-andean valley in northern South America. Mon. Weather Rev. 151 (1), 145–162. doi:10.1175/mwr-d-21-0231.1
Greco, S., Ulanski, S., Garstang, M., and Houston, S. (1992). Low-level nocturnal wind maximum over the central Amazon basin. Boundary-Layer Meteorol. 58 (1-2), 91–115. doi:10.1007/bf00120753
Halladay, K., Kahana, R., Johnson, B., Still, C., Fosser, G., and Alves, L. (2023). Convection-permitting climate simulations for south America with the met office unified model. Clim. Dyn. 2023, 1–23. doi:10.1007/s00382-023-06853-0
Henao, J. J., Mejía, J. F., Rendón, A. M., and Salazar, J. F. (2020). Sub-kilometer dispersion simulation of a CO tracer for an inter-Andean urban valley. Atmos. Pollut. Res. 11 (5), 928–945. doi:10.1016/j.apr.2020.02.005
Hernandez-Deckers, D. (2022). Features of atmospheric deep convection in Northwestern South America obtained from infrared satellite data. Q. J. R. Meteorological Soc. 148 (742), 338–350. doi:10.1002/qj.4208
Hersbach, H., Bell, B., Berrisford, P., Hirahara, S., Horányi, A., Muñoz-Sabater, J., et al. (2020). The ERA5 global reanalysis. Q. J. R. Meteorological Soc. 146 (730), 1999–2049. doi:10.1002/qj.3803
Hong, S. Y., Noh, Y., and Dudhia, J. (2006). A new vertical diffusion package with an explicit treatment of entrainment processes. Mon. Weather Rev. 134 (9), 2318–2341.
Houze, R. A., Rasmussen, K. L., Zuluaga, M. D., and Brodzik, S. R. (2015). The variable nature of convection in the tropics and subtropics: a legacy of 16 years of the Tropical Rainfall Measuring Mission satellite. Rev. Geophys. 53 (3), 994–1021. doi:10.1002/2015rg000488
Hoyos, C. D., Ceballos, L. I., Pérez-Carrasquilla, J. S., Sepúlveda, J., López-Zapata, S. M., Zuluaga, M. D., et al. (2019). Meteorological conditions leading to the 2015 Salgar flash flood: lessons for vulnerable regions in tropical complex terrain. Nat. Hazards Earth Syst. Sci. 19 (11), 2635–2665. doi:10.5194/nhess-19-2635-2019
Huffman, G. J., Stocker, E. F., Bolvin, D. T., Nelkin, E. J., and Tan, J. (2019). GPM IMERG final precipitation L3 half hourly 0.1 degree x 0.1 degree V06. Greenbelt, MD: Goddard Earth Sciences Data and Information Services Center GES DISC.
Iacono, M. J., Delamere, J. S., Mlawer, E. J., Shephard, M. W., Clough, S. A., and Collins, W. D. (2008). Radiative forcing by long-lived greenhouse gases: calculations with the AER radiative transfer models. J. Geophys. Res. 113, D13103. doi:10.1029/2008jd009944
IPCC (2021). “Summary for policymakers,” in Climate change 2021: the physical science basis. Contribution of working group I to the sixth assessment report of the intergovernmental panel on climate change. Editors V. Masson-Delmotte, P. Zhai, A. Pirani, S. L. Connors, C. Péan, S. Berger, N. Caudet al. (Cambridge, United Kingdom and New York, NY, USA: Cambridge University Press), 3–32. doi:10.1017/9781009157896.001
Itterly, K. F., Taylor, P. C., and Dodson, J. B. (2018). Sensitivity of the Amazonian convective diurnal cycle to its environment in observations and reanalysis. J. Geophys. Res. Atmos. 123 (22), 12–62. doi:10.1029/2018jd029251
Janowiak, J., Joyce, B., and Xie, P. (2017). NCEP/CPC L3 half hourly 4km global (60S–60N) merged IR V1. Greenbelt, MD: Goddard Earth Sciences Data and Information Services Center GES DISC.
Jaramillo, L., Poveda, G., and Mejía, J. F. (2017). Mesoscale convective systems and other precipitation features over the tropical Americas and surrounding seas as seen by TRMM. Int. J. Climatol. 37, 380–397. doi:10.1002/joc.5009
Jiménez-Sánchez, G., Marlowski, P. M., Jewtoukoff, V., Young, G. S., and Stensrud, D. (2019). The Orinoco low-level jet: an investigation of its characteristics and evolution using the WRF model. J. Geophys. Res. Atmos. 125 (13), 1–23. doi:10.1029/2019JD030934
Jiménez-Sánchez, G., Marlowski, P. M., Young, G. S., and Stensrud, D. (2020). The Orinoco low-level jet: an investigation of its characteristics and evolution using the WRF model. J. Geophys. Res. Atmos. 124 (20), 10696–10711. doi:10.1029/2019jd030934
Jones, C. (2019). Recent changes in the South America low-level jet. Clim. Atmos. Sci. 2 (1), 20–28. doi:10.1038/s41612-019-0077-5
Junquas, C., Heredia, M. B., Condom, T., Ruiz-Hernández, J. C., Campozano, L., Dudhia, J., et al. (2022). Regional climate modeling of the diurnal cycle of precipitation and associated atmospheric circulation patterns over an Andean glacier region (Antisana, Ecuador). Clim. Dyn. 58 (11-12), 3075–3104. doi:10.1007/s00382-021-06079-y
Junquas, C., Takahashi, K., Condom, T., Espinoza, J. C., Chávez, S., Sicart, J. E., et al. (2018). Understanding the influence of orography on the precipitation diurnal cycle and the associated atmospheric processes in the central Andes. Clim. Dyn. 50 (11), 3995–4017. doi:10.1007/s00382-017-3858-8
Ko, H. C., and Chun, H. Y. (2022). Potential sources of atmospheric turbulence estimated using the Thorpe method and operational radiosonde data in the United States. Atmos. Res. 265, 105891. doi:10.1016/j.atmosres.2021.105891
Lebo, Z. J., and Morrison, H. (2015). Effects of horizontal and vertical grid spacing on mixing in simulated squall lines and implications for convective strength and structure. Mon. Weather Rev. 143 (11), 4355–4375. doi:10.1175/mwr-d-15-0154.1
Liu, C., and Moncrieff, M. W. (2000). Simulated density currents in idealized stratified environments. Mon. Weather Rev. 128 (5), 1420–1437. doi:10.1175/1520-0493(2000)128<1420:sdciis>2.0.co;2
López, M. E., and Howell, W. E. (1967). Katabatic winds in the equatorial Andes. J. Atmos. Sci. 24 (1), 29–35. doi:10.1175/1520-0469(1967)024<0029:kwitea>2.0.co;2
Lucas-Picher, P., Argüeso, D., Brisson, E., Tramblay, Y., Berg, P., Lemonsu, A., et al. (2021). Convection-permitting modeling with regional climate models: latest developments and next steps. Wiley Interdiscip. Rev. Clim. Change 12 (6), e731. doi:10.1002/wcc.731
Mapes, B. E., Warner, T. T., and Xu, M. (2003). Diurnal patterns of rainfall in northwestern South America. Part III: diurnal gravity waves and nocturnal convection offshore. Mon. weather Rev. 131 (5), 830–844. doi:10.1175/1520-0493(2003)131<0830:dporin>2.0.co;2
Martinez, J. A., Arias, P. A., Castro, C., Chang, H. I., and Ochoa-Moya, C. A. (2019). Sea surface temperature-related response of precipitation in northern South America according to a WRF multi-decadal simulation. Int. J. Climatol. 39 (4), 2136–2155. doi:10.1002/joc.5940
Martinez, J. A., Arias, P. A., Junquas, C., Espinoza, J. C., Condom, T., Dominguez, F., et al. (2022). The Orinoco low-level jet and the cross-equatorial moisture transport over tropical South America: lessons from seasonal WRF simulations. J. Geophys. Res. Atmos. 127 (3), e2021JD035603. doi:10.1029/2021jd035603
Morrison, H., Thompson, G., and Tatarskii, V. (2008). Impact of cloud microphysics on the development of trailing stratiform precipitation in a simulated squall line: comparison of one- and two-moment schemes. Mon. Wea. Rev. 137, 991–1007. doi:10.1175/2008mwr2556.1
Moya-Álvarez, A. S., Estevan, R., Kumar, S., Rojas, J. L. F., Ticse, J. J., Martínez-Castro, D., et al. (2020). Influence of PBL parameterization schemes in WRF_ARW model on short-range precipitation's forecasts in the complex orography of Peruvian Central Andes. Atmos. Res. 233, 104708. doi:10.1016/j.atmosres.2019.104708
Moya-Alvarez, A. S., Martínez-Castro, D., Flores, J. L., and Silva, Y. (2018). Sensitivity study on the influence of parameterization schemes in WRF_ARW model on short-and medium-range precipitation forecasts in the Central Andes of Peru. Adv. Meteorology 2018, 1–16. doi:10.1155/2018/1381092
Oglesby, R., Rowe, C., Grunwaldt, A., Ferreira, I., Ruiz, F., Campbell, J., et al. (2016). A high-resolution modeling strategy to assess impacts of climate change for Mesoamerica and the Caribbean. Am. J. Clim. Change 5 (2), 202–228. doi:10.4236/ajcc.2016.52019
Pal, S., Chang, H. I., Castro, C. L., and Dominguez, F. (2019). Credibility of convection-permitting modeling to improve seasonal precipitation forecasting in the southwestern United States. Front. Earth Sci. 7, 11. doi:10.3389/feart.2019.00011
Pergaud, J., Masson, V., Malardel, S., and Couvreux, F. (2009). A parameterization of dry thermals and shallow cumuli for mesoscale numerical weather prediction. Bound.-Layer Meteorol. 132, 83–106.
Posada-Marín, J. A., Rendón, A. M., Salazar, J. F., Mejía, J. F., and Villegas, J. C. (2019). WRF downscaling improves ERA-Interim representation of precipitation around a tropical Andean valley during El Niño: implications for GCM-scale simulation of precipitation over complex terrain. Clim. Dyn. 52 (5), 3609–3629. doi:10.1007/s00382-018-4403-0
Poveda, G., Espinoza, J. C., Zuluaga, M. D., Solman, S. A., Garreaud, R., and van Oevelen, P. J. (2020). High impact weather events in the Andes. Front. Earth Sci. 8, 162. doi:10.3389/feart.2020.00162
Prein, A. F., Ge, M., Valle, A. R., Wang, D., and Giangrande, S. E. (2022). Towards a unified setup to simulate mid-latitude and tropical mesoscale convective systems at kilometer-scales. Earth Space Sci. 9 (8), e2022EA002295. doi:10.1029/2022ea002295
Prein, A. F., Langhans, W., Fosser, G., Ferrone, A., Ban, N., Goergen, K., et al. (2015). A review on regional convection-permitting climate modeling: demonstrations, prospects, and challenges. Rev. Geophys. 53 (2), 323–361. doi:10.1002/2014rg000475
Prein, A. F., Rasmussen, R. M., Wang, D., and Giangrande, S. E. (2021). Sensitivity of organized convective storms to model grid spacing in current and future climates. Philosophical Trans. R. Soc. A 379 (2195), 20190546. doi:10.1098/rsta.2019.0546
Risanto, C. B., Castro, C. L., Moker, J. M., Arellano, A. F., Adams, D. K., Fierro, L. M., et al. (2019). Evaluating forecast skills of moisture from convective-permitting WRF-ARW model during 2017 North American monsoon season. Atmosphere 10 (11), 694. doi:10.3390/atmos10110694
Rivera, E. R., Amador, J. A., and Sáenz, F. (2022). Sensitivity of precipitation and atmospheric low-level circulation patterns to domain size and choice of parameterization schemes in RegCM4. 4 over Central America. Clim. Res. 89, 61–83. doi:10.3354/cr01707
Romatschke, U., and Houze, R. A. (2010). Extreme summer convection in South America. J. Clim. 23 (14), 3761–3791. doi:10.1175/2010jcli3465.1
Ruiz, S. A. G., Barriga, J. E. C., and Martínez, J. A. (2022). Assessment and validation of wind power potential at convection-permitting resolution for the Caribbean region of Colombia. Energy 244, 123127. doi:10.1016/j.energy.2022.123127
Salio, P., Nicolini, M., and Zipser, E. J. (2007). Mesoscale convective systems over southeastern South America and their relationship with the South American low-level jet. Mon. Weather Rev. 135 (4), 1290–1309. doi:10.1175/mwr3305.1
Santos, D. C., and Nascimento, E. D. L. (2016). Numerical simulations of the South American low level jet in two episodes of MCSs: sensitivity to PBL and convective parameterization schemes. Adv. Meteorology 2016, 1–18. doi:10.1155/2016/2812978
Seigel, R. B., and van den Heever, S. C. (2012). Simulated density currents beneath embedded stratified layers. J. Atmos. Sci. 69 (7), 2192–2200. doi:10.1175/jas-d-11-0255.1
Seneviratne, S. I., Zhang, X., Adnan, M., Badi, W., Dereczynski, C., Di Luca, A., et al. (2021). “Weather and climate extreme events in a changing climate,” in Climate change 2021: the physical science basis. Contribution of working group I to the sixth assessment report of the intergovernmental panel on climate change. Editors V. Masson-Delmotte, P. Zhai, A. Pirani, S. L. Connors, C. Péan, S. Bergeret al. (Cambridge, United Kingdom and New York, NY, USA: Cambridge University Press), 1513–1766. doi:10.1017/9781009157896.013
Skamarock, W. C., and Klemp, J. B. (2008). A time-split nonhydrostatic atmospheric model for weather research and forecasting applications. J. Comput. Phys. 227 (7), 3465–3485. doi:10.1016/j.jcp.2007.01.037
Skamarock, W. C., Klemp, J. B., Dudhia, J., Gill, D. O., Liu, Z., Berner, J., et al. (2019). A description of the advanced research WRF model version 4 (No. NCAR/TN-556+STR). technical report. doi:10.5065/1dfh-6p97
Smith, E. N., Gibbs, J. A., Fedorovich, E., and Klein, P. M. (2018). WRF Model study of the Great Plains low-level jet: effects of grid spacing and boundary layer parameterization. J. Appl. Meteorology Climatol. 57 (10), 2375–2397. doi:10.1175/jamc-d-17-0361.1
Smith, R. K., Coughlan, M. J., and Lopez, J. L. (1986). Southerly nocturnal wind surges and bores in northeastern Australia. Mon. weather Rev. 114 (8), 1501–1518. doi:10.1175/1520-0493(1986)114<1501:snwsab>2.0.co;2
Soler, M. R., Udina, M., and Ferreres, E. (2014). Observational and numerical simulation study of a sequence of eight atmospheric density currents in northern Spain. Boundary-layer Meteorol. 153, 195–216. doi:10.1007/s10546-014-9942-2
Stensrud, D. J. (1996). Importance of low-level jets to climate: a review. J. Clim. 9 (8), 1698–1711. doi:10.1175/1520-0442(1996)009<1698:iolljt>2.0.co;2
Stull, R. B. (1988). An introduction to boundary layer meteorology. Springer Science & Business Media.
Sukoriansky, S., Galperin, B., and Perov, V. (2006). A quasi-normal scale elimination model of turbulence and its application to stably stratified flows. Nonlinear Proc. Geoph. 13 (1), 9–22.
Torrealba, E. R., and Amador, J. A. (2010). La corriente en chorro de bajo nivel sobre los Llanos Venezolanos de Sur América. Rev. Climatol. 10, 1–10. Avaliable at: https://climatol.eu/reclim/reclim10a.pdf.
Trachte, K., and Bendix, J. (2012). Katabatic flows and their relation to the formation of convective clouds—idealized case studies. J. Appl. meteorology Climatol. 51 (8), 1531–1546. doi:10.1175/jamc-d-11-0184.1
Trachte, K., Rollenbeck, R., and Bendix, J. (2010). Nocturnal convective cloud formation under clear-sky conditions at the eastern Andes of south Ecuador. J. Geophys. Res. Atmos. 115 (D24). doi:10.1029/2010jd014146
Urrego-Ortiz, J., Martínez, J. A., Arias, P. A., and Jaramillo-Duque, Á. (2019). Assessment and day-ahead forecasting of hourly solar radiation in Medellín, Colombia. Energies 12 (22), 4402. doi:10.3390/en12224402
Vallejo-Bernal, S. M., Urrea, V., Bedoya-Soto, J. M., Posada, D., Olarte, A., Cárdenas-Posso, Y., et al. (2021). Ground validation of TRMM 3B43 V7 precipitation estimates over Colombia. Part I: monthly and seasonal timescales. Int. J. Climatol. 41 (1), 601–624. doi:10.1002/joc.6640
Velasco, I., and Fritsch, J. M. (1987). Mesoscale convective complexes in the Americas. J. Geophys. Res. Atmos. 92 (D8), 9591–9613. doi:10.1029/jd092id08p09591
Vernekar, A., Kirtman, B., and Fennessy, M. (2003). Low-level jets and their effects on the south American Summer climate as simulated by the NCEP Eta model. J. Clim. 16 (2), 297–311. doi:10.1175/1520-0442(2003)016<0297:LLJATE>2.0.CO;2
Wang, D., Giangrande, S. E., Feng, Z., Hardin, J. C., and Prein, A. F. (2020). Updraft and downdraft core size and intensity as revealed by radar wind profilers: MCS observations and idealized model comparisons. J. Geophys. Res. Atmos. 125 (11), e2019JD031774. doi:10.1029/2019jd031774
WRF (2023). User's guide. Avaliable at: https://github.com/wrf-model/Users_Guide (Accessed February 6, 2023).
Yepes, J., Mejía, J. F., Mapes, B., and Poveda, G. (2020). Gravity waves and other mechanisms modulating the diurnal precipitation over one of the rainiest spots on Earth: observations and Simulations in 2016. Mon. Weather Rev. 148 (9), 3933–3950. doi:10.1175/mwr-d-19-0405.1
Zhang, C., and Wang, Y. (2017). Projected future changes of tropical cyclone activity over the western North and South Pacific in a 20-km-mesh regional climate model. J. Clim. 30 (15), 5923–5941. doi:10.1175/jcli-d-16-0597.1
Zipser, E. J., Cecil, D. J., Liu, C., Nesbitt, S. W., and Yorty, D. P. (2006). Where are the most intense thunderstorms on Earth? Bull. Am. Meteorological Soc. 87 (8), 1057–1072. doi:10.1175/bams-87-8-1057
Keywords: mesoscale meteorology, low-level jet, planetary boundary layer, complex terrain, mesoscale convective system, extreme precipitation, convection permitting simulation
Citation: Martinez JA, Arias PA, Dominguez F and Prein A (2024) Mesoscale structures in the Orinoco basin during an extreme precipitation event in the tropical Andes. Front. Earth Sci. 11:1307549. doi: 10.3389/feart.2023.1307549
Received: 04 October 2023; Accepted: 12 December 2023;
Published: 04 January 2024.
Edited by:
Alexandre M. Ramos, Karlsruhe Institute of Technology (KIT), GermanyReviewed by:
Gilberto Fisch, Universidade de Taubaté, BrazilCopyright © 2024 Martinez, Arias, Dominguez and Prein. This is an open-access article distributed under the terms of the Creative Commons Attribution License (CC BY). The use, distribution or reproduction in other forums is permitted, provided the original author(s) and the copyright owner(s) are credited and that the original publication in this journal is cited, in accordance with accepted academic practice. No use, distribution or reproduction is permitted which does not comply with these terms.
*Correspondence: J. Alejandro Martinez, am9obi5tYXJ0aW5lekB1ZGVhLmVkdS5jbw==
Disclaimer: All claims expressed in this article are solely those of the authors and do not necessarily represent those of their affiliated organizations, or those of the publisher, the editors and the reviewers. Any product that may be evaluated in this article or claim that may be made by its manufacturer is not guaranteed or endorsed by the publisher.
Research integrity at Frontiers
Learn more about the work of our research integrity team to safeguard the quality of each article we publish.